

Abstract
The growth hormone and insulin-like growth factor (IGF) system is integral to human growth. Genome-wide association studies (GWAS) have identified variants associated with height and located near the genes in this pathway. However, mechanisms underlying these genetic associations are not understood. To investigate the regulation of the genes in this pathway and mechanisms by which regulation could affect growth, we performed GWAS of measured serum protein levels of IGF-I, IGF binding protein-3 (IGFBP-3), pregnancy-associated plasma protein A (PAPP-A2), IGF-II and IGFBP-5 in 838 children (3–18 years) from the Cincinnati Genomic Control Cohort. We identified variants associated with protein levels near IGFBP3 and IGFBP5 genes, which contain multiple signals of association with height and other skeletal growth phenotypes. Surprisingly, variants that associate with protein levels at these two loci do not colocalize with height associations, confirmed through conditional analysis. Rather, the IGFBP3 signal (associated with total IGFBP-3 and IGF-II levels) colocalizes with an association with sitting height ratio (SHR); the IGFBP5 signal (associated with IGFBP-5 levels) colocalizes with birth weight. Indeed, height-associated single nucleotide polymorphisms near genes encoding other proteins in this pathway are not associated with serum levels, possibly excluding PAPP-A2. Mendelian randomization supports a stronger causal relationship of measured serum levels with SHR (for IGFBP-3) and birth weight (for IGFBP-5) than with height. In conclusion, we begin to characterize the genetic regulation of serum levels of IGF-related proteins in childhood. Furthermore, our data strongly suggest the existence of growth-regulating mechanisms acting through IGF-related genes in ways that are not reflected in measured serum levels of the corresponding proteins.
Introduction
The insulin-like growth factor (IGF) system is known to play a role in growth (1) and disruption of the genes encoding growth hormone (GH1), insulin-like growth factor-1 (IGF1) or insulin-like growth factor-2 (IGF2) leads to a variety of growth disorders (2–4). In mice, knockout of Igf1, Igf2, or the gene encoding the IGF-I receptor (Igf1r) reduces birth weight and body size: birth weight is reduced to 40 and 60% for Igf1 and Igf2 knockouts, respectively (5–9). Furthermore, overexpression of Igf2 results in overgrowth (8, 9). In humans, total IGF-I and total IGFBP-3 are used as clinical biomarkers in the assessment of children with short stature for potential growth hormone deficiency. IGF1 mutations lead to severe intrauterine growth restriction, postnatal growth failure and developmental delay (10), while IGF2 mutations have been shown to be associated with Silver-Russell Syndrome (11). For IGF signaling to occur, it has been shown that IGFs must be released from IGF binding proteins (IGFBPs), which, among other functions, sequester IGFs and prolong their half life (3, 12, 13). Some IGFBPs are also necessary for localization and transport of IGFs. Specifically, IGFBP-3 controls IGF-II concentration (14), binding between 90 and 96% of free IGF-I and IGF-II (15), and IGFBP-3 and IGF-II serum levels have been shown to be tightly correlated (r = 0.56) in adults (16). Measurement of intact IGFBPs is complicated due to their cleavage by the proteases, pregnancy-associated plasma protein A (PAPP-A) and A2 (PAPP-A2). IGFBP cleavage allows IGF release, binding to their cell surface receptor, IGF-1R and downstream signaling. Multiple proteins in the IGF signaling pathway have been implicated by genome-wide association studies (GWAS) of both height and skeletal growth phenotypes (17–19); specifically, Wood et al. reported that height GWAS identifies loci at or near IGF1, IGF2, IGFBP3, IGFBP5, PAPPA and PAPPA2. GWAS of sitting height ratio (SHR), a measure of skeletal proportion, also implicate the IGFBP3 locus. However, the mechanism by which the variants in these genes influence skeletal growth is still unknown. Further genetic study can offer insight into the interactions and shared underlying mechanisms of the GH system and human growth. Furthermore, genetic associations can enable causal inference and provide evidence regarding whether circulating levels of these proteins causally influence height and other skeletal growth phenotypes.
Previous work (20) described the distributions of serum concentrations for many of these proteins through childhood in a large cross-sectional cohort. In this report, we describe the distributions of IGF-II and IGFBP-5 levels and perform a GWAS of multiple circulating protein levels in participants from this same cohort to identify genetic variants that influence circulating protein levels during childhood (protein quantitative trait loci, pQTLs). We also explore the relationship between pQTLs for different growth-related proteins and skeletal growth phenotypes (including height and SHR), and identify surprising and distinct relationships between the genetic variants near genes encoding the growth-related proteins, the circulating protein levels and the skeletal growth phenotypes.
Results
IGF-II and IGFBP-5 levels throughout childhood
Our group has previously reported distributions of total and free IGF-I, PAPP-A2, total and intact IGFBP-3 throughout childhood as well as the correlation between these proteins (20). Herein, we present additional data describing IGF-II and IGFBP-5 levels in the same cohort. Serum IGF-II levels increased in childhood with a subsequent flattening of the curves (Fig. 1A and B, Supplementary Material, Table S3). Serum IGFBP-5 in females increased until approximately 13-years old and then flattened. Interestingly, serum IGFBP-5 levels in males remained flat until the age of 10–11 years and then progressively increased (Fig. 1C and D, Supplementary Material, Table S4).
Figure 1.
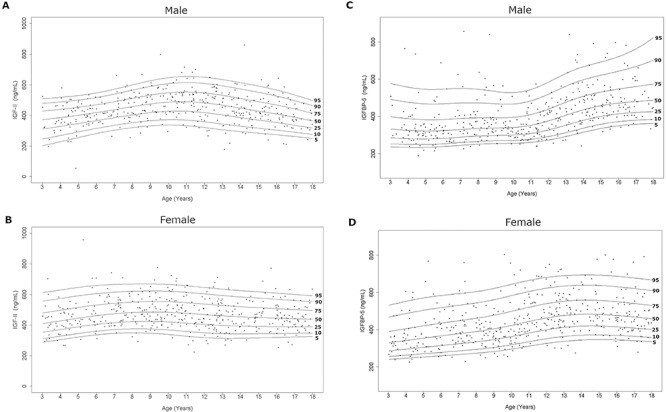
Serum IGF-II and IGFBP-5 curves in the study population. Age distribution of serum IGF-II and IGFBP-5 levels in males (A, C) and females (B, D) are represented respectively. The curves of the 5th, 10th, 25th, 50th, 75th, 90th and 95th percentiles calculated by the BCT method are displayed.
Correlation analyses are presented in Table 1. IGF-II levels had a strong positive correlation with total IGFBP-3 in both sexes (M, F; r = 0.53, 0.51; P < 0.0001). However, IGF-II levels were weakly positively correlated with intact IGFBP-3 (r = 0.17, P = 0.0006) in males only. There were no significant correlations between IGF-II and height or BMI throughout childhood. There was no significant correlation between serum IGF-II and IGFBP-5 levels in either sex (Male, Female: r = −0.10 (P = 0.05), r = 0.07 (P = 0.13), respectively).
Table 1.
Correlation analyses between IGF-II, IGFBP-5 and other variables and regression with height and BMI
| Variable | IGFBP-5 | Free IGF-Ia | Total IGF-Ia | Intact IGFBP-3 | Total IGFBP-3 | PAPP-A2a | Free/total IGF-Ia | Height z-score | BMI z-score | |
|---|---|---|---|---|---|---|---|---|---|---|
| Males | ||||||||||
| IGF-II (N = 405) | r P value | −0.10 (0.05) | −0.15 (0.003) | 0.07 (0.17) | 0.17 (0.0006) | 0.53 (<0.0001) | 0.02 (0.65) | −0.19 (0.0002) | −0.015 (0.77) | −0.007 (0.89) |
| IGFBP-5 (N = 405) | r P value | 0.39 (<0.0001) | 0.44 (<0.0001) | 0.32 (<0.0001) | 0.008 (0.87) | −0.14 (0.004) | −0.009 (0.86) | 0.12 (0.02) | −0.02 (0.71) | |
| Females | ||||||||||
| IGF-II (N = 431) | r P value | 0.07 (0.13) | 0.06 (0.22) | −0.05 (0.27) | 0.04 (0.57) | 0.51 (<0.0001) | 0.12 (0.02) | 0.10 (0.03) | −0.028 (0.56) | −0.045 (0.35) |
| IGFBP-5 (N = 431) | r P value | 0.41 (<0.0001) | 0.51 (<0.0001) | 0.32 (<0.0001) | 0.18 (0.0001) | −0.10 (0.04) | −0.04 (0.37) | 0.04 (0.37) | −0.029 (0.55) |
aThe natural log-transformation was used for statistical analysis of free and total IGF-I, PAPP-A2 and free/total IGF-I ratio.
Note: Bivariate Pearson correlation analyses were performed. The r means the Pearson correlation coefficient. A P-value less than 0.05 was considered statistically significant.
IGFBP-5 levels had a positive correlation with free and total IGF-I in both sexes (M, F; free IGF-I, r = 0.39, 0.41; total IGF-I, r = 0.44, 0.51; all P < 0.0001). IGFBP-5 levels were significantly correlated with intact IGFBP-3 (r = 0.32; P < 0.0001) in both sexes. There were no significant correlations between IGFBP-5 and height or BMI throughout childhood.
Genetic analyses
Genome-wide association studies for protein levels
GWAS was performed for each of the seven phenotypes (Free IGF-I, Total IGF-I, IGF-II, IGFBP-5, Total IGFBP-3, Intact IGFBP-3 and PAPP-A2) as well as two derived ratio phenotypes (Free/Total IGF-I, Intact IGFBP-3/Total IGFBP-3) and two conditional phenotypes (IGF-II conditioned on Intact IGFBP-3, IGF-II conditioned on Total IGFBP-3). This was done for two populations (African American and European American) for each sex strata (sex-combined, male, female), while adjusting for covariates described in Materials and Methods section. Directly genotyped or imputed single nucleotide polymorphisms (SNPs) were analyzed in the GWAS. Fixed-effects meta analysis was performed using METAL to combine GWAS results across the two populations, and likely independent SNPs were selected as having the best association at each 1 Mb genomic locus (‘lead SNPs’). In total, we identified 17 independent lead SNPs with association P values below a commonly used genome-wide significance threshold of 5 × 10⁻⁸ (Supplementary Material, Table S1). Strongest associations were identified at the rs2854746 SNP within the IGFBP3 locus, associated with both IGF-II and Total IGFBP-3 levels, and the rs11575194 SNP within the IGFBP5 locus, associated with IGFBP-5 levels. The rs2854746 variant is a previously known expression QTL (eQTL) and protein QTL (pQTL) (21, 22) [also reported in (23–27)], associated with levels of IGFBP3 expression and IGFBP-3 in serum but has not to our knowledge been previously associated with IGF-II levels. By conditioning on IGFBP-3 levels, we show the novel rs2854746 association with IGF-II is independent of intact IGFBP-3 and is attenuated but remains significant when conditioning on total IGFBP-3 (Supplementary Material, Fig. S2). The rs11575194 variant is a known pQTL for OSBPL-11 (28, 29) but has not to our knowledge been reported to be associated with IGFBP-5 levels. 17 additional associations reached the genome-wide significance threshold, across a range of phenotypes as described in Supplementary Material, Table S1.
Overlap with findings from GWAS of skeletal growth phenotypes
GWAS was performed for standing height (referred to simply as ‘height’), SHR (sitting height to standing height ratio) and birth weight using data from the UKBiobank (see Materials and Methods). The rs2854746 SNP, which is associated with total IGFBP-3 and IGF-II levels, lies near the IGFBP3 gene and is also significantly associated with both height (P = 5.0 × 10⁻¹²) and SHR (P = 3.8 × 10−69), but not with birth weight. However, although rs2854746 was also the strongest associated SNP for SHR in the region, it was only weakly correlated (R2 = 0.0045, 0.0001 respectively) with the two lead height SNPs in the region (rs11455214, P = 1.7 × 10⁻²⁵, rs723149, P = 3.2 × 10−50), consistent with earlier suggestions that these might reflect different signals at the same locus (19). The rs11575194 SNP, which is associated with IGFBP-5 levels, lies near the IGFBP5 gene, and is associated with birth weight (P = 3.4 × 10⁻⁹) but not with height or SHR, despite the fact that other SNPs near IGFBP5 are strongly associated with height (lead SNP is rs2241192, P = 1.3 × 10⁻¹⁴, R2 = 0.0004, rs1478575, P = 8.9 × 10−58, R2 = 0 in 1000 Genomes).
To look for other phenotypes that could be influenced by the levels of IGF-related proteins, we also performed an association study across many other phenotypes (pheWAS) using the T2Dportal (30, 31), the UKB pheWEB (http://pheweb.sph.umich.edu/) (Supplementary Material, Fig. S3) and the GWAS catalog (32) for the lead SNPs affecting total IGFBP-3 and IGFBP-5 levels. Although IGF-related proteins have been suggested as risk factors for cancer, neither lead SNP has been identified in the GWAS catalog as being strongly associated with colorectal, breast or prostate cancers. The only associations surviving multiple testing correction (besides skeletal growth phenotypes) were between rs2854746 in IGFBP3 and multiple measures of bioelectrical impedance (legs, whole body and arms), as well as diastolic and systolic blood pressures.
Conditional analyses to distinguish association signals at the IGFBP3 and IGFBP5 loci
Although the weak correlations between lead SNPs for height and total IGFBP-3 levels suggest that these associations are distinct, the presence of multiple signals of association at a locus can complicate interpretation of simple correlation measures between lead SNPs. To more formally evaluate whether the associations at the IGFBP3 locus with height and total IGFBP-3 levels actually reflect distinct associations, and hence distinct mechanisms, we performed serial conditional analyses. For each phenotype, we performed association analysis for the SNPs across the locus, conditioning on the lead SNP for that phenotype, and then continued to condition on the strongest remaining SNP associated with that phenotype until no genome-wide significant signal of association remained at the locus (see Materials and Methods). When conditioning in turn on each of two total IGFBP-3 associated independent SNPs in the IGFBP3 locus, we observed minimal change in the strength of the height associations in the region. Similarly, when conditioning in turn on 13 height-associated SNPs, we observe that associations with total IGFBP-3 protein levels remained robust (Fig. 2A, Supplementary Material, Fig. S4A and B). In contrast, when we performed similar analyses comparing associations of total IGFBP-3 levels and SHR, the signals associated with SHR were dramatically attenuated when conditioning on the two total IGFBP-3 associated SNPs, and, comparably, total IGFBP-3 association dramatically attenuated when conditioning on the six SHR associated SNPs (Fig. 2B, Supplementary Material, Fig. S4C and D). Together, these analyses indicate that the associations with height at the IGFBP3 locus are independent of associations with serum total IGFBP-3 protein levels but the effects on SHR and total IGFBP-3 levels likely represent the same signal.
Figure 2.


Conditional analysis. Serial conditional analyses were performed comparing (A) total IGFBP-3 association signal with height associations in the region. After conditioning on 12 nearby (2 MB window) height lead SNPs, SNPs in the region remain associated with total IGFBP-3 levels. (B) Total IGFBP-3 with SHR. After conditioning on six nearby SHR lead SNPs, SNP association with total IGFBP-3 levels is attenuated. (C) IGFBP-5 with height. After conditioning on 18 nearby height lead SNPs, SNPs in the region remain associated with IGFBP-5 levels. (D) IGFBP-5 with birth weight. After conditioning on the one nearby BW lead SNP, SNP association with IGFBP-5 levels is attenuated.
We performed similar serial conditional analyses at the IGFBP5 locus to examine the relationship between the associations with IGFBP-5 levels, height and birth weight. The signal of association with IGFBP-5 is vastly attenuated when conditioning birth weight signals in the region (and vice versa), suggesting that these reflect the same association signal (Fig. 2D and Supplementary Material, Fig. S4F). In contrast, when we serially conditioned on 18 height signals in the region, we observed minimal attenuation of the IGFBP-5 associations, and conditioning on IGFBP-5 associated SNPs did not substantially attenuate the height signals (Fig. 2C, Supplementary Material, Fig. S4E). Thus, similar to our observations at the IGFBP3 locus, these results indicate that associations with height are distinct from the associations with serum levels of IGFBP-5, but the serum levels are associated with a distinct skeletal growth phenotype (in this case, birth weight).
Genetic studies of height have identified signals near other genes encoding IGF-related proteins (17, 18, 33). To further explore the relationship between serum levels of IGF-related proteins and height association signals near the genes encoding these proteins, we focused on the height-associated SNPs in the loci containing the IGF1, IGFBP3, PAPPA2, IGF2 and IGFBP5 genes. We tested nine common genome-wide significant height SNPs for association with protein levels. Results of each SNP association are presented in Supplementary Material, Table S2. The only significant association (after correction for multiple comparisons) was between the rs1044299 SNP at the PAPPA2 locus and serum PAPP-A2 levels (P = 6.85 × 10⁻⁵). Conditioning on one of the height signals near PAPPA2 (rs1040457) vastly attenuated this association with PAPP-A2 serum levels; however, the most significant height lead SNP (rs10913200) is independent of the association with PAPP-A2 levels (Supplementary Material, Fig. S5). Thus, as with IGFBP3 and IGFBP5 the effects on height of variants at the other IGF-related genes are not mediated by serum levels, with the possible exception of one variant near PAPPA2.
Mendelian randomization
To evaluate causal relationships between identified associations at IGFBP3 and IGFBP5 and skeletal growth phenotypes, we performed Mendelian randomization (MR). In this method, a SNP associated with the proposed causal protein level (exposure) is used as an instrumental variable (IV) to test the exposure’s effect on the anthropometric trait (outcome). We first used rs2854746 as an IV for total IGFBP-3 levels (before and after conditioning on other height signals in the region). After conditioning, we show increasing total IGFBP-3 levels by 1 standard deviation (SD) is associated with a 0.061 SD increase in SHR [95% CI: (0.053, 0.069)] and a much smaller 0.010 SD decrease in height [95% CI (−0.018, −0.0023)] (Fig. 3A). Similarly, we use rs11575194 as the IV for IGFBP-5 levels (before and after conditioning on other height signals in the region). After conditioning, we show increasing IGFBP-5 levels by 1 SD is associated with a 0.027 SD decrease in birth weight [95% CI (−0.036, −0.018)] and a smaller 0.010 SD decrease in height [95% CI (−0.017, −0.004)]; the IGFBP-5—birth weight relationship may act through correlated measures such as fetal serum levels. These results suggest that the main detectable causal effects of variation in serum levels of total IGFBP-3 and IGFBP-5 in childhood are on skeletal proportion (SHR) and birth weight, respectively (Fig. 4).
Figure 3.

Mendelian randomization. MR was performed using the Wald method; rs2854746 was used as an instrumental variable (IV) for total IGFBP-3 levels and rs11575194 was used as an IV for IGFBP-5 levels. GWAS of both protein levels and anthropometric traits was performed before (A analyses) and after (B analyses) conditioning on nearby height SNPs as a sensitivity analysis for confounding LD. (A) MR analyses show change in total IGFBP-3 levels correlate to more SD changes in SHR than in height. (B) MR analyses show change in IGFBP-5 levels correlate to more SD changes in birth weight than in height.
Figure 4.

Schematic. (A) The IGFBP3 locus is associated with both height and SHR. The total IGFBP-3 association, with lead SNP rs2854746, colocalizes with the SHR association but not the height association. As such, it is possible total IGFBP-3 serum levels and possibly IGF-II serum levels modulate SHR but not height, and other regulatory mechanisms of IGFBP3 in other tissues or other time points are responsible for IGFBP3’s association with height. Dashed lines mark interactions for which there is most evidence in MR analyses. (B) Similarly, the IGFBP5 locus is associated with both height and birth weight. The IGFBP-5 association, with lead SNP rs11575194, colocalizes with the birth weight association. Therefore, it is possible the IGFBP5 locus affects birth weight through IGFBP-5 serum levels, and interacts with height not through serum levels, but rather in some other tissues or time points.
Discussion
The GH and IGF regulatory system is critical for understanding biology driving human growth, height and related phenotypes. Recent work has explored IGF protein interactions and their regulation of height-relevant biology, across multiple age ranges (20, 34, 35). In this study, we performed GWAS of measured serum levels of IGF-related proteins throughout childhood, and identified 17 associated genetic loci. These included strong effects at the IGFBP3 locus on total IGFBP-3 and IGF-II levels and at the IGFBP5 locus on IGFBP-5 levels. We leveraged genetic variation through MR to assess evidence of causality between measured serum levels with mechanisms driving height and related phenotypes. Here, we provide evidence that serum levels of IGF-II, total IGFBP-3 and IGFBP-5 do not appear to be causal for height but instead have evidence for causality for other skeletal growth phenotypes, notably total IGFBP-3 and/or IGF-II with SHR and IGFBP-5 with birth weight.
Normal levels of GH-IGF axis-related proteins are well described in adults and through childhood. Large population based studies have examined the concentrations of serum total IGF-I and total IGFBP-3 throughout the lifespan (36, 37). Our group has measured serum levels of PAPP-A2 and GH-IGF axis-related proteins (now including IGF-II and IGFBP-5) throughout childhood, and performed correlation analyses of all the analytes to investigate the interplay between the various proteins.
IGF-related proteins are known to play a role in regulation of growth and are canonically understood to affect human height; as such, changes in levels or function would logically be assumed to affect overall growth and therefore adult height. Because genetic factors affect both protein levels and measures of human growth, genetic studies can be used to gain insights into the relationships between serum protein levels and skeletal growth. In the GWAS performed in this study, we confirm prior observations that there are signal(s) of association with height as well as with other skeletal growth phenotypes near the IGFBP3 locus. Surprisingly, the variant associated with serum levels of total IGFBP-3 and IGF-II is far more strongly associated with adult SHR than with adult height; indeed, as suggested by earlier studies (19) our conditional analyses indicate that while SHR and protein levels share a common association at the IGFBP3 locus, the associations with height and total IGFBP-3/IGF-II protein levels are independent of each other. These findings support a surprising conclusion, wherein serum levels of total IGFBP-3, IGF-II or other unmeasured correlated variables causally affect predominantly SHR, rather than height (shown graphically in Figure 4a). It follows that variation in human height is not caused by total IGFBP-3 nor IGF-II levels, as measured in the serum. Further, because there are at least 13 variants clustered near the IGFBP3 gene that are independently associated with height but not with total IGFBP-3 levels, our results suggest that regulation of expression of IGFBP3 somewhere in the body does influence overall height, but that IGFBP3 expression in this as yet undefined place (or time) in the body does not correlate with measured serum levels of total IGFBP-3 in childhood. Future examination of the regulatory elements near the IGFBP3 variants associated with height should provide clues as to the time(s) and place(s), where total IGFBP-3 influences overall growth.
It is also curious that the variant at IGFBP3 that is associated with serum levels affects SHR but not overall height—although many variants affect both SHR and height, some, like this IGFBP3 variant, only have a detectable effect on SHR. Because overall height is composed of sitting height (head + spine) and leg length, the effect on SHR without an effect on overall height means that the variant must have symmetric and opposing effects on head + spine and leg length. We are not aware of an obvious mechanism for such coordinated and opposing effects on skeletal growth, although one could postulate a mechanism that somehow regulates overall height, meaning that an effect on one component of height (for example on leg length) could cause an indirect compensation reflected in the other component of height (for example, head + spine). Alternatively, total IGFBP-3 or IGF-II serum levels (or something correlated with these) could have two independent and opposing effects on head + spine and leg length that just happen to cancel each other out in their effect on total height.
Interestingly, the variant associated with total IGFBP-3 levels is also known to influence expression of IGFBP3 mRNA in multiple tissues (28). However, these tissues (heart—left ventricle, thyroid, muscle—skeletal, lung, brain—cerebellum, artery—aorta, artery—tibial, esophagus—muscularis) (28) do not include the liver, which is presumed to be the main source of circulating IGFBP-3. Furthermore, this variant is associated only with total circulating IGFBP-3 but not with intact IGFBP-3 levels, which are thought to reflect the biologically active form of IGFBP-3. Because this variant influences SHR, these observations collectively raise the possibility that non-intact forms of IGFBP-3 may affect skeletal proportion either directly or indirectly (for example through IGF-II levels or other correlated measures) and that the relevant expression of IGFBP-3 is not mediated through changes in IGFBP3 expression in the liver.
We also observed variation at the IGFBP5 gene locus that is associated with IGFBP-5 levels. Like IGFBP3, the IGFBP5 locus is known to be associated with human height (17, 18). However, as we observed for the IGFBP3 locus, the associations with height and IGFBP-5 protein levels are independent, as shown by conditional analysis; this indicates circulating serum levels of IGFBP-5 are likely not mediating the effect of IGFBP-5 on height. In contrast to variation at the IGFBP3 locus, the variation at IGFBP5 that influences protein levels is not associated with SHR; however, it is associated with birth weight, suggesting that serum IGFBP-5 levels are important for prenatal growth through a mechanism that is distinct from the influence of IGFBP-5 on adult height. This is shown graphically in Figure 4b. As with IGFBP3, the influence of variation in IGFBP5 expression on height must occur at a time and/or place that is not reflected in circulating protein levels in childhood.
We also performed an analysis of the lead height-associated SNPs near the remaining genes encoding IGF-related proteins in our study. None of the lead height SNPs was significantly associated with serum levels of the proteins, with the exception of one variant near PAPPA2. Again, this suggests that serum levels of these proteins during childhood are not necessarily determinative of adult height. These results do not mean that these proteins cannot serve as clinical biomarkers but it does imply the existence of mechanisms for these genetic associations with height that are not reflected in measured serum proteins.
Beyond the signals at IGFBP3 and IGFBP5, 17 additional genome-wide associations were identified with IGF-related protein levels. None had clear colocalization with either the genes encoding these proteins or other skeletal growth phenotypes, but may provide clues as to the regulation of these proteins. To allow further exploration of these results, we will provide access to a genome-wide set of summary association statistics.
This study has a number of limitations. First, the sample size for serum protein associations is small for a GWAS study, although the presence of highly significant associations with large effects on measured serum levels (as has been seen in other studies) shows that we had adequate power to successfully identify these strong associations. Larger sample sizes would also allow for additional analyses, such as estimates of heritabilities and genetic correlations for serum protein levels, as well as identification of variants with more modest effects. Second, we have not replicated these findings in a second independent study, so it is possible the associations we discover are a result of uncorrected confounders. The colocalization of associations with other, relevant phenotypes measured in independent studies supports the validity of these findings; however, replication in an independent study of the protein level associations would be valuable. Third, we provide evidence that some association signals overlap (such as total IGFBP-3 serum levels and SHR), but methods to rigorously evaluate colocalization (38) or genetic correlation (39) are limited in small samples and these analyses are further complicated by the presence of many independent associations in each region. We also did not have parental genotypes, so could not directly analyze parent-of-origin effects, which decreases power at imprinted loci (for example, the IGF2 gene is imprinted).
The GWAS analysis was corrected for population structure in the data using principal components (PC) of genetic ancestry, and our sample was stratified by ancestry before meta-analysis, but there may still be confounding from residual population stratification reflected in the summary statistics. In addition, data from this study were largely derived from European descent individuals (both in the UKB and Cincinnati cohorts), limiting the generalizability to non-European ancestry; it would be beneficial to expand these analyses of serum protein levels to other ancestries.
Because the rs2854746 in IGFBP3 is a missense variant, it is theoretically possible that this variant affects binding of the ELISA probe, and is not actually associated with circulating serum protein levels. However, the amino acid altered by rs2854746 does not overlap the probe binding location, and the association with IGF-II levels is strongly indicative of a true biological effect, rather than a laboratory artifact. As with all GWAS associations, functional follow-up of this and the other loci we identified will be necessary to elucidate the specific mechanism of action of these findings.
In conclusion, this study identifies strong genetic associations with measured serum levels of IGF-related proteins, particularly between IGF-II and total IGFBP-3 serum protein levels and variation at the IGFBP3 locus, and between IGFBP-5 protein levels and variation at the IGFBP5 locus. These associations are distinct from and independent of the associations with adult height that have been observed at these loci. Rather, the IGFBP3 variant rs2854746 is strongly associated with SHR, and the IGFBP5 variant rs11575194 is associated with birth weight. These findings suggest that genetically encoded variation in IGFBP3 and IGFBP5 expression affects height in ways that are as yet unknown but are independent of measured serum levels during childhood (for example, local paracrine effects in the growth plate or developing skeleton, or effects on serum levels in fetal life or infancy). In contrast, effects on skeletal proportion and birth weight may be more directly mediated through measured serum levels of total IGFBP-3 and IGFBP-5, respectively (and/or by correlated phenotypes, such as IGF-II levels). Further functional studies are needed to elucidate the mechanism of effect of variants in these genes on height, skeletal proportion and birth weight, and specifically whether and how their effects are mediated by local or systemic changes in the level or activity of growth factor-related proteins, possibly at specific times in development. Taken together, these findings challenge our understanding of how well-known growth factors affect skeletal growth and proportion in children.
Materials and Methods
Study population and design of the Cincinnati Genomic Control Cohort
Subject selection for this cohort has been previously described (20, 40–42). The study subjects and data were derived from the Cincinnati Genomic Control Cohort (CGCC), which is a community-based cross-sectional cohort comprised of 1020 children representative in terms of race, ethnicity, gender and socioeconomic status of the seven counties in Ohio and Kentucky surrounding Cincinnati. Recruitment and sample collection was completed in 2010. 143 children were excluded from the current study due to insufficient blood samples. 39 were excluded due to severe malnutrition (BMI Z-score < or > 3.0 SD), severe short stature (Height Z-score < −3.0 SD), overgrowth (Height Z-score > 3.0 SD), chronic diseases and pregnancy leaving a total of 838 children for whom blood analyte measurements were available. Of these, 815 individuals passed quality genotype quality filters: 415 (51%) were female and 400 (49%) were male; 691 (85%) were identified as ancestrally European and 124 (15%) were identified as ancestrally African American. The study was reviewed and approved by the institutional review board at Cincinnati Children’s Hospital Medical Center (CCHMC).
Anthropometric data and samples
All participants had their height and weight measured by a single investigator as previously described (20). The datasets of CDC 2000 growth charts were used to calculate age- and sex-adjusted Z-scores (43). Blood samples were taken from the participants to obtain serum and genomic DNA at once. Serum samples were isolated with a standard coagulation and centrifuge protocol and frozen at −80°C within 2 h of collection (20). The serum samples were stored at −80°C for more than 8 years without thawing.
IGF-related protein measurements
Serum concentrations of IGF-II, IGFBP-5, free and total IGF-I, intact and total IGFBP-3, and PAPP-A2 were measured using commercially available enzyme-linked immunosorbent assays (ELISA) kits (AL-121, 122, 149, 120, 109, 131 and 127; Ansh labs, TX, USA) as previously published (20, 44). The limits of detection and limits of quantification, imprecision, linearity and recovery were determined for each assay. The IGF-II assay demonstrates no significant (<0.1%) cross-reactivity with IGFBP-2, -3, -4, -5 and IGF-I to 1000 ng/ml. The IGFBP-5 assay demonstrates no significant (<0.1%) cross-reactivity with IGFBP-2, −3, −4, IGF-I and IGF-II to 1000 ng/ml.
Study-based IGF-II and IGFBP-5 curves generation
Age- and sex- specific IGF-II and IGFBP-5 curves in this study were created using the R package as previously published (20). Curve development was done using the Box-Cox t (BCT) distribution. The models included the median, a coefficient of variation, and a measure of skewness and/or kurtosis. The study based IGF-II and IGFBP-5 curves were constructed with the percentile lines of 5, 10, 25, 50, 75, 90 and 95th for each analyte (Fig. 1). The percentile data for each of these analytes are presented in Supplementary Material, Tables S3 and S4.
GWAS data description
Genotyping and quality control of genotype data
The SNP genotyping was carried out previously at CCHMC using the Omni-5™ platform.
Ancestry was estimated by PC analysis: the genotype data for each participant were projected onto PCs from the 1000Genomes samples (45) to define two groups of participants based on their estimated continental ancestries; participants were placed into groups whose genotype data were broadly consistent either with European ancestry or with admixed African and European ancestry. Participants were removed based on sex missingness or mismatch, genotype call rate (<95%) and haplotype missingness (P > 1 × 10⁻⁸). Variants were filtered using Plink2-1.90b3.32 (46) based on multiple criteria: monomorphic sites, site missingness (>10%), heterozygosity (±4 SD), Hardy-Weinberg equilibrium (P > 1 × 10⁻⁷). Genotype data were aligned to 1000Genomes phase 3 data (45) and imputation was performed using the University of Michigan imputation server (47). After QC and imputation, there remained 47 117 093 SNPs and 691 individuals in the European ancestry analysis and 47 110 173 SNPs and 124 individuals in the African American ancestry analysis. Variants were flagged based on low imputation info score (R2 < 0.3) and minor allele frequency (<0.01). After info and MAF flagging, there remained 9 784 569 unflagged SNPs in the European ancestry analysis and 16 711 434 unflagged SNPs in the African American ancestry analysis.
Phenotyping
Height z-scores and BMI z-scores were generated using the 2000 CDC growth charts. Subjects were excluded for extreme height or BMI z-scores (z > 3.0 or z < −3.0), chronic illness, and pregnancy.
GWAS analysis of Cincinnati and UKB cohorts
GWAS in the Cincinnati cohort was performed on samples stratified by estimated ancestry (European ancestry or African-American ancestry) and by sex (male only, female only, and all). Prior to running the GWAS, derived traits were calculated, and adjusted phenotype values were adjusted for PC1-10, and sex (for the all analysis); for conditional traits (IGF-II conditioned on Intact IGFBP-3 and IGF-II conditioned on Total IGFBP-3), residuals were calculated by conditioning the IGF-II phenotype on respective IGFBP-3 levels. Inverse normal (rank-based) transformation was performed on the residuals after these adjustments. GWAS was performed using linear regression with plink software. Cross-population analyses were fixed-effects meta analyzed using METAL (48). Independent loci were selected by identifying lead SNPs in 1 Mb windows.
GWAS was performed in the UK Biobank for locus comparison for traits height and SHR. Analyses were performed on individuals of European ancestry (N = 455 146) and stratified by sex. Phenotype values were adjusted for age and sex (in the unstratified analysis). Residuals were filtered for extreme outliers (±4 SD) and inverse normal transformation was performed. GWAS was performed using Bolt-lmm v2.3 (49), adjusting for array type and 10 PCs of ancestry.
Serial conditioning for eQTLs
For the IGFBP3 locus, serial conditional analyses were performed to evaluate independence with nearby height associations. For the first analysis, GWAS was performed conditioning on the height lead SNP (within ±2 MB). This was repeated, conditioning on the first height lead SNP and additionally next height lead SNP, and iterated; eventually after 13 steps, GWAS was performed conditioning on 13 height lead SNPs (stopping when no genome-wide significant associations P < 5 × 10⁻⁸ remained). At the same locus, this analysis was repeated conditioning on IGFBP-3 lead SNPs (2 iterations, 2 IGFBP-3 lead SNPs). Similar conditional analyses were repeated for IGFBP-3 and SHR, IGFBP-5 and birth weight, and IGFBP-5 and height. Conditional analyses were also performed for PAPP-A2 and height, with the modification that, when conditioning on PAPP-A2 associated SNPs, SNPs are considered lead SNPs if GWAS P < 1 × 10⁻⁴ (rather than 5 × 10⁻⁸, to investigate weak associations in the region).
Mendelian randomization analyses
We performed MR to evaluate the causal relationship between protein levels and relevant phenotypes. Briefly, in this method, genetic variants (instruments) which are assumed to be randomly assigned at conception, are used to infer causal relationships between protein levels and anthropometric traits. We used a two-sample design, minimizing bias away from the null due to Winner’s Curse (50). Instrument strength (51) was adequate (F statistic > 10: F for rs2854746 on total IGFBP-3 with (133.0) and without (166.9) conditioning on height, rs11575194 on IGFBP-5 with (149.0) and without (156.0) conditioning on height). As we only found a single IV per exposure protein, we were unable to do sensitivity analyses to assess for violations of the exclusion criterion (e.g. pleiotropy bias) that rely on multiple instruments per exposure (e.g. MR-Egger regression) (52). For each pair of traits (IGFBP-3 levels with each of height, SHR, sitting height, and leg length; IGFBP-5 levels with each of height and BW), effect sizes were estimated using the Wald method (53). For pairs including total IGBFP-3 levels, rs2854746 was used as the IV; for trait-pairs involving IGFBP-5 levels, rs11575194 was used. Effect sizes for protein level associations were estimated in GWAS in CCHMC described above and effect sizes for anthropometric phenotypes were estimated in GWAS of UKB as described above. As a sensitivity analysis to assess for violation of the exclusion criteria due to by linkage disequilibrium (LD) (54), each analysis was repeated using GWAS conditioned on all GWS height signals in each locus (13 SNPs for IGFBP3, 18 SNPs for IGFBP5); while this controls for the causal effect of height signals, there is the theoretical possibility of bias if there are other as-yet-undefined loci associated with protein levels or anthropometric traits. MR was performed using the MendelianRandomization 0.3.0 R package (https://cran.r-project.org/web/packages/MendelianRandomization/vignettes/Vignette_MR.pdf).
GWAS power evaluation
We evaluated the power of GWAS analyses using the genetic power calculator (http://zzz.bwh.harvard.edu/cgi-bin/qtlassoc.cgi) (55) shown in Supplementary Material, Figure S6. Power estimates were generated for multiple true causal SNP effect sizes (percent variance explained, PVE) and sample sizes, and effect estimates of lead SNPs associated with total IGFBP-3 levels and IGFBP-5 levels were included.
Statistical analysis for association between the dependent variables
As previously described (20), data were imported into SAS®, version 9.4 (SAS Institute, Cary NC), for data management and analysis except for GWAS analysis. Continuous data were examined for distributional properties and potential outlying values. After outliers removed, three of the dependent variables, free IGF-I, PAPP-A2 and total IGF-I were transformed using the natural logarithm for analysis. General linear models were used to examine changes over age for the dependent variables and differences by sex and the interaction of sex and age. Pearson correlation was used to examine the association between the dependent variables. A P-value of <0.05 was considered statistically significant.
Supplementary Material
Acknowledgements
The authors thank Lisa Martin and Susan Thompson and the entire Cincinnati Genomics Control Cohort team for providing the samples for the study. The authors also thank Melissa Andrew and Leah Tyzinski for their assistance with sample handling. Furthermore, the authors thank Joanne Cole for her help guiding GWAS analyses and Yu-han Hsu, Rebecca Fine and Tiffany Amariuta for many useful discussions.
Conflict of Interest Statement: Joel Hirschhorn is a Board Member for Camp4 Therapeutics. Besides this, no Conflicts of Interest to report.
The authors wish it to be known that, in their opinion, the first 2 authors should be regarded as joint First Authors.
Funding
NIDDK (R01DK075787 to J.N.H.); NHGRI (5T32HG002295 to E.R.B.); NIDDK (K23DK120899 for C.M.A.).
References
- 1. Ranke M.B. and Wit J.M. (2018) Growth hormone-past, present and future. Nat. Rev. Endocrinol., 14, 285–300. [DOI] [PubMed] [Google Scholar]
- 2. Storr H.L., Chatterjee S., Metherell L.A., Foley C., Rosenfeld R.G., Backeljauw P.F., Dauber A., Savage M.O. and Hwa V. (2019) Nonclassical GH insensitivity: characterization of mild abnormalities of GH action. Endocr. Rev., 40, 476–505. [DOI] [PMC free article] [PubMed] [Google Scholar]
- 3. David A., Hwa V., Metherell L.A., Netchine I., Camacho-Hübner C., Clark A.J.L., Rosenfeld R.G. and Savage M.O. (2011) Evidence for a continuum of genetic, phenotypic, and biochemical abnormalities in children with growth hormone insensitivity. Endocr. Rev., 32, 472–497. [DOI] [PubMed] [Google Scholar]
- 4. Savage M.O., Hwa V., David A., Rosenfeld R.G. and Metherell L.A. (2011) Genetic defects in the growth hormone-IGF-I axis causing growth hormone insensitivity and impaired linear growth. Front. Endocrinol. (Lausanne), 2, 95. [DOI] [PMC free article] [PubMed] [Google Scholar]
- 5. Liu J.P., Baker J., Perkins A.S., Robertson E.J. and Efstratiadis A. (1993) Mice carrying null mutations of the genes encoding insulin-like growth factor I (Igf-1) and type 1 IGF receptor (Igf1r). Cell, 75, 59–72. [PubMed] [Google Scholar]
- 6. Powell-Braxton L., Hollingshead P., Warburton C., Dowd M., Pitts-Meek S., Dalton D., Gillett N. and Stewart T.A. (1993) IGF-I is required for normal embryonic growth in mice. Genes Dev., 7, 2609–2617. [DOI] [PubMed] [Google Scholar]
- 7. DeChiara T.M., Efstratiadis A. and Robertsen E.J. (1990) A growth-deficiency phenotype in heterozygous mice carrying an insulin-like growth factor II gene disrupted by targeting. Nature, 345, 78–80. [DOI] [PubMed] [Google Scholar]
- 8. Baker J., Liu J.P., Robertson E.J. and Efstratiadis A. (1993) Role of insulin-like growth factors in embryonic and postnatal growth. Cell, 75, 73–82. [PubMed] [Google Scholar]
- 9. Sferruzzi-Perri A.N., Owens J.A., Pringle K.G. and Roberts C.T. (2011) The neglected role of insulin-like growth factors in the maternal circulation regulating fetal growth. J. Physiol., 589, 7–20. [DOI] [PMC free article] [PubMed] [Google Scholar]
- 10. Woods K.A., Camacho-Hübner C., Savage M.O. and Clark A.J.L. (1996) Intrauterine growth retardation and postnatal growth failure associated with deletion of the insulin-like growth factor I gene. N. Engl. J. Med., 335, 1363–1367. [DOI] [PubMed] [Google Scholar]
- 11. Begemann M., Zirn B., Santen G., Wirthgen E., Soellner L., Büttel H.M., Schweizer R., Van Workum W., Binder G. and Eggermann T. (2019) Paternally inherited IGF2 mutation and growth restriction. N. Engl. J. Med., 373, 349–356. [DOI] [PubMed] [Google Scholar]
- 12. Bach L.A. (2018) 40 years of IGF1: IGF-binding proteins. J. Mol. Endocrinol., 61, T11–T28. [DOI] [PubMed] [Google Scholar]
- 13. Baxter R.C. (2000) Insulin-like growth factor (IGF)-binding proteins: interactions with IGFs and intrinsic bioactivities. Am. J. Physiol. Endocrinol. Metab., 278, E967–E976. [DOI] [PubMed] [Google Scholar]
- 14. Ismayilnajadteymurabadi H. and Konukoglu D. (2018) The relationship between IGF-2, IGFBP-2, and IGFBP-3 levels in patients suffering from pre-diabetes. J. Biol. Regul. Homeost Agents, 32, 63–68. [PubMed] [Google Scholar]
- 15. Jones J. I. and Clemmons D. R. (1995) Insulin-like growth factors and their binding proteins: biological actions. Endocr Rev, 16, 3–34. [DOI] [PubMed] [Google Scholar]
- 16. Probst-Hensch N.M., Yuan J.M., Stanczyk F.Z., Gao Y.T., Ross R.K. and Yu M.C. (2001) IGF-1, igf-2 and IGFBP-3 in prediagnostic serum: association with colorectal cancer in a cohort of Chinese men in Shanghai. Br. J. Cancer, 85, 1695–1699. [DOI] [PMC free article] [PubMed] [Google Scholar]
- 17. Wood A.R., Esko T., Yang J., Vedantam S., Pers T.H., Gustafsson S., Chu A.Y., Estrada K., Luan J., Kutalik Z. et al. (2014) Defining the role of common variation in the genomic and biological architecture of adult human height. Nat. Genet., 46, 1173–1186. [DOI] [PMC free article] [PubMed] [Google Scholar]
- 18. Yengo L., Sidorenko J., Kemper K.E., Zheng Z., Wood A.R., Weedon M.N., Frayling T.M., Hirschhorn J., Yang J., Visscher P.M. et al. (2018) Meta-analysis of genome-wide association studies for height and body mass index in ∼700000 individuals of European ancestry. Hum. Mol. Genet., 27, 3641–3649. [DOI] [PMC free article] [PubMed] [Google Scholar]
- 19. Chan Y., Salem R.M., Hsu Y.H.H., McMahon G., Pers T.H., Vedantam S., Esko T., Guo M.H., Lim E.T., Franke L. et al. (2015) Genome-wide analysis of body proportion classifies height-associated variants by mechanism of action and implicates genes important for skeletal development. Am. J. Hum. Genet., 96, 695–708. [DOI] [PMC free article] [PubMed] [Google Scholar]
- 20. Fujimoto M., Khoury J.C., Khoury P.R., Kalra B., Kumar A., Sluss P., Oxvig C., Hwa V. and Dauber A. (2020) Anthropometric and biochemical correlates of PAPP-A2, free IGF-I, and IGFBP-3 in childhood. Eur. J. Endocrinol., 182, 363–374. [DOI] [PMC free article] [PubMed] [Google Scholar]
- 21. Kaplan R.C., Petersen A.-K., Chen M.-H., Teumer A., Glazer N.L., Dö Ring A., Lam C.S.P., Friedrich N., Newman A., Mü Ller M. et al. (2011) A genome-wide association study identifies novel loci associated with circulating IGF-I and IGFBP-3. Hum. Mol. Genet., 20, 1241–1251. [DOI] [PMC free article] [PubMed] [Google Scholar]
- 22. Machiela M.J. and Chanock S.J. (2015) Genetics and population analysis LDlink: a web-based application for exploring population-specific haplotype structure and linking correlated alleles of possible functional variants. Bioinformatics, 31, 3555–3557. [DOI] [PMC free article] [PubMed] [Google Scholar]
- 23. Deal C., Ma J., Wilkin F., Paquette J., Rozen F., Ge B., Hudson T., Stampfer M. and Pollak M. (2001) Novel promoter polymorphism in insulin-like growth factor-binding Protein-3: correlation with serum levels and interaction with known regulators 1. J. Clin. Endocrinol. Metab., 86, 1274–1280. [DOI] [PubMed] [Google Scholar]
- 24. Canzian F., McKay J.D., Cleveland R.J., Dossus L., Biessy C., Rinaldi S., Landi S., Boillot C., Monnier S., Chajès V. et al. (2006) Polymorphisms of genes coding for insulin-like growth factor I and its major binding proteins, circulating levels of IGF-I and IGFBP-3 and breast cancer risk: results from the EPIC study. Br. J. Cancer, 94, 299–307. [DOI] [PMC free article] [PubMed] [Google Scholar]
- 25. Schumacher F.R., Cheng I., Freedman M.L., Mucci L., Allen N.E., NPollak M., BHayes R., OStram D., EHenderson B., Hunter D.J. et al. (2010) A comprehensive analysis of common IGF1, IGFBP1 and IGFBP3 genetic variation with prospective IGF-I and IGFBP-3 blood levels and prostate cancer risk among Caucasians. Hum. Mol. Genet., 19, 3089–3101. [DOI] [PMC free article] [PubMed] [Google Scholar]
- 26. Evans D.S., Cailotto F., Parimi N., Valdes A.M., Castaño-Betancourt M.C., Liu Y., Kaplan R.C., Bidlingmaier M., Vasan R.S., Teumer A. et al. (2015) Genome-wide association and functional studies identify a role for IGFBP3 in hip osteoarthritis. Ann. Rheum. Dis., 74, 1861–1867. [DOI] [PMC free article] [PubMed] [Google Scholar]
- 27. Teumer A., Qi Q., Nethander M., Aschard H., Bandinelli S., Beekman M., Berndt S.I., Bidlingmaier M., Broer L., Cappola A. et al. (2016) Genomewide meta-analysis identifies loci associated with IGF-I and IGFBP-3 levels with impact on age-related traits. Aging Cell, 15, 811–824. [DOI] [PMC free article] [PubMed] [Google Scholar]
- 28. Aguet F., Brown A.A., Castel S.E., Davis J.R., He Y., Jo B., Mohammadi P., Park Y.S., Parsana P., Segrè A.V. et al. (2017) Genetic effects on gene expression across human tissues. Nature, 550, 204–213. [DOI] [PMC free article] [PubMed] [Google Scholar]
- 29. Sun B.B., Maranville J.C., Peters J.E., Stacey D., Staley J.R., Blackshaw J., Burgess S., Jiang T., Paige E., Surendran P. et al. (2018) Genomic atlas of the human plasma proteome. Nature, 558, 73–79. [DOI] [PMC free article] [PubMed] [Google Scholar]
- 30. Type 2 Diabetes Knowledge Portal. rs2854746. type2diabetesgenetics.org (2020). http://www.type2diabetesgenetics.org/variantInfo/variantInfo/rs2854746.
- 31. Type 2 Diabetes Knowledge Portal. rs11575194. type2diabetesgenetics.org (2020). http://www.type2diabetesgenetics.org/variantInfo/variantInfo/rs11575194.
- 32. Buniello A., Macarthur J.A.L., Cerezo M., Harris L.W., Hayhurst J., Malangone C., McMahon A., Morales J., Mountjoy E., Sollis E. et al. (2019) The NHGRI-EBI GWAS catalog of published genome-wide association studies, targeted arrays and summary statistics 2019. Nucleic Acids Res., 47, D1005–D1012. [DOI] [PMC free article] [PubMed] [Google Scholar]
- 33. Marouli E., Graff M., Medina-Gomez C., Lo K.S., Wood A.R., Kjaer T.R., Fine R.S., Lu Y., Schurmann C., Highland H.M. et al. (2017) Rare and low-frequency coding variants alter human adult height. Nature, 542, 186–190. [DOI] [PMC free article] [PubMed] [Google Scholar]
- 34. Kløverpris S., Gaidamauskas E., Rasmussen L.C.V., Overgaard M.T., Kronborg C., Knudsen U.B., Christiansen M., Kumar A. and Oxvig C. (2013) A robust immunoassay for pregnancy-associated plasma protein-A2 based on analysis of circulating antigen: establishment of normal ranges in pregnancy. Mol. Hum. Reprod., 19, 756–763. [DOI] [PubMed] [Google Scholar]
- 35. Steinbrecher A., Janke J., Poy M.N., Oxvig C. and Pischon T. (2017) Pregnancy-associated plasma protein-A2 and anthropometry, lifestyle, and biochemical factors in a human adult population. Sci. Rep., 7, 10455. [DOI] [PMC free article] [PubMed] [Google Scholar]
- 36. Friedrich N., Wolthers O.D., Arafat A.M., Emeny R.T., Spranger J., Roswall J., Kratzsch J., Grabe H.J., Hübener C., Pfeiffer A.F.H. et al. (2014) Age- and sex-specific reference intervals across life span for insulin-like growth factor binding protein 3 (IGFBP-3) and the IGF-I to IGFBP-3 ratio measured by new automated chemiluminescence assays. J. Clin. Endocrinol. Metab., 99, 1675–1686. [DOI] [PubMed] [Google Scholar]
- 37. Bidlingmaier M., Friedrich N., Emeny R.T., Spranger J., Wolthers O.D., Roswall J., Körner A., Obermayer-Pietsch B., Hübener C., Dahlgren J. et al. (2014) Reference intervals for insulin-like growth factor-1 (IGF-I) from birth to senescence: results from a multicenter study using a new automated chemiluminescence IGF-I immunoassay conforming to recent international recommendations. J. Clin. Endocrinol. Metab., 99, 1712–1721. [DOI] [PubMed] [Google Scholar]
- 38. Giambartolomei C., Vukcevic D., Schadt E.E., Franke L., Hingorani A.D., Wallace C. and Plagnol V. (2014) Bayesian test for Colocalisation between pairs of genetic association studies using summary statistics. PLoS Genet., 10, e1004383. [DOI] [PMC free article] [PubMed] [Google Scholar]
- 39. Bulik-Sullivan B., Loh P.R., Finucane H.K., Ripke S., Yang J., Patterson N., Daly M.J., Price A.L., Neale B.M., Corvin A. et al. (2015) LD score regression distinguishes confounding from polygenicity in genome-wide association studies. Nat. Genet., 47, 291–295. [DOI] [PMC free article] [PubMed] [Google Scholar]
- 40. Baye T.M., Butsch Kovacic M., Biagini Myers J.M., Martin L.J., Lindsey M., Patterson T.L., He H., Ericksen M.B., Gupta J., Tsoras A.M. et al. (2011) Differences in candidate Gene Association between European ancestry and African American asthmatic children. PLoS One, 6, e16522. [DOI] [PMC free article] [PubMed] [Google Scholar]
- 41. Butsch Kovacic M., Biagini Myers J.M., Wang N., Martin L.J., Lindsey M., Ericksen M.B., He H., Patterson T.L., Baye T.M., Torgerson D. et al. (2011) Identification of KIF3A as a novel candidate gene for childhood asthma using RNA expression and population allelic frequencies differences. PLoS One, 6, e23714. [DOI] [PMC free article] [PubMed] [Google Scholar]
- 42. Mersha T.B., Martin L.J., Biagini Myers J.M., Kovacic M.B., He H., Lindsey M., Sivaprasad U., Chen W. and Khurana Hershey G.K. (2015) Genomic architecture of asthma differs by sex. Genomics, 106, 15–22. [DOI] [PMC free article] [PubMed] [Google Scholar]
- 43. Kuczmarski R.J., Ogden C.L., Guo S.S., Grummer-Strawn L.M., Flegal K.M., Mei Z., Wei R., Curtin L.R., Roche A.F. and Johnson C.L. (2002) 2000 CDC growth charts for the United States: methods and development. Vital Heal. Stat., 11, 1–190. [PubMed] [Google Scholar]
- 44. DiPrisco B., Kumar A., Kalra B., Savjani G.V., Michael Z., Farr O., Papathanasiou A.E., Christou H. and Mantzoros C. (2019) Placental proteases PAPP-A and PAPP-A2, the binding proteins they cleave (IGFBP-4 and -5), and IGF-I and IGF-II: levels in umbilical cord blood and associations with birth weight and length. Metabolism, 100, 153959. [DOI] [PubMed] [Google Scholar]
- 45. Auton A., Abecasis G.R., Altshuler D.M., Durbin R.M., Bentley D.R., Chakravarti A., Clark A.G., Donnelly P., Eichler E.E., Flicek P. et al. (2015) A global reference for human genetic variation. A global reference for human genetic variation. Nature, 526, 68–74. [DOI] [PMC free article] [PubMed] [Google Scholar]
- 46. Chang C.C., Chow C.C., Tellier L.C., Vattikuti S., Purcell S.M. and Lee J.J. (2015) Second-generation PLINK: rising to the challenge of larger and richer datasets. Gigascience, 4, 7. [DOI] [PMC free article] [PubMed] [Google Scholar]
- 47. Das S., Forer L., Schönherr S., Sidore C., Locke A.E., Kwong A., Vrieze S.I., Chew E.Y., Levy S., McGue M. et al. (2016) Next-generation genotype imputation service and methods. Nat. Genet., 48, 1284–1287. [DOI] [PMC free article] [PubMed] [Google Scholar]
- 48. Willer C.J., Li Y. and Abecasis G.R. (2010) METAL: fast and efficient meta-analysis of genomewide association scans. Bioinformatics, 26, 2190–2191. [DOI] [PMC free article] [PubMed] [Google Scholar]
- 49. Loh P.R., Kichaev G., Gazal S., Schoech A.P. and Price A.L. (2018) Mixed-model association for biobank-scale datasets. Nat. Genet., 50, 906–908. [DOI] [PMC free article] [PubMed] [Google Scholar]
- 50. Pierce B. L. and Burgess S.. Efficient design for Mendelian randomization studies: Subsample and 2-sample instrumental variable estimators. Am J Epidemiol., 178, 1177–1184. [DOI] [PMC free article] [PubMed] [Google Scholar]
- 51. Staiger D. and Stock J. (1997) Instrumental variables regression with weak instruments. Econometrica, Econometric Society, 65, 557–586. [Google Scholar]
- 52. Burgess S., Bowden J., Fall T., Ingelsson E. and Thompson S.G. (2017) Sensitivity analyses for robust causal inference from mendelian randomization analyses with multiple genetic variants. Epidemiology, 28, 30–42. [DOI] [PMC free article] [PubMed] [Google Scholar]
- 53. Burgess S., Small D.S. and Thompson S.G. (2017) A review of instrumental variable estimators for Mendelian randomization. Stat. Methods Med. Res., 26, 2333–2355. [DOI] [PMC free article] [PubMed] [Google Scholar]
- 54. Vanderweele T.J., Tchetgen Tchetgen E.J., Cornelis M. and Kraft P. (2014) Methodological challenges in Mendelian randomization. Epidemiology, 25, 427–435. [DOI] [PMC free article] [PubMed] [Google Scholar]
- 55. Purcell S., Cherny S.S. and Sham P.C. (2003) Genetic power calculator: design of linkage and association genetic mapping studies of complex traits. Bioinformatics, 19, 149–150. [DOI] [PubMed] [Google Scholar]
Associated Data
This section collects any data citations, data availability statements, or supplementary materials included in this article.