

Abstract
GABAergic interneurons (GINs) are a heterogeneous population of inhibitory neurons that collectively contribute to the maintenance of normal neuronal excitability and network activity. Identification of the genetic regulatory elements and transcription factors that contribute toward GIN function may provide new insight into the pathways underlying proper GIN activity while also indicating potential therapeutic targets for GIN-associated disorders, such as schizophrenia and epilepsy. In this study, we examined the temporal changes in gene expression and chromatin accessibility during GIN development by performing transcriptomic and epigenomic analyses on human induced pluripotent stem cell-derived neurons at 22, 50 and 78 days (D) post-differentiation. We observed 13 221 differentially accessible regions (DARs) of chromatin that associate with temporal changes in gene expression at D78 and D50, relative to D22. We also classified families of transcription factors that are increasingly enriched at DARs during differentiation, indicating regulatory networks that likely drive GIN development. Collectively, these data provide a resource for examining the molecular networks regulating GIN functionality.
Introduction
GABAergic interneurons (GINs) comprise a heterogeneous population of inhibitory neurons that play a critical role in regulating neuronal excitability (1). GINs are characterized based on their unique electrophysiological properties, cellular morphology and expression of specific calcium-binding proteins or neuropeptides (1,2). Collectively, these diverse GINs help shape the complex neural circuity underlying proper network activity and, when disrupted, can cause neurological disorders such as schizophrenia and epilepsy (3–10). Schizophrenia alone affects ~1% of the global population, and patients exhibit a wide spectrum of clinical phenotypes, including depression, psychosis and impaired cognition (10,11). Patients with schizophrenia often share comparable numbers of GINs with healthy controls, yet exhibit reduced expression of genes involved in GABA synthesis (GAD1 and GAD2) or fast-spiking inhibition (PVALB, encoding parvalbumin), thereby suggesting that schizophrenic phenotypes may partially stem from altered functional development of GINs (5,12,13).
Several homeobox (HOX) and basic helix-loop-helix (bHLH) transcription factors (TFs) are known to contribute to neural patterning and early GIN fate specification, including DLX1/DLX2, NKX2.1, ASCL1 and MASH1 (6,14–16). However, much less is known about the networks of TFs and genetic elements that contribute to GIN function. Identification of these regulatory components may provide new insight into the pathways underlying proper GIN activity while also denoting potential therapeutic targets for GIN-associated disorders. Though some progress has been made in describing the chromatin and transcriptomic signatures of GIN subtypes in mice, efforts to relate these findings to humans are confounded by the divergence in GIN complexity and development through primate evolution (16–19). While there are several existing methods to culture human-derived GINs or related brain organoids, these studies have only profiled cells utilizing RNA-seq or, in one case, anti-NKX2.1 ChIP-seq (16,20–23). Altogether, there is a knowledge gap in the epigenomic dynamics that may direct interneuron-specific expression patterns in developing GINs.
In the current study, we differentiated human induced pluripotent stem cells (iPSCs) derived from two healthy male controls (denoted HC1 and HC2) into GINs with 81-85% efficiency. To examine temporal changes in gene expression and chromatin accessibility, cells were collected at three time points for RNA-seq and assay for transposase-accessible chromatin (ATAC)-seq analysis: neural progenitor cells (NPCs) at 22 days post-differentiation (D22) and then GINs at 50 days post-differentiation (D50) and 78 days post-differentiation (D78). By comparing differentially accessible regions (DARs) of chromatin that were shared between the two iPSC lines, we identified 13 221 genomic regions that correlated with temporal changes in gene expression unique to differentiatied GINs. We also classified several TFs that were increasingly enriched at DARs during differentiation, indicating regulatory networks that may underlie GIN function. Collectively, these data represent a comprehensive analysis of transcriptomic and epigenomic changes that occur during GIN development.
Results
Human iPSCs are differentiated to GINs with high efficiency
NKX2.1 is highly expressed in the medial ganglionic eminence (MGE) of the ventral telencephalon where the majority of inhibitory progenitors arise during development (24). By using sonic hedgehog (SHH) and its agonist, purmorphamine, NPCs were patterned to the ventral forebrain fate, and >90% of cells expressed NKX2.1 and the neural progenitor marker, NESTIN, by D22 (Supplementary Material, Fig. S1) (25–27). These D22 NPCs were further differentiated into MAP2+/GABA+ neurons with high (81–85%) efficiency by D78 (Fig. 1). To identify transcriptomic and epigenomic changes associated with the differentiation of GINs from NPCs, we collected iPSC-derived cells for RNA-seq and ATAC-seq analyses at three time points during differentiation: D22, D50 and D78 (Fig. 1A). Cells were first assessed for the emergence of GIN subtypes at 36 days post-differentiation (D36), with ~19 and ~16% staining positive for the calcium-binding proteins calbindin (CB+) and calretinin (CR+), respectively (Fig. 1B–E). In contrast, less than ~4% of cells at D36 stained for the GIN subtype markers somatostatin (SST+), parvalbumin (PV+) and neuropeptide Y (NPY+; Fig. 1B–E). At D50, these cells fired repetitive action potentials and exhibited mature passive membrane properties including resting membrane potential (RMP), membrane capacitance and input resistance (Supplementary Material, Fig. S2A–E). Whole-cell patch-clamp recordings of D50 cells also showed spontaneous synaptic activity, as indicated by spontaneous postsynaptic currents (sPSC; Supplementary Material, Fig. S2F–H). Furthermore, there was a significant increase in the percentage of GABA+ cells between D36 and D78, as indicated by elevated percentages of CB+ (~12–15% increase), CR+ (~8–9% increase), SST+ (~23–29% increase) and PV+ (~13–14% increase) cells, though the proportion of NPY+ cells remained constant across differentiation (Fig. 1B–E). Altogether, 81–85% of cells exhibited GABA immunoreactivity by D78, including 26–31% SST+ and 15–16% PV+ cells, suggesting a robust conversion of iPSCs from both the HC1 and HC2 cell lines into GINs (Fig. 1B–E).
Figure 1.
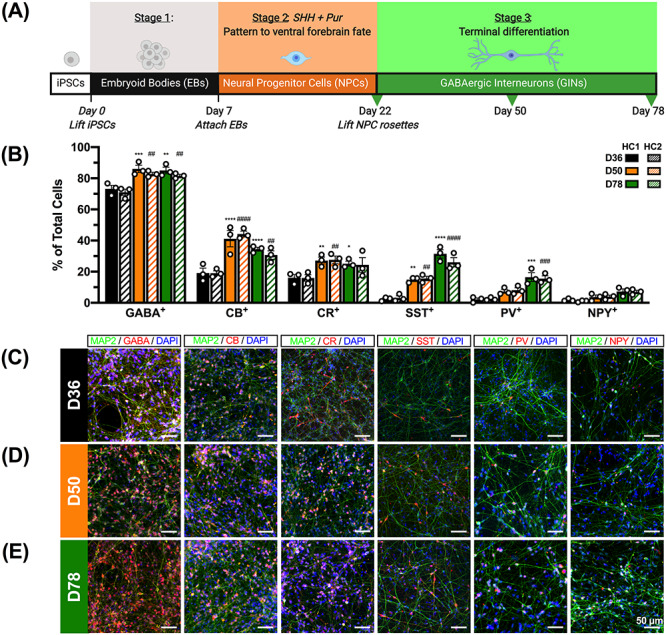
Distinct subtypes of GINs emerge during differentiation. (A) Human iPSC lines derived from two healthy male controls (denoted HC1 and HC2) were patterned to the ventral forebrain fate and subsequently differentiated to GINs. Samples were collected for RNA-seq and ATAC-seq at three time points: 22 days (D22), D50 and D78 post-differentiation. Image created with BioRender. (B) Cells were differentiated into GINs with ~81–85% efficiency, as marked by GABA immunoreactivity (GABA+) and the emergence of GIN subtypes expressing the markers calbindin (CB+), calretinin (CR+), somatostatin (SST+), parvalbumin (PV+) and neuropeptide Y (NPY+). Quantification for each GIN marker was performed on three independently differentiated preparations of cells per time point and iPSC line (n = 3). Asterisks (*) denote statistical comparisons relative to D36 in HC1, while pound signs (#) denote statistical comparisons to D36 in HC2. Mean ± SEM. *P < 0.05, **/##P < 0.01, ***/###P < 0.001, ****/####P < 0.0001. Representative immunostaining images of cells at (C) D36, (D) D50 and (E) D78 (scale bars: 50 μm).
RNA-seq confirms enrichment of genes and pathways associated with GIN function
As a first step to characterize GIN development, we performed RNA-seq on 2–3 biological replicates of HC1-derived cells at D22, D50 and D78. We identified a total of 5776 unique differentially expressed genes (DEGs) across all three time point comparisons, as defined by a >2-fold change (FC) in gene expression and false discovery rate (FDR) < 0.05 (Fig. 2A–C, Supplementary Material, Table S1). The most variation in gene expression (4840 DEGs) was observed between D78 and D22, with comparable numbers of downregulated and upregulated genes (Fig. 2C).
Figure 2.
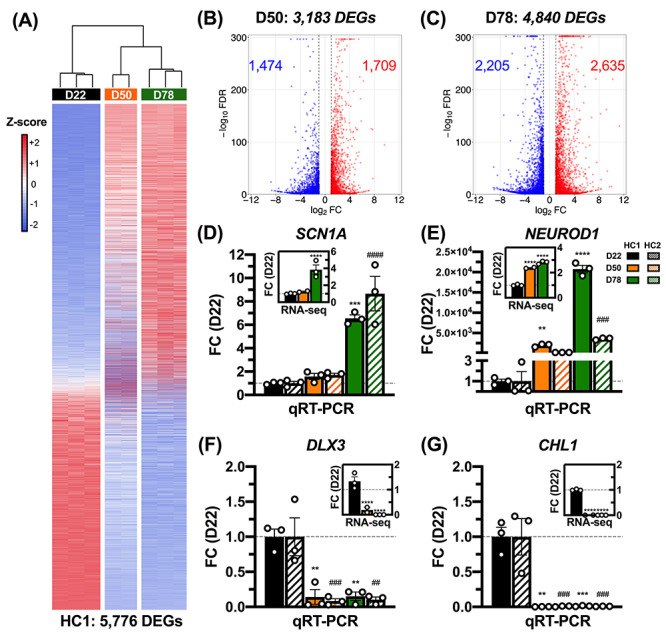
Broad changes in gene expression during GIN differentiation. (A) There were 5776 DEGs during GIN differentiation in HC1-derived cells (n = 2–3 replicates per time point). Cell colors indicate row Z-scores of DESeq2-normalized gene expression values (blue, low; red, high). Summary of upregulated and downregulated DEGs at (B) D50 and (C) D78, relative to D22. (D–G) Upregulated (D,E) and downregulated (F,G) DEGs detected by RNA-seq each exhibit comparable trends in expression between HC1 and HC2 during differentiation. qRT-PCR results are normalized to ACTB, and expression is presented as FC relative to D22 (n = 3). DESeq2-normalized RNA-seq results are presented in the corner of each panel, relative to D22 (n = 2–3). Asterisks (*) denote statistical comparisons to D22 in HC1, while pound signs (#) denote statistical comparisons to D22 in HC2. Mean ± SEM. **/##P < 0.01, ***/###P < 0.001, ****/####P < 0.0001.
To validate the trends in gene expression observed via RNA-seq, we performed quantitative real-time polymerase chain reaction (qRT-PCR) for select DEGs related to GIN function and development (Fig. 2D–G; Supplementary Material, Table S2). For instance, both SCN1A and NEUROD1 were significantly upregulated at D78 relative to D22 (Fig. 2D and E). While SCN1A is crucial for fast-spiking GABAergic inhibition in PV+ GINs, NEUROD1 encodes a bHLH TF that induces neuronal differentiation (7,28–30). Consistent with the RNA-seq data, there was a significant increase in SCN1A expression by D78 and NEUROD1 expression by D50 in the HC1 cell line (Fig. 2D and E). qRT-PCR also affirmed RNA-seq results from DEGs that were significantly downregulated over GIN differentiation, such as DLX3 and CHL1 (Fig. 2F and G). DLX3 is a member of the HOX TF family that has previously been reported to repress neural gene expression, whereas CHL1 encodes a neural adhesion molecule that, in part, negatively regulates NPC proliferation (Fig. 2F and G) (31,32). Accordingly, qRT-PCR results confirmed that both DLX3 and CHL1 expressions were significantly reduced by D50 in HC1 cells (Fig. 2F and G). These trends in expression were consistent in HC2-derived cells, which exhibited a significant increase in SCN1A expression at D78, and a significant decrease in DLX3 and CHL1 expression by D50 (Fig. 2D, F and G). During GIN differentiation, significant induction of NEUROD1 expression was observed earlier in HC1 cells (D50) than HC2 cells (D78; Fig. 2E). This variability between HC1- and HC2-derived cells underscores the importance of utilizing multiple iPSC lines.
As an additional step to examine whether changes in mRNA expression correlate with altered protein levels, we also performed immunoblotting for two DEGs associated with neuronal and GIN identity: MAP2 and DCX (33,34) (Supplementary Material, Fig. S3). Both DCX and MAP2 mRNA levels were significantly upregulated during differentiation, and we observed a significant increase in protein levels between D22 and D78 (Supplementary Material, Fig. S3). As a control, we also performed immunoblotting for the glycolytic enzyme, GAPDH, which is ubiquitously expressed in mammalian cells (Supplementary Material, Fig. S3) (35). While we observed a decrease in GAPDH mRNA levels by D78, it was not considered a DEG because it exhibited < 2-FC in gene expression (log2FC = −0.879; Supplementary Material, Fig. S3A). Furthermore, there was no significant change in GAPDH protein levels during differentiation (Supplementary Material, Fig. S3B and C).
To determine whether these changes in gene expression were associated with neuronal or, more specifically, GABAergic cell types and biological pathways, we performed three enrichment analyses: gene set enrichment analysis (GSEA; to evaluate relevant molecular pathways), spatial gene set enrichment (SGSE; to indicate brain region or tissue association) and cell type-specific enrichment analysis (CSEA; to indicate neuronal subtype specificity) (Fig. 3) (36–38). GSEA of all detected genes was utilized to identify molecular pathways associated with changes in gene expression at D50 and D78 relative to D22 (Fig. 3A and B; Supplementary Material, Table S3) (37). The expression patterns of cells at D50 and D78 were significantly enriched for genes associated with pathways linked to neuronal maturation and, importantly, GABAergic function (Fig. 3A and B). For instance, GABA receptor subunit genes (GABRA3, GABRB2 and GABRG2) and the GABA reuptake transporter gene (SLC6A1) were among the DEGs enriched in the ‘GABAergic synaptic transmission’ gene ontology (GO) term (Fig. 3A and B) (39–41). Similarly, SYT1, SV2A and VAMP2 were all enriched in the ‘vesicle-mediated transport in synapse’ GO term (Fig. 3A and B). SYT1 encodes a calcium-binding protein involved in fast-releasing inhibitory transmitter release, and SV2A and VAMP2 encode proteins involved in vesicular release and docking, respectively, and all three DEGs are noted to have enriched expression and function in developing GINs (42–45). Genes involved in synapse organization were also significantly enriched in cells at D50 and D78, including NGEF, which plays a specialized role in GABAergic inhibition by facilitating neurite outgrowth and the localization of GABAA receptor subunits to inhibitory synapses (Fig. 3A and B) (46). SGSE similarly revealed that the 4840 unique DEGs with altered expression between D78 and D22 were most associated with the MGE, which is the primary source of cortical GINs (Fig. 3C) (21,36,47). These DEGs were also associated with the lateral ganglionic eminence (LGE), ventricular zone and the horizontal portion of the rostral migratory stream, all of which generate cortical or olfactory bulb GINs (Fig. 3C) (48,49). SGSE analysis also noted a strong association between these DEGs and the putamen, which relies on the integration of GINs and cholinergic interneurons for proper function (Fig. 3C) (50). There was minimal association of these DEGs with the subventricular and marginal zones, which are important sources of excitatory cortical neurons and glia, respectively (Fig. 3C) (51–53). CSEA indicated that the 250 DEGs with highest expression at D78 were most associated with layer 6 and prepronociceptin-expressing (PNOC+) cortical neurons, as well as D1+ and D2+ medium spiny neurons of the striatum (Fig. 3D) (38). While layer 6 of the cortex is highly heterogeneous, encompassing both excitatory pyramidal neurons and GINs, PNOC+ neurons are representative of GINs, and D1+ or D2+ medium spiny neurons are the primary GABAergic cells in the striatum (38,54–57). Altogether, these results provide support that the differentiated cells adopt a GABAergic fate by D78.
Figure 3.
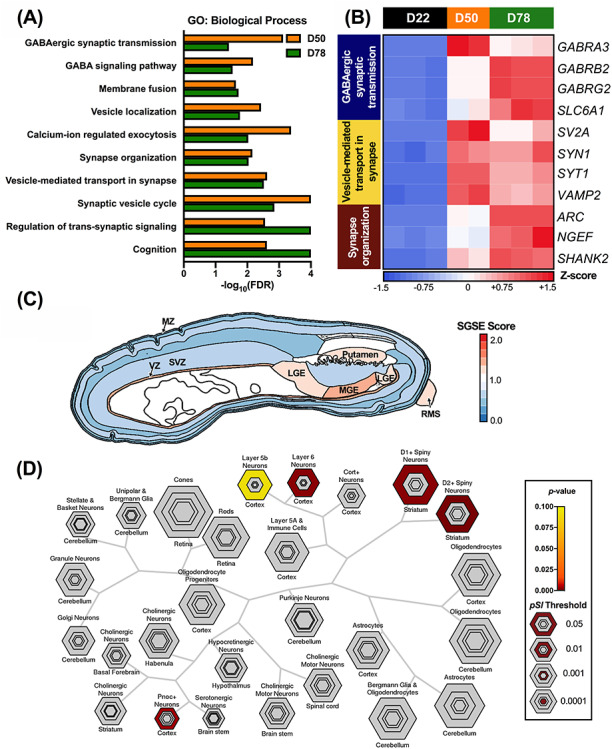
iPSC-derived GINs are enriched for pathways associated with mature neuronal function. (A) The 10 most significant biological process GO terms identified by GSEA indicate enrichment of DEGs involved in GABAergic synapse formation and neuronal function across GIN differentiation. Genes were pre-ranked based on changes in expression relative to D22. (B) Heatmap of representative DEGs in GO categories identified by GSEA analysis (n = 2–3 per time point). Cell colors indicate row Z-scores of DESeq2-normalized gene expression values (blue, low; red, high). (C) The 4840 DEGs at D78 relative to D22 are primarily associated with the MGE in the developing human brain. DEGs are also associated with the LGE, horizontal portion of the rostral migratory stream (RMS), putamen and ventricular zone (VZ), but not the subventricular zone (SVZ) or marginal zone (MZ). Colors indicate the SGSE score for each brain region (blue, low; red, high). Image of the fetal human brain at 15 post-coital weeks was derived from the Allen Brain Atlas using brainImageR (36). (D) The 250 DEGs with highest expression in D78 cells are significantly associated with layer 6 and prepronociceptin-expressing (PNOC+) cortical neurons, as well as striatal D1+ and D2+ medium spiny neurons. Hexagon colors indicate the significance of gene set association (gray, P > 0.10; yellow, not significant; brown, highly significant), while hexagon size indicates different specificity index probability (pSI) thresholds, or the overall specificity of a gene set to a given cell type.
HC1- and HC2-derived GINs exhibit similar changes in chromatin accessibility across differentiation
To generate a comprehensive map of accessible regions of chromatin across GIN differentiation, ATAC-seq was performed on 2–3 replicates of HC1- and HC2-derived cells at D22, D50 and D78 (Fig. 4; Supplementary Material, Fig. S4 and Table S4). Out of the 35 703 ATAC-seq peaks detected across all samples, 16 492 peaks in HC1 cells (46% of all peaks) and 15 583 in HC2 cells (44% of all peaks) demonstrated significant changes in accessibility during GIN differentiation, as defined by >2-FC in accessibility and FDR < 0.05 (Fig. 4A and B). Out of the 13 515 DARs of chromatin present in both the HC1 and HC2 lines, 13 221 were consistently increased or decreased when comparing accessibility between specific differentiation time points (Fig. 4C; Supplementary Material, Table S4). Principal component analysis of these 13 221 DARs indicated that samples at the same time point exhibited the least variation, regardless of cell line (Fig. 4D). Consistent with our RNA-seq results, the greatest amount of variation was observed between D78 and D22 (Fig. 4D). In comparison with D50, nearly twice as many DARs were present at D78 relative to D22, with a majority (71%) increasing in accessibility over GIN differentiation (Fig. 4E and F).
Figure 4.

ATAC-seq reveals widespread changes in chromatin accessibility during GIN differentiation. (A, B) HC1-derived cells exhibited a total of 16 492 DARs of chromatin across differentiation, while HC2-derived cells exhibited 15 583 DARs (n = 2–3 per time point and iPSC line). Cell colors indicate row Z-scores of reads per million (rpm) for each DAR (blue, low; red, high). (C) Out of the 13 515 regions that were differentially accessible in both the HC1 and HC2 lines during differentiation, there were 13 221 DARs with similar changes in accessibility between time point comparisons. (D) Principal component (PC) analysis of ATAC-seq rpm values across the 13 221 shared DARs. The percentage of variance explained by PC1 or PC2 is listed in parentheses. Summary of the 13 221 shared DARs with decreasing or increasing accessibility across differentiation at (E) D50 and (F) D78, relative to D22.
Changes in chromatin accessibility are correlated with GIN-specific gene expression
Epigenomic changes in chromatin structure directly impact gene expression, and increased chromatin accessibility is often linked to elevated transcription (58). We observed a significant, positive correlation between changes in accessibility of DARs proximal to transcription start sites (TSSs) and gene expression at D50 and D78, relative to D22 (Fig. 5A and B). For instance, B3GAT2, which encodes a glucuronyltransferase involved in synapse formation and the maintenance of extracellular perineuronal nets, was confirmed by RNA-seq and qRT-PCR to be significantly upregulated by D78 (Fig. 5C) (59). While there was no significant change in accessibility at the characterized B3GAT2 TSS, there were three proximal DARs (within 3 kb) with increased accessibility during GIN differentiation that may contribute to elevated B3GAT2 expression (Fig. 5C). Consistent with previous reports that cell type-specific gene expression is often driven by elements outside of the TSS, only 6.6% of shared DARs were within 3 kb of a TSS (20,60,61). Therefore, the chromatin remodeling that occurs across differentiation may reveal novel genetic regulatory elements that contribute toward expression of GIN-specific genes. For instance, SLC6A1, which encodes the GAT-1 transporter responsible for reuptake of GABA at mature inhibitory synapses, was significantly upregulated by D50, yet did not demonstrate a significant change in TSS accessibility (Fig. 5D) (41). However, one DAR within SLC6A1 intron 1 (7.5 kb downstream of the TSS) significantly increased in accessibility by D50 and therefore may represent a regulatory enhancer element (Fig. 5D).
Figure 5.

Dynamic association of chromatin accessibility and gene expression across GIN differentiation. (A, B) DARs within 3 kb of the transcription start site (TSS ± 3 kb) were positively correlated with changes in gene expression. log2FC denotes FC in chromatin accessibility (ATAC-seq) or gene expression (RNA-seq) relative to D22. Pearson’s product-moment correlation. (C, D) Examples of DEGs with DARs that may contribute to changes in expression. Genome plots represent averaged ATAC-seq data from HC1 and HC2 cells, where shared DARs with increased accessibility are denoted by red arrows (rpm: reads per million). Peaks of ATAC-seq signal that did not exhibit differential accessibility in both HC1- and HC2-derived cells are denoted as ‘NR’, or not reproduced. Coordinates refer to the hg38 annotation of the human genome (December 2013) (103). Gene expression from qRT-PCR and RNA-seq is presented to the right of each genome plot (n = 2–3 replicates per time point and iPSC line). qRT-PCR results are normalized to ACTB, and expression is presented as FC relative to D22 (n = 3). DESeq2-normalized RNA-seq results from HC1-derived cells are presented in the corner of each panel, relative to D22 (n = 2–3). Asterisks (*) denote statistical comparisons to D22 in HC1, while pound signs (#) denote statistical comparisons to D22 in HC2. Mean ± SEM. */#P < 0.05, **P < 0.01, ***P < 0.001, ****/####P < 0.0001.
Motif enrichment analysis implicates distinct groups of TFs in GIN differentiation
One mechanism by which DARs mediate changes in gene expression is through interactions with TFs (58). We classified DARs into one of two groups, based on whether they increased (denoted +A) or decreased (−A) in accessibility during GIN differentiation. Next, we utilized the MEME Suite Analysis of Motif Enrichment tool to predict the 20 most significant TF binding motifs that were enriched in either +A or −A DARs (Fig. 6, Supplementary Material, Table S5) (62). There was no overlap between the 20 most significant binding motifs enriched in either group, indicating that distinct sets of TFs might interact with +A and −A DARs (Fig. 6). There were also discernable TF footprints at each predicted binding motif, supporting the physical occupation of predicted motifs by their respective TFs (Supplementary Material, Figs S5 and S6). Furthermore, a majority of TFs enriched in +A DARs (HOXA2, IRF3, etc.) exhibited more prominent footprints at D78 than D22 (Supplementary Material, Fig. S5). The reverse was true for TFs enriched in −A DARs, which demonstrated more prominent footprints at D22 than D78 (Supplementary Material, Fig. S6).
Figure 6.
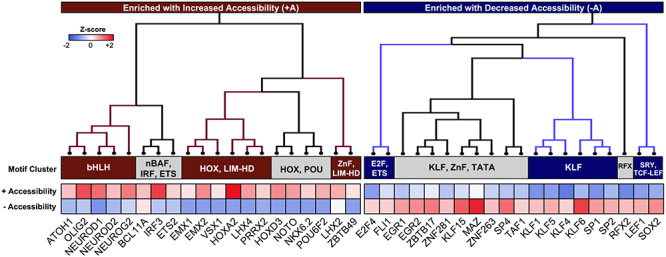
DARs with divergent changes in accessibility are enriched for distinct sets of TFs. Heatmap of the 20 most significant TF binding motifs enriched in DARs with increasing (+A) or decreasing (−A) accessibility across GIN differentiation. TFs enriched in +A or −A DARs are clustered into subfamilies by consensus binding motif similarity, as determined by STAMP alignment software (63). Cell colors indicate column Z-scores of the −log(rank) of the TF motif as determined by the MEME Suite Analysis of Motif Enrichment tool (blue, less enriched; red, highly enriched) (62).
Using the STAMP tool for TF motif comparison, we clustered the TFs enriched in +A or −A DARs into subfamilies based on consensus binding motif similarity (Fig. 6) (63). Notably, +A DARs were enriched for TFs containing a bHLH domain, which have previously been associated with neuronal development, including NEUROD2, which promotes inhibitory synapse formation (Fig. 6) (64–66). Several bHLH TFs previously linked to glutamatergic differentiation were also enriched in +A DARs, including NEUROG2, EMX1 and EMX2 (Fig. 6) (67,68). Other clusters included TFs such as HOXA2, which is involved in dorsoventral patterning and neurogenesis, or NKX6.2, which contributes to CR+ and SST+ GIN cell fate specification (Fig. 6) (69). In contrast, motifs for Krüppel-like family (KLF) members were enriched in −A DARs, including the KLF5 and KLF15 proteins known to maintain pluripotency or repress neurite outgrowth (Fig. 6) (70–72). These diverse TF clusters also included motifs for the SRY-related protein, SOX2, and the zinc finger nuclease (ZnF), ZNF281, which contribute toward the multipotent state of NPCs (Fig. 6) (73,74). Interestingly, one +A DAR cluster included TFs in the nBAF (BCL11A), IRF (IRF3) and ETS (ETS2) protein families, which have defined roles outside of neuronal development (Fig. 6) (75,76). Of the three enriched TFs within this cluster, BCL11A demonstrated the most prominent change in motif occupancy between D78 and D22 (Supplementary Material, Fig. S4). Altogether, these results suggest that +A DARs interact with TFs that promote GIN development, whereas −A DARs represent targets of TFs that suppress neuronal differentiation.
A subset of DEGs may represent risk factors for schizophrenia
Given that DARs often indicate genetic enhancer elements that drive cell type-specific gene expression, genes associated with differential chromatin accessibility during GIN development may be particularly relevant to interneuron function (58,60,61,77). Notably, GIN dysfunction has been strongly linked to the pathogenesis of schizophrenia (SZ), and SZ genetic risk factors such as single-nucleotide polymorphisms (SNPs) have previously been identified via genome-wide association studies (5,78). SNPs within putative regulatory elements may disrupt normal enhancer activity, thereby altering gene expression and contributing toward increased SZ risk (79,80). Therefore, we next examined whether the 13 221 DARs observed during GIN differentiation coincided with any of the 108 SZ-associated genomic loci previously reported by the Schizophrenia Working Group of the Psychiatric Genomics Consortium (78). These SZ-associated genomic loci were defined by the authors as regions that were within linkage disequilibrium (R2 > 0.60) with ‘index’ SNPs that reached genome-wide significance in their association study (78). While none of the 13 221 DARs shared between HC1- and HC2-derived GINs directly coincided with these index SNPs, 111 DARs did localize within 56 of the SZ-associated genomic loci, indicating a significant enrichment (P = 8.2108E-09, two-tailed Fisher’s exact test; Fig. 7A; Supplementary Material, Table S6).
Figure 7.
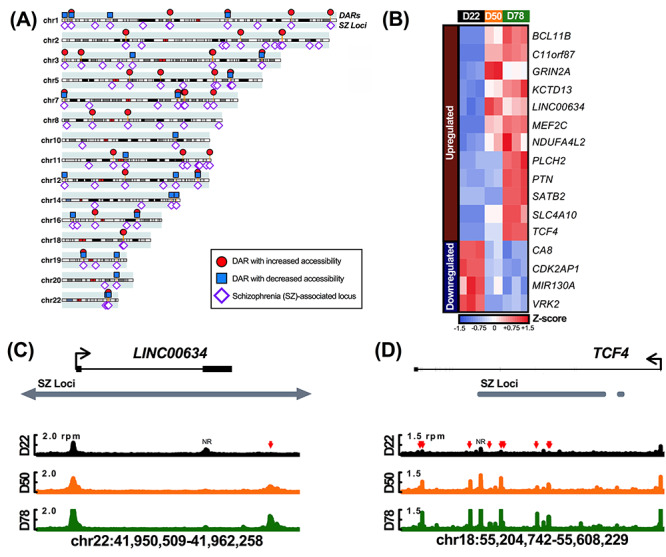
DARs are significantly enriched in SZ-associated genomic loci. (A) 111 DARs coincide with 56/108 schizophrenia-associated genomic loci (‘SZ Loci’) identified by the Schizophrenia Working Group of the Psychiatric Genomics Consortium (78). Red circles and blue squares above each chromosome indicate DARs with increased or decreased accessibility by D78, respectively, while purple diamonds below each chromosome denote SZ-associated genomic loci. (B) 16 DEGs exhibit DARs in SZ-associated genomic loci (n = 2–3 per time point). Cell colors indicate row Z-scores of DESeq2-normalized gene expression values (blue, low; red, high). (C, D) Examples of DEGs with DARs that coincide with SZ-associated genomic loci. Genome plots represent averaged ATAC-seq data from HC1- and HC2-derived cells, where shared DARs are denoted by colored arrows (red, increased accessibility; rpm, reads per million). Peaks of ATAC-seq signal that did not exhibit differential accessibility in both HC1- and HC2-derived cells are denoted as ‘NR’, or not reproduced. Horizontal gray bars denote SZ Loci identified by the Schizophrenia Working Group of the Psychiatric Genomics Consortium (78). The SZ locus in (C) extends ~31 kb upstream and ~3 kb downstream of the depicted genomic region, as noted by arrows. Coordinates refer to the hg38 annotation of the human genome (December 2013) (103).
To further examine a potential link between SZ risk loci and gene expression, we focused on the DEGs that also exhibited DARs within SZ-associated loci. The 111 DARs within SZ-associated genomic loci were associated with 77 genes, 16 of which were differentially expressed during GIN differentiation (Fig. 7B). Several of these DEGs have previously been linked to SZ, including TCF4, MEF2C, GRIN2A and VRK2 (58,60,61,77,81–85). In particular, TCF4 encodes a neurodevelopmental bHLH TF that was identified as a potential driver of altered gene expression in schizophrenia patients (83,85). We observed that TCF4 was significantly upregulated during GIN differentiation and exhibited six intronic DARs that coincide with a SZ-associated genomic locus (Fig. 7B and C) (84,86). While TCF4 represents a gene with multiple DARs, 7 of the 16 DEGs identified from this analysis exhibited a single DAR within a SZ-associated genomic locus. For instance, LINC00634, which encodes a neuronal long non-coding RNA, was significantly upregulated during GIN differentiation and exhibited one downstream DAR in a SZ-associated locus that may represent a novel genetic regulatory element (Fig. 7B and D). Altogether, these genes and their DARs merit further study to assess whether they may contribute toward elevated schizophrenia risk.
Discussion
In this study, we differentiated iPSCs to a heterogeneous population of GINs with 81–85% efficiency, as confirmed by positive immunostaining for GABA and GIN markers such as PV, SST and CR. SGSE, CSEA and GSEA also indicated that these cells adopt a GABAergic fate. While previous studies have examined transcriptomic changes during GIN differentiation, this is the first profile of altered chromatin accessibility in developing human GINs (16,21,47,87). Furthermore, we have combined both RNA-seq and ATAC-seq to explore the temporal dynamics of GIN development, thereby facilitating comparisons between altered chromatin accessibility and gene expression. By utilizing two independent iPSC lines, we were also able to identify accessible regions of chromatin and biological pathways that were consistently altered across different genetic backgrounds, indicating shared programming during GIN differentiation.
The regions of open chromatin detected by ATAC-seq mark potential binding sites for TFs that mediate changes in gene expression. We detected significant enrichment for distinct families of TF motifs in DARs with increased (+A) or decreased (−A) accessibility over GIN differentiation. In +A DARs, these motifs suggest binding of several TFs with previously characterized roles in GIN fate specification, including the bHLH proteins NEUROD1, NEUROD2 and NKX6.2 (30,64,65). +A DARs were also enriched for binding motifs of TFs with roles outside of the nervous system, such as IRF3 (toll-like receptor signaling), HOXD3 (angiogenesis) and BCL11A (hemoglobin switching), thereby suggesting novel roles in GIN development and function (75,76,88). Though BCL11A was originally characterized as a developmental regulator of hemoglobin production in erythroid cells, Wiegreffe et al. reported that Bcl11a is highly expressed in projection neurons and GINs of the developing neocortex, and we observed a significant increase in BCL11A expression across GIN differentiation (75,89). Several missense or truncating loss-of-function mutations in BCL11A have since been identified in patients with intellectual disability, and heterozygous-null Bcl11a mice exhibit deficits in social discrimination (90). A recent study by Chen et al. also identified BCL11A as part of a network of co-expressed genes that is reproducibly downregulated among patients with SZ, altogether suggesting that BCL11A may play an important role in disease phenotypes, perhaps through participating in GIN function and/or development (91).
Interestingly, we observed that several bHLH TF binding motifs associated with glutamatergic differentiation were also enriched in +A DARs: NEUROG2, EMX1 and EMX2 (67,68,77,92). Though our differentiation protocol consistently generated GINs with 81–85% efficiency, a minority of cells may also adopt a glutamatergic fate, as indicated by enrichment of layer 6 cortical neurons in our CSEA results (38,54). Furthermore, the bulk RNA-seq approach that we used did not enable deconvolution to determine the contribution of specific cell types to the observed epigenomic or transcriptomic changes during differentiation. Therefore, the enrichment of consensus binding motifs for TFs associated with glutamatergic neuronal development may reflect the presence of DARs that are unique to a subset of non-GABAergic cells. Alternatively, though NEUROG2 is often linked to glutamatergic differentiation, Pereira et al. observed that coordinated overexpression of Neurog2 and Neurod2 enabled the conversion of mouse striatal glia into PV+ GINs with ~30% efficiency (30,68,92). Similarly, Parras et al. noted that deficits in GIN development and migration in the cortex of Mash1-null mice could be rescued by overexpressing Neurog2 (67). Beyond their role in glutamatergic development, Emx1 and Emx2 are also involved in early corticogenesis from neural precursors (68,93). It is possible, then, that these glutamatergic TFs may also contribute to human GIN development through cortical patterning or other mechanisms.
Given the crucial role of GINs in maintaining cortical network activity, GIN dysfunction is believed to contribute to the cognitive and behavioral deficits observed in SZ patients (5,94). We observed 16 DEGs with DARs that fell within SZ-associated genomic loci reported by the Schizophrenia Working Group of the Psychiatric Genomics Consortium (78). While several of these DEGs have previously been linked to SZ, we report DARs indicative of novel putative genetic cis-regulatory elements (81,82,95,96). For instance, there are several DARs within TCF4 which significantly increased in accessibility by D78 and localized within a SZ-associated genomic locus. Given that TCF4 also exhibited a significant increase in gene expression by D78, these DARs may collectively indicate transcriptional enhancer elements that underlie the observed changes in gene expression. This analysis also identified DARs corresponding to DEGs which have not yet been studied in the context of SZ, such as LINC00634. While LINC00634 is known to encode a neuronal long non-coding RNA, it does not have a characterized function, therefore making it difficult to speculate how it may contribute toward increased SZ risk (97). Furthermore, though LINC00634 exhibited a single DAR that may contribute toward altered gene expression, it is worth noting that 9 of the 16 DEGs identified in this analysis exhibited multiple DARs that could potentially contribute toward altered gene expression, not all of which were located within SZ-associated genomic loci. While it is tempting to speculate that DARs in SZ-associated loci may drive altered expression of a given DEG during GIN development in SZ patients, additional experiments would be necessary to first confirm whether each DAR acts as a functional genetic element. Additionally, given that none of these DARs coincide with neuronal expression quantitative trait loci, it is unclear by what mechanism these elements could contribute to increased SZ risk (78). Given these results, further study will be required to examine the individual contribution of these 16 genes and their related DARs to SZ-related phenotypes.
In summary, our ATAC-seq and RNA-seq data reveal novel TFs and genetic regulatory elements that may broadly regulate the expression of genes critical for GIN development and, by extension, interneuron-related disorders such as schizophrenia. While protein-driven analyses represent important next steps to evaluate functional changes in gene expression or specific drivers of GIN maturation, these data will altogether be a useful resource for examining the molecular networks regulating GIN functionality.
Materials and Methods
In vitro differentiation to GINs
The HC1 and HC2 human iPSC lines were previously generated from skin biopsy samples of two healthy adult males (98). iPSCs (passage ≤ 35) were cultured on irradiated mouse embryonic fibroblasts in human iPSC media consisting of DMEM/F12 (#11320082, Thermo Fisher, Waltham, MA, USA) supplemented with 20% KnockOut Serum Replacement (#10828028, Thermo Fisher), 2 mm GlutaMAX (#35050079, Thermo Fisher), 100 μm non-essential amino acids (NEAA; #11140050, Thermo Fisher), 100 μm 2-mercaptoethanol (#21985023, Thermo Fisher) and 10 ng/ml human basic FGF (#100-18B, PeproTech, Rocky Hill, NJ, USA) as previously described (99). Media were changed daily and iPSC lines were passaged by incubation for 1 h at 37°C in DMEM/F12 media with 1 mg/ml collagenase (#17018029, Thermo Fisher). For differentiation of iPSCs into cortical GINs, iPSC colonies were detached from the feeder layer with collagenase and resuspended in EB medium, comprised of FGF2-free human iPSC media supplemented with 2 μm dorsomorphin (#3093, Tocris Bioscience, Bristol, UK) and 2 μm A-83-01 (#2939, Tocris Bioscience). Cells were grown in non-treated polystyrene plates for 6 days, and medium was changed daily. On day 7 (D7) of the differentiation protocol, floating embryoid bodies were transferred to Matrigel-coated 6-well plates (#354432, Corning Inc., Corning, NY, USA). Cells were first grown in NPC1 media consisting of DMEM/F12 with 1X N-2 supplement (#17502001, Thermo Fisher), 1X NEAA, 2 μg/ml heparin (#H3149, MilliporeSigma, Burlington, MA, USA) and 1 μg/ml of recombinant human SHH (#100-45, PeproTech). On D11, the NPC1 medium was replaced with NPC2 medium comprised of DMEM/F12 with 1X N-2 supplement, 1X NEAA, 2 μg/ml heparin and 1.5 μm purmorphamine (#4551, Tocris Bioscience). From D7 to D22, the medium was changed once every 2 days. On D22, neural rosettes were mechanically picked and transferred to low-attachment plates (#3471, Corning) in NPC2 media supplemented with 1X B-27 (#17504044, Thermo Fisher). For further differentiation, neural progenitor spheres were dissociated by incubation with Accutase (#A1110501, Thermo Fisher) for 10 min at 37°C and then resuspended in Neuron medium, comprised of Neurobasal medium (#21103049, Thermo Fisher) supplemented with 2 mm GlutaMAX, 1X B-27, 1 μm cAMP (#D0260, MilliporeSigma), 200 ng/ml L-ascorbic acid (#A4403, MilliporeSigma), 10 ng/ml recombinant BDNF (#450-02, PeproTech) and 10 ng/ml recombinant GDNF (#450-10, PeproTech). For quantification of GIN subtypes, additional cells were passaged onto coverslips coated with 50 μg/ml poly-D-lysine (#P6407, MilliporeSigma) and 10 μg/ml laminin (#L2020, MilliporeSigma). Cells were continuously cultured in Neuron media from D22 to D78, and half of the media was replaced weekly. At D22, D50 and D78, cells were dissociated with Accutase and gently pelleted by centrifugation at 1500 rpm for 5 min (rotor #75006445, Sorvall, Thermo Fisher). Cells were resuspended in 1 ml TRIzol reagent (#15596026, Thermo Fisher) for RNA-seq and qRT-PCR, or 1X PBS for ATAC-seq library preparation.
Immunostaining for neuronal markers
Cells at D36, D50 or D78 were fixed with 4% paraformaldehyde (#157-4, Electron Microscopy Sciences, Hatfield, PA, USA) for 15 min at room temperature. Samples were permeabilized and blocked with 0.25% Triton X-100 (#X100, MilliporeSigma) and 10% donkey serum (#017-000-121, Jackson ImmunoResearch, West Grove, PA, USA) in PBS for 20 min as previously described (98). Samples were then incubated with primary antibodies at 4°C overnight, followed by incubation with secondary antibodies for 1 h at room temperature. The following primary antibodies were used: rabbit polyclonal anti-NESTIN (1:800; #AB5922, MilliporeSigma), mouse monoclonal anti-NKX2.1 (1:500; #MAB5460, MilliporeSigma), rabbit polyclonal anti-GABA (1:1000; #A2052, MilliporeSigma), mouse monoclonal anti-calbindin (1:500; #300, Swant, Marly, Switzerland), rabbit polyclonal anti-calretinin (1:500; #7699/4, Swant), rabbit polyclonal anti-parvalbumin (1:300; #PV27, Swant), rabbit monoclonal anti-somatostatin (1:500; #MA5-17182, Thermo Fisher), rabbit polyclonal anti-NPY (1:300; #T-4068.0500, Peninsula Laboratories, San Carlos, CA, USA) and chicken polyclonal anti-MAP2 (1:500; #NB300-213, Novus Biologicals, Centennial, CO, USA). The following secondary antibodies were used: donkey anti-chicken Alexa Fluor 488 (1:1000; #703-545-155, Jackson ImmunoResearch), donkey anti-mouse Alexa Fluor 568 (1:1000; #A10037, Thermo Fisher) and donkey anti-rabbit Alexa Fluor 568 (1:1000; #A10042, Thermo Fisher). Antibodies were prepared in PBS containing 0.25% Triton X-100 and 10% donkey serum. Slides were mounted using VECTASHIELD antifade medium with DAPI (#H-1200, Vector Laboratories, Burlingame, CA, USA). Images were taken using a Nikon Eclipse Ti-E microscope and analyzed with ImageJ software (https://imagej.nih.gov/ij/) (100).
Electrophysiology
Whole-cell patch-clamp recordings were conducted at room temperature using a MultiClamp 700B patch-clamp amplifier (Molecular Devices, Palo Alto, CA, USA) as previously described (98). Briefly, the recording chamber was constantly perfused with a bath solution consisting of 128 mm NaCl, 30 mm glucose, 25 mm HEPES, 5 mm KCl, 2 mm CaCl2 and 1 mm MgCl2 (pH 7.3; 315–325 mOsmol). Patch pipettes were pulled from borosilicate glass (4–6 MΩ) and filled with an internal solution consisting of 130 mm K-gluconate, 8 mm KCl, 10 mm HEPES, 1 mm EGTA, 8 mm Na2-phosphocreatine, 4 mm Mg-ATP and 0.3 mm Na2-GTP (pH 7.3; 290 mOsmol). Membrane potential was corrected for liquid junction potential (−14 mV), and signals were filtered at 2 kHz and sampled at 20 kHz via a Digidata 1550B digitizer (Molecular Devices) controlled by pCLAMP software (Molecular Devices). sPSC recordings were held at −60 mV and amplitudes <10 pA were excluded from analysis. To record whole-cell ionic currents, cells were voltage-clamped at −60 mV and depolarized to voltages stepped from −90 to 50 mV with a 10 mV increment for 500 ms. Any recordings in which the membrane resting potential was greater than −40 mV were excluded from analysis. The evoked action potential measurements were conducted in current clamp recording, and RMP was adjusted to −60 mV by injecting a small positive current (<30 pA). Cells were stimulated with current steps from −20 to 100 pA with a 10 pA increment for 500 ms to measure the number and pattern of action potentials fired. Action potential parameters were characterized from the first evoked action potential in which the maximum rising slope exceeded 20 mV/ms.
RNA-seq and data analysis
Total RNA was isolated from TRIzol preparations of independently differentiated HC1-derived neurons (three biological replicates each at D22 and D78, and two biological replicates at D50, for a total of eight samples), following manufacturer guidelines (Thermo Fisher). Briefly, 200 μl chloroform (#C298–500, Fisher Scientific) was added to each TRIzol sample, and samples were incubated on ice for 15 min, followed by a 15-min centrifugation step at 13 200 rpm (rotor #FA-24x2, Eppendorf, Hamburg, Germany) and 4°C. The aqueous phase containing RNA was transferred to a new nuclease-free tube and gently mixed with 500 μl isopropanol (#BP2618-1, Fisher Scientific). Tubes were incubated for an additional 15 min on ice before a second 15-min centrifugation step at 13 200 rpm (rotor #FA-24x2, Eppendorf) and 4°C. The precipitated RNA was aspirated and resuspended in 1 ml of 75% ethanol and then centrifuged for 15 min at 13 200 rpm (rotor #FA-24x2, Eppendorf) and 4°C. The precipitated RNA pellet was then aspirated and dissolved in 50 μl nuclease-free water via a 10-min incubation step at 60°C. RNA concentration and quality were determined utilizing a 2100 Bioanalyzer (Agilent Technologies, Santa Clara, CA, USA). 2 μg total RNA per sample was used to create libraries with a Kapa Biosystems stranded RNA-seq kit with capture beads (#07962207001, Roche, Basel, Switzerland). Libraries were pooled at equimolar concentrations and sequenced on a NextSeq 500 system (Illumina, San Diego, CA, USA), using 75 bp paired-end chemistry.
Raw sequence reads were trimmed for Illumina adapters utilizing Trimmomatic v.0.38 and then aligned to the hg38 human reference genome utilizing TopHat2 v2.1.1 (101–103). HTSeq v0.11.0 was used to determine gene counts from uniquely mapped, paired reads (104). DESeq2 was utilized to normalize gene counts and determine changes in gene expression between cells at D22, D50 and D78 (105). Genes were considered to have detectable expression if at least two samples within a given time point (D22, D50 or D78) exhibited a DESeq2-normalized expression value >3. DEGs were determined by a FDR < 0.05 and absolute FC > 2. All DEGs and DESeq2-normalized gene expression values are listed in Supplementary Material, Table S1.
Gene set enrichment analyses
All genes with detectable expression were pre-ranked for GSEA based on the equation:  . GSEA was performed utilizing GSEA v3.0 software, with default settings (1000 permutations, weighted enrichment statistic and meandiv normalization) (37). Pathways with FDR (q) < 0.05 were considered statistically significant. The 10 most significant GSEA pathways observed starting at D50 are listed in Supplementary Material, Table S3. SGSE was performed with the brainImageR package in Bioconductor, using the 4840 DEGs between D78 and D22 as input (36). CSEA was performed through the online CSEA platform (http://genetics.wustl.edu/jdlab/csea-tool-2/), using the 250 DEGs which were upregulated at D78 (relative to D22) and exhibited the highest normalized expression as input (38).
Quantitative real-time PCR
Total RNA from HC1- and HC2-derived cells was incubated with amplification-grade DNase I (#18068015, Thermo Fisher) for 15 min at 25°C to eliminate residual genomic DNA. DNase I was inactivated by adding 25 mm EDTA solution to each sample and incubating at 65°C for 10 min. DNase-treated RNA was then reverse-transcribed into cDNA using a SuperScript III first-strand cDNA synthesis kit with random hexamer primers (#18080051, Thermo Fisher).
qRT-PCR was carried out in technical triplicate in a 20 μl volume containing iQ SYBR Green SuperMix (#1708880, Bio-Rad, Hercules, CA, USA) and 5 μm primers, on a CFX96 Real-Time PCR Detection System (Bio-Rad), using three biological replicates per time point and iPSC cell line. The reaction parameters were 1 cycle with 2 min at 95°C; 40 cycles with 15 s at 95°C, 30 s at 58°C or 60°C; and 1 cycle with 10 s at 95°C. To prevent amplification of any residual genomic DNA, Primer3 software (http://primer3.ut.ee/) was used to design qRT-PCR primers that spanned exon–exon junctions (106). Primers for SCN1A were previously reported by Fraser et al. (122). The optimal annealing temperature to generate standard curves with 90–100% amplification efficiency was determined for each primer pair (Supplementary Material, Table S2). The expression level of each gene was normalized to ACTB (encoding β-actin) using the Pfaffl method, as previously described (107,108).
Western blot analysis
Following RNA isolation from TRIzol preparations of HC1- and HC2-derived cells, protein was extracted following manufacturer guidelines (Thermo Fisher). Briefly, 200 μl of 100% ethanol was added to each TRIzol sample, and samples were incubated at room temperature for 3 min, followed by a 10-min centrifugation step at 13 200 rpm (rotor #FA-24x2, Eppendorf) and 4°C. The supernatant containing protein was transferred to a new tube and gently mixed with 1.2 ml isopropanol (Fisher Scientific). Tubes were incubated for 10 min on ice before a second 10-min centrifugation step at 13 200 rpm (rotor #FA-24x2, Eppendorf) and 4°C. The precipitated protein pellet was then aspirated and washed in 2 ml of 0.3 M guanidine hydrochloride solution in 95% ethanol (#BP178-500, Fisher Scientific). Samples were incubated with guanidine hydrochloride solution at 4°C for 20 min, before a 5-min centrifugation step at 13 200 rpm (rotor #FA-24x2, Eppendorf) and 4°C. This guanidine hydrochloride wash and centrifugation step was repeated a total of three times per sample. Following the final wash, samples were incubated with 2 ml of 100% ethanol for 20 min on ice, followed by a 5-min centrifugation step at 13 200 rpm (rotor #FA-24x2, Eppendorf) and 4°C. The protein pellet was aspirated and resuspended in 200 μl of 1% SDS solution (#428015, MilliporeSigma).
Protein extracts (200 μg) were briefly denatured in 4X Laemmli buffer (#1610747, Bio-Rad) and 5% β-mercaptoethanol (#444203, MilliporeSigma) at 37°C for 5 min and then loaded on a precast 7.5% mini-PROTEAN TGX stain-free polyacrylamide gel (#4568024, Bio-Rad). Blots were probed using the following primary antibodies: mouse monoclonal anti-DCX (1:500; #sc-271 390, Santa Cruz Biotechnology, Dallas, TX, USA), chicken polyclonal anti-MAP2 (1:10000; #NB300-213, Novus Biologicals) and rabbit monoclonal anti-GAPDH (1:1000; #D16H11, Cell Signaling Technology, Danvers, MA, USA). Protein signal was visualized utilizing the following HRP-conjugated secondary antibodies: goat polyclonal anti-mouse (1:2000; #ab205719, Abcam), donkey polyclonal anti-chicken (1:250; #SA1-300, Thermo Fisher) and donkey monoclonal anti-rabbit (1:3000; #NA934, GE Healthcare, Chicago, IL, USA). Band intensities were analyzed using Image Lab software (v5.2.1, Bio-Rad) and normalized to total protein. For D22 cells, which lacked visible MAP2 and DCX bands, the corresponding background signal at 280 kDa (MAP2) and 40 kDa (DCX) was quantified and plotted.
ATAC-seq and data analysis
ATAC-seq was performed as previously described by Guo et al. (109). Briefly, independent preparations of HC1- and HC2-derived cells were gently pelleted in 1X PBS and resuspended in a 25 μl tagmentation reaction consisting of 1X TD buffer (10 mm TAPS-NaOH pH 8.1, 5 mm MgCl2, 10% DMF), 2.5 μl Tn5 transposase, 0.1% Tween 20 and 0.02% Digitonin and then incubated for 1 h at 37°C. In total, nuclei were isolated from 17 samples: three biological replicates each for HC1-derived cells at D22, D50 and D78, two biological replicates for HC2-derived cells at D22 and three biological replicates for HC2-derived cells at D50 and D78. Tagmented nuclei were diluted 2-fold and incubated for 30 min at 40°C in lysis buffer comprised of 300 mm NaCl, 100 mm EDTA, 0.6% SDS and 1.6 μg proteinase K. Transposed DNA was isolated by size selection using SPRI beads and PCR-amplified using 2X KAPA HiFi HotStart ReadyMix (#7958927001, Roche) and Nextera Indexing Primers (#FC-131-2003, Illumina). Following PCR amplification, the size-selection step was repeated to enrich for low molecular weight DNA. Sample quality was assessed on a 2100 Bioanalyzer (Agilent Technologies), and libraries were pooled at an equimolar ratio for sequencing on a HiSeq 2500 system (Illumina) with 50 bp paired-end chemistry.
Raw sequencing reads were trimmed for sequencing adapters utilizing the CutAdapt package in Python and then mapped to the hg38 human reference genome using Bowtie2 v2.2.4 (103,110,111). MACS2 v.2.1.0 was used to call peaks, and counts were normalized to reads per peak per million using the equation:  (112). Peaks were annotated to the nearest TSS using HOMER v.4.8.2 software, and distribution of raw ATAC peaks across the genome was determined using ChIPseeker (113,114). edgeR was utilized to determine changes in chromatin accessibility between samples at D22, D50 and D78 (115). DARs of chromatin were defined by FDR < 0.05 and absolute FC >2. Only DARs with the same signed FC (positive or negative) between time point comparisons in both HC1- and HC2-derived cells were utilized for downstream analyses. Shared DARs and annotations are listed in Supplementary Material, Table S4. The distribution of shared DARs in schizophrenia-associated genomic loci was visualized using karyoploteR (78,116). Visualizations of ATAC-seq reads per million (rpm) signal to the human genome build hg38 were generated from bigWig files using the rtracklayer package in R/Bioconductor (103,117). All custom R/Bioconductor scripts are available upon request.
TF motif analysis
The MEME Suite v5.0.5 Analysis of Motif Enrichment tool was utilized to determine enrichment of TF binding motifs (HOCOMOCO v11 database) in DARs, compared to shuffled input sequences (Supplementary Material, Table S5) (62,118). TF footprinting in DARs was performed utilizing RGT-HINT software (119). Similarity among HOCOMOCO v11 TF motifs was calculated using STAMP alignment software (http://www.benoslab.pitt.edu/stamp/), phylogenies were visualized with FigTree v1.4.4 (http://tree.bio.ed.ac.uk), and clades of analogous TF motifs were determined using CTree v1.03 (63,120).
Statistical analysis
Statistical comparisons were calculated using Prism v8.1.2 software (GraphPad, San Diego, CA, USA). A two-way ANOVA with Tukey’s multiple comparisons test was used to compare the percentage of cells expressing GIN markers at D50 or D78, relative to D36. A two-way ANOVA with Tukey’s multiple comparisons test was also used to compare the genomic distribution of ATAC-seq peaks at D50 or D78, relative to D22. A two-way ANOVA with Sidak’s multiple comparisons test was used to compare differences in gene expression validated by qRT-PCR and Western blotting relative to D22. Pearson’s product-moment correlation between TSS accessibility and gene expression was calculated using the cor() function in R. The BEDtools two-tailed Fisher’s exact test was used to compare enrichment of DARs in 108 schizophrenia-associated genomic loci (78,121).
Data availability
All sequencing data are available under accession GSE145073 at the National Center for Biotechnology Information Gene Expression Omnibus (https://www.ncbi.nlm.nih.gov/geo/).
Supplementary Material
Acknowledgements
The content of this publication is solely the responsibility of the authors and does not necessarily reflect the official views of the National Institutes of Health, the Department of Defense or the Edward Mallinckrodt, Jr. Foundation. RNA-seq was performed with the Georgia Genomics and Bioinformatics Core at the University of Georgia, while ATAC-seq libraries were sequenced at the NYU Genome Technology Center. We are grateful for feedback from Dr Peng Jin.
Conflict of Interest statement. None declared.
Funding
National Institute of Neurological Disorders and Stroke of the National Institutes of Health (grant numbers R01NS107505 to Z.W., R21NS108760 to A.E., U19AI131130 to Z.W., F31NS110193 to G.A.S.I., T32NS007480 to G.A.S.I.); Department of Defense (grant number W81XWH1910353 to Z.W.); Edward Mallinckrodt, Jr. Foundation (Z.W.).
References
- 1. Rossignol E. (2011) Genetics and function of neocortical GABAergic interneurons in neurodevelopmental disorders. Neural Plast., 2011, 649325. [DOI] [PMC free article] [PubMed] [Google Scholar]
- 2. Liu Y., Liu H., Sauvey C., Yao L., Zarnowska E.D. and Zhang S.C. (2013) Directed differentiation of forebrain GABA interneurons from human pluripotent stem cells. Nat. Protoc., 8, 1670–1679. [DOI] [PMC free article] [PubMed] [Google Scholar]
- 3. Shao Z., Noh H., Bin Kim W., Ni P., Nguyen C., Cote S.E., Noyes E., Zhao J., Parsons T., Park J.M. et al. (2019) Dysregulated protocadherin-pathway activity as an intrinsic defect in induced pluripotent stem cell-derived cortical interneurons from subjects with schizophrenia. Nat. Neurosci., 22, 229–242. [DOI] [PMC free article] [PubMed] [Google Scholar]
- 4. Sun Q., Li X., Ren M., Zhao M., Zhong Q., Ren Y., Luo P., Ni H., Zhang X., Zhang C. et al. (2019) A whole-brain map of long-range inputs to GABAergic interneurons in the mouse medial prefrontal cortex. Nat. Neurosci., 22, 1357–1370. [DOI] [PubMed] [Google Scholar]
- 5. Lewis D.A., Curley A.A., Glausier J.R. and Volk D.W. (2012) Cortical parvalbumin interneurons and cognitive dysfunction in schizophrenia. Trends Neurosci., 35, 57–67. [DOI] [PMC free article] [PubMed] [Google Scholar]
- 6. Volk D.W. and Lewis D.A. (2014) Early developmental disturbances of cortical inhibitory neurons: contribution to cognitive deficits in schizophrenia. Schizophr. Bull., 40, 952–957. [DOI] [PMC free article] [PubMed] [Google Scholar]
- 7. Dutton S.B., Makinson C.D., Papale L.A., Shankar A., Balakrishnan B., Nakazawa K. and Escayg A. (2013) Preferential inactivation of Scn1a in parvalbumin interneurons increases seizure susceptibility. Neurobiol. Dis., 49, 211–220. [DOI] [PMC free article] [PubMed] [Google Scholar]
- 8. Jacob J. (2016) Cortical interneuron dysfunction in epilepsy associated with autism spectrum disorders. Epilepsia, 57, 182–193. [DOI] [PubMed] [Google Scholar]
- 9. Nicholas C.R., Chen J., Tang Y., Southwell D.G., Chalmers N., Vogt D., Arnold C.M., Chen Y.J., Stanley E.G., Elefanty A.G. et al. (2013) Functional maturation of hPSC-derived forebrain interneurons requires an extended timeline and mimics human neural development. Cell Stem Cell, 12, 573–586. [DOI] [PMC free article] [PubMed] [Google Scholar]
- 10. Mouchlianitis E., McCutcheon R. and Howes O.D. (2016) Brain-imaging studies of treatment-resistant schizophrenia: a systematic review. Lancet Psychiatry, 3, 451–463. [DOI] [PMC free article] [PubMed] [Google Scholar]
- 11. Tandon R., Gaebel W., Barch D.M., Bustillo J., Gur R.E., Heckers S., Malaspina D., Owen M.J., Schultz S., Tsuang M. et al. (2013) Definition and description of schizophrenia in the DSM-5. Schizophr. Res., 150, 3–10. [DOI] [PubMed] [Google Scholar]
- 12. Volk D.W., Edelson J.R. and Lewis D.A. (2016) Altered expression of developmental regulators of parvalbumin and somatostatin neurons in the prefrontal cortex in schizophrenia. Schizophr. Res., 177, 3–9. [DOI] [PMC free article] [PubMed] [Google Scholar]
- 13. Bicks L.K., Yamamuro K., Flanigan M.E., Kim J.M., Kato D., Lucas E.K., Koike H., Peng M.S., Brady D.M., Chandrasekaran S. et al. (2020) Prefrontal parvalbumin interneurons require juvenile social experience to establish adult social behavior. Nat. Commun., 11, 1003. [DOI] [PMC free article] [PubMed] [Google Scholar]
- 14. Sun A.X., Yuan Q., Tan S., Xiao Y., Wang D., Khoo A.T., Sani L., Tran H.D., Kim P., Chiew Y.S. et al. (2016) Direct induction and functional maturation of forebrain GABAergic neurons from human pluripotent stem cells. Cell Rep., 16, 1942–1953. [DOI] [PubMed] [Google Scholar]
- 15. Hansen D.V., Lui J.H., Flandin P., Yoshikawa K., Rubenstein J.L., Alvarez-Buylla A. and Kriegstein A.R. (2013) Non-epithelial stem cells and cortical interneuron production in the human ganglionic eminences. Nat. Neurosci., 16, 1576–1587. [DOI] [PMC free article] [PubMed] [Google Scholar]
- 16. Meganathan K., Lewis E.M.A., Gontarz P., Liu S., Stanley E.G., Elefanty A.G., Huettner J.E., Zhang B. and Kroll K.L. (2017) Regulatory networks specifying cortical interneurons from human embryonic stem cells reveal roles for CHD2 in interneuron development. Proc. Natl. Acad. Sci. U. S. A., 114, E11180–e11189. [DOI] [PMC free article] [PubMed] [Google Scholar]
- 17. Clowry G.J. (2015) An enhanced role and expanded developmental origins for gamma-aminobutyric acidergic interneurons in the human cerebral cortex. J. Anat., 227, 384–393. [DOI] [PMC free article] [PubMed] [Google Scholar]
- 18. Mo A., Mukamel E.A., Davis F.P., Luo C., Henry G.L., Picard S., Urich M.A., Nery J.R., Sejnowski T.J., Lister R. et al. (2015) Epigenomic signatures of neuronal diversity in the mammalian brain. Neuron, 86, 1369–1384. [DOI] [PMC free article] [PubMed] [Google Scholar]
- 19. Anastasiades P.G., Marques-Smith A., Lyngholm D., Lickiss T., Raffiq S., Katzel D., Miesenbock G. and Butt S.J. (2016) GABAergic interneurons form transient layer-specific circuits in early postnatal neocortex. Nat. Commun., 7, 10584. [DOI] [PMC free article] [PubMed] [Google Scholar]
- 20. Gallegos D.A., Chan U., Chen L.F. and West A.E. (2018) Chromatin regulation of neuronal maturation and plasticity. Trends Neurosci., 41, 311–324. [DOI] [PMC free article] [PubMed] [Google Scholar]
- 21. Close J.L., Yao Z., Levi B.P., Miller J.A., Bakken T.E., Menon V., Ting J.T., Wall A., Krostag A.R., Thomsen E.R. et al. (2017) Single-cell profiling of an in vitro model of human interneuron development reveals temporal dynamics of cell type production and maturation. Neuron, 93, 1035–1048.e1035. [DOI] [PMC free article] [PubMed] [Google Scholar]
- 22. Noh H., Shao Z., Coyle J.T. and Chung S. (2017) Modeling schizophrenia pathogenesis using patient-derived induced pluripotent stem cells (iPSCs). Biochim. Biophys. Acta Mol. basis Dis., 1863, 2382–2387. [DOI] [PMC free article] [PubMed] [Google Scholar]
- 23. Schuster J., Laan L., Klar J., Jin Z., Huss M., Korol S., Noraddin F.H., Sobol M., Birnir B. and Dahl N. (2019) Transcriptomes of Dravet syndrome iPSC derived GABAergic cells reveal dysregulated pathways for chromatin remodeling and neurodevelopment. Neurobiol. Dis., 132, 104583. [DOI] [PubMed] [Google Scholar]
- 24. Campbell K. (2003) Dorsal-ventral patterning in the mammalian telencephalon. Curr. Opin. Neurobiol., 13, 50–56. [DOI] [PubMed] [Google Scholar]
- 25. Liu Y., Weick J.P., Liu H., Krencik R., Zhang X., Ma L., Zhou G.M., Ayala M. and Zhang S.C. (2013) Medial ganglionic eminence-like cells derived from human embryonic stem cells correct learning and memory deficits. Nat. Biotechnol., 31, 440–447. [DOI] [PMC free article] [PubMed] [Google Scholar]
- 26. Maroof A.M., Keros S., Tyson J.A., Ying S.W., Ganat Y.M., Merkle F.T., Liu B., Goulburn A., Stanley E.G., Elefanty A.G. et al. (2013) Directed differentiation and functional maturation of cortical interneurons from human embryonic stem cells. Cell Stem Cell, 12, 559–572. [DOI] [PMC free article] [PubMed] [Google Scholar]
- 27. Park D., Xiang A.P., Mao F.F., Zhang L., Di C.G., Liu X.M., Shao Y., Ma B.F., Lee J.H., Ha K.S. et al. (2010) Nestin is required for the proper self-renewal of neural stem cells. Stem Cells, 28, 2162–2171. [DOI] [PubMed] [Google Scholar]
- 28. Sun Y., Pasca S.P., Portmann T., Goold C., Worringer K.A., Guan W., Chan K.C., Gai H., Vogt D., Chen Y.J. et al. (2016) A deleterious Nav1.1 mutation selectively impairs telencephalic inhibitory neurons derived from Dravet syndrome patients. elife, 5, e13073. [DOI] [PMC free article] [PubMed] [Google Scholar]
- 29. Pang Z.P., Yang N., Vierbuchen T., Ostermeier A., Fuentes D.R., Yang T.Q., Citri A., Sebastiano V., Marro S., Sudhof T.C. et al. (2011) Induction of human neuronal cells by defined transcription factors. Nature, 476, 220–223. [DOI] [PMC free article] [PubMed] [Google Scholar]
- 30. Pereira M., Birtele M., Shrigley S., Benitez J.A., Hedlund E., Parmar M. and Ottosson D.R. (2017) Direct reprogramming of resident NG2 glia into neurons with properties of fast-spiking parvalbumin-containing interneurons. Stem Cell Rep., 9, 742–751. [DOI] [PMC free article] [PubMed] [Google Scholar]
- 31. Beanan M.J. and Sargent T.D. (2000) Regulation and function of Dlx3 in vertebrate development. Dev. Dyn., 218, 545–553. [DOI] [PubMed] [Google Scholar]
- 32. Schmalbach B., Lepsveridze E., Djogo N., Papashvili G., Kuang F., Leshchyns'ka I., Sytnyk V., Nikonenko A.G., Dityatev A., Jakovcevski I. et al. (2015) Age-dependent loss of parvalbumin-expressing hippocampal interneurons in mice deficient in CHL1, a mental retardation and schizophrenia susceptibility gene. J. Neurochem., 135, 830–844. [DOI] [PubMed] [Google Scholar]
- 33. Friocourt G., Liu J.S., Antypa M., Rakic S., Walsh C.A. and Parnavelas J.G. (2007) Both doublecortin and doublecortin-like kinase play a role in cortical interneuron migration. J. Neurosci., 27, 3875–3883. [DOI] [PMC free article] [PubMed] [Google Scholar]
- 34. Harada A., Teng J., Takei Y., Oguchi K. and Hirokawa N. (2002) MAP2 is required for dendrite elongation, PKA anchoring in dendrites, and proper PKA signal transduction. J. Cell Biol., 158, 541–549. [DOI] [PMC free article] [PubMed] [Google Scholar]
- 35. Barber R.D., Harmer D.W., Coleman R.A. and Clark B.J. (2005) GAPDH as a housekeeping gene: analysis of GAPDH mRNA expression in a panel of 72 human tissues. Physiol. Genomics, 21, 389–395. [DOI] [PubMed] [Google Scholar]
- 36. Linker S.B., Hsu J.Y., Pfaff A., Amatya D., Ko S.M., Voter S., Wong Q. and Gage F.H. (2019) BrainImageR: spatiotemporal gene set analysis referencing the human brain. Bioinformatics, 35, 343–345. [DOI] [PMC free article] [PubMed] [Google Scholar]
- 37. Subramanian A., Tamayo P., Mootha V.K., Mukherjee S., Ebert B.L., Gillette M.A., Paulovich A., Pomeroy S.L., Golub T.R., Lander E.S. et al. (2005) Gene set enrichment analysis: a knowledge-based approach for interpreting genome-wide expression profiles. Proc. Natl. Acad. Sci. U. S. A., 102, 15545–15550. [DOI] [PMC free article] [PubMed] [Google Scholar]
- 38. Xu X., Wells A.B., O'Brien D.R., Nehorai A. and Dougherty J.D. (2014) Cell type-specific expression analysis to identify putative cellular mechanisms for neurogenetic disorders. J. Neurosci., 34, 1420–1431. [DOI] [PMC free article] [PubMed] [Google Scholar]
- 39. Yeung R.K., Xiang Z.H., Tsang S.Y., Li R., Ho T.Y.C., Li Q., Hui C.K., Sham P.C., Qiao M.Q. and Xue H. (2018) Gabrb2-knockout mice displayed schizophrenia-like and comorbid phenotypes with interneuron-astrocyte-microglia dysregulation. Transl. Psychiatry, 8, 128. [DOI] [PMC free article] [PubMed] [Google Scholar]
- 40. Niturad C.E., Lev D., Kalscheuer V.M., Charzewska A., Schubert J., Lerman-Sagie T., Kroes H.Y., Oegema R., Traverso M., Specchio N. et al. (2017) Rare GABRA3 variants are associated with epileptic seizures, encephalopathy and dysmorphic features. Brain, 140, 2879–2894. [DOI] [PubMed] [Google Scholar]
- 41. Mattison K.A., Butler K.M., Inglis G.A.S., Dayan O., Boussidan H., Bhambhani V., Philbrook B., Silva C., Alexander J.J., Kanner B.I. et al. (2018) SLC6A1 variants identified in epilepsy patients reduce gamma-aminobutyric acid transport. Epilepsia, 59, e135–e141. [DOI] [PubMed] [Google Scholar]
- 42. Bouhours B., Gjoni E., Kochubey O. and Schneggenburger R. (2017) Synaptotagmin2 (Syt2) drives fast release redundantly with Syt1 at the output synapses of parvalbumin-expressing inhibitory neurons. J. Neurosci., 37, 4604–4617. [DOI] [PMC free article] [PubMed] [Google Scholar]
- 43. Batista-Brito R., Machold R., Klein C. and Fishell G. (2008) Gene expression in cortical interneuron precursors is prescient of their mature function. Cereb. Cortex, 18, 2306–2317. [DOI] [PMC free article] [PubMed] [Google Scholar]
- 44. Bragina L., Giovedi S., Barbaresi P., Benfenati F. and Conti F. (2010) Heterogeneity of glutamatergic and GABAergic release machinery in cerebral cortex: analysis of synaptogyrin, vesicle-associated membrane protein, and syntaxin. Neuroscience, 165, 934–943. [DOI] [PubMed] [Google Scholar]
- 45. Tokudome K., Okumura T., Shimizu S., Mashimo T., Takizawa A., Serikawa T., Terada R., Ishihara S., Kunisawa N., Sasa M. et al. (2016) Synaptic vesicle glycoprotein 2A (SV2A) regulates kindling epileptogenesis via GABAergic neurotransmission. Sci. Rep., 6, 27420. [DOI] [PMC free article] [PubMed] [Google Scholar]
- 46. Blackmore M.G., Moore D.L., Smith R.P., Goldberg J.L., Bixby J.L. and Lemmon V.P. (2010) High content screening of cortical neurons identifies novel regulators of axon growth. Mol. Cell. Neurosci., 44, 43–54. [DOI] [PMC free article] [PubMed] [Google Scholar]
- 47. Xiang Y., Tanaka Y., Patterson B., Kang Y.J., Govindaiah G., Roselaar N., Cakir B., Kim K.Y., Lombroso A.P., Hwang S.M. et al. (2017) Fusion of regionally specified hPSC-derived organoids models human brain development and interneuron migration. Cell Stem Cell, 21, 383–398e387. [DOI] [PMC free article] [PubMed] [Google Scholar]
- 48. Vergano-Vera E., Yusta-Boyo M.J., Castro F., Bernad A., Pablo F. and Vicario-Abejon C. (2006) Generation of GABAergic and dopaminergic interneurons from endogenous embryonic olfactory bulb precursor cells. Development, 133, 4367–4379. [DOI] [PubMed] [Google Scholar]
- 49. Radonjić N.V., Ayoub A.E., Memi F., Yu X., Maroof A., Jakovcevski I., Anderson S.A., Rakic P. and Zecevic N. (2014) Diversity of cortical interneurons in primates: the role of the dorsal proliferative niche. Cell Rep., 9, 2139–2151. [DOI] [PMC free article] [PubMed] [Google Scholar]
- 50. Bernácer J., Prensa L. and Giménez-Amaya J.M. (2007) Cholinergic interneurons are differentially distributed in the human striatum. PLoS One, 2, e1174. [DOI] [PMC free article] [PubMed] [Google Scholar]
- 51. Yu X. and Zecevic N. (2011) Dorsal radial glial cells have the potential to generate cortical interneurons in human but not in mouse brain. J. Neurosci., 31, 2413–2420. [DOI] [PMC free article] [PubMed] [Google Scholar]
- 52. Costa M.R. and Muller U. (2014) Specification of excitatory neurons in the developing cerebral cortex: progenitor diversity and environmental influences. Front. Cell. Neurosci., 8, 449. [DOI] [PMC free article] [PubMed] [Google Scholar]
- 53. Costa M.R., Kessaris N., Richardson W.D., Götz M. and Hedin-Pereira C. (2007) The marginal zone/layer I as a novel niche for neurogenesis and Gliogenesis in developing cerebral cortex. J. Neurosci., 27, 11376. [DOI] [PMC free article] [PubMed] [Google Scholar]
- 54. Briggs F. (2010) Organizing principles of cortical layer 6. Front. Neural Circuit, 4, 3–3. [DOI] [PMC free article] [PubMed] [Google Scholar]
- 55. Frandolig J.E., Matney C.J., Lee K., Kim J., Chevee M., Kim S.J., Bickert A.A. and Brown S.P. (2019) The synaptic organization of layer 6 circuits reveals inhibition as a major output of a neocortical sublamina. Cell Rep., 28, 3131–3143e3135. [DOI] [PMC free article] [PubMed] [Google Scholar]
- 56. Reinius B., Blunder M., Brett F.M., Eriksson A., Patra K., Jonsson J., Jazin E. and Kullander K. (2015) Conditional targeting of medium spiny neurons in the striatal matrix. Front. Behav. Neurosci., 9, 71. [DOI] [PMC free article] [PubMed] [Google Scholar]
- 57. Gagnon D., Petryszyn S., Sanchez M.G., Bories C., Beaulieu J.M., De Koninck Y., Parent A. and Parent M. (2017) Striatal neurons expressing D(1) and D(2) receptors are morphologically distinct and differently affected by dopamine denervation in mice. Sci. Rep., 7, 41432–41432. [DOI] [PMC free article] [PubMed] [Google Scholar]
- 58. Buenrostro J.D., Giresi P.G., Zaba L.C., Chang H.Y. and Greenleaf W.J. (2013) Transposition of native chromatin for fast and sensitive epigenomic profiling of open chromatin, DNA-binding proteins and nucleosome position. Nat. Methods, 10, 1213–1218. [DOI] [PMC free article] [PubMed] [Google Scholar]
- 59. Kahler A.K., Djurovic S., Rimol L.M., Brown A.A., Athanasiu L., Jonsson E.G., Hansen T., Gustafsson O., Hall H., Giegling I. et al. (2011) Candidate gene analysis of the human natural killer-1 carbohydrate pathway and perineuronal nets in schizophrenia: B3GAT2 is associated with disease risk and cortical surface area. Biol. Psychiatry, 69, 90–96. [DOI] [PubMed] [Google Scholar]
- 60. Nord A.S. and West A.E. (2019) Neurobiological functions of transcriptional enhancers. Nat. Neurosci., 23, 5–14. [DOI] [PMC free article] [PubMed] [Google Scholar]
- 61. Heinz S., Romanoski C.E., Benner C. and Glass C.K. (2015) The selection and function of cell type-specific enhancers. Nat. Rev. Mol. Cell Biol., 16, 144–154. [DOI] [PMC free article] [PubMed] [Google Scholar]
- 62. Bailey T.L., Boden M., Buske F.A., Frith M., Grant C.E., Clementi L., Ren J., Li W.W. and Noble W.S. (2009) MEME SUITE: tools for motif discovery and searching. Nucleic Acids Res., 37, W202–W208. [DOI] [PMC free article] [PubMed] [Google Scholar]
- 63. Mahony S. and Benos P.V. (2007) STAMP: a web tool for exploring DNA-binding motif similarities. Nucleic Acids Res., 35, W253–W258. [DOI] [PMC free article] [PubMed] [Google Scholar]
- 64. Sousa V.H., Miyoshi G., Hjerling-Leffler J., Karayannis T. and Fishell G. (2009) Characterization of Nkx6-2-derived neocortical interneuron lineages. Cereb. Cortex, 19(Suppl 1), i1–i10. [DOI] [PMC free article] [PubMed] [Google Scholar]
- 65. Pieper A., Rudolph S., Wieser G.L., Gotze T., Miessner H., Yonemasu T., Yan K., Tzvetanova I., Castillo B.D., Bode U. et al. (2019) NeuroD2 controls inhibitory circuit formation in the molecular layer of the cerebellum. Sci. Rep., 9, 1448. [DOI] [PMC free article] [PubMed] [Google Scholar]
- 66. Skinner M.K., Rawls A., Wilson-Rawls J. and Roalson E.H. (2010) Basic helix-loop-helix transcription factor gene family phylogenetics and nomenclature. Differentiation, 80, 1–8. [DOI] [PMC free article] [PubMed] [Google Scholar]
- 67. Parras C.M., Schuurmans C., Scardigli R., Kim J., Anderson D.J. and Guillemot F. (2002) Divergent functions of the proneural genes Mash1 and Ngn2 in the specification of neuronal subtype identity. Genes Dev., 16, 324–338. [DOI] [PMC free article] [PubMed] [Google Scholar]
- 68. Chan C.H., Godinho L.N., Thomaidou D., Tan S.S., Gulisano M. and Parnavelas J.G. (2001) Emx1 is a marker for pyramidal neurons of the cerebral cortex. Cereb. Cortex, 11, 1191–1198. [DOI] [PubMed] [Google Scholar]
- 69. Davenne M., Maconochie M.K., Neun R., Pattyn A., Chambon P., Krumlauf R. and Rijli F.M. (1999) Hoxa2 and Hoxb2 control dorsoventral patterns of neuronal development in the rostral hindbrain. Neuron, 22, 677–691. [DOI] [PubMed] [Google Scholar]
- 70. Aksoy I., Giudice V., Delahaye E., Wianny F., Aubry M., Mure M., Chen J., Jauch R., Bogu G.K., Nolden T. et al. (2014) Klf4 and Klf5 differentially inhibit mesoderm and endoderm differentiation in embryonic stem cells. Nat. Commun., 5, 3719. [DOI] [PubMed] [Google Scholar]
- 71. Moore D.L., Apara A. and Goldberg J.L. (2011) Krüppel-like transcription factors in the nervous system: novel players in neurite outgrowth and axon regeneration. Mol. Cell. Neurosci., 47, 233–243. [DOI] [PMC free article] [PubMed] [Google Scholar]
- 72. Dong J.-T. and Chen C. (2009) Essential role of KLF5 transcription factor in cell proliferation and differentiation and its implications for human diseases. Cell. Mol. Life Sci., 66, 2691–2706. [DOI] [PMC free article] [PubMed] [Google Scholar]
- 73. Zhang S. and Cui W. (2014) Sox2, a key factor in the regulation of pluripotency and neural differentiation. World J. Stem Cells, 6, 305–311. [DOI] [PMC free article] [PubMed] [Google Scholar]
- 74. Pieraccioli M., Nicolai S., Pitolli C., Agostini M., Antonov A., Malewicz M., Knight R.A., Raschella G. and Melino G. (2018) ZNF281 inhibits neuronal differentiation and is a prognostic marker for neuroblastoma. Proc. Natl. Acad. Sci. U. S. A., 115, 7356–7361. [DOI] [PMC free article] [PubMed] [Google Scholar]
- 75. Liu N., Hargreaves V.V., Zhu Q., Kurland J.V., Hong J., Kim W., Sher F., Macias-Trevino C., Rogers J.M., Kurita R. et al. (2018) Direct promoter repression by BCL11A controls the fetal to adult hemoglobin switch. Cell, 173, 430–442e417. [DOI] [PMC free article] [PubMed] [Google Scholar]
- 76. Marsh B., Stevens S.L., Packard A.E.B., Gopalan B., Hunter B., Leung P.Y., Harrington C.A. and Stenzel-Poore M.P. (2009) Systemic lipopolysaccharide protects the brain from ischemic injury by reprogramming the response of the brain to stroke: a critical role for IRF3. J. Neurosci., 29, 9839–9849. [DOI] [PMC free article] [PubMed] [Google Scholar]
- 77. Zhang S., Moy W., Zhang H., Leites C., McGowan H., Shi J., Sanders A.R., Pang Z.P., Gejman P.V. and Duan J. (2018) Open chromatin dynamics reveals stage-specific transcriptional networks in hiPSC-based neurodevelopmental model. Stem Cell Res., 29, 88–98. [DOI] [PMC free article] [PubMed] [Google Scholar]
- 78. Ripke S., Neale B.M., Corvin A., Walters J.T.R., Farh K.-H., Holmans P.A., Lee P., Bulik-Sullivan B., Collier D.A., Huang H. et al. (2014) Biological insights from 108 schizophrenia-associated genetic loci. Nature, 511, 421–427. [DOI] [PMC free article] [PubMed] [Google Scholar]
- 79. Kikuchi M., Hara N., Hasegawa M., Miyashita A., Kuwano R., Ikeuchi T. and Nakaya A. (2019) Enhancer variants associated with Alzheimer’s disease affect gene expression via chromatin looping. BMC Med. Genet., 12, 128. [DOI] [PMC free article] [PubMed] [Google Scholar]
- 80. Huo Y., Li S., Liu J., Li X. and Luo X.-J. (2019) Functional genomics reveal gene regulatory mechanisms underlying schizophrenia risk. Nat. Commun., 10, 670. [DOI] [PMC free article] [PubMed] [Google Scholar]
- 81. Harrington A.J., Raissi A., Rajkovich K., Berto S., Kumar J., Molinaro G., Raduazzo J., Guo Y., Loerwald K., Konopka G. et al. (2016) MEF2C regulates cortical inhibitory and excitatory synapses and behaviors relevant to neurodevelopmental disorders. elife, 5, e20059. [DOI] [PMC free article] [PubMed] [Google Scholar]
- 82. Mitchell A.C., Javidfar B., Pothula V., Ibi D., Shen E.Y., Peter C.J., Bicks L.K., Fehr T., Jiang Y., Brennand K.J. et al. (2018) MEF2C transcription factor is associated with the genetic and epigenetic risk architecture of schizophrenia and improves cognition in mice. Mol. Psychiatry, 23, 123–132. [DOI] [PMC free article] [PubMed] [Google Scholar]
- 83. Forrest M.P., Hill M.J., Kavanagh D.H., Tansey K.E., Waite A.J. and Blake D.J. (2018) The psychiatric risk gene transcription factor 4 (TCF4) regulates neurodevelopmental pathways associated with schizophrenia, autism, and intellectual disability. Schizophr. Bull., 44, 1100–1110. [DOI] [PMC free article] [PubMed] [Google Scholar]
- 84. Hill M.J., Forrest M.P., Martin-Rendon E. and Blake D.J. (2014) Association of Transcription Factor 4 (TCF4) variants with schizophrenia and intellectual disability. Curr. Behav. Neurosci. Rep., 1, 206–214. [Google Scholar]
- 85. Doostparast Torshizi A., Armoskus C., Zhang H., Forrest M.P., Zhang S., Souaiaia T., Evgrafov O.V., Knowles J.A., Duan J. and Wang K. (2019) Deconvolution of transcriptional networks identifies TCF4 as a master regulator in schizophrenia. Sci. Adv., 5, eaau4139. [DOI] [PMC free article] [PubMed] [Google Scholar]
- 86. Sepp M., Kannike K., Eesmaa A., Urb M. and Timmusk T. (2011) Functional diversity of human basic helix-loop-helix transcription factor TCF4 isoforms generated by alternative 5′ exon usage and splicing. PLoS One, 6, e22138. [DOI] [PMC free article] [PubMed] [Google Scholar]
- 87. Barretto N., Zhang H., Powell S.K., Fernando M.B., Zhang S., Flaherty E.K., Ho S.M., Slesinger P.A., Duan J. and Brennand K.J. (2020) ASCL1- and DLX2-induced GABAergic neurons from hiPSC-derived NPCs. J. Neurosci. Methods, 334, 108548. [DOI] [PMC free article] [PubMed] [Google Scholar]
- 88. Chen Y., Xu B., Arderiu G., Hashimoto T., Young W.L., Boudreau N. and Yang G.Y. (2004) Retroviral delivery of homeobox D3 gene induces cerebral angiogenesis in mice. J. Cereb. Blood Flow Metab., 24, 1280–1287. [DOI] [PubMed] [Google Scholar]
- 89. Wiegreffe C., Simon R., Peschkes K., Kling C., Strehle M., Cheng J., Srivatsa S., Liu P., Jenkins N.A., Copeland N.G. et al. (2015) Bcl11a (Ctip1) controls migration of cortical projection neurons through regulation of <em>Sema3c</em>. Neuron, 87, 311–325. [DOI] [PubMed] [Google Scholar]
- 90. Dias C., Estruch S.B., Graham S.A., McRae J., Sawiak S.J., Hurst J.A., Joss S.K., Holder S.E., Morton J.E.V., Turner C. et al. (2016) BCL11A haploinsufficiency causes an intellectual disability syndrome and dysregulates transcription. Am. J. Hum. Genet., 99, 253–274. [DOI] [PMC free article] [PubMed] [Google Scholar]
- 91. Chen J., Cao H., Kaufmann T., Westlye L.T., Tost H., Meyer-Lindenberg A. and Schwarz E. (2020) Identification of reproducible BCL11A alterations in schizophrenia through individual-level prediction of coexpression. Schizophr. Bull., sbaa047. [DOI] [PMC free article] [PubMed] [Google Scholar]
- 92. Gorski J.A., Talley T., Qiu M., Puelles L., Rubenstein J.L.R. and Jones K.R. (2002) Cortical excitatory neurons and glia, but not GABAergic neurons, are produced in the Emx1-expressing lineage. J. Neurosci., 22, 6309–6314. [DOI] [PMC free article] [PubMed] [Google Scholar]
- 93. Stocker A.M. and O’Leary D.D.M. (2016) Emx1 is required for neocortical area patterning. PLoS One, 11, e0149900. [DOI] [PMC free article] [PubMed] [Google Scholar]
- 94. Roberts R.C., Barksdale K.A., Roche J.K. and Lahti A.C. (2015) Decreased synaptic and mitochondrial density in the postmortem anterior cingulate cortex in schizophrenia. Schizophr. Res., 168, 543–553. [DOI] [PMC free article] [PubMed] [Google Scholar]
- 95. Yoshikawa A., Nishimura F., Inai A., Eriguchi Y., Nishioka M., Takaya A., Tochigi M., Kawamura Y., Umekage T., Kato K. et al. (2018) Novel rare variations in genes that regulate developmental change in N-methyl-d-aspartate receptor in patients with schizophrenia. Hum. Genome Var., 5, 17056. [DOI] [PMC free article] [PubMed] [Google Scholar]
- 96. Gao K., Tankovic A., Zhang Y., Kusumoto H., Zhang J., Chen W., XiangWei W., Shaulsky G.H., Hu C., Traynelis S.F. et al. (2017) A de novo loss-of-function GRIN2A mutation associated with childhood focal epilepsy and acquired epileptic aphasia. PLoS One, 12, e0170818. [DOI] [PMC free article] [PubMed] [Google Scholar]
- 97. Gandal M.J., Zhang P., Hadjimichael E., Walker R.L., Chen C., Liu S., Won H., Bakel H., Varghese M., Wang Y. et al. (2018) Transcriptome-wide isoform-level dysregulation in ASD, schizophrenia, and bipolar disorder. Science, 362, eaat8127. [DOI] [PMC free article] [PubMed] [Google Scholar]
- 98. Wen Z., Nguyen H.N., Guo Z., Lalli M.A., Wang X., Su Y., Kim N.S., Yoon K.J., Shin J., Zhang C. et al. (2014) Synaptic dysregulation in a human iPS cell model of mental disorders. Nature, 515, 414–418. [DOI] [PMC free article] [PubMed] [Google Scholar]
- 99. Chiang C.H., Su Y., Wen Z., Yoritomo N., Ross C.A., Margolis R.L., Song H. and Ming G.L. (2011) Integration-free induced pluripotent stem cells derived from schizophrenia patients with a DISC1 mutation. Mol. Psychiatry, 16, 358–360. [DOI] [PMC free article] [PubMed] [Google Scholar]
- 100. Rueden C.T., Schindelin J., Hiner M.C., DeZonia B.E., Walter A.E., Arena E.T. and Eliceiri K.W. (2017) ImageJ2: ImageJ for the next generation of scientific image data. BMC Bioinformatics, 18, 529. [DOI] [PMC free article] [PubMed] [Google Scholar]
- 101. Bolger A.M., Lohse M. and Usadel B. (2014) Trimmomatic: a flexible trimmer for Illumina sequence data. Bioinformatics, 30, 2114–2120. [DOI] [PMC free article] [PubMed] [Google Scholar]
- 102. Trapnell C., Pachter L. and Salzberg S.L. (2009) TopHat: discovering splice junctions with RNA-Seq. Bioinformatics, 25, 1105–1111. [DOI] [PMC free article] [PubMed] [Google Scholar]
- 103. Haeussler M., Zweig A.S., Tyner C., Speir M.L., Rosenbloom K.R., Raney B.J., Lee C.M., Lee B.T., Hinrichs A.S., Gonzalez J.N. et al. (2019) The UCSC Genome Browser database: 2019 update. Nucleic Acids Res., 47, D853–d858. [DOI] [PMC free article] [PubMed] [Google Scholar]
- 104. Anders S., Pyl P.T. and Huber W. (2015) HTSeq--a python framework to work with high-throughput sequencing data. Bioinformatics, 31, 166–169. [DOI] [PMC free article] [PubMed] [Google Scholar]
- 105. Love M.I., Huber W. and Anders S. (2014) Moderated estimation of fold change and dispersion for RNA-seq data with DESeq2. Genome Biol., 15, 550. [DOI] [PMC free article] [PubMed] [Google Scholar]
- 106. Untergasser A., Cutcutache I., Koressaar T., Ye J., Faircloth B.C., Remm M. and Rozen S.G. (2012) Primer3--new capabilities and interfaces. Nucleic Acids Res., 40, e115. [DOI] [PMC free article] [PubMed] [Google Scholar]
- 107. Lamar T., Vanoye C.G., Calhoun J., Wong J.C., Dutton S.B.B., Jorge B.S., Velinov M., Escayg A. and Kearney J.A. (2017) SCN3A deficiency associated with increased seizure susceptibility. Neurobiol. Dis., 102, 38–48. [DOI] [PMC free article] [PubMed] [Google Scholar]
- 108. Pfaffl M.W. (2001) A new mathematical model for relative quantification in real-time RT-PCR. Nucleic Acids Res., 29, e45. [DOI] [PMC free article] [PubMed] [Google Scholar]
- 109. Guo M., Price M.J., Patterson D.G., Barwick B.G., Haines R.R., Kania A.K., Bradley J.E., Randall T.D., Boss J.M. and Scharer C.D. (2018) EZH2 represses the B cell transcriptional program and regulates antibody-secreting cell metabolism and antibody production. J. Immunol., 200, 1039–1052. [DOI] [PMC free article] [PubMed] [Google Scholar]
- 110. Martin M. (2011) Cutadapt removes adapter sequences from high-throughput sequencing reads. EMBnet J., 17, 3. [Google Scholar]
- 111. Langmead B. and Salzberg S.L. (2012) Fast gapped-read alignment with bowtie 2. Nat. Methods, 9, 357–359. [DOI] [PMC free article] [PubMed] [Google Scholar]
- 112. Scharer C.D., Blalock E.L., Barwick B.G., Haines R.R., Wei C., Sanz I. and Boss J.M. (2016) ATAC-seq on biobanked specimens defines a unique chromatin accessibility structure in naive SLE B cells. Sci. Rep., 6, 27030. [DOI] [PMC free article] [PubMed] [Google Scholar]
- 113. Heinz S., Benner C., Spann N., Bertolino E., Lin Y.C., Laslo P., Cheng J.X., Murre C., Singh H. and Glass C.K. (2010) Simple combinations of lineage-determining transcription factors prime cis-regulatory elements required for macrophage and B cell identities. Mol. Cell, 38, 576–589. [DOI] [PMC free article] [PubMed] [Google Scholar]
- 114. Yu G., Wang L.G. and He Q.Y. (2015) ChIPseeker: an R/Bioconductor package for ChIP peak annotation, comparison and visualization. Bioinformatics, 31, 2382–2383. [DOI] [PubMed] [Google Scholar]
- 115. Robinson M.D., McCarthy D.J. and Smyth G.K. (2010) edgeR: a Bioconductor package for differential expression analysis of digital gene expression data. Bioinformatics, 26, 139–140. [DOI] [PMC free article] [PubMed] [Google Scholar]
- 116. Gel B. and Serra E. (2017) karyoploteR: an R/Bioconductor package to plot customizable genomes displaying arbitrary data. Bioinformatics, 33, 3088–3090. [DOI] [PMC free article] [PubMed] [Google Scholar]
- 117. Lawrence M., Gentleman R. and Carey V. (2009) rtracklayer: an R package for interfacing with genome browsers. Bioinformatics, 25, 1841–1842. [DOI] [PMC free article] [PubMed] [Google Scholar]
- 118. Kulakovskiy I.V., Vorontsov I.E., Yevshin I.S., Sharipov R.N., Fedorova A.D., Rumynskiy E.I., Medvedeva Y.A., Magana-Mora A., Bajic V.B., Papatsenko D.A. et al. (2018) HOCOMOCO: towards a complete collection of transcription factor binding models for human and mouse via large-scale ChIP-Seq analysis. Nucleic Acids Res., 46, D252–d259. [DOI] [PMC free article] [PubMed] [Google Scholar]
- 119. Li Z., Schulz M.H., Look T., Begemann M., Zenke M. and Costa I.G. (2019) Identification of transcription factor binding sites using ATAC-seq. Genome Biol., 20, 45. [DOI] [PMC free article] [PubMed] [Google Scholar]
- 120. Archer J. and Robertson D.L. (2007) CTree: comparison of clusters between phylogenetic trees made easy. Bioinformatics, 23, 2952–2953. [DOI] [PubMed] [Google Scholar]
- 121. Quinlan A.R. and Hall I.M. (2010) BEDTools: a flexible suite of utilities for comparing genomic features. Bioinformatics, 26, 841–842. [DOI] [PMC free article] [PubMed] [Google Scholar]
- 122. Frasier C.R., Zhang H., Offord J., Dang L.T., Auerbach D.S., Shi H., Chen C., Goldman A.M., Eckhardt L.L., Bezzerides V.J. et al. (2018) Channelopathy as a SUDEP biomarker in Dravet syndrome patient-derived cardiac Myocytes. Stem Cell Rep., 11, 626–634. [DOI] [PMC free article] [PubMed] [Google Scholar]
Associated Data
This section collects any data citations, data availability statements, or supplementary materials included in this article.
Supplementary Materials
Data Availability Statement
All sequencing data are available under accession GSE145073 at the National Center for Biotechnology Information Gene Expression Omnibus (https://www.ncbi.nlm.nih.gov/geo/).