Figure 4.
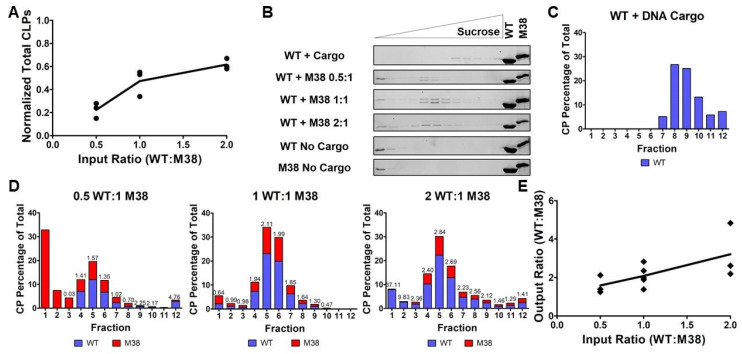
The amount of WT and M38 capsid proteins in the WT + M38 CLPs varies with input ratio. (A) As the input ratio of WT:M38 CP increases (by varying WT CP and keeping M38 constant), the number of CLPs formed increases, as determined by DLS. The line represents the mean of the three biological replicates (circles). The numbers are normalized according to Table 1. (B) The individual capsid proteins, WT + DNA cargo CLPs, and WT + M38 CLPs were separated over a sucrose gradient using ultracentrifugation. The gel for WT + DNA cargo CLPs is a representative gel of two biological replicates, and the gels for WT + M38 CLPs at all ratios are representative of at least three biological replicates. The control lanes contained 1.5 µg concentrated protein (gels 2 and 4, corresponding to ratios 0.5:1 and 2:1, respectively) or 3 µg concentrated protein (all other gels). (C,D) Quantification of protein signal from the gels in (B) using densitometry (WT CP in blue; M38 CP in red). Each graph represents an average of at least three biological replicates except WT CP + DNA cargo, which represents two replicates; each data point was normalized so that total protein signal in each graph would equal 100%. Above the bars is the ratio of WT:M38 CP in the fraction and is the average of at least three biological replicates. (E) As the input ratio increases, the output ratio of the assembled CLPs also increases in a linear fashion. The line represents the mean of the three-to-five biological replicates (diamonds). The output ratios plotted are for fraction 5, as determined in panel (D).

