Abstract
Commercial samples of strychnine sulfate were used as the starting material in crystallization experiments accompanied by stability studies. Eight hydrate forms (HyA–HyG), including five novel hydrates, were verified. The crystal structures of HyA (“pentahydrate”) and HyF (“hexahydrate”) were determined from single-crystal X-ray diffraction data. HyF was identified as the most stable hydrate at high water activities at room temperature (RT), and HyA and HyC were also found to be stable at ambient conditions. Long-time storage experiments over nearly two decades confirm that these three hydrates are stable at ambient conditions (20–60% relative humidity). The other five hydrates, HyB (“dihydrate”), HyD, HyE, HyG, and HyH, are only observable at the low(est) relative humidity (RH) levels at RT. Some of these latter forms can only exist within a very narrow RH range and are therefore intermediate phases. By applying a range of complementary experimental techniques such as gravimetric moisture sorption analysis, thermal analysis, moisture controlled PXRD measurements, and variable temperature IR spectroscopy in combination with principal component analysis, it was possible to identify the distinct hydrate phases and elucidate their stability and dehydration pathways. The observed (de)hydration routes, HyA ↔ HyB, HyC ↔ HyD ↔ HyE, HyF ↔ HyG ↔ HyH and HyF → HyA ↔ HyB, depended on the initial hydrate form, particle size, and atmospheric conditions. In addition, a transformation from HyC/HyA to HyF occurs at high RH values at RT. The specific moisture and temperature conditions of none of the applied drying regimes yielded a crystalline water-free form, which highlights the essential role of water molecules for the formation and stability of the crystalline strychnine sulfate phases.
Short abstract
The complex moisture- and temperature-dependent interconversion pathways and the stability of eight hydrate forms of strychnine sulfate were unraveled by a complementary approach comprising gravimetric moisture (de)sorption analysis, moisture controlled powder X-ray diffraction measurements, thermal analysis, and variable temperature infrared spectroscopy combined with multivariate data treatment. The study highlights the importance of high-resolution, moisture-dependent investigations for gaining insight into the structural reorganization and transient states of hydrates.
1. Introduction
In the last decades, research concerning the formation and properties of crystalline forms (polymorphism, hydrate, solvate formation, and cocrystals) has become a central topic in academia and industry. This is due to the increasing awareness that the control of the crystal form is crucial for the product quality in fine-chemical industries (pharmaceuticals, dyes, high energy and plant protection materials, etc.).1−4 A series of critical substance parameters are affected by this phenomenon such as bulk properties, solubility and dissolution rate, bioavailability, and chemical and physical stability.1,5−8 This is also true for hydrates, which can emerge during standard processing steps such as crystallization, lyophilization, wet granulation, aqueous film coating, etc.9−11 To obtain reliable results, the solid forms of a compound must be controlled, and to achieve this, full knowledge of the forms and their interrelationships is required.12−17 The discovery and characterization of different solid forms is very time-consuming and requires the development of suitable methods and novel strategies.18−20
An important aspect of polymorphs, hydrates, and solvates are solid-state transformations, induced by the variation of temperature, humidity (water activity), and pressure, which can occur during manufacturing processes21,22 or storage.23,24 The physical stability of crystalline hydrates is dependent on temperature as well as water vapor pressure.25 Water sorption of pharmaceuticals is considered as an important, sometimes even critical, factor that will affect the selection of the form (or salt) of a drug substance.26,27
Understanding the physical and chemical properties of each solid form enables the identification of the most suitable solid form in (drug) development. In a preformulation study, hydrate formation is routinely investigated by gravimetric moisture (de)sorption analysis.11 The decrease of void space, the increase of packing efficiency, and the formation of additional intermolecular interactions can be readily seen as driving forces for hydrate formation.28−31 On the basis of the hydration/dehydration mechanisms, the corresponding continuity/discontinuity of their sorption/desorption behavior, and structural changes, hydrates can be grouped into two classes, stoichiometric and nonstoichiometric hydrates. Stoichiometric hydrates differ fundamentally from all other solid form(s) in that their crystal structures have a well-defined water content. The mechanism of their dehydration usually involves a considerable rearrangement of host molecules. In contrast, nonstoichiometric hydrates show a continuous variation of their composition over a certain RH range without significant structural alterations, while the accommodation of water molecules in their (open) structural voids results in an anisotropic expansion of the host structure.32 Nonstoichiometric hydrates are generally problematic solid forms as the water is often weakly bound (“free” water) and may interact with other components, compromising the stability and performance of formulated products. There are also significant concerns over certain operations such as weighing for nonstoichiometric hydrates. Even though hydrates are usually among the first solid-state forms that are discovered in polymorph screens, a full understanding of their stability and interrelation pathways is rarely established.
Numerous methods for the determination of stability relationships between anhydrous forms and hydrates or lower and higher hydrates have been reported, including the investigation of water (de)sorption isotherms,4,10,33,34 isothermal dehydration,35−38 water activity in binary aqueous solutions,39−42 solubility as a function of temperature,43 and intrinsic dissolution rates.44 Furthermore, computational techniques have been employed to calculate the enthalpy difference between hydrates (or solvates in general) and water-free forms.45−47
A recent CSD analysis revealed that sulfate salts are prone to hydration, with 56.5% of the sulfate salts (C, H, N, O, and S atoms only) being hydrate structures. This was related to an imbalance in hydrogen bonding donor and acceptor groups of the salts. Furthermore, the analysis showed that sulfate salt hydrates exist mostly in higher hydration states than other hydrates of organic compounds.48 Therefore, we investigate the (de)hydration behavior of strychnine sulfate (Figure 1). Strychnine, the free base of the investigated compound, was first isolated in 1817 from St. Ignatus beans49,50 and occurs most abundantly in seeds of Strychnos nux-vomica. Seeds of S. nux-vomica, both in powdered form and as a tincture, were used to treat indigestion, chronic constipation, and, by virtue of their bitter taste, to stimulate the salivary glands and thereby increase appetite. Strychnine extracted from the seeds was also used as a bitter and as a tonic for the circulatory system. The alkaloid is a neurotoxin and acts as an antagonist of glycine and acetylcholine receptors. It primarily affects the motor nerve fibers in the spinal cord, which control the muscle contraction. Because of its chiral and alkaline properties, strychnine can be used to separate racemic mixtures of organic acids into their (+) and (−) forms.51
Figure 1.
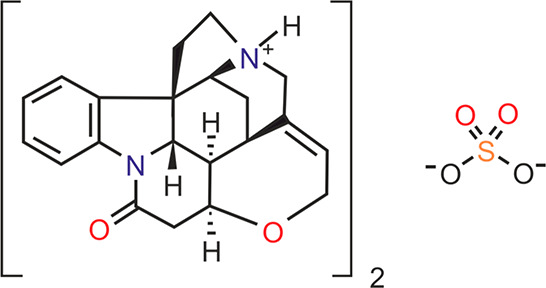
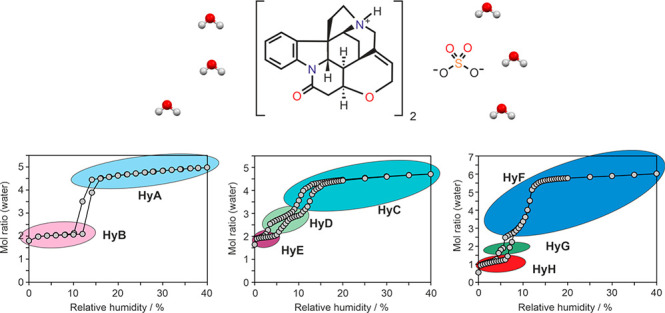
Molecular diagram of strychnine sulfate.
The earliest reports on solid forms of this compound date to Löwenstein in 1909,52 who described the preparation routes and moisture-dependent behavior of a penta- and hexahydrate and mentioned the existence of a dihydrate. The hexahydrate is described as releasing its water content continuously upon storage over a desiccant.52
Twenty years later, Schnellbach reported that the commercial product at that time consisted of a mixture of a penta- and a hexahydrate.53 Furthermore, the single crystal structure of strychnine sulfate pentahydrate has been determined in 1951 (non-hydrogen atom positions only).54 However, no comprehensive investigation covering the hydrates of strychnine sulfate has been undertaken since that time. The hydrate stoichiometries have been described for the bis-strychnine sulfate (Figure 1), and we decided to stick to the historical notation.
This work now seeks to unravel the hydration states, structural features, and (de)hydration pathways of strychnine sulfate. To understand the interplay between its hydrated forms, a thorough investigation of the thermally and moisture induced dehydration behavior of the hydrates HyA, HyB, HyC, and HyF was undertaken, using a combination of moisture-dependent (gravimetric moisture (de)sorption analysis and variable humidity X-ray powder diffraction) and thermoanalytical techniques (hot-stage microscopy, thermogravimetric analysis, differential scanning calorimetry, and variable temperature IR spectroscopy). The structures of the “pentahydrate” HyA and “hexahydrate” HyF were (re)determined from single-crystal X-ray diffraction data. Insights into the interconversion pathways of the strychnine sulfate hydrates upon changes in relative humidity and temperature and into the structural role of water were gained only through the combination of complementary analytical techniques and careful control of the environmental conditions.
2. Materials and Methods
2.1. Preparation of Strychnine Sulfate Hydrates
HyA was produced by cooling a hot saturated solution of strychnine sulfate in water (saturated at approximately 90 °C) to 45 °C. Within a few hours, the solid form crystallized in the form of elongated prismatic crystals. The second hydrate, HyB, was prepared by storing HyA at a relative humidity ≤12%.
The starting material, as commercially obtained (Baker, Lot. 432926; Sigma, Lot 87H1042), consisted of HyC. Storing the latter hydrate phase at approximately 6% and 2% RH resulted in the formation of the hydrates HyD and HyE, respectively.
Slow evaporation of a RT saturated strychnine sulfate solution in water led to the formation of HyF. The hydrate crystals obtained in evaporation experiments exhibited different morphologies, i.e., octahedra, prisms with a square base, and needle-like crystals, but corresponded all to the same hydrate form. The hydrate forms HyG and HyH were obtained by storing HyF at approximately 5% and <5%, respectively.
2.2. Gravimetric Moisture Sorption/Desorption Analysis
Automated moisture (de)sorption studies were performed with the automatic multisample gravimetric moisture sorption analyser SPSX-10 μ (ProUmid, Ulm, D). The moisture sorption analyzer was calibrated with saturated salt solutions according to the suppliers’ recommendations. Approximately 80–300 mg of sample was used for each analysis.
The first measurement cycle was started at 40% with a desorption cycle (decreasing humidity) to 0%, followed by a sorption (increasing humidity) to 95% RH, a desorption cycle to 0% RH, and a final sorption step to 40% (one step). RH changes were set to 5%. The equilibrium conditions for each step were set to a mass constancy of ±0.015% over 40 min and a maximum time limit of 48 h.
The second measurement started at 43% RH with an initial stepwise desorption to 0%, followed by a sorption cycle back to 43%, with RH changes set to 2% (except for the steps 43% ↔ 40% RH).
The third measurement started at 40% RH and covered the RH range 40 ↔ 95% in 5% steps and the RH range 40 ↔ 0% in 0.5% steps. The equilibrium conditions for each step (second and third measurement) were set to a mass constancy of ±0.001% over 60 min and a maximum time limit of 48 h.
In addition, manual water desorption studies were performed for HyC and HyF over a desiccant (P2O5) at 25 °C. The loss of water as a function of time was determined gravimetrically55 with a below-weighting balance (AT 250 semimicro balance, Mettler Instruments AG, Greifensee, CH). The sample mass used in each of these studies was about 200 mg.
2.3. Powder X-ray Diffraction
PXRD patterns were obtained using an X’Pert PRO diffractometer (PANalytical, Almelo, NL) equipped with a θ/θ coupled goniometer in transmission geometry, programmable XYZ stage with a well plate holder, Cu–Kα1,2 radiation source, and solid state PIXcel detector. The patterns were recorded at a tube voltage of 40 kV and a tube current of 40 mA, applying a step size of 2θ = 0.013° with 200–600 s per step in the 2θ range between 2° and 40°. For nonambient RH measurements, a VGI stage (VGI 2000M, Middlesex, UK) was used.
The diffraction patterns of HyF, recorded at controlled humidity and temperature conditions, were indexed with DICVOL04, and the space group was determined based on a statistical assessment of systematic absences,56 as implemented in the DASH structure solution package.57 Pawley fits58 were performed with Topas Academic V5.59 The background was modeled with Chebyshev polynomials, and the modified Thompson-Cox-Hastings pseudo-Voigt function was used for peak shape fitting.
2.4. Single-Crystal X-ray Diffraction
Cooling crystallization experiments from water yielded HyA (45 °C) and HyF (25 °C). Intensity data were recorded at 173 K, using a Rigaku Oxford Diffraction CCD Gemini Ultra diffractometer and MoKα radiation (HyA; λ = 0.71073 Å) or CuKα radiation (HyF; λ = 1.54184 Å). The data were corrected for absorption effects using SADABS.60 The crystal structures were solved by Direct Methods with SHELXT61 and refined by full-matrix least-squares techniques using SHELXL.62 The positions of H atoms were identified from difference maps and included in the refinement using a riding model. All disorder components of sulfate anions were refined using distance restraints for chemically equivalent 1,1- and 1,2-distances. The H atoms of the disordered water molecules of HyA have not been determined. The H atoms of the water molecules O2W, O3W, and O4W of HyF have been determined, but not those of any of the other disordered water molecules.
2.4.1. HyA
C42H56.58N4O13.29S, 2(C21H23N2O2)+·SO42–·5.29(H2O), colorless plate, 0.30 × 0.26 × 0.05 mm, space group C2, monoclinic, a = 34.362(7) Å, b = 7.5218(15) Å, c = 7.7523(16) Å, β = 97.46(3)°, V = 1986.7(7) Å3, Z = 2, ρcalcd = 1.441 g·cm–3, T = 173 K, θ range 3.6–25.4°, 6054 reflections collected, 3160 independent reflections, Rint = 0.0323, 359 parameters, wR2 = 0.1322 (all data), R1 = 0.0512 [I > 2σ(I)], absolute structure Flack parameter 0.01(9).
2.4.2. HyF
C42H58N4O14S, 2(C21H23N2O2)+·SO42–·6(H2O), colorless plate, 0.25 × 0.25 × 0.07 mm, space group P43212, tetragonal, a = b = 7.71649(10) Å, c = 69.2558(16) Å, V = 4123.78(15) Å3, Z = 4, ρcalcd = 1.409 g·cm–3, T = 173 K, θ range 5.1–67.7°, 30 677 reflections collected, 3717 independent reflections, Rint = 0.0878, 323 parameters, wR2 = 0.2027 (all data), R1 = 0.0774 [I > 2σ(I)], absolute structure Flack parameter 0.079(19).
2.5. Crystal Packing Comparison
The program XPac(63) was used to compare the packing of strychnine moieties in HyA, HyF, and related crystal structures. For each structure, intermolecular geometrical parameters were calculated using an initial set comprising all 25 non-H atomic positions of an independent strychnine unit. Pairwise comparisons between crystal structures were carried out, and standard cutoff parameters were applied to identify cases of packing similarity. For occurrences of packing similarity, a dissimilarity index x was calculated in the previously described manner.64 These values are listed, together with relevant lattice parameters, in section 5 of the Supporting Information.
2.6. Thermal Analysis
For hot-stage thermomicroscopic (HSM) investigations a Reichert Thermovar polarization microscope, equipped with a Kofler hot-stage (Reichert, A), was used. Photographs were taken with an Olympus DP71 digital camera.
Differential scanning calorimetry (DSC) thermograms were recorded on a DSC 7 (PerkinElmer Norwalk, Ct., USA) and Diamond DSC controlled by the Pyris software. Using a UM3 ultramicrobalance (Mettler, Greifensee, CH), samples of approximately 3–10 mg were weighed into perforated aluminum pans or high pressure capsules. The samples were heated using rates of 1, 2, 5 (perforated), and 10 (high pressure capsules) °C min–1 with dry nitrogen as the purge gas (purge: 20 mL min–1). The instruments were calibrated for temperature with pure benzophenone (mp 48.0 °C) and caffeine (236.2 °C), and the energy calibration was performed with indium (mp 156.6 °C, heat of fusion 28.45 J g–1).
Thermogravimetric analysis (TGA) was carried out with a TGA7 system (PerkinElmer, Norwalk, CT, USA) using the Pyris 2.0 Software. Approximately 5–8 mg of sample was weighed into a platinum pan. Two-point calibration of the temperature was performed with ferromagnetic materials (Alumel and Ni, Curie-point standards, PerkinElmer). A heating rate of 2, 5, or 10 °C min–1 was applied, and dry nitrogen was used as a purge gas (sample purge: 20 mL min–1, balance purge: 40 mL min–1).
2.7. Karl Fischer Titration
Coulometic water determinations were performed using a Karl Fischer-Titrator C20 (Mettler Toledo, Vienna, AT) and commercially available pyridine-free reagents.
2.8. Infrared Spectroscopy and Principal Component Analysis (PCA)
Infrared spectra were recorded with a temperature-controlled diamond ATR (PIKE GaldiATR, Madison, US) crystal on a Bruker Vertex 70 FTIR spectrometer (Bruker Analytische Messtechnik GmbH, Germany). The spectra were recorded between 4000 and 400 cm–1 at an instrument resolution of 2 cm–1 (16 scans per spectrum).
Principle component analysis (PCA), a multivariate data treatment to reduce the number of variables and provide a representation of the spectra in low dimensional space,65−67 was used to interpret changes in the IR spectra of strychnine sulfate hydrates during heating (dehydration). Spectra were preprocessed using min-max normalization and the first derivatives were calculated using Simca-P (Version 11.0, Umetrics AB, Umeå, Sweden). The spectral region of 1720 to 400 cm–1 was used for constructing the PCA models.
3. Results and Discussion
3.1. Crystal Structures of the Hydrates HyA and HyF
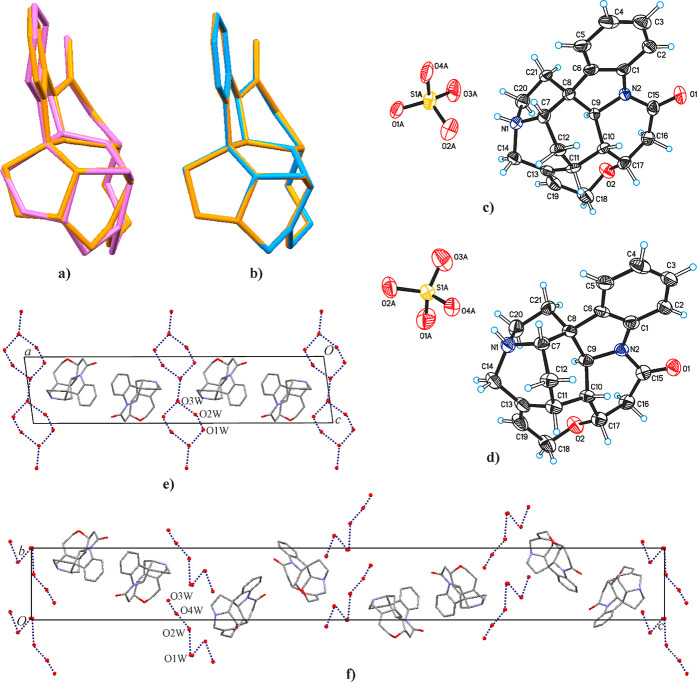
HyA has the space group symmetry C2, and its asymmetric unit contains one-half of a formula unit, i.e., one strychninium cation (Figure 2c), one-half of an SO42– anion, two split water positions (O2W/O2W′ and O3W/O3W′; occupancy ratios 0.64:0.36 and 0.53:0.47), and one partially (64%) occupied water position (O1W; concomitant with the occupation of the O2W site), giving a composition of 2(C21H23N2O2)+·SO42–·5.28(H2O). The anion is disordered over four orientations. Two of these are related by a rotation with the central S atom being located on a crystallographic 2-fold axis (fragment A; occupancy 0.25). The symmetry relationship between the remaining two SO42– orientations is also a 2-fold rotation, albeit with all atoms in general position (fragment B; occupancy 0.25). Given the fact that the geometry of the cation is expected to be rigid, a surprisingly high root-mean-square deviation (rmsd1) of 0.214 Å is obtained for the overlay of the HyA cation geometry determined in the present study onto the parameters from an earlier determination54 of the HyA structure (all 25 non-H atoms fitted; Figure 2a). These discrepancies may be explained by differences in data quality between the two studies. By contrast, the cation geometries for HyA and HyF, both determined in our study, agree very well with one another (rmsd1 = 0.027 Å; Figure 2b). As expected, the N1 site of the strychninium cation is protonated and engaged in an N–H···O interaction with a neighboring anion. The water molecules form a chain structure that propagates parallel to the a axis (Figure 2e). Additionally, they are H-bonded to the disordered sulfate ions.
Figure 2.
Overlay of the strychninium cation geometry of HyA determined in the present study (orange) with the corresponding geometry (a) as reported in ref (54) (pink; note the nonplanar benzene ring), revealing unexpectedly large differences, and (b) of HyF (blue). Molecular structures of (c) HyA and (d) HyF with thermal displacement ellipsoids drawn at the 50% level. The SO42– anion is represented by a single disorder fragment, and water molecules are omitted for clarity. Alternating packing of double layers composed of strychninium cations and layers of water molecules in the crystal structures of (e) HyA and (f) HyF (each viewed along a; only one disorder fragment of the water molecules shown; disordered SO42– anions and H atoms omitted for clarity; dashed lines indicate H-bonding between water molecules).
HyF crystallizes in the tetragonal space group P43212. Its asymmetric unit contains one-half of a formula unit, i.e., one strychninium cation (Figure 2d), one-half of an SO42– anion, and four partially occupied or split water positions, resulting in an overall composition of 2(C21H23N2O2)+·SO42–·6(H2O). The anion and one water molecule (O1W) are both located in a special position on a 2-fold axis. A second water site (O2W) in a general position is 50% occupied, and the occupancy of each of another two water molecules is equally split over two positions. This structure model implies the presence of two alternative disorder fragments, i.e., O3W+O4W versus O3W′+O4W′. An N–H···O interaction via the protonated N1 site connects each strychninium moiety with an anion. The water molecules are linked by hydrogen bonds into finite chains (Figure 2f), and H-bonds connect the disordered water molecules with the disordered sulfate anion.
A comparison of the packing of strychninium units in HyA and HyF with the program XPac(63,64) reveals a close 2D relationship, namely, that both structures contain the same double layer of cations as their essential building block. Individual double layers display a 21 screw symmetry and lie parallel to the ac plane in HyA or parallel to the ab plane in HyF, and two consecutive strychninium double layers in the crystal structure are separated from one another by a water/anion layer (Figure 2e,f). In the structure of HyA, neighboring strychninium double layers are related to one another by a 180° rotation, with the rotation axis being parallel to the crystallographic a axis (i.e., a direction in the layer plane) and located at the center of the separating interlayer. By contrast, the corresponding relationship in HyF is a 43 screw operation perpendicular to the plane of strychninium units (see Figure 3a,b).
Figure 3.
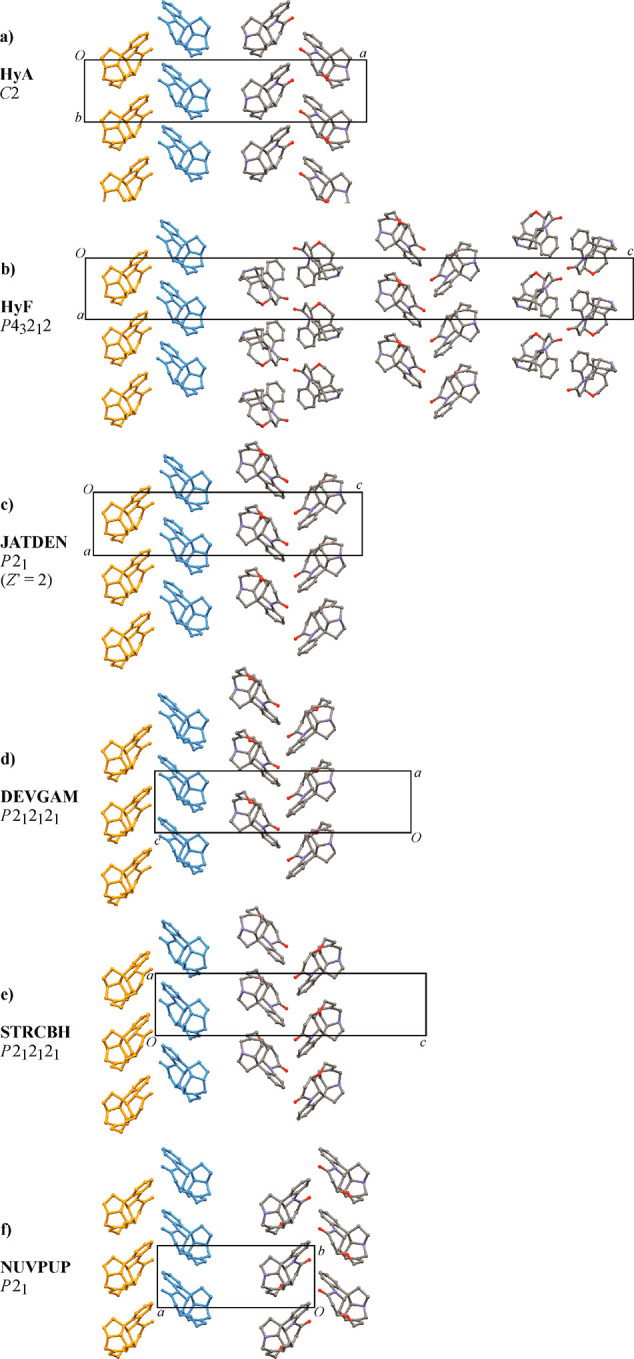
Packing of strychninium cations in the crystals of (a) HyA and (b) HyF. To emphasize the close 2D packing similarity, a single double layer (consisting of orange and blue subunits related by 21 symmetry) is highlighted in each diagram (water molecules and anions filling the space between two consecutive double layer units are omitted for clarity). (c–f) Corresponding diagrams for strychninium structures displaying the same 2D packing characteristic as HyA and HyF.
In a second step, the XPac comparison was extended to include all relevant entries in the Cambridge Structural Database68 (CSD; version 5.41, November 2019) relating to the strychnine molecule or its cation. It was found that the strychninium double layer of HyA and HyF is also present in the structures of the corresponding nitrate (CSD refcode DEVGAM), hydrochloride sesquihydrate69 (JATDEN), hydrobromide dihydrate70 (STRCBH) and S-(+)-bromochlorofluoroacetate71 (NUVPUP); see Figure 3a–f. Additionally, a particular 1D subunit composed of strychninium cations related by a translation along the a axis of either HyA or HyF is also present in the related N-benzoyl-l-alanine dihydrate72 (CUXKIP10). The crystal structure of strychnine73 (ZZZUEE02) does not display any significant packing similarity with either HyA or HyF. Figure 4 shows a cluster composed of a central cation and its 10 closest neighbors, which represents the essential unit of the double layer packing in HyA, HyF, and the other strychninium salts mentioned above (Figure 3). The interactions within this cluster, i.e., the cation intralayer interactions, involve complementary molecular surfaces with a single short contact C16–H16A···O1 (HyA: −x + 3/2, y + 1/2, −z + 2; H···O = 2.32 Å and HyF: −x + 1/2, y + 1/2, −z + 7/4; H···O = 2.37 Å).
Figure 4.
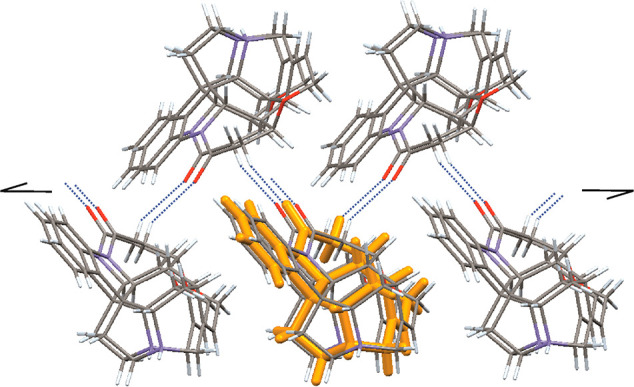
Essential unit of the double layer structure composed of strychninium cations in HyA, HyF, and related salts: cluster comprising a central cation (orange) and its 10 closest neighbors. The molecules in the upper and lower rows are related by a 21 screw operation. Dashed lines indicate short intermolecular C16–H16A···O1 contacts.
3.2. Moisture-Dependent Strychnine Sulfate (De)hydration Reactions
The moisture dependent (de)sorption behavior of HyA, HyC, and HyF was investigated with gravimetric vapor sorption analysis and moisture controlled PXRD measurements and resulted in new hydrate forms of the compound.
3.2.1. Hydrates A and B
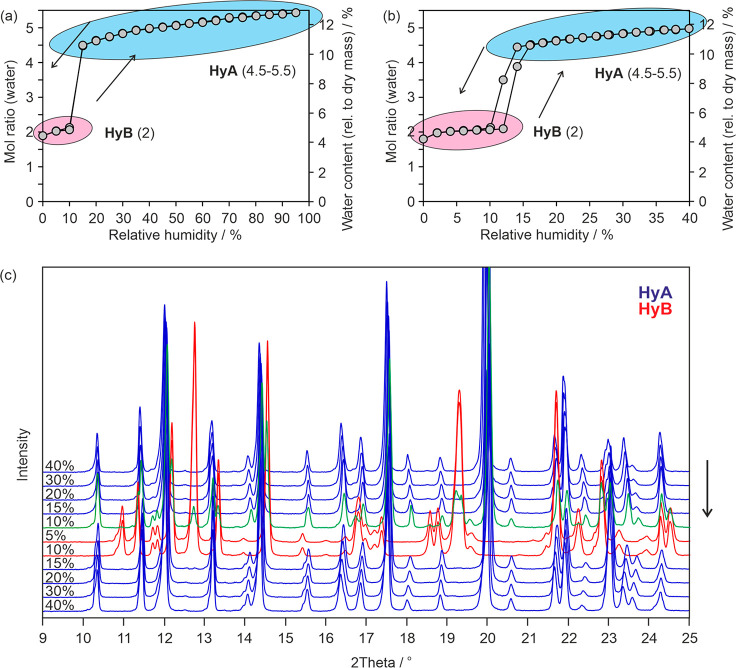
Starting from HyA and 95% RH, a continuous mass loss is observed upon decreasing the RH to 14%, i.e., from 5.4 mol of water per mole strychnine sulfate to 4.5 mol of water (Figure 5a). Upon further decreasing the RH, a step characteristic for a phase change to a structurally different hydrate is visible at an RH of 10%, resulting in a hydrate with a water/strychnine sulfate ratio of approximately 2:1. The sorption curve indicates that the dehydration process is reversible upon increasing the RH. To specify the transition point between the two hydrate phases seen in Figure 5a, a moisture (de)sorption isotherm with a higher resolution was recorded in the RH range ∼0 to 40% (Figure 5b). This second measurement revealed that the dehydration occurs already at 12% RH. The transformation to the dihydrate (HyB) at this humidity level is not completed within the set time limit of 48 h due to the slow transition rate close to the equilibrium condition. The same is also true for the HyB to HyA transition at 14% RH in the sorption cycle. Thus, the transition point (critical water activity) between the HyA/HyB pair lies at approximately 13%. The hysteresis of the reversible transition is strikingly small (<2% RH), which suggests that the kinetic barrier of the structural reorganization is low.
Figure 5.
(a, b) Gravimetric moisture (de)sorption isotherms starting from strychnine sulfate HyA at 25 °C. Arrows indicate the direction, i.e., sorption or desorption; numbers in parentheses indicate the moles of water per mole strychnine sulfate at each hydration state. (c) Variable humidity PXRD experiments following the reversible HyA ↔ HyB transformation at 25 °C. The arrow indicates the start and direction of the (de)sorption.
RH controlled PXRD measurements were performed to prove that HyA and HyB are structurally distinct hydrates and that the variable water content of HyA at RH values >13% is not connected with significant structural changes. The PXRD data were recorded every 5% upon decreasing and increasing the RH (Figure 5c). As expected, hardly any changes in the diffraction patterns of HyA are visible between 95% and 15% RH, apart from small peak shifts to higher 2θ angles. These peak shifts can be related to small changes in unit cell parameters due to the loss of approximately one mole of water per mole strychnine sulfate. Thus, the PXRD measurements confirm that HyA is a nonstoichiometric hydrate with a molar water ratio that varies between 5.5 and 4.5. Decreasing the RH to 10% resulted in the appearance of new diffraction peaks, and simultaneously the intensity of the HyA peaks decreases. At 5% RH only peaks of HyB are visible. These are clear indications for a phase change and unequivocally confirm that HyA and HyB are different solid forms. The HyB peak positions do not strikingly vary with changing RH, albeit the gravimetric measurements illustrated in Figure 5b show that the water content is not quite constant between 2 and 12% RH. This variation ranges from 2.0 to 2.1 mol-equivalents of water, and HyB can be readily designated as a dihydrate.
At driest conditions (<0.5% RH), a further mass decrease below the dihydrate level is observed, which is accompanied by a loss in crystallinity as indicated by PXRD. The total removal of water does not result in a lower hydrate but in a structural collapse, as is also seen for the chemically related compound brucine sulfate.48
3.2.2. Hydrates C, D, and E
At 43% RH, HyC (commercial sample) shows a water content of 4.7 mol per mole strychnine sulfate, as determined using Coulometric Karl Fischer titration. The desorption isotherm shows, similar to HyA, a nearly linear and continuous mass loss between 95% and 15% RH (Figure 6a), corresponding to approximately one molecule of water per mole strychnine sulfate. Upon decreasing the RH to approximately 0%, the water ratio drops to slightly below two moles of water per mole strychnine sulfate. The sorption/desorption isotherm recorded with a resolution of 5% RH (Figure 6a) does not give a clear picture of the behavior of HyC at RH values below 15%. Therefore, repeated measurements with smaller RH steps were performed. The isotherm recorded with a resolution of 2% RH (Figure 6b,c) clearly shows two steps, one slightly below a water ratio of three moles and another at a ratio of two moles. This indicates that HyC dehydrates via an intermediate HyD phase to a lower hydrate, named HyE. From the course of the highly reversible isotherm, it can also be concluded that the lowest hydrate (HyE) must be distinct to HyB, and therefore both are dihydrates. Moreover, the comparison of the isotherms of the two hydrates (HyA and HyC) also shows that the maximum water content of HyA is slightly higher than that of HyC.
Figure 6.
(a–c) Gravimetric moisture (de)sorption isotherms starting from strychnine sulfate HyC at 25 °C. Arrows indicate the direction, i.e., sorption or desorption and numbers in parentheses state the moles of water per mole strychnine sulfate at each hydration state. (d) Variable humidity PXRD experiments following the reversible HyC ↔ HyD ↔ HyE transformations at 25 °C. Note that the transition to HyE was not completed in (d). The arrow indicates the start and direction of the (de)sorption. The two measurements at 10% RH in (d) were taken at different time points (after 2 and 12 h).
To strengthen the conclusions drawn from the gravimetric moisture (de)sorption experiments, PXRD data were recorded at different RH conditions. Between 90 and 10% RH, the pattern of HyC shows only anisotropic shifts due to the variable water content but no indication for a change in the crystal phase, just as observed for HyA. New diffraction peaks emerged (Figure 6c) upon further decreasing the RH from 10 to 8%, and at 6% RH the phase transformation of HyC to HyD is complete. The two hydrates bear a strong structural resemblance, which is indicated by the similarity of their diffraction patterns. Because of the fast transformation kinetics between the two hydrates, it is possible to derive the critical water activity between HyC/HyD from the dynamic (de)sorption measurements to be ∼0.11 (∼11% RH).
The HyD ↔ HyE transformation could also be recorded using PXRD, albeit the transformation did not finish within 2 days (longer equilibration times would have been necessary). The discrepancy between the gravimetric moisture desorption and the RH controlled PXRD measurements can be related to different experimental setups. The similarity of their powder patterns suggests that the structures of HyE, HyD, and HyC are closely related to one another. Two of the hydrates, HyC and HyD, also show RH-dependent peak shifts within their existence range, due to slight variations of the water content. The emergence of additional peaks in the PXRD pattern upon changing the RH and the course of the (high resolution) gravimetric moisture sorption/desorption isotherm confirm that HyC dehydrates reversibly to two additional hydrates phases (HyD and HyE) whose diffraction patterns are clearly distinct from that of HyB (Figure 7).
Figure 7.
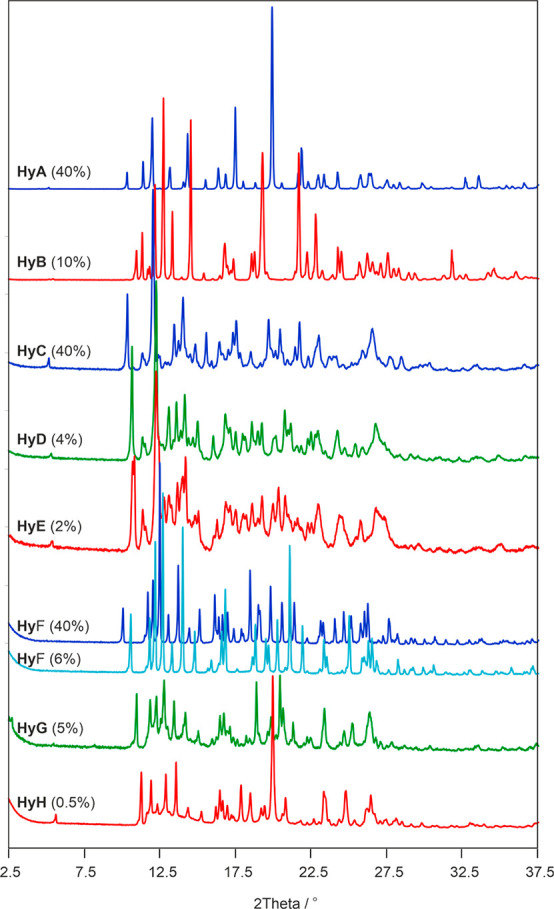
PXRD comparison of strychnine sulfate hydrates. Numbers in parentheses correspond to the RH at which the data were recorded.
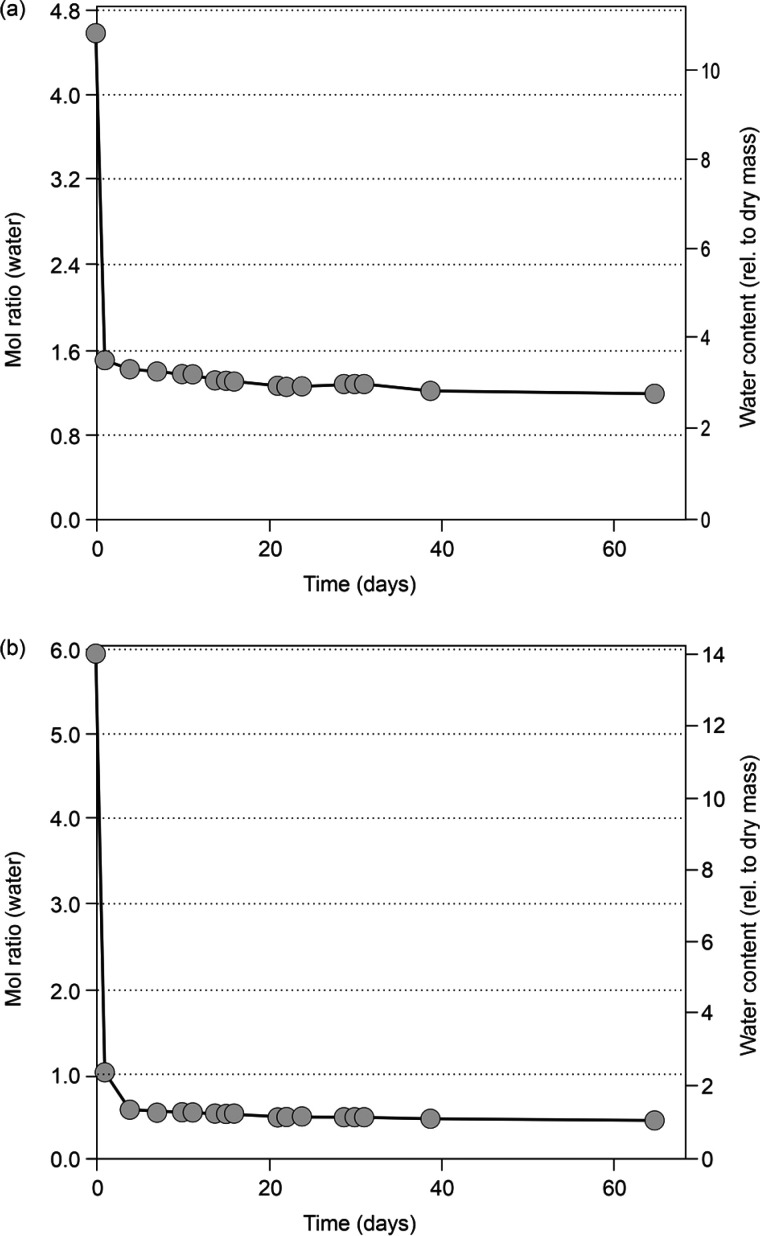
Long-time storage experiments of HyC were performed over a desiccant (P2O5) at 25 °C to test whether it is possible to remove the hydration water completely. Within 1 day, more than three moles of hydrate water had been removed from HyC (Figure 8a), still leaving ca. 1.55 mol of water per mole strychnine sulfate in the crystal. Within 60 days, the ratio drops to 1.2 mol of water, indicating that at RT even the driest conditions do not produce water free strychnine sulfate.
Figure 8.
Dehydration kinetics of the strychnine sulfates HyC (a) and HyF (b) at ∼0% RH (over P2O5) and 25 °C, monitored for 63 days.
3.2.3. Hydrates F, G, and H
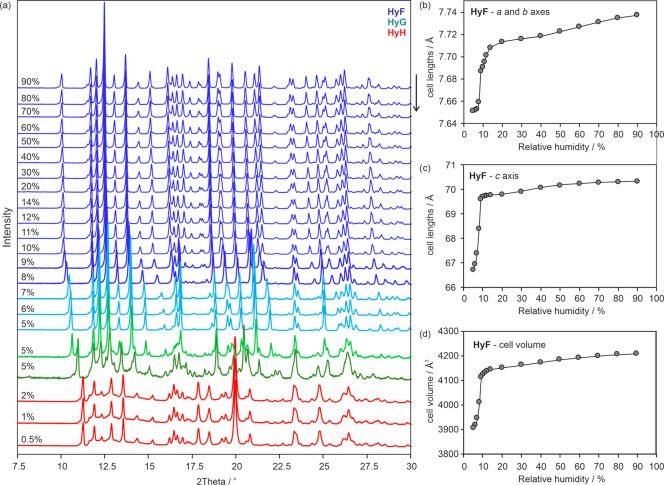
The third strychnine sulfate hydrate used as a starting material for gravimetric (de)sorption studies (HyF) shows again an almost linear weight loss upon decreasing the RH from 95 to 15% (Figure 9a), corresponding to the loss of approximately one mole-equivalent of water (6.5 to 5.5 mol of water per mole strychnine sulfate). Upon further decreasing the RH, a steep mass loss was recorded, resulting in <1 mol-equivalent of water. The sorption and desorption curves are superimposable, and the (de)hydration kinetics is fast. The data displayed in Figure 9a indicate a nonstoichiometric dehydration behavior similar to that observed for the brucine hydrate HyA.30 The data for HyF recorded in this study differ from the manually measured data by Löwenstein published in 1910, who described a continuous water (de)sorption in the entire RH range starting form 0% to 90% RH, with a strong increase/decrease in mass at an RH above 55% RH.52 To confirm a nonstoichiometric dehydration behavior, the measurement was repeated using a smaller step size in the low RH range (Figure 9b,c), leading to higher resolved moisture (de)sorption data. The better resolved isotherm now reveals a clear step between 8 and 4% RH with a hysteresis between the sorption and the desorption isotherm, which contradicts a nonstoichiometric dehydration behavior32 at low RH values. On the basis of Figure 9b, it can be assumed that another hydrate phase is formed at a RH < 5%. Surprisingly, by reducing the RH step size further from 2 to 0.5% and by carefully analyzing the (de)sorption data points, in particular whether the data points were in equilibrium, yet another intermediate strychnine sulfate hydrate could be identified (Figure 9c). Thus, HyF dehydrates via HyG to HyH.
Figure 9.
(a–c) Gravimetric moisture (de)sorption isotherms starting from strychnine sulfate HyF. Arrows indicate the direction, i.e., sorption or desorption; numbers in parentheses indicate the moles of water per mol of strychnine sulfate at each hydration state. (d) Variable humidity PXRD experiments following the reversible HyF ↔ HyG ↔ HyH transformations at 25 °C. The arrow indicates the start and direction of the (de)sorption.
Figure 9d displays the variable humidity PXRD measurements starting from HyF in the RH range from 8 to 1.5%, where phase changes had been monitored in the gravimetric (de)sorption experiments. In the RH range from 6 to 5%, new peak positions appear (HyG). The similarity between the PXRD data suggests a structural resemblance between HyF and HyG. Changing the RH from 5 to 3% results in the emergence of new (HyH) reflections and simultaneously the disappearance of a characteristic HyG reflection positions (2θ value of 11°). The observation that peak positions of both hydrates coexist and changes in intensity are seen if the sample is kept at 3% RH (desorption) or 6% RH (sorption) indicates that a phase change takes place. The PXRD data of HyH and HyG and HyF bear a very strong resemblance to each other, which implies that these phases are structurally similar. Likewise, small structural changes that are associated with a phase transition are also known to occur upon the dehydration of morphine HCl trihydrate to its dihydrate.74
The structural changes seen in the PXRD measurements agree well with the mass loss/gain steps seen in the (de)sorption experiments (Figure 9c). HyH exists only at lowest RH values (<5%), HyG shows a very narrow existence range (5–6% RH), while HyF is formed at RH values of 7% and above.
A more detailed PXRD study of HyF was undertaken to investigate the RH range from 90% to ∼5% (Figure 10a). The substantial changes in peak positions seen upon decreasing the RH might (wrongly) suggest an additional phase change. Therefore, the PXRD patterns were indexed, and Pawley75 fitting was performed to test whether a possible phase change exists or not (see section 2 of the Supporting Information). The plot of unit cell volume against RH (Figure 10d) mirrors more or less the course of the gravimetric moisture (de)sorption isotherm of HyF. Figure 10b,c illustrates that from 90% to about 40% RH the anisotropic changes of the equivalent unit cell axes a and b are more pronounced than those of the c axis. Below 40% RH, including the RH range where most of the HyF water is released (Figure 9a–c), the dimension of the c axis is more affected than that of the a axes. A shortening of the a and b axes indicates an equivalent shrinking of each individual double layer unit in these two directions (Figure 2f and Figure 3b), whereas a shortened c axis indicates a reduced distance between adjacent double layer sheets and thereby a contraction of the channels containing the water molecules (see Supporting Information for a void analysis).
Figure 10.
(a) Moisture-dependent PXRD measurements of HyF/HyG/HyH. Numbers on the y axis indicate the moisture in % at which the powder pattern was recorded. (b–d) Moisture-dependent changes of the lattice parameters and cell volume of HyF on decreasing the RH from 90% to 5%. The arrow indicates the start and direction of the (de)sorption.
The PXRD pattern recorded at 5% (after the transformation occurred) could not be indexed using the HyF cell, allowing for anisotropic changes due to a smaller cell size, and thus affirming a change in the solid-state form (to HyG) at approximately 5% RH upon decreasing the RH.
Starting from HyF, it was possible to remove more water than from HyA and HyC. The HyF, which was stored for two months over P2O5 at RT, contained only 0.4 mol-equivalent of water (Figure 8b). Nevertheless, the sample clearly showed loss in crystallinity. Thus, it was not possible to remove the complete water at 25 °C from any of the hydrates.
To determine which of the hydrates has the highest stability in water, a mixture of HyA/HyC/HyF was stirred in water at 25 °C as well as 50 °C. HyF was identified as the stable form in both of the experiments. Furthermore, storing HyA/HyC at 97% RH (over a K2SO4 solution) at RT resulted in the transition to HyF after 1 week.
3.3. Temperature-Dependent Strychnine Sulfate Dehydration Reactions
Hot-stage microscopy, differential scanning calorimetry, thermogravimetric analysis, and IR spectroscopy were applied to investigate the temperature-dependent dehydration pathways of strychnine sulfate phases. The obtained results were contrasted to the already described moisture-dependent dehydration pathways.
3.3.1. Hydrates A and B
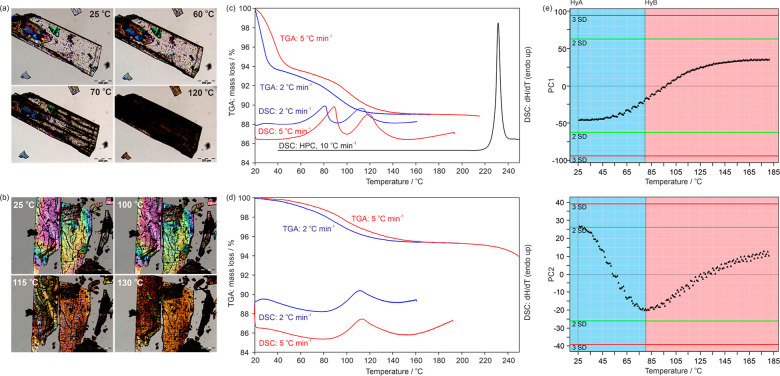
A preparation of HyA crystals, embedded into a high viscosity silicon oil, showed the formation of bubbles upon heating (see section 3 of the Supporting Information), which confirms that water vapor is released from the crystals. In a second experiment, HyA crystals were heated in a dry preparation (Figure 11a). The dehydration starts immediately upon heating, which is indicated by spots emerging at the surface of the crystals. These spots represent the nucleation centers of HyB, as confirmed with PXRD. At temperatures above 65 °C, the number of nucleation centers increases significantly, accompanied by a discoloration (orange-brownish). Starting from 170 °C, the sublimation of prismatic strychnine crystals was observed.
Figure 11.
Photomicrographs of heating experiments of the strychnine sulfates HyA (a) and HyB (b). DSC and TGA thermograms of HyA (c) and HyB (d). The TGA and DSC curves depicted in color were recorded in perforated DSC crucibles and in black using a high-pressure DSC capsule (HPC). (e) Plot of the first and second principal components (PC1 and PC2) derived from principal component analysis of the IR spectra recorded during heating HyA from 24 to 180 °C. Each data point corresponds to an IR spectrum.
The HSM investigations were repeated using HyB crystals as the starting material, which, in contrast to the HyA crystals, showed already cracks and fissures before the heating program started. The formation of bubbles was observed upon heating a preparation of HyB crystals embedded in high viscosity silicon oil (see section 3 of the Supporting Information). However, this occurred at a higher temperature than in the analogous experiment with HyA. The change in birefringence colors observed upon heating the crystals in a dry preparation (polarized light) is a clear indication for a phase change (Figure 11b).
The TGA curves of HyA (Figure 11c) reveal that the water molecules are released in a two-step process. The first step starts immediately upon exposing the hydrate to dry nitrogen purge and corresponds to the loss of approximately 3 mol of water per mole strychnine sulfate (Figure 11c). The first dehydration step is complete at 40 °C if a slow heating rate (2 °C min–1) is applied, yielding HyB, as confirmed with PXRD. The overall mass loss of the sample was determined to be 5.2 mol of water per mole of strychnine sulfate. The TGA curve of the HyB sample shows only a single mass-loss step, corresponding to 2 mol of water per mole strychnine sulfate (Figure 11d). The dehydration reaction was completed at temperatures ≥160 °C. An additional mass decrease occurs upon further heating (>200 °C), which corresponds to the loss of the anion (decomposition) and sublimation of strychnine.
The DSC thermograms recorded in perforated crucibles show the two-step dehydration process for HyA (Figure 11c). In agreement with the TGA results, only one dehydration step is seen for HyB (Figure 11d). At heating rates of 5–10 °C min–1, the maximum of the first dehydration peak (transition of HyA to HyB. Figure 11c) occurs between 80 and 90 °C, whereas the maximum rate of the dehydration process of HyB is observed between 115 and 120 °C. The DSC curve of HyA in a hermetically sealed (high pressure) crucible shows a pronounced dissociation peak (melting and decomposition) at 229 °C (Figure 11c). The dissociation of the hydrate and the decomposition of HyB occur similar to HyA at around 230 °C (derived from crystals embedded in high viscosity silicon oil).
Because of the high water affinity of strychnine sulfate, it was not possible to isolate and handle a water free form produced by thermal dehydration experiments. Furthermore, all samples that had been heated to 160 °C and above contained traces of strychnine free base.
IR spectroscopy was then used to follow the dehydration reaction of HyA upon heating. A heating rate of 2 °C min–1 was applied, and IR spectra were recorded at temperature intervals of 1 °C. The spectra were then subjected to PCA, and the computed first (PC1) and second principal components (PC2) are given in Figure 11e. The PC1, describing the highest data variability among the spectra, clearly reflects the loss of water. The PC2 provides insight into the structural changes seen upon dehydration. From 24 to 82 °C, the dehydration of HyA to HyB takes place. The inflection point indicates the formation of HyB. Upon further increasing the temperature, an amorphous or disordered strychnine sulfate phase (indicated by broader bands) and impurities of strychnine free base are formed. Thus, all investigated thermal and moisture induced dehydrations follow the same route: HyA → HyB → loss in crystallinity.
3.3.2. Hydrates C, D, and E
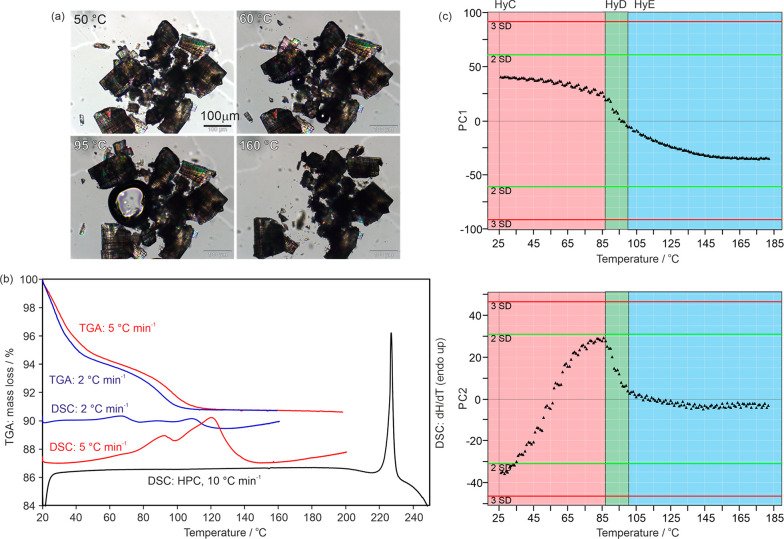
Heating experiments of HyC in silicon oil (HSM, Figure 12a) revealed bubble formation at temperatures above 60 °C. The dry preparation showed a clear pseudomorphosis of the crystals on heating, which confirms a significant structural reorganization of the lattice upon dehydration. The decomposition of the sulfate salt to strychnine and the sublimation of strychnine crystals were observed above ca. 170 °C.
Figure 12.
(a) Photomicrographs following the dehydration of the strychnine sulfate HyC (embedded into high viscosity silicon oil). (b) DSC and TGA thermograms of HyC. The TGA and DSC curves depicted in color were recorded in perforated DSC crucibles and in black using a high-pressure DSC capsule (HPC). (c) Plot of the first and second principal components (PC1 and PC2) from the principal component analysis of the IR spectra recorded during heating HyC from 24 to 180 °C. Each data point corresponds to an IR spectrum.
The TGA heating curve of HyC shows a two-step mass loss, with the first step starting immediately upon exposing the hydrate to dry N2 (Figure 12b). The overall mass loss was estimated to correspond to 4.4 mol of water per mole strychnine sulfate. Considering the moisture-dependent dehydration results, we can assume that the initial step of the TGA curve comprises the dehydration reactions of HyC to HyE, with HyD not being detectable as an intermediate step. The second step then corresponds to the loss of the remaining hydrate water. With heating rates of 2–5 °C min–1 and N2 purge, the dehydration of HyE was complete at approximately 110 °C. Similar to the dehydration experiments of HyA, it was not possible to further investigate the water free strychnine sulfate as water sorption occurred immediately and fast upon exposing the sample to ambient humidity conditions. The PXRD patterns recorded after thermal dehydration showed a low crystallinity compared to HyC, indicating that the dehydration results in a severely disordered phase. On the basis of the TGA curves, one might assume that the dehydration proceeds via a stoichiometric lower hydrate.
The DSC thermograms show three broad and overlapping dehydration steps, suggesting that the thermal- and moisture-dependent dehydration of HyC follows the route HyC → HyD → HyE. This assertion was also supported by stepwise dehydration experiments using TGA (heating rate of 2 °C min–1). Individual samples were heated to different end temperatures (40, 60, 90, and 100 °C) and then immediately placed between two mylar foils before the PXRD patterns were recorded. The sample, which was heated to 40 °C, yielded a mixture of hydrates HyC and HyD, the sample heated to 60 °C a mixture of HyD and HyE, and the experiments stopped at 90 and 100 °C yielded HyE (rehydrated). All samples retransformed into HyC upon storage at ambient conditions (25 °C and approximately 40% RH).
The DSC measurement of HyC in a hermetically sealed pan shows that this hydrate is very stable in the self-generated atmosphere (maximal water vapor pressure), as the dissociation peak occurs above 220 °C (Figure 12b).
Variable temperature IR spectroscopy, applied in the temperature range from 24 to 180 °C, combined with PCA (Figure 12c) confirmed the observations made by DSC. HyD is formed as an intermediate phase during the dehydration process of HyC to HyE. The PC1 describes the loss of water and PC2 and PC3 key structural changes observed upon dehydration. The first transition, HyC → HyD, is clearly visible in the PC2 plot, whereas the second phase change (HyD → HyE) is detectable in the PC3 plot (see section 4 of the Supporting Information).
3.3.3. Hydrates F, G, and H
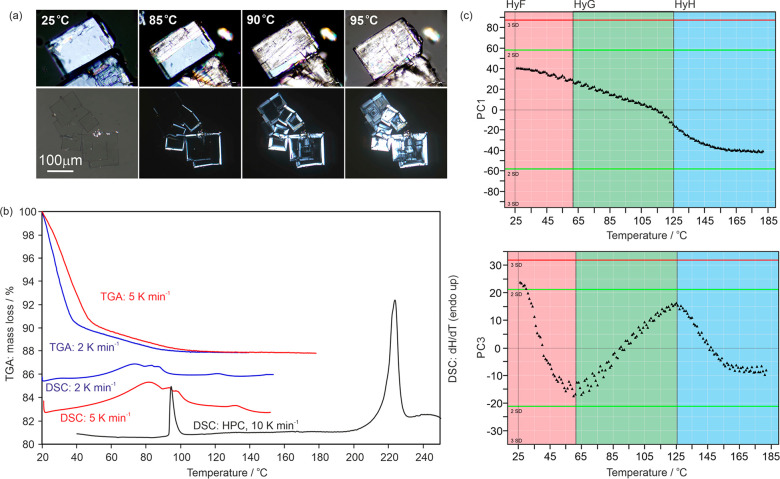
The mechanism for the dehydration of HyF depends on the crystal size in the investigated sample. A phase transition to HyA is clearly observable by polarized light microscopy when single cystals of HyF are heated (Figure 13a, crystal size: 50–200 μm). Depending on the orientation of the HyF crystals with respect to the optical pathway, the transformation to HyA (as confirmed with PXRD and IR) is indicated by a change in birefringence colors, or if the tetragonal single crystals of HyF are orientated along the optical axis, an increase/appearance of birefringence is observed upon the phase transition (dehydration) to the hydrate with lower crystal symmetry (HyA, monoclinic). The transition takes place in the temperature range of 85–105 °C.
Figure 13.
(a) Photomicrographs of strychnine sulfate following the transition of HyF to HyA. (b) DSC and TGA thermograms starting from HyF. The TGA and DSC curves depicted in color were recorded in perforated DSC crucibles and in black using a high-pressure DSC capsule (HPC). (c) Plot of the first and third principal components (PC1 and PC3) from the principal component analysis of the IR spectra observed during heating HyF from 24 to 180 °C. Each data point corresponds to an IR spectrum.
In contrast, smaller HyF crystals (<20 μm) start to dehydrate at 40 °C if slow heating rates are applied, and thus the dehydration occurs significantly below the HyF to HyA transition temperature. The maximum dehydration occurs at 80 °C (heating rate approximately 2 °C min–1), and the first dehydration reaction is finished at approximately 100 °C. A second dehydration reaction was observed at approximately 120 °C, which resulted in a highly disordered material. The dissociation of the sulfate salt and sublimation of strychnine occur above 160 °C.
The TGA curves of HyF indicate a two-step dehydration mechanism. The mass loss starts as soon as HyF is exposed to dry conditions (Figure 13b) and proceeds via HyG and HyH. The absence of other strychnine sulfate hydrates was confirmed with PXRD measurements. The corresponding DSC heating curves recorded with crucibles covered with pinholed lids exhibit several broad and overlapping endotherms (Figure 13b). We were able to interpret these thermal events only by analyzing individual DSC samples after heating to 60, 80, 90, 100, and 120 °C respectively with PXRD. There are two overlapping dehydration pathways: (1) HyF → HyA (→ HyB) and (2) HyF → HyG → HyH. The use of closed or DSC crucibles with one pinhole and faster heating rates favors the HyF → HyA → HyB dehydration route. DSC crucibles with three pinholes and very slow heating rates favor the HyF → HyG → HyH route, as water can escape from the system. Furthermore, the peritectic HyF to HyA transition at 95 °C can be confirmed using high-pressure DSC pans.
A special experimental setup was used to reproduce the HyF → HyG → HyH dehydration route with IR spectroscopy. A powder sample of HyF sample (particle size 2–10 μm) was used for the experiments, and after recording of each spectrum, the ATR punch was removed for 20 s to allow the hydrate water to escape from the sample (thereby mimicking the TGA and slow heating DSC measurements). The PC1 reflects the loss of water, and the change in the course of the trajectory of the PC3 indicates that the dehydration proceeds via two intermediates, i.e., HyG and HyH.
4. Conclusions
Strychnine sulfate was found to exist in eight hydrate forms. An overview of the hydrates and their probable phase interrelations invoked by changes in temperature and RH is given in Figure 14. The water content of the hydrates ranges from approximately one to 6.5 mol equiv. Two of the hydrates (HyA and HyF) crystallize directly from water, HyC is the commercial product, and the remaining five hydrates (HyB, HyD, HyE, HyG, HyH) are obtained by partial dehydration of the three aforementioned hydrates. At the highest RH levels, all hydrates convert to HyF over time.
Figure 14.
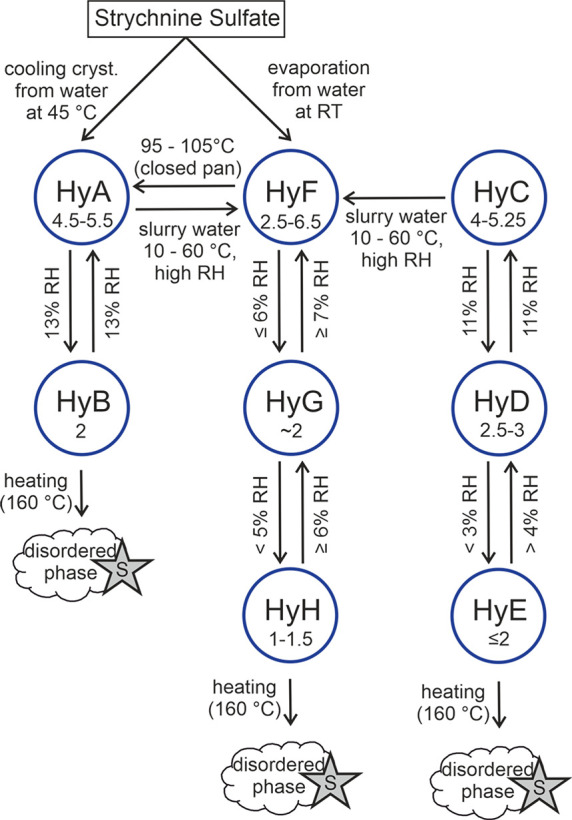
Flowchart showing the interrelation pathways of strychnine sulfate solid forms (S - strychnine, the decomposition product).
The structurally characterized strychnine sulfate hydrates (HyA and HyF) display a close 2D relationship, a double layer of cations which is also present in most of the strychnine salt structures of the CSD.76 The fast transformation kinetics between most of the strychnine sulfate hydrates and the predominance of the 2D strychninium construct may indicate that the same double layer sheets are also present in the other (not structurally characterized) hydrate forms.
The strychnine sulfate hydrates demonstrate that a strict classification of a hydrate as being either stoichiometric or nonstoichiometric is not always straightforward, in particular, for cases where high-resolution gravimetric moisture (de)sorption data are not available. As observed for HyC and HyF, the nonstoichiometric range of a hydrate (variable water content of the same hydrate phase) can be highly discontinuous and may also comprise a step-like change in the equilibrium moisture sorption/desorption isotherm, which is typical for a phase change in stoichiometric hydrates because of a considerable structural reorganization. In order to identify such phenomena and to avoid misinterpretations, moisture-controlled studies of phase-pure samples complemented with methods that enable insights into the structural features of the crystalline phases (e.g., PXRD) have to be employed.
HyA and HyF have been referred to in the literature as a pentahydrate and hexahydrate, respectively, which based on this study is a misnomer. HyA, with a variable water composition, should no longer be referred to formally as a pentahydrate, nor HyF as a hexahydrate. This carefully conducted investigation on strychnine sulfate demonstrates that state-of-the-art tools for characterizing hydrates, i.e., equilibrium moisture sorption/desorption isotherms and TGA, are needed for something as seemingly simple as getting the hydrate stoichiometry right.
The occurrence of (de)hydration reactions and intermediate hydrates of a compound upon changing temperature or humidity conditions very likely has severe implications in the manufacturing and for the performance of products. The fact that strychnine sulfate shows eight hydrate forms but no stable and ordered anhydrous phase highlights the potential importance of water as a stabilizing agent in solids. Overall, the study highlights that a series of complementary analytical techniques allowing precise adjustments of humidity and temperature conditions must be employed to reveal the solid-state behavior of such a complex hydrate system with subtle phase changes and transient states to finally establish a better understanding of the role of water in molecular crystals.
Acknowledgments
The authors are grateful to Danya Spechtenhauser for experimental assistance. D.E.B. gratefully acknowledges funding by the Elise Richter Programme of the Austrian Science Fund (FWF, Project V436-N34).
Supporting Information Available
The Supporting Information is available free of charge at https://pubs.acs.org/doi/10.1021/acs.cgd.0c00777.
Crystallography (single crystal), Pawley fitting (HyF), hot-stage microscopy, and principal component analysis (PDF)
Accession Codes
CCDC 1992281–1992282 contain the supplementary crystallographic data for this paper. These data can be obtained free of charge via www.ccdc.cam.ac.uk/data_request/cif, or by emailing data_request@ccdc.cam.ac.uk, or by contacting The Cambridge Crystallographic Data Centre, 12 Union Road, Cambridge CB2 1EZ, UK; fax: +44 1223 336033.
Austrian Science Fund (FWF), Project V436-N34.
The authors declare no competing financial interest.
Supplementary Material
References
- Hilfiker R.Polymorphism in the Pharmaceutical Industry; Wiley-VCH: Weinheim, 2006. [Google Scholar]
- Byrn S. R.; Pfeiffer R. R.; Stowell J. G.. Solid-State Chemistry of Drugs, 2nd ed.; SSCI, Inc.: West Lafayette, IN, 1999. [Google Scholar]
- Ito M.; Shiba R.; Watanabe M.; Iwao Y.; Itai S.; Noguchi S. Phase transitions of antibiotic clarithromycin forms I, IV and new form VII crystals. Int. J. Pharm. 2018, 547, 258–264. 10.1016/j.ijpharm.2018.05.073. [DOI] [PubMed] [Google Scholar]
- Braun D. E.; McMahon J. A.; Bhardwaj R. M.; Nyman J.; Neumann M. A.; van de Streek J.; Reutzel-Edens S. M. Inconvenient Truths about Solid Form Landscapes Revealed in the Polymorphs and Hydrates of Gandotinib. Cryst. Growth Des. 2019, 19, 2947–2962. 10.1021/acs.cgd.9b00162. [DOI] [Google Scholar]
- Bernstein J.Polymorphism in Molecular Crystals; Clarendon Press: Oxford, 2002. [Google Scholar]
- Cruz-Cabeza A. J.; Davey R. J.; Oswald I. D. H.; Ward M. R.; Sugden I. J. Polymorphism in p-aminobenzoic acid. CrystEngComm 2019, 21, 2034–2042. 10.1039/C8CE01890A. [DOI] [Google Scholar]
- Zhu B.; Wang J.-R.; Ren G.; Mei X. Polymorphs and Hydrates of Apatinib Mesylate: Insight into the Crystal Structures, Properties, and Phase Transformations. Cryst. Growth Des. 2016, 16, 6537–6546. 10.1021/acs.cgd.6b01230. [DOI] [Google Scholar]
- Newman A. W.; Byrn S. R. Solid-state analysis of the active pharmaceutical ingredient in drug products. Drug Discovery Today 2003, 8, 898–905. 10.1016/S1359-6446(03)02832-0. [DOI] [PubMed] [Google Scholar]
- Ahlneck C.; Zografi G. The molecular basis of moisture effects on the physical and chemical stability of drugs in the solid state. Int. J. Pharm. 1990, 62, 87–95. 10.1016/0378-5173(90)90221-O. [DOI] [Google Scholar]
- Braun D. E.; Koztecki L. H.; McMahon J. A.; Price S. L.; Reutzel-Edens S. M. Navigating the Waters of Unconventional Crystalline Hydrates. Mol. Pharmaceutics 2015, 12, 3069–3088. 10.1021/acs.molpharmaceut.5b00357. [DOI] [PMC free article] [PubMed] [Google Scholar]
- Reutzel-Edens Susan M.; Braun Doris E.; Newman Ann W.. Hygroscopicity and Hydrates in Pharmaceutical Solids. In Polymorphism in the Pharmaceutical Industry: Solid Form and Drug Development; Hilfiker R., Von Raumer M., Eds.; Wiley-VCH: 2019; Vol. 2. [Google Scholar]
- Lee A. Y.; Erdemir D.; Myerson M. S. Crystal polymorphism in chemical process development. Annu. Rev. Chem. Biomol. Eng. 2011, 2, 259–280. 10.1146/annurev-chembioeng-061010-114224. [DOI] [PubMed] [Google Scholar]
- Sun C. C. Material Science Tetrahedron - A Useful Tool for Pharmaceutical Research and Development. J. Pharm. Sci. 2009, 98, 1744–1749. 10.1002/jps.21554. [DOI] [PubMed] [Google Scholar]
- Bhardwaj R. M.; McMahon J. A.; Nyman J.; Price L. S.; Konar S.; Oswald I. D. H.; Pulham C. R.; Price S. L.; Reutzel-Edens S. M. A Prolific Solvate Former, Galunisertib, under the Pressure of Crystal Structure Prediction, Produces Ten Diverse Polymorphs. J. Am. Chem. Soc. 2019, 141, 13887–13897. 10.1021/jacs.9b06634. [DOI] [PubMed] [Google Scholar]
- Braun D. E.; Lingireddy S. R.; Beidelschies M. D.; Guo R.; Mueller P.; Price S. L.; Reutzel-Edens S. M. Unraveling Complexity in the Solid Form Screening of a Pharmaceutical Salt: Why so Many Forms? Why so Few?. Cryst. Growth Des. 2017, 17, 5349–5365. 10.1021/acs.cgd.7b00842. [DOI] [PMC free article] [PubMed] [Google Scholar]
- Braun D. E.; Gelbrich T.; Kahlenberg V.; Tessadri R.; Wieser J.; Griesser U. J. Conformational Polymorphism in Aripiprazole: Preparation, Stability and Structure of Five Modifications. J. Pharm. Sci. 2009, 98, 2010–2026. 10.1002/jps.21574. [DOI] [PubMed] [Google Scholar]
- Ding Z.; Su W.; Huang X.; Tian B.; Cheng X.; Mao Y.; Li G.; Liu H.; Hao H. Understanding the Role of Water in Different Solid Forms of Avibactam Sodium and Its Affecting Mechanism. Cryst. Growth Des. 2020, 20, 1150–1161. 10.1021/acs.cgd.9b01459. [DOI] [Google Scholar]
- Okeyo P. O.; Ilchenko O.; Slipets R.; Larsen P. E.; Boisen A.; Rades T.; Rantanen J. Imaging of dehydration in particulate matter using Raman line-focus microscopy. Sci. Rep. 2019, 9, 1–11. 10.1038/s41598-019-43959-0. [DOI] [PMC free article] [PubMed] [Google Scholar]
- Newman A. Specialized Solid Form Screening Techniques. Org. Process Res. Dev. 2013, 17, 457–471. 10.1021/op300241f. [DOI] [Google Scholar]
- Price S. L.; Reutzel-Edens S. M. The potential of computed crystal energy landscapes to aid solid-form development. Drug Discovery Today 2016, 21, 912–923. 10.1016/j.drudis.2016.01.014. [DOI] [PubMed] [Google Scholar]
- Jorgensen A.; Rantanen J.; Karjalainen M.; Khriachtchev L.; Raesaenen E.; Yliruusi J. Hydrate Formation During Wet Granulation Studied by Spectroscopic Methods and Multivariate Analysis. Pharm. Res. 2002, 19, 1285–1291. 10.1023/A:1020621906855. [DOI] [PubMed] [Google Scholar]
- Rasanen E.; Rantanen J.; Jorgensen A.; Karjalainen M.; Paakkari T.; Yliruusi J. Novel identification of pseudopolymorphic changes of theophylline during wet granulation using near infrared spectroscopy. J. Pharm. Sci. 2001, 90, 389–396. . [DOI] [PubMed] [Google Scholar]
- Li Y.; Sanzgiri Y. D.; Chen Y. A study on moisture isotherms of formulations: the use of polynomial equations to predict the moisture isotherms of tablet products. AAPS PharmSciTech 2003, 4, 461–468. 10.1208/pt040459. [DOI] [PMC free article] [PubMed] [Google Scholar]
- Duggirala N. K.; La Casse S. M.; Zaworotko M. J.; Krzyzaniak J. F.; Arora K. K. Pharmaceutical cocrystals: formulation approaches to develop robust drug products. Cryst. Growth Des. 2020, 20, 617–626. 10.1021/acs.cgd.9b00946. [DOI] [Google Scholar]
- Morris K. R.Structural aspects of hydrates and solvates. In Polymorphism in Pharmaceutical Solids; Brittain H. G., Ed.; Marcel Dekker, Inc.: New York, 1999; Vol. 95, pp 125–181. [Google Scholar]
- Sacchetti M. Thermodynamics of water-solid interactions in crystalline and amorphous pharmaceutical materials. J. Pharm. Sci. 2014, 103, 2772–2783. 10.1002/jps.23806. [DOI] [PubMed] [Google Scholar]
- Newman A. W.; Reutzel-Edens S. M.; Zografi G. Characterization of the ″hygroscopic″ properties of active pharmaceutical ingredients. J. Pharm. Sci. 2008, 97, 1047–1059. 10.1002/jps.21033. [DOI] [PubMed] [Google Scholar]
- Infantes L.; Fabian L.; Motherwell W. D. S. Organic crystal hydrates: what are the important factors for formation. CrystEngComm 2007, 9, 65–71. 10.1039/B612529H. [DOI] [Google Scholar]
- Bobrovs R.; Kons A.; Berzins A.; Rekis T.; Actins A. Formation and Transformations of Organic Salt Hydrates: Four Encenicline Hydrochloride Monohydrates and Respective Isostructural Desolvates. Cryst. Growth Des. 2018, 18, 2100–2111. 10.1021/acs.cgd.7b01561. [DOI] [Google Scholar]
- Braun D. E.; Griesser U. J. Stoichiometric and Non-Stoichiometric Hydration of Brucine. Cryst. Growth Des. 2016, 16, 6111–6121. 10.1021/acs.cgd.6b01231. [DOI] [PMC free article] [PubMed] [Google Scholar]
- Guguta C.; Peters T.; de Gelder R. Structural Investigations of Hydrate, Anhydrate, Free Base, and Hydrochloride Forms of Morphine and Naloxone. Cryst. Growth Des. 2008, 8, 4150–4158. 10.1021/cg800622m. [DOI] [Google Scholar]
- Griesser U. J.The importance of solvates. In Polymorphism: In the Pharmaceutical Industry; Hilfiker R., Ed.; Wiley-VCH: Germany, 2006; pp 211–233. [Google Scholar]
- Raijada D.; Bond A. D.; Larsen F. H.; Cornett C.; Qu H.; Rantanen J. Exploring the Solid-Form Landscape of Pharmaceutical Hydrates: Transformation Pathways of the Sodium Naproxen Anhydrate-Hydrate System. Pharm. Res. 2013, 30, 280–289. 10.1007/s11095-012-0872-8. [DOI] [PubMed] [Google Scholar]
- Najib M. N. M.; Back K.; Edkins K. The Complex Solid-State Landscape of Sodium Diatrizoate Hydrates. Chem. - Eur. J. 2017, 23, 17339–17347. 10.1002/chem.201703658. [DOI] [PubMed] [Google Scholar]
- Han J.; Suryanarayanan R. A method for the rapid evaluation of the physical stability of pharmaceutical hydrates. Thermochim. Acta 1999, 329, 163–170. 10.1016/S0040-6031(99)00054-4. [DOI] [Google Scholar]
- Taylor L. S.; York P. Effect of particle size and temperature on the dehydration kinetics of trehalose dihydrate. Int. J. Pharm. 1998, 167, 215–221. 10.1016/S0378-5173(98)00065-9. [DOI] [Google Scholar]
- Malaj L.; Censi R.; Di Martino P. Mechanisms for Dehydration of Three Sodium Naproxen Hydrates. Cryst. Growth Des. 2009, 9, 2128–2136. 10.1021/cg800684v. [DOI] [Google Scholar]
- Liao X.; Zhou N. Dehydration Study of Piracetam Co-Crystal Hydrates. J. Pharm. Sci. 2018, 107, 2804–2809. 10.1016/j.xphs.2018.06.023. [DOI] [PubMed] [Google Scholar]
- Stieger N.; Caira M. R.; Liebenberg W.; Tiedt L. R.; Wessels J. C.; De Villiers M. M. Influence of the Composition of Water/Ethanol Mixtures on the Solubility and Recrystallization of Nevirapine. Cryst. Growth Des. 2010, 10, 3859–3868. 10.1021/cg901501d. [DOI] [Google Scholar]
- Zhu H.; Yuen C.; Grant D. J. W. Influence of water activity in organic solvent + water mixtures on the nature of the crystallizing drug phase. 1. Theophylline. Int. J. Pharm. 1996, 135, 151–160. 10.1016/0378-5173(95)04466-3. [DOI] [Google Scholar]
- Braun D. E.; Orlova M.; Griesser U. J. Creatine: Polymorphs Predicted and Found. Cryst. Growth Des. 2014, 14, 4895–4900. 10.1021/cg501159c. [DOI] [PMC free article] [PubMed] [Google Scholar]
- Ticehurst M. D.; Storey R. A.; Watt C. Application of slurry bridging experiments at controlled water activities to predict the solid-state conversion between anhydrous and hydrated forms using theophylline as a model drug. Int. J. Pharm. 2002, 247, 1–10. 10.1016/S0378-5173(02)00277-6. [DOI] [PubMed] [Google Scholar]
- Rodriguez-Hornedo N.; Lechuga-Ballesteros D.; Hsiu-Jean Wu Phase transition and heterogeneous/epitaxial nucleation of hydrated and anhydrous theophylline crystals. Int. J. Pharm. 1992, 85, 149–162. 10.1016/0378-5173(92)90144-Q. [DOI] [Google Scholar]
- Leung S. S.; Padden B. E.; Munson E. J.; Grant D. J. W. Solid-State Characterization of Two Polymorphs of Aspartame Hemihydrate. J. Pharm. Sci. 1998, 87, 501–507. 10.1021/js970249n. [DOI] [PubMed] [Google Scholar]
- Braun D. E.; Karamertzanis P. G.; Price S. L. Which, if any, hydrates will crystallise? Predicting hydrate formation of two dihydroxybenzoic acids. Chem. Commun. 2011, 47, 5443–5445. 10.1039/c1cc10762c. [DOI] [PMC free article] [PubMed] [Google Scholar]
- Cruz-Cabeza A. J.; Day G. M.; Jones W. Towards Prediction of Stoichiometry in Crystalline Multicomponent Complexes. Chem. - Eur. J. 2008, 14, 8830–8836. 10.1002/chem.200800668. [DOI] [PubMed] [Google Scholar]
- Dudek M. K.; Day G. M. Explaining crystallization preferences of two polyphenolic diastereoisomers by crystal structure prediction. CrystEngComm 2019, 21, 2067–2079. 10.1039/C8CE01783B. [DOI] [Google Scholar]
- Braun D. E., Supramolecular organisation of sulphate salt hydrates exemplified with brucine sulphate. CrystEngComm 2020, 10.1039/C9CE01762C. [DOI] [Google Scholar]
- Pelletier P. J.; Caventou J. B. Ann. Chim. Phys. 1818, 8, 323. [Google Scholar]
- Pelletier P. J.; Caventou J. B. Ann. Chim. Phys. 1819, 10, 142. [Google Scholar]
- Harris R. M. Strychnine. Molecules of Death (2nd Edition) 2007, 367–385. 10.1142/9781860948381_0021. [DOI] [Google Scholar]
- Lowenstein E. A Study of Hydrates, the Vapor Pressures of which Vary Continuously with the Composition. Zeitschrift fuer Anorganische Chemie 1909, 63, 69–139. 10.1002/zaac.19090630108. [DOI] [Google Scholar]
- Schnellbach W. Determination of the water content of strychnine sulfate. Am. J. Pharm. 1929, 101, 587–96. [Google Scholar]
- Bokhoven C.; Schoone J. C.; Bijvoet J. M. The Fourier synthesis of the crystal structure of strychnine sulfate pentahydrate. Acta Crystallogr. 1951, 4, 275–80. 10.1107/S0365110X51000891. [DOI] [Google Scholar]
- Griesser U. J.; Burger A. The effect of water vapor pressure on desolvation kinetics of caffeine 4/5-hydrate. Int. J. Pharm. 1995, 120, 83–93. 10.1016/0378-5173(94)00416-3. [DOI] [Google Scholar]
- Markvardsen A. J.; David W. I. F.; Johnson J. C.; Shankland K. A probabilistic approach to space-group determination from powder diffraction data. Acta Crystallogr., Sect. A: Found. Crystallogr. 2001, A57, 47–54. 10.1107/S0108767300012174. [DOI] [PubMed] [Google Scholar]
- David W. I. F.; Shankland K.; van de Streek J.; Pidcock E.; Motherwell W. D. S.; Cole J. C. DASH: a program for crystal structure determination from powder diffraction data. J. Appl. Crystallogr. 2006, 39, 910–915. 10.1107/S0021889806042117. [DOI] [Google Scholar]
- Pawley G. S. Unit-Cell Refinement from Powder Diffraction Scans. J. Appl. Crystallogr. 1981, 14, 357–361. 10.1107/S0021889881009618. [DOI] [Google Scholar]
- Coelho A. A.Topas Academic V5; Coelho Software: Brisbane, 2012. [Google Scholar]
- Sheldrick G. M.SADABS. Version 2007/7 ; Bruker AXS Inc.: Madison, Wisconsin, USA, 2007. [Google Scholar]
- Sheldrick G. SHELXT - Integrated space-group and crystal-structure determination. Acta Crystallogr., Sect. A: Found. Adv. 2015, 71, 3–8. 10.1107/S2053273314026370. [DOI] [PMC free article] [PubMed] [Google Scholar]
- Sheldrick G. Crystal structure refinement with SHELXL. Acta Crystallogr., Sect. C: Struct. Chem. 2015, 71, 3–8. 10.1107/S2053229614024218. [DOI] [PMC free article] [PubMed] [Google Scholar]
- Gelbrich T.; Hursthouse M. B. A versatile procedure for the identification, description and quantification of structural similarity in molecular crystals. CrystEngComm 2005, 7, 324–336. 10.1039/b502484f. [DOI] [Google Scholar]
- Gelbrich T.; Threlfall T. L.; Hursthouse M. B. XPac dissimilarity parameters as quantitative descriptors of isostructurality: the case of fourteen 4,5′-substituted benzenesulfonamido-2-pyridines obtained by substituent interchange involving CF3/I/Br/Cl/F/Me/H. CrystEngComm 2012, 14, 5454–5464. 10.1039/c2ce25508a. [DOI] [Google Scholar]
- Martens H.; Naes T.. Multivariate Calibration; Wiley VCH: Chichester, 1991. [Google Scholar]
- Roggo Y.; Chalus P.; Maurer L.; Lema-Martinez C.; Edmond A.; Jent N. A review of near infrared spectroscopy and chemometrics in pharmaceutical technologies. J. Pharm. Biomed. Anal. 2007, 44, 683–700. 10.1016/j.jpba.2007.03.023. [DOI] [PubMed] [Google Scholar]
- Jorgensen A. C.; Miroshnyk I.; Karjalainen M.; Jouppila K.; Siiria S.; Antikainen O.; Rantanen J. Multivariate data analysis as a fast tool in evaluation of solid state phenomena. J. Pharm. Sci. 2006, 95, 906–916. 10.1002/jps.20573. [DOI] [PubMed] [Google Scholar]
- Groom C. R.; Bruno I. J.; Lightfoot M. P.; Ward S. C. The Cambridge Structural Database. Acta Crystallogr., Sect. B: Struct. Sci., Cryst. Eng. Mater. 2016, 72, 171–179. 10.1107/S2052520616003954. [DOI] [PMC free article] [PubMed] [Google Scholar]
- Ghosh R.; Roychowdhury P.; Chattopadhyay D.; Iitaka Y. Structure of strychnine hydrochloride sesquihydrate. Acta Crystallogr., Sect. C: Cryst. Struct. Commun. 1989, C45, 1794–7. 10.1107/S0108270189003483. [DOI] [PubMed] [Google Scholar]
- Robertson J. H.; Beevers C. A. The crystal structure of strychnine hydrobromide. Acta Crystallogr. 1951, 4, 270–5. 10.1107/S0365110X5100088X. [DOI] [Google Scholar]
- Costante J.; Ehlinger N.; Perrin M.; Collet A. The absolute configuration of bromochlorofluoroacetic acid. Enantiomer 1996, 1, 377–386. [Google Scholar]
- Gould R. O.; Kelly R.; Walkinshaw M. D. Asymmetric resolution and molecular recognition. Part 1. The crystal structure of N-benzoyl-L-alanyl-strychninium dihydrate. J. Chem. Soc., Perkin Trans. 2 1985, 847–52. 10.1039/P29850000847. [DOI] [Google Scholar]
- Mostad A. Structural study of the strychnine molecule in crystals of the free base and of the nitric acid complex. Acta Chem. Scand., Ser. B 1985, B39, 705–716. [Google Scholar]
- Braun D. E.; Gelbrich T.; Kahlenberg V.; Griesser U. J. Insights into Hydrate Formation and Stability of Morphinanes from a Combination of Experimental and Computational Approaches. Mol. Pharmaceutics 2014, 11, 3145–3163. 10.1021/mp500334z. [DOI] [PMC free article] [PubMed] [Google Scholar]
- Pawley G. S.; Yeats E. A. A Neutron-Diffraction Study of Perdeuteronaphthalene. Acta Crystallogr., Sect. B: Struct. Crystallogr. Cryst. Chem. 1969, 25, 2009–2013. 10.1107/S0567740869005073. [DOI] [Google Scholar]
- Taylor R.; Wood P. A. A Million Crystal Structures: The Whole Is Greater than the Sum of Its Parts. Chem. Rev. 2019, 119, 9427–9477. 10.1021/acs.chemrev.9b00155. [DOI] [PubMed] [Google Scholar]
Associated Data
This section collects any data citations, data availability statements, or supplementary materials included in this article.


