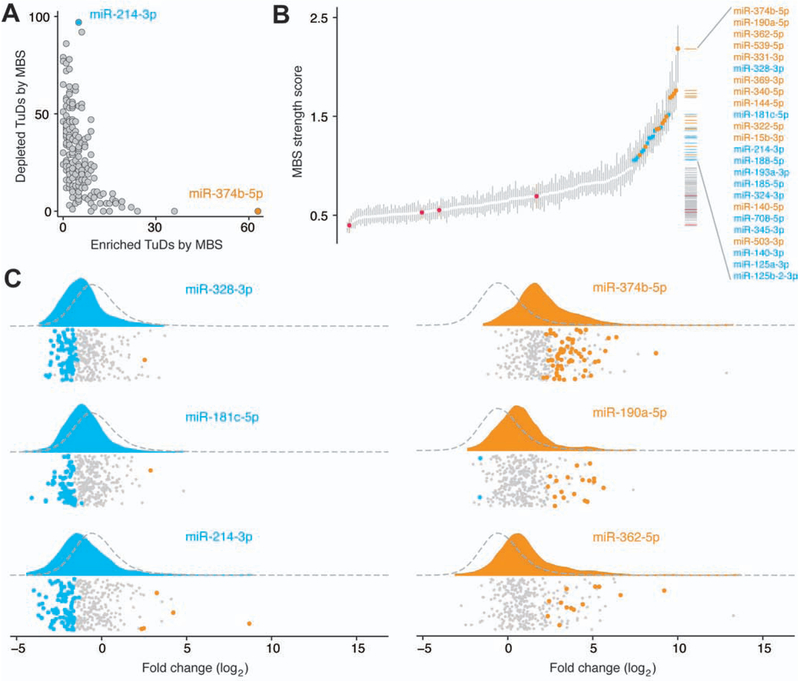
Figure 3.
MicroRNAs regulate repopulation following liver injury. (A) MBS tallies in enriched and depleted TuDs were negatively correlated in the combined data set. (B) Quantile plot of 174 individual MBS strength scores. Control MBS scores are shown in red. Vertical bars indicate 95% confidence intervals. Twenty four MBSs with strength scores above 1 are colored according to phenotypes above (orange) or below (blue) zero. (C) Raincloud plots of the log2 fold change distributions of TuDs containing the strongest MBSs with a negative phenotype (blue) and or a positive phenotype (orange). Kernel density plots are shaded according to the MBS phenotype. Dashed lines indicate the density plot of all TuDs not containing the specified MBS. Data points indicate each TuD detected containing the specified MBS and are colored by significance: depleted (blue), enriched (orange), or unchanged (gray) relative to non-targeting controls. Each distribution was significantly different from the remaining TuDs (P<.001).

