

Abstract
Background:
Pediatric Risk of Mortality (PRISM) III score is one of the widely used scoring systems to quantify critical illness in the pediatric age group. This study was carried out to find the association of PRISM III score with the outcome (discharge/mortality) and also hospital stay in survivors and nonsurvivors.
Setting:
The study was conducted in a tertiary care hospital from January 2014 to June 2015.
Materials and Methods:
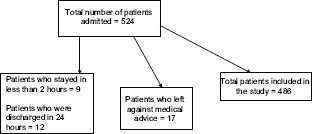
A total of 524 patients were admitted, and after excluding the patients who met the exclusion criteria, 486 patients were analyzed.
Statistical Analysis:
Logistic regression was used to find the association of variables under the PRISM III score with mortality. Linear regression was used to find the association of PRISM III score with length of stay.
Results:
Mortality was 31%; male: female ratio was 1.5:1. Maximum patients presented with respiratory system involvement (26.3%), and maximum mortality (20.3%) was observed in the patients with respiratory involvement. Discrimination by the model between mortality and survival was excellent (receiver operating characteristic curve [0.903]). Maximum risk of mortality was noticed in mechanically ventilated patients (odds ratio [OR]: 10.87) followed by lower systolic blood pressure (OR: 2.72), deranged prothrombin time, partial thromboplastin time (OR: 1.50), deranged mental status (OR: 1.41), and tachycardia (OR: 1.37). Length of stay (LOS) in patients increased till PRISM III score of 25. Average LOS in survivors was 4.327 days which was not accounted by difference in PRISM III score between different patients. With each unit increase in PRISM III score, LOS increased by 5 h.
Conclusions:
PRISM III score has excellent capacity to discriminate between survival and mortality. PRISM III score can be used to predict LOS among survivors.
Keywords: Length of stay, mortality, Pediatric Risk of Mortality III score, receiver operating characteristic curve
INTRODUCTION
Critical illness in the pediatric age group is a familiar concept, but objectivity to critical illness was assigned only with the development of scoring systems.
First scoring system which was developed with the intention to be used for critically sick pediatric patients was Physiologic Stability Index. It was developed in 1984 by pediatric intensivists, 34 variables from seven major physiologic systems were used, and points 0, 1, 3, and 5 were given to each variable and increasing score corresponding with increasing severity.[1]
As the number of variables was large, a second-generation scoring system called Pediatric Risk of Mortality (PRISM) was developed by Pollack et al. in 1988. The number of variables was reduced from 34 to 14. Variables used in the PRISM score were re-evaluated in 1996 by Pollack et al. based on data from 32 pediatric intensive care units (PICUs), and the sample comprised 11,165 consecutive admissions. This scoring system was labeled as PRISM III score, and diastolic blood pressure (BP), respiratory rate, PaCO2/FiO2, serum bilirubin, and calcium levels were not included in the study, whereas systolic BP, temperature, percentage of acid–base gas parameters, serum creatinine, blood urea nitrogen (BUN), white blood cell (WBC) count, and platelet count were included, making a total of 17 parameters in the scoring system. PRISM III score is institution independent and can be calculated at 12 h and 24 h labeled as PRISM-12 and PRISM-24, respectively.[2]
PRISM III score has been used in lot of studies to find its utility as a mortality score, but not much work has been done on using it for predicting length of stay (LOS) in survivors. Its role in estimating LOS can be further studied to ascertain the objective effect of increase in PRISM-III score on LOS as India being resource-poor country without any insurance cover.
Objectives
To ascertain the role of PRISM III score as mortality predictor
To find the relation of PRISM III score to the LOS.
MATERIALS AND METHODS
Study design
This was a prospective study conducted in the department of pediatrics.
Setting
The study was conducted from January 2014 to June 2015. Ours is a tertiary care hospital with 6-bedded PICU. Permission to start the study was obtained from the institution's ethics committee.
Participants
Patients in the age group of 1 month to 14 years admitted in PICU were included in the study. Readmissions were counted as separate admission. Patients excluded from the study were those patients who stayed in PICU for <2 h or discharged from PICU in <24 h of PICU admission or admitted in continuous cardiopulmonary resuscitation and did not achieve stable vital signs for ≥2 h and newborns <1 month of age and children above 14 years of age.
Variables
Demographic details, diagnosis, date of admission, date of discharge, outcome, mechanical ventilation, and LOS were recorded on the pro forma sheet for the study. For PRISM III score, various variables (systolic BP, heart rate, temperature, mental status, pupillary response, acidosis, pH, pCO2, total CO2, PaO2, glucose, potassium, creatinine, BUN, WBC count, platelet count, prothrombin time, and partial thromboplastin time [PT and PTT]) were recorded at 24 h of admission.
Data Source
Admitted patients in the age group of 1 month to 14 years in PICU.
Bias
As this study was based on scoring system, so chances of bias are less.
Study size
A total of 524 patients were admitted during the study, 21 patients were excluded, and 17 patients left against medical advice; hence, 486 patients formed the sample of the study.
Quantitative variables
The variables recorded were based on the scoring system and were recorded in the pro forma sheet, and the final PRISM III score was calculated.
Statistical method
Descriptive analysis (mean and standard deviation) was used for sample characterization. Goodness of fit for the model was assessed by Hosmer–Lemeshow goodness of fit. Observed and expected mortality were compared. Receiver operating characteristic curve was used to estimate the capacity of the model to discriminate between discharge and mortality. Area under the curve between 0.7 and 0.79 is acceptable, area ≥0.8 is considered good, and area ≥0.9 is considered excellent discrimination. Forward logistic regression was used to find the systems which are associated with mortality and to what extent. Further logistic regression was used to find the association of variables in the PRISM score and other parameters like mechanical admission which are associated with mortality.[3] Relation of PRISM score to hospital stay in survivors and nonsurvivors was calculated. Linear regression was used to find the association of hospital stay in survivors to PRISM III score.
Total patients included in the study = 486
Patients who left against medical advice = 17
Patients who stayed in <2 h = 9
Patients who were discharged in 24 h = 12
Total number of patients admitted = 524.
RESULTS
Participants
Descriptive data
As shown in Table 1, the diseasewise distribution of patients, it was observed that maximum number of patients had respiratory disease (24.07%) followed by CNS diseases (20.57%) and infectious diseases (13.79% of patients).
Table 1.
Distribution of patients
| Characteristics of patients | Value | |
|---|---|---|
| Number of patients | 486 | |
| Mortality, n (%) | 151 (31.07) | |
| Agewise distribution, n (%) | ||
| Infant (1 month-12 months) | 209 (43.00) | |
| Child (1-12 years) | 226 (46.50) | |
| Adolescent (>12 years) | 51 (10.50) | |
| Genderwise distribution, n (%) | ||
| Female | 194 (39.92) | |
| Male | 292 (60.08) | |
| Male:female | 1.475:1 | |
| Average length of stay (days) | ||
| Survivors | 5.537 | |
| Nonsurvivors | 4.78 | |
| Diagnosis | Total, n (%) | Mortality, n (%) |
| Diabetic ketoacidosis | 28 (5.76) | 5 (3.31) |
| Gastrointestinal infections | 35 (7.20) | 4 (2.6) |
| Liver disease | 14 (2.88) | 9 (6) |
| Gastrointestinal surgical conditions | 12 (2.47) | 7 (4.6) |
| Cardiovascular diseases | 19 (3.91) | 10 (6.6) |
| Respiratory diseases | 117 (24.07) | 31 (20.5) |
| Infectious diseases | 67 (13.79) | 29 (19.2) |
| Chronic infections | 25 (5.14) | 11 (7.3) |
| Central nervous system diseases | 100 (20.57) | 30 (19.9) |
| Accidents | 4 (0.8) | 2 (1.3) |
| Renal system diseases | 18 (3.7) | 3 (2) |
| Hematological diseases | 28 (5.8) | 6 (4) |
| Miscellaneous | 14 (2.88) | 2 (1.3) |
| Burns | 2 (0.4) | 1 (0.7) |
| Cranial surgeries | 3 (0.6) | 1 (0.7) |
| Total | 486 (100) | 151 (100) |
Age groupwise distribution of the patients showed that 1% of patients belonged to the neonatal age group, 43% were infants, 46.50% were children, and 10.50% were adolescents. Male: female ratio was 1.475:1.
Hosmer–Lemeshow goodness of fit for PRISM score [Table 2] depicted the model to be good fit with good calibration (P = 0.25). Model was able to predict the outcome (discharge/mortality) correctly in 84.6% cases.
Table 2.
Outcome of patients
| Observed | Predicted outcome | Percentage correct | |
|---|---|---|---|
| Discharge | Mortality | ||
| Outcome | |||
| Discharge | 307 | 28 | 91.6 |
| Mortality | 47 | 104 | 68.9 |
| Overall percentage | 84.6 | ||
PRISM III score has good predictability with area under the curve being 0.903 (95% confidence interval: 0.873–0.932).
Main results
Using logistic regression [Table 3], it was found that increase in PRISM score by 1 unit increased the mortality by 1.251 times.
Table 3.
Logistic regression with pediatric risk of mortality score, vital signs, and laboratory tests
| Variables | B | SE | Wald | df | Significant | Exp(B) | 95% CI for Exp(B) | |
|---|---|---|---|---|---|---|---|---|
| Lower | Upper | |||||||
| PRISM score | 0.224 | 0.020 | 128.395 | 1 | 0.000 | 1.251 | 1.204 | 1.301 |
| Constant | −3.319 | 0.265 | 156.298 | 1 | 0.000 | 0.036 | ||
| Step 1a | ||||||||
| Cardiovascular and neurologic vital signs | 0.433 | 0.037 | 134.709 | 1 | 0.000 | 1.541 | 1.433 | 1.658 |
| Step 2b | ||||||||
| Hematologic tests | 0.181 | 0.058 | 9.649 | 1 | 0.002 | 1.198 | 1.069 | 1.343 |
| Step 3c | ||||||||
| Chemistry tests | 0.161 | 0.070 | 5.349 | 1 | 0.021 | 1.175 | 1.025 | 1.346 |
a0.0; b0.002; c0.021. SE: Standard error, CI: Confidence interval, PRISM: Pediatric risk of mortality
On further using logistic regression [Table 3] to find the relative effect of various parameters under PRISM score, it was found that cardiovascular and neurologic signs, hematologic tests, and chemistry tests affected the mortality, and results were statistically significant (P < 0.05). Increase in one point of cardiovascular and neurologic signs increased the mortality by 1.5 times. Increase in one unit of hematologic test or chemistry tests increased mortality by 1.2 times or 1.17 times, respectively.
On further using logistic regression [Table 4], it was found that ventilated patients had 10.87 times more risk of mortality. Variables which were negatively correlated to mortality were systolic BP and mental status. Fall in systolic BP below critical point, that is, shock was 2.724 times linked to mortality. Fall in mental status, that is, Glasgow Coma Scale was 1.41 times linked to mortality. Variables positively related to mortality were prothrombin time, partial thromboplastin time, and heart rate. Deranged coagulation profile, that is, increase in PT and PTT by 1 point lead to 50% increase in mortality. Tachycardia was responsible for 1.3 times increase in mortality. Increase in pH was negatively related to mortality, that is, increase in pH by 1 point decreased mortality by 40% (Exp (B) = 0.606; P = 0.024).
Table 4.
Logistic regression with six variables of pediatric risk of mortality score (reaching significant levels)
| Variables | B | SE | Wald | df | Significant | Exp(B) | 95% CI for Exp(B) | |
|---|---|---|---|---|---|---|---|---|
| Lower | Upper | |||||||
| Systolic BP | 1.002 | 0.089 | 127.817 | 1 | 0.000 | 2.724 | 2.290 | 3.241 |
| Ventilator | 2.386 | 0.296 | 64.863 | 1 | 0.000 | 10.870 | 6.082 | 19.426 |
| PT and PTT | 0.408 | 0.122 | 11.200 | 1 | 0.001 | 1.503 | 1.184 | 1.909 |
| Mental status | 0.344 | 0.096 | 12.736 | 1 | 0.000 | 1.410 | 1.168 | 1.703 |
| HR | 0.273 | 0.112 | 5.880 | 1 | 0.015 | 1.313 | 1.054 | 1.637 |
| pH | -0.500 | 0.222 | 5.090 | 1 | 0.024 | 0.606 | 0.393 | 0.936 |
CI: Confidence interval, SE: Standard error, BP: Blood pressure, PT: Prothrombin time, PTT: Partial thromboplastin time, HR: Heart rate
Maximum mortality (42.38%) was seen when PRISM score was >20 [Table 5], out of patients with score >20, maximum mortality (65.625%) was seen within <3 days of hospital stay.
Table 5.
Pediatric risk of mortality score and length of stay
| PRISM score | <3 days | Days | Days | >14 days | Total | |||||
|---|---|---|---|---|---|---|---|---|---|---|
| Survivors | Nonsurvivors | Survivors | Nonsurvivors | Survivors | Nonsurvivors | Survivors | Nonsurvivors | Survivors | Nonsurvivors | |
| 0-5 | 89 | 3 | 96 | 8 | 18 | 3 | 8 | 2 | 211 | 16 |
| 6-10 | 21 | 9 | 29 | 8 | 12 | 0 | 4 | 1 | 66 | 18 |
| 11-15 | 10 | 27 | 13 | 7 | 15 | 3 | 2 | 2 | 40 | 39 |
| 16-20 | 3 | 9 | 4 | 2 | 1 | 1 | 0 | 2 | 8 | 14 |
| >20 | 1 | 42 | 3 | 11 | 3 | 9 | 3 | 2 | 10 | 64 |
| Total | 124 | 90 | 145 | 36 | 49 | 16 | 17 | 9 | 335 | 151 |
PRISM: Pediatric risk of mortality
On applying linear regression [Figure 1 and Table 6] to find the relation of LOS in survivors with the PRISM score, it was observed that the LOS which was not accounted for by the PRISM score was 4.327 days (intercept) and increase in PRISM score by 1 unit increased LOS by 5 h (coefficient B = 0.21 days).
Figure 1.
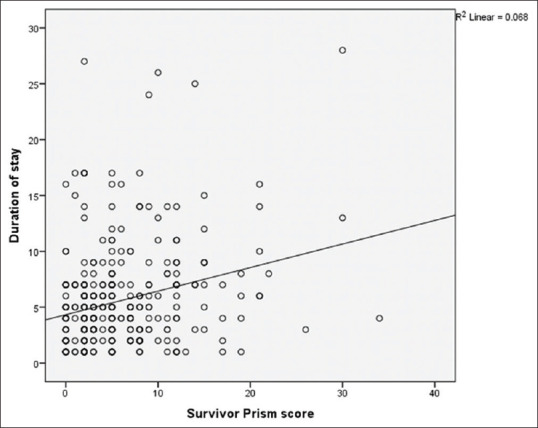
Relation between PRISM Score in survivors and hospital stay
Table 6.
Linear regression model showing relationship of pediatric risk of mortality score of survivors and length of stay
| Model | Unstandardized coefficients | Standardized coefficients β | t | Significant | 95% CI for B | 95% CI for B | ||
|---|---|---|---|---|---|---|---|---|
| B | SE | Lower bound | Upper bound | |||||
| Constant | 4.327 | 0.341 | 12.676 | 0.000 | 3.656 | 4.999 | ||
| Survivor PRISM score | 0.211 | 0.043 | 0.260 | 4.915 | 0.000 | 0.127 | 0.296 | |
PRISM: Pediatric risk of mortality, CI: Confidence interval, SE: Standard error
DISCUSSION
Our model [Table 2] was able to predict 84.6% of the outcomes and had good discriminatory power as area under the curve was 0.903, which is considered excellent, and discriminatory power increases when this value approaches 1. Our results are in consonance with other studies where AUC [Figure 2] was >0.9,[4,5,6,7] while discriminatory power <0.9 was reported by few other studies.[8,9,10]
Figure 2.
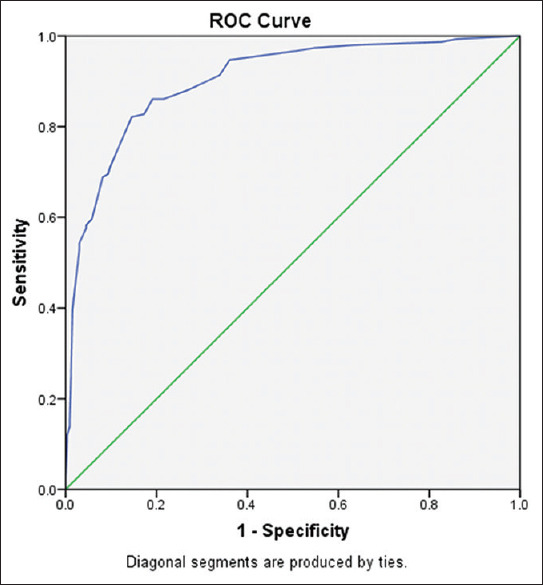
ROC curve
Using logistic regression, it was found that mechanical ventilation, mental status, deranged coagulation profile, tachycardia, PT and PTT, tachycardia, and increase in pH were the risk factors for death.
Only few studies have commented on the risk factors.
A study by Costa et al. has reported that mechanical ventilation, vasoactive drugs, nosocomial infections, and duration of hospitalization significantly affected the mortality as addition of vasoactive drug increased mortality four fold.[10]
A study by Ana Lila found that variables significantly associated with mortality were abnormal papillary reflexes, acidosis, BUN, and WBC count. Abnormal papillary reflexes had nine times risk of mortality, whereas acidosis had three times risk of mortality. Deranged BUN (odds ratio [OR]: 1.03) and WBC count (OR: 1.02) were directly related to mortality.[11]
Another study by Pollack et al. reported that abnormal papillary reflexes, minimum systolic BP, and coma were significantly associated with mortality.[2]
The difference in reporting of relation of different factors to mortality in different studies could be due to the different system involvement at different centers on presentation.
In our study, the average LOS was 10.23 days [Table 1], whereas in case of survivors, it was 5.537 days, and in nonsurvivors, it was 4.78 days. Our study is in concordance with the study from Egypt, in which LOS in case of survivors was 5.34 ± 5.82 days, and in case of nonsurvivors, it was 3.82 ± 4.18 days.[12]
In other studies, the average length of stay varied from 3 days to 11.9 days.[6,9,10,11,13]
Further, linear regression [Table 6] was applied to find the relation of LOS in survivors with the PRISM score, and it was observed that 4.327 days (intercept) is the LOS not accounted for by the PRISM score. Increase in PRISM score by 1 unit increased LOS by 5 h (coefficient B = 0.21 days).
On review of literature, we could find only one study in which association between LOS and various other factors was studied, and it was concluded that average LOS (in both survivors and nonsurvivors) was 1.4 days (intercept), which was not accounted for by PRISM III-24 score or other factors.[7]
However, no other study has correlated LOS in survivors with the PRISM III score.
The mean PRISM score in our study was 9.91, whereas in case of survivors, it was 5.72, and in case of nonsurvivors, it was 19.01, which is in concordance with study from Portugal in which PRISM score in survivors was 5.6, and in nonsurvivors, it was 19.7.[6]
Similar results were also reported by study from Brazil, in which median Prism score in survivors and nonsurvivors was 7 and 15, respectively.[10]
Another study from India also reported the mean Prism score in survivors and nonsurvivors as 7.5878 ± 5.032 and 20.63 ± 3.41, respectively.[14]
A study from Egypt reported higher mean PRISM score in survivors (17.39 ± 6.60) as well as nonsurvivors (35.81 ± 6.69).[12]
On analysis of association of duration of stay and PRISM score, it was observed that LOS increased till PRISM score of 25, and thereafter, LOS decreased because of the early mortality.
In a study by Ruttimann et al., similar results were obtained as expected LOS increased up to a score of 18 and then decreased due to early deaths as higher PRISM score indicated increased severity of disease.[7]
Limitations
This study was conducted in a single tertiary center in a developing country, and other multicentric studies are needed to support the results.
CONCLUSIONS
PRISM III score has excellent capacity to discriminate between survival and mortality. PRISM III score can be used to predict LOS among survivors.
Financial support and sponsorship
Nil.
Conflicts of interest
There are no conflicts of interest.
REFERENCES
- 1.Yeh TS, Pollack MM, Ruttimann UE, Holbrook PR, Fields AI. Validation of a physiologic stability index for use in critically ill infants and children. Pediatr Res. 1984;18:445–51. doi: 10.1203/00006450-198405000-00011. [DOI] [PubMed] [Google Scholar]
- 2.Pollack MM, Patel KM, Ruttimann UE. PRISM III: An updated pediatric risk of mortality score. Crit Care Med. 1996;24:743–52. doi: 10.1097/00003246-199605000-00004. [DOI] [PubMed] [Google Scholar]
- 3.Hosmer D, Lemeshow S. Applied Logistic Regression. 2nd ed. New York: Wiley-Interscience Publication; 2000. [Google Scholar]
- 4.Susainawati V, Suryantro P, Naning R. Prognostic predictor at pediatric intensive care unit (PICU) with pediatric risk of mortality III (PRISM III) scores. J Med Sci. 2014;46:71–7. [Google Scholar]
- 5.Pollack MM, Ruttimann UE, Getson PR. Pediatric risk of mortality (PRISM) score. Crit Care Med. 1988;16:1110–6. doi: 10.1097/00003246-198811000-00006. [DOI] [PubMed] [Google Scholar]
- 6.Gonçalves JP, Severo M, Rocha C, Jardim J, Mota T, Ribeiro A. Performance of PRISM III and PELOD-2 scores in a pediatric intensive care unit. Eur J Pediatr. 2015;174:1305–10. doi: 10.1007/s00431-015-2533-5. [DOI] [PubMed] [Google Scholar]
- 7.Ruttimann UE, Patel KM, Pollack MM. Length of stay and efficiency in pediatric intensive care units. J Pediatr. 1998;133:79–85. doi: 10.1016/s0022-3476(98)70182-9. [DOI] [PubMed] [Google Scholar]
- 8.Khajeh A, Noori NM, Reisi M, Fayyazi A, Mohammadi M, Miri-Aliabad G. Mortality risk prediction by application of pediatric risk of mortality scoring system in pediatric intensive care unit. Iran J Pediatr. 2013;23:546–50. [PMC free article] [PubMed] [Google Scholar]
- 9.Taori RN, Lahiri KR, Tullu MS. Performance of PRISM (Pediatric Risk of Mortality) score and PIM (Pediatric Index of Mortality) score in a tertiary care pediatric ICU. Indian J Pediatr. 2010;77:267–71. doi: 10.1007/s12098-010-0031-3. [DOI] [PubMed] [Google Scholar]
- 10.Costa GA, Delgado AF, Ferraro A, Okay TS. Application of the pediatric risk of mortality (PRISM) score and determination of mortality risk factors in a tertiary pediatric intensive care unit. Clinics (Sao Paulo) 2010;65:1087–92. doi: 10.1590/S1807-59322010001100005. [DOI] [PMC free article] [PubMed] [Google Scholar]
- 11.De León AL, Romero-Gutiérrez G, Valenzuela CA, González-Bravo FE. Simplified PRISM III score and outcome in the pediatric intensive care unit. Pediatr Int. 2005;47:80–3. doi: 10.1111/j.1442-200x.2004.01997.x. [DOI] [PubMed] [Google Scholar]
- 12.El-Nawawy A. Evaluation of the outcome of patients admitted to the pediatric intensive care unit in Alexandria using the pediatric risk of mortality (PRISM) score. J Trop Pediatr. 2003;49:109–14. doi: 10.1093/tropej/49.2.109. [DOI] [PubMed] [Google Scholar]
- 13.Mukhtar FR, Faizal MAM, Herath HMDRK, Bamunuarachchi C, Samarasinghe PTV. A study on the prediction of illness related mortality of critically ill children by applying paediatric risk mortality III score in paediatric medical intensive care unit patients. Sri Lanka J Child Health. 2017;47:118–24. [Google Scholar]
- 14.Madaan G, Bhardwaj AK, Sharma PD, Dhanjal GS. Validity of PRISM score in prediction of mortality in North Indian pediatric intensive care unit. Indian J Child Health. 2014;1:105–8. [Google Scholar]