

Abstract
MYB transcription factors play important roles in different plant biological processes during plant growth, development and stress response. In this study, 101 (DoMYB1-101) and 99 (PaMYB1-99) R2R3-MYB genes were identified in the genomes of Dendrobium officinale and Phalaenopsis aphrodite, respectively. To classify the isolated candidate genes, the R2R3-MYB genes from A. thaliana were selected as references. As a result, all identified DoMYB and PaMYB genes were classified into 22 subfamilies. Phylogenetic analysis revealed that S21 had the largest number of members of all the subfamilies. The numbers of introns, exons and conserved sequences in all of the identified genes are different. In addition, 20 DoMYB genes from six subfamilies were selected for further analysis of tissue-specific expression and responses to various abiotic stresses treatments. The results showed that all of the DoMYB genes in S4 and S19 subfamilies exhibited the highest relative expression levels in flowers. And five DoMYB genes including DoMYB31, DoMYB40, DoMYB49, DoMYB52 and DoMYB54, responded to the stress response. These results may provide useful information for further studies of the R2R3-MYB gene family.
Keywords: Dendrobium officinale, Phalaenopsis aphrodite, Orchidaceae, R2R3-MYB, Gene family
Introduction
As a superfamily of transcription factors (TFs), MYB proteins comprise one of largest gene families in plants. They play important roles in controlling metabolism regulation and abiotic or biotic responses during the whole processes of plant growth and development (Chen et al., 2005; Du et al., 2012; Dubos et al., 2010; Peng et al., 2016; Nesi et al., 2001). For example, MYB TFs are involved in the regulation of various phytochemical biosynthesis pathways (Adato et al., 2009). They are closely related to the regulation of several developmental processes, secondary cell wall biosynthesis, the development of stem apical meristems, and the synthesis of plant lignin (Zhong et al., 2008; Kirik et al., 1998).
The MYB gene was firstly identified in maize and then successively isolated from many other plants. MYB TFs contained a highly conserved DNA binding domain (R) with 50 to 53 amino acids and a conserved tryptophan at every 18 amino acids. Based on the number of special R domains, MYB TFs can be divided into four categories, namely, R1R2R3-MYB, R2R3-MYB, R1-MYB, and 4R-MYB (Dubos et al., 2010). Among them, R2R3-MYB contains two conserved domains (2R) with five tryptophan residues in the repeat sequence, which forms a helix-turn-helix motif at the N-terminus and plays a vital role in maintaining the stability of the MYB TFs (Rabinowicz et al., 1999; Stracke, Werber & Weisshaar, 2001).
Recently, the R2R3-MYB gene family has been identified in many plants. There are at least 126, 109, 157 and 192 members of R2R3-MYB genes in Arabidopsis thaliana, Oryza sativa, Zea mays and Populus trichocarpa, respectively (Dubos et al., 2010; Du et al., 2012; Katiyar et al., 2012; Wilkins et al., 2009). Clustering analysis of the R2R3-MYB gene family in A. thaliana revealed that the R2R3-MYB genes could be divided into 25 subfamilies (Matus, Aquea & Arce-Johnson, 2009; Stracke, Werber & Weisshaar, 2001). Of all these subfamilies, the S4 subfamily was involved in the synthesis of various alkenes in Oil palm (Li et al., 2017a; Li et al., 2017b). The S6 subfamily was proved to be closely related to the synthesis of carotenoids and anthocyanins (Li et al., 2017a; Li et al., 2017b). The S7 subfamily was demonstrated to play a regulatory role in the terpenoid synthesis pathway in A. thaliana and M. spicata (Reddy et al., 2017; Stracke et al., 2007).
The orchid species are widely distributed in the world. For their ornamental value and medical use, four species of Orchidaceae including Apostasia shenzhenica, Vanilla fragrans, Phalaenopsis aphrodite and Dendrobium officinale have completed the whole genome sequencing (Zhang et al., 2017). Further biological evolution analysis revealed that orthologous genes might contribute to evolutionary innovations of nonfunctional, subfunctional or new functional genes after the evolutions of common ancestors for plants (Riechmann et al., 2000). MYB TFs are involved in all aspects of plant development and metabolism. Nevertheless, the reports on MYB TFs in orchids are few. In this study, the R2R3-MYB gene families were identified from D. officinale (DoMYB) and P. aphrodite (PaMYB). The analysis of the classification, phylogenetics, and chromosomal distribution was conducted. Otherwise, the expression patterns of the DoMYB genes were analyzed. The results may provide novel insights into the roles of MYB transcription factors in D. officinale, P. aphrodite, and other orchid plants.
Materials & Methods
Identification and classification of R2R3-MYB genes in D. officinale and P. aphrodite
The genomes of D. officinale (https://www.ncbi.nlm.nih.gov/bioproject/262478) and P.aphrodite (http://orchidstra2.abrc.sinica.edu.tw/orchidstra2/padownload.php) were downloaded to identify the candidate R2R3-MYB genes as previously described by Cao et al. (2016). Specifically, the Hidden Markov Model (HMM) in Pfam2 database was used to generate conserved domains (PF00249). It was then used to blast against the genome (E-value <1e−3) to obtain candidate R2R3-MYB genes. All candidate sequences were confirmed with the SMART tool (http://smart.embl-heidelberg.de). The uncertain R2R3-MYB proteins were filtered out. For further analysis of the phylogenetic relationships for the R2R3-MYB gene members in D. officinale and P. aphrodite, a phylogenetic dendrogram was constructed based on the full sequences of candidate proteins using MEGA5.2 software with the neighbor-joining (NJ) method. In detail, a phylogeny test was performed using the bootstrap method with 1000 replicates, substitution with the Possion model, and Gaps/Missing Data treatment with pairwise deletion. The uniform rates were used as the rates among sites. The number of threads is 7 (Tamura et al., 2011). The gap open and gap extend are -2.9 and 0, respectively. According to the classification of MYB subfamily in A. thaliana, the R2R3-MYB gene members were eventually divided into 25 subfamilies (Matus, Aquea & Arce-Johnson, 2009; Stracke, Werber & Weisshaar, 2001).
Intron-exon structure and domain analysis of R2R3-MYB genes from D. officinale and P. aphrodite
The Gene Structure Display Server 2.04 (GSDS) was used to analyze the exons-introns structures of the obtained full sequences (Cao et al., 2016, Guo et al., 2007). The MEME suite (Multiple Expectation Maximization for Motif Elicitation, version 5.1.0) was employed to analyze the conserved motif (Bailey et al., 2006). The parameters were set as follows, 0 or 1 occurrence per sequence to be distributed in sequences; maximum number of motifs to find, 8; minimum width of motif, 6; maximum width of motif, 100; and the motif must be present in all members within the same subgroup. Subsequently, MAST XML output was used to analysis protein databases and finally redraw motif pattern. The annotations of the conservative patterns were performed using Pfam and SMART.
Calculations of synonymous substitutions (Ks) and nonsynonymous substitutions (Ka)
According to the phylogenetic tree, two sequences of candidate genes with similar genetic relationships were isolated. The gene pairs were compared using DNAMAN software. Gene pairs with a consistency greater than 60% were selected for the calculation of Ka (non-synonymous substitution) and Ks (synonymous substitution). The values of Ka∕Ks, Ka, and Ks were calculated using DnaSP 5.0 software (Librado & Rozas, 2009). A Ka∕Ks ratio of 1.0 has been suggested to be a useful cut-off value to identify genes under positive selection. Generally, Ka∕Ks < 1.0 indicates purifying or negative selection. Ka∕Ks = 1.0 shows neutral selection, and Ka∕Ks > 1.0 means positive selection (Zhang et al., 2006).
R domain and gene ontology (GO) annotation analysis
The sequences of the R2 and R3 domains of 101 DoMYBs and 99 PaMYBs were aligned using MEGA 5.0 to identify their features in the sequences. The multiple alignment files for these domains were submitted to WebLogo (http://weblogo.berkeley.edu/logo.cgi) using the default settings to acquire sequence logos as previously described by Cao et al. (2016). The protein sequences of DoMYBs and PaMYBs were aligned to the NCBI non-redundant protein database by BLASTp using Blast2GO software with the default parameters (Conesa et al., 2005). The functions of the R2R3-MYB proteins were predicted by GO annotation analysis. The GO classifications were performed using the WEGO online tool (Ye, 2006).
Physical distribution of PaMYB genes in chromosomes
To understand the chromosomal location of PaMYBs, the GFF (General Feature Format) file containing the P. aphrodite chromosome information was downloaded from the website (http://orchidstra2.abrc.sinica.edu.tw/orchidstra2/pagenome.php) (Chao et al., 2018). MapInspect software was used to visualize physical location information. DNAMAN was used to compare the similarity of the PaR2R3-MYB cluster.
Bioinformatics analysis of R2R3-MYB genes expression in D. officinale
The transcriptome of D. officinale were downloaded from the NCBI SRA database with the accession number PRJNA348403. Clean reads were obtained by removing the low-quality base calls (Q<20) using FASTX-toolkit (http://hannonlab.cshl.edu/fastx_toolkit), then mapped to the reference genome using TopHat2 software with the default parameters and assembled using Cufflinks software (Kim et al., 2013; Trapnell et al., 2012). The expression profiles were presented using MeV 4.9 with Pearson correlation using average linkage clustering.
To verify the transcriptome data, 20 genes were selected to perform qRT-PCR analysis. Three biological repeats were conducted. The average data was used to construct heatmap by MeV 4.9 with Pearson correlation using average linkage clustering.
A co-expression network of 20 DoMYB genes in response to five different treatments was constructed based on the Pearson correlation coefficients (PCCs). It was better to understand the topological relationships between stress-responsive DoMYB genes. All of the available gene expression data were averaged, and the PCC was calculated between any pair of 20 genes (Tang et al., 2013). All 20 genes were selected to evaluate a co-expression network based on the PCCs at a 0.05 significance level (p-value) using Cytoscape 3.3 (http://www.cytoscape.org).
Expression analysis R2R3-MYB genes under different treatments in D. officinale
One-year-old plantlets of D. officinale were cultivated in an incubator at 25 °C with 12 h light and 12 h dark. The protocorms of D. officinale were cultivated at 25 °C in the dark. For the stress treatment, an equal mass protocorm of the same period was placed in MS liquid medium with an additional 300 mM NaCl, 300 mM mannitol and 100 µM abscisic acid (ABA), respectively. Then, protocorms with the same quality were collected at 0, 1, 2, 3, 4, and 7 d for further experiment. Moreover, for the treatment with hormone, the protocorms with the same size in the same period were cultivated in MS liquid medium additionally containing 100 µM methyl jasmonate (MeJA) and 100 µM salicylic acid (SA), respectively. The protocorms were collected at 0, 2, 4, 8, 24, 48 and 72 h. Protocorms, 0 h cultivated in a different medium, were selected as controls, respectively. Each experiment was repeated three times.
Total RNA was extracted by using RNAprep Pure Plant Kit (Tiangen, China). Primer Premier 5.0 was used to design the corresponding primers of DoMYB (Table S4). The gene β-actin was selected as an internal reference (GeneBank ID: JX294908). The qPCR system consisted of 12.5 µl of SYBR® Premix Ex TaqTM II, 2 µl of cDNA, 2 µl primers and 8.5 µl of ddH2O. The PCR reaction procedure was as follows: 95 °C for 30 s, 95 °C for 5 s, 60 °C for 30 s, 40 cycles (Jin et al., 2013). The relative expression level of genes was calculated using the 2−ΔΔCt method (Livak & Schmittgen, 2001). Three biological repeats were conducted.
Results
Phylogenetic analysis and classification of the R2R3-MYB genes from D. officinale and P. aphrodite
As was shown in Fig. 1, total of 101 DoMYBs and 99 PaMYBs were identified (Table S1). Then, 126 R2R3-MYB genes from Arabidopsis (AtMYBs) were selected as references to construct the neighbor-joining tree. The results showed that all identified R2R3-MYB genes could be divided into 22 subgroups with the number of members ranging from 1 to 16. Of 22 subgroups, the subfamily S21 contained the most members of R2R3-MYB genes with 16 DoMYBs and 11 PaMYBs, followed by S14 subfamily with 10 DoMYBs and 11 PaMYBs. The subfamily S18 contained 12 DoMYBs and 6 PaMYBs. Interestingly, nine subfamilies, including S1, S3, S4, S9, S13, S16, S17, S19, and S23, contained the same numbers of R2R3-MYBs from both D. officinale and P. aphrodite. For example, both six members of DoMYBs and PaMYBs were divided into S17 subfamily. S1 and S4 subfamilies included both five R2R3-MYBs for D. officinale and P. aphrodite. The subfamily S13 contained four R2R3-MYBs from both D. officinale and P. aphrodite. Otherwise, no R2R3-MYB genes were classified into the subfamilies S6, S12, and S15 from the two Orchidaceae species. So, the distributions of most R2R3-MYB genes were similar between D. officinale and P. aphrodite.
Figure 1. Phylogenetic analysis of R2R3-MYB proteins from Dendrobium officinale and Phalaenopsis aphrodite.

In total, 101 R2R3-MYB proteins from D. officinale, 99 R2R3-MYB proteins from P. aphrodite and 126 R2R3-MYB proteins from A. thaliana were selected to construct the neighbor-joining tree with 1,000 bootstraps. S1-S25 indicated the divided subfamilies according to the categories of R2R3-MYB proteins in A. thaliana.
Gene structure analysis of the R2R3-MYB protein from D. officinale and P. aphrodite
The R2R3-MYB protein sequences of D. officinale and P. aphrodite were used to create a phylogenetic tree using MEGA5.2 software (Fig. 2A and Fig. S1A). The conserved motifs were identified using the MEME tool. The results showed that most of R2R3-MYB proteins in the same subfamily contained similar motifs, which futher verifying the closeness of their evolutionary relationship with the phylogenetic tree (Fig. 2B and Fig. S1B). Nevertheless, motif 3, which didn’t belong to the conserved domain R2 or R3, was included in almost half of R2R3-MYB members in D. officinale and P. aphrodite. Otherwise, the subfamilies S4, S8, S9, S10, S11 and S13, all contained the motif 4 in D. officinale. Furthermore, the gene structure analysis of the R2R3-MYB genes revealed that most of these genes consisted of three exons and two introns (Fig. 2C and Fig. S1C). These results indicated that the intron patterns were highly conserved.
Figure 2. Phylogenetic relationships, intron pattern, and architecture of conserved protein motifs in R2R3-MYB proteins from D. officinale.

(A) The phylogenetic tree constructed with 101 R2R3-MYB proteins from D.officinale. S1-S25 indicated the divided subfamilies. (B) Architecture of conserved protein motifs in different subfamilies. The colored boxes indicated the different motifs as listed at the bottom of the figure. (C) The predicted exon-intron structures. The yellow boxes and black lines exhibited exons and introns, respectively.
Strong purifying selection analysis of the R2R3-MYB genes from D. officinale and P. aphrodite
To examine the selection pressure on the R2R3-MYB genes, 16 gene pairs between P. aphrodite and D. officinale, 19 gene pairs of P. aphrodite and four gene pairs of D. officinale with close genetic affinities were selected to calculate the Ka/Ks ratio. As a result, of 16 gene pairs between two species, 87% showed a rate less than 0.3. Of the 19 gene pairs from D. officinale, 79% exhibited a Ka/Ks ratio between 0 and 0.5, and only four gene pairs scored a Ka/Ks ratio greater than 0.5. Moreover, the Ka/Ks ratios of the four gene pairs from P. aphrodite were between 0 and 1 (Table S2). These results implied that most of the R2R3-MYB gene pairs from D. officinale and P. aphrodite mainly evolved under the influence of purifying selection.
Gene ontology annotation and R domain characteristics analysis the R2R3-MYB genes from D. officinale and P. aphrodite
The functions of the R2R3-MYB proteins were predicted by GO annotation analysis. Based on amino acid similarity, the R2R3-MYB proteins from two Orchidaceae species were classified into three categories: biological process (BP), cellular component (CC), and molecular function (MF) (Table S5, Fig. S2). The majority of the R2R3-MYB proteins from D. officinale and P. aphrodite were enriched in two categories: biological process and molecular function. Only a small portion of the R2R3-MYB proteins was enriched in the cellular component (Fig. S2AC).
To analyze the presence of conserved sequences at particular positions, WebLogo was used to generate sequence logos. As is shown in Fig. 3, A and B indicated the repeats of the R2 and R3 sequences of D. officinale, respectively. C and D showed the repeats of the R2 and R3 sequences of P. aphrodite, respectively. These results indicated that most amino acids are conservatively presented in the R2 and R3 repeats between two Orchidaceae species (Fig. 3). Otherwise, some amino acids are more conservative. For example, tryptophan was identified at the sites approximately per every 18 amino acids. There were three tryptophans in R2 and two in R3.
Figure 3. Sequence logos of the R2 (A&C) and R3 (B&D) MYB repeats.
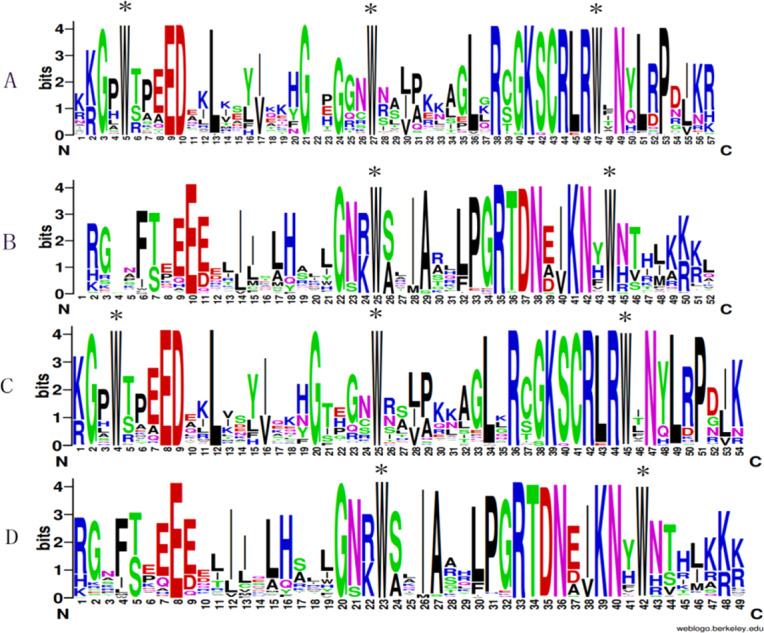
A & B respectively indicate the R2 and R3 logos based on multiple alignment analysis of 101 DoR2R3-MYB proteins. C & D indicate the R2 and R3 logos of 99 PaR2R3-MYB proteins. * indicate typical conserved Trp residues in the MYB domain.
Chromosomal location analysis of the PaMYB genes
To study the relationship between genetic divergence and gene duplication within the R2R3-MYB gene family in P. aphrodite, the locations and distribution of the R2R3-MYB genes were analyzed. As a result, of the 99 PaMYB genes, 85 genes were mapped and distributed in 17 chromosomes of P. aphrodite. The distribution of genes was uneven. Chromosome 9 contained the most R2R3-MYB genes (10 PaMYB genes), followed by chromosome 18, which contained 9 PaMYB genes. The other chromosomes contained R2R3-MYB genes, ranging from 1 to 8, respectively (Fig. S3). In addition, 33 pairs of R2R3-MYB proteins were isolated with similar sequences by using sequence alignment in DNAMAN (Table S6). Of these proteins, two pairs were proved to be segmental duplication for their high similarity values (PaMYB64/PaMYB65, PaMYB73/PaMYB91). PaMYB64 and PaMYB65 have an identical sequence with the same position on chromosome 9 (Table S6). PaMYB73 and PaMYB91 showed a high similarity value of 87.25% (Table S6).
Expression analysis of DoMYB genes in different tissues
The transcriptome data of seven tissues including root tips (RT), roots (RO), stems (ST), leaves (LE), flower buds (FB), columns (CO), and sepals (SP) were downloaded from the NCBI SRA (Sequence Read Archives) database. 65 of 101 DoMYB genes were detected in the transcriptome analysis (Fig. 4). They were clustered into five groups (A–E). Among those groups, 17 genes were classified in group A with relatively high expression levels in roots and/or stems. Four genes in group B displayed low expression levels in various tissues. Out of 65 genes, 22 genes were clustered in group C. They had the highest transcript abundance in the roots and/or root tips. All 12 genes in group D exhibited a high expression levels in columns and/or sepals. The remaining ten genes were all in group E. They had higher expression in flower buds if compared with that in other tissues. Moreover, several genes showed tissue-specific expression patterns. For example, seven genes were only expressed in flowers (DoMYB4, DoMYB12, DoMYB40, DoMYB52, DoMYB58, DoMYB86, DoMYB94), three genes were only expressed in roots (DoMYB6, DoMYB78, DoMYB81) (Table S3).
Figure 4. RNA-seq analysis of R2R3-MYB transcription factors in D. officinale.
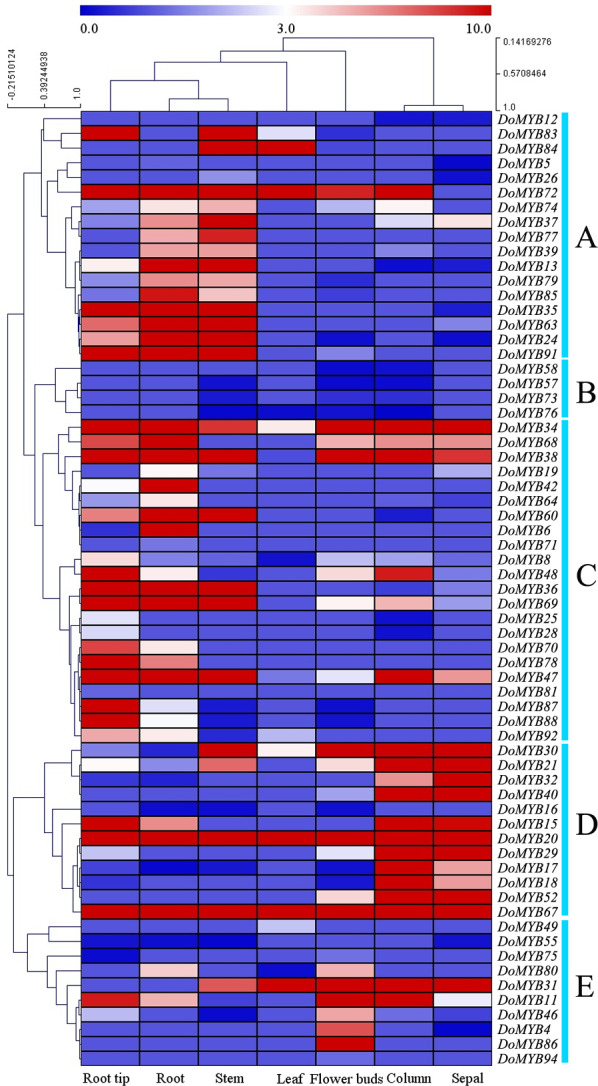
The heatmap was generated using R gplots package, and the FPKM values of D. officinale genes were evaluated and normalized based on RNA-seq data from NCBI SRA database. Differential expression pattern of 65 annotated R2R3-MYBs in various tissues,including root tips (RT), roots (RO), stems (ST), leaves (LE), flower buds (FB),columns (CO), and sepals (SP). The expression values are available in Table S3.
D. officinale is a valuable medicinal plant for its high content of secondary metabolites, including polysaccharides, alkaloids and terpenes. Due to its strict requirements on the growth environment, it usually suffers from various biotic or abiotic stresses during its development and growth. Based on the reported functions of R2R3-MYB in other plants, we screened out 20 DoMYBs belonged to six subfamilies to study the role of R2R3-MYB in the regulation of secondary metabolism and the responses to abiotic stress for D. officinale (Stracke et al., 2007; Adato et al., 2009). Their expression patterns in different tissues (Fig. 5) and under various abiotic stresses were tested (Figs. 6 and 7). Among the five genes of the S1 subfamily, DoMYB30, DoMYB49, and DoMYB101 showed higher expression levels in flowers, DoMYB29 had higher expression levels in protocorms, and DoMYB93 displayed higher expression levels in stems. Otherwise, five genes of the S4 subfamily showed higher expression levels in flowers. Among the S7 subfamily, DoMYB26 had the highest expression level in stems, and DoMYB32 had the highest expression level in flowers. Among the S9 subfamily, DoMYB11 and DoMYB46 had higher expression levels in flowers, and DoMYB31 had higher expression level in stems. In the S19 subfamily, DoMYB40 and DoMYB52 had higher expression levels in flowers. In the S22 subfamily, DoMYB4 and DoMYB8 had higher expression levels in flowers. Otherwise, DoMYB20 had higher expression level in roots. These results are in accord with transcriptome data.
Figure 5. qRT-PCR validation of R2R3-MYB transcription factor genes of D. officinale in different tissues.

Twenty genes were selected to perform qRT-PCR analysis to verify the transcriptome data. Three biological repeats were conducted. The average data were used to construct heatmap by MeV 4.9 with Pearson correlation using average linkage clustering.
Figure 6. Expression patterns of the DoMYB genes in response to drought treatment.

The relative expression levels of 20 DoMYB genes were examined by qRT-PCR and normalized to the reference gene β-actin. Every experiment had three biological repeats. The x-axis indicated the time course of each stress treatment, and the y-axis represented the relative expression level. Mean values and standard deviations (SDs) indicated by error bars. ** significant difference (P < 0.01), *significant difference at P < 0.05. (A) DoMYB4, (B) DoMYB8, (C) DoMYB11, (D) DoMYB20, (E) DoMYB26, (F) DoMYB29, (G) DoMYB30, (H) DoMYB31, (I) DoMYB32, (J) DoMYB40, (K) DoMYB46, (L) DoMYB49, (M) DoMYB52, (N) DoMYB54, (O) DoMYB62, (P) DoMYB67, (Q) DoMYB69, (I) DoMYB72, (S) DoMYB93, (T) DoMYB101.
Figure 7. Expression patterns of the DoMYB genes under salt treatment.

The relative expression level of 20 DoMYB genes was evaluated by qRT-PCR. The gene β-actin was selected as a reference. Every experiment had three biological repeats. The x-axis indicated the time course of each stress treatment, and the y-axis represented the relative expression level. Mean values and standard deviations (SDs) indicated by error bars. ** significant difference (P < 0.01), * significant difference at P < 0.05. (A) DoMYB4, (B) DoMYB8, (C) DoMYB11, (D) DoMYB20, (E) DoMYB26, (F) DoMYB29, (G) DoMYB30, (H) DoMYB31, (I) DoMYB32, (J) DoMYB40, (K) DoMYB46, (L) DoMYB49, (M) DoMYB52, (N) DoMYB54, (O) DoMYB62, (P) DoMYB67, (Q) DoMYB69, (I) DoMYB72, (S) DoMYB93, (T) DoMYB101.
Expression pattern of DoMYB genes in response to abiotic stress in protocorms
To explore the functions of the R2R3-MYB genes in D. officinale, the expression patterns of 20 DoMYB genes were analyzed under drought and salt stress. Multiple genes were upregulated, yet a few genes were downregulated in response to drought and salt stress. DoMYB20, DoMYB29 and DoMYB69 showed downregulated expression patterns under either drought or salt stress. Five DoMYB genes, DoMYB31, DoMYB40, DoMYB49, DoMYB52 and DoMYB54, showed increased expression levels at different times under the drought treatment (Fig. 6). The expression levels of DoMYB31, DoMYB40 and DoMYB54, were significantly increased after one day of treatment. The expression of DoMYB49 increased after seven days of treatment. DoMYB52 exhibited an increased expression level after three days of treatment. Also, DoMYB26, DoMYB31 and DoMYB67 were identified to respond to salt stress (Fig. 7). DoMYB26 had an increased expression level after one day of treatment. DoMYB31 showed an increased expression level with approximately 40-fold after four days of treatment. DoMYB67 exhibited an elevated expression level after seven days of treatment.
Co-expression network analysis of DoMYB genes in different tissues and different treatments
To analyze the relationship of 20 DoMYB genes, a co-expression network was constructed using Cytoscape 3.3. Based on the data of the relative transcript abundance in different tissues under various kinds of treatments, a tissue co-expression network and a post-processing gene co-expression network were constructed to explore the relationship of the MYB genes in D. officinale (Fig. S4A/B). The results showed that the tissue co-expression network contained 17 nodes (DoMYB Genes) and 66 edges (co-expressed gene pairs), representing PCCs between tissue co-expressing events. Moreover, the processed co-expression network contained 16 nodes and 44 edges, representing the handling of PCCs between co-expression events. Each node had a different number of regulatory edges, ranging from 1 to 11.
Discussion
MYB transcription factors (TFs) are a large gene family in plants. Previous studies have identified many MYB genes in Orchidaceae. For example, by RT-PCR, 21 R2R3-MYB genes have been isolated from the Dendrobium orchid hybrid Woo Leng. Four of these genes, DwMYB1, DwMYB2, DwMYB8, and DwMYB10, belong to typical plant R2R3-MYB genes (Wu, Lim & Yang, 2003). Otherwise, three R2R3-MYB transcription factors, including PeMYB2, PeMYB11 and PeMYB12, have been identified and proven to be concomitant with the red color formation in flowers from Phalaenopsis spp (Hsu et al., 2015). Similarly, DhMYB1 has been confirmed to be involved in the development of the conical cell shape of epidermis cells of the Dendrobium hybrid flower labellum (Lau et al., 2015). In this study, 101 DoMYBs and 99 PaMYBs of R2R3-MYB genes were identified from genomic database sequences and classified into 22 subfamilies. In contrast to the R2R3-MYB gene numbers found in other species, the numbers of R2R3-MYB genes in D. officinale and P. aphrodite were less than those in A. thaliana (126), O. sativa (109), Z. mays (157) and P.trichocarpa (192). All of the identified R2R3-MYB genes were divided into different subfamilies. The subfamilies S14, S18 and S21, contained the most MYBs. Nine subfamilies included the same number of R2R3-MYB genes from both D. officinale and P. Aphrodite. There were no R2R3-MYB members found in the S6, S12, and S15 R2R3-MYB subfamilies. These results may imply the special characteristics R2R3-MYB genes in two Orchidaceae species (Fig. 2).
It has been reported that several R2R3-MYB genes are involved in regulating responses to biotic and abiotic stresses. For example, the S1 subfamily genes AtMYB96 and OsMYB4 were confirmed to be involved in the drought response of plants (Seo et al., 2009; Vannini et al., 2004). AtMYB41 and AtMYB102 contribute to plant resistance against wounding and osmotic stress (Denekamp & Smeekens, 2003; Lippold et al., 2009). Overexpression of AtMYB2 can be induced by dehydration and salt stress (Abe et al., 2003). AtMYB62 participates in response to phosphate starvation (Devaiah et al., 2009). Besides, the S22 subfamily gene AtMYB44 has been shown to be induced by drought and high salt. Overexpression of AtMYB44 obviously enhances drought and salt tolerance in plants (Jung et al., 2007). AmMYB1 is related to the enhancement of tolerance to NaCl stress in transgenic tobacco (Ganesan et al., 2012). In this study, 20 R2R3-MYB genes were tested in response to drought and salt stress treatments. Significant changes in the expression levels of all of the members of the S19 subfamily were detected (Figs. 6 and 7). For example, DoMYB40 showed increased expression after one day of drought treatment. Then, the expression level of DoMYB40 gradually decreased. DoMYB52 displayed the highest expression level after three days of treatment. On the other hand, after undergoing NaCl-simulated salt stress, DoMYB40 reached the highest expression level under treatment for three days, after which, its expression level decreased. DoMYB52 expression increased after four days of treatment and decreased after that. These results may imply the vital role of the S19 subfamily members in response to abiotic stress.
Conclusions
In this study, 101 and 99 R2R3-MYB genes were identified from the genomes of Dendrobium officinale and Phalaenopsis aphrodite. They were distributed into 22 subfamilies based on the homologous analysis. To test the function of identified R2R3-MYB genes, the expression pattern analysis of the DoMYB genes from six subfamily members in different tissues revealed that the S4 and S19 subfamily members had the highest gene expression levels in flowers. Besides, determination of expression level of DoMYBs verified that some of them were responsible for the stress response. These results may provide useful information for further studies of the R2R3-MYB gene family.
Supplemental Information
Funding Statement
This work was supported by a scholarship from the China Scholar Council and Anhui Provincial Department of Education (gxfx2017006), Science and Technology Major Project in Anhui province (17030701031) and Anhui Natural Science Foundation (1908085MC59). The funders had no role in study design, data collection and analysis, decision to publish, or preparation of the manuscript.
Contributor Information
Yongping Cai, Email: swkx12@ahau.edu.cn.
Yi Lin, Email: linyi1957@126.com.
Additional Information and Declarations
Competing Interests
The authors declare there are no competing interests.
Author Contributions
Honghong Fan and Manli Cui conceived and designed the experiments, performed the experiments, analyzed the data, prepared figures and/or tables, authored or reviewed drafts of the paper, and approved the final draft.
Ninghong Li and Xujuan Li analyzed the data, prepared figures and/or tables, and approved the final draft.
Yuxuan Liang analyzed the data, prepared figures and/or tables, authored or reviewed drafts of the paper, and approved the final draft.
Lin Liu analyzed the data, authored or reviewed drafts of the paper, and approved the final draft.
Yongping Cai and Yi Lin conceived and designed the experiments, authored or reviewed drafts of the paper, and approved the final draft.
Data Availability
The following information was supplied regarding data availability:
The raw measurements are available in the Supplemental Files.
References
- Abe et al. (2003).Abe H, Urao T, Ito T, Seki M, Shinozaki K, Yamaguchi-shinozaki K. Arabidopsis AtMYC2 (bHLH) and AtMYB2 (MYB) function as transcriptional activators in abscisic acid signaling. The Plant Cell. 2003;15:63–78. doi: 10.1105/tpc.006130. [DOI] [PMC free article] [PubMed] [Google Scholar]
- Adato et al. (2009).Adato A, Mandel T, Mintz-Oron S, Venger I, Levy D, Yativ M, Domínguez E, Wang Z, De Vos RC, Jetter R, Schreiber L, Heredia A, Rogachev I, Aharoni A. Fruit-surface flavonoid accumulation in tomato is controlled by a SlMYB12-regulated transcriptional network. PLOS Genetics. 2009;5:e1000777. doi: 10.1371/journal.pgen.1000777. [DOI] [PMC free article] [PubMed] [Google Scholar]
- Bailey et al. (2006).Bailey TL, Williams N, Misleh C, Li WW. MEME: discovering and analyzing DNA and protein sequence motifs. Nucleic Acids Research. 2006;34(Web Server issue):369–373. doi: 10.1093/nar/gkl198. [DOI] [PMC free article] [PubMed] [Google Scholar]
- Cao et al. (2016).Cao YP, Han YH, Li DH, Lin Y, Cai YP. MYB transcription factors in Chinese pear (Pyrus bretschneideri Rehd.): genome-wide identification, classification, and expression profiling during fruit development. Frontiers in Plant Science. 2016;7:1–14. doi: 10.3389/fpls.2016.00577. [DOI] [PMC free article] [PubMed] [Google Scholar]
- Chao et al. (2018).Chao YT, Chen WC, Chen CY, Ho HY, Yeh CH, Kuo YT, Su CL, Yen SH, Hsueh HY, Yeh JH, Hsu HL, Tsai YH, Kuo TY, Chang SB, Chen KY, Shih MC. Chromosome-level assembly, genetic and physical mapping of Phalaenopsis aphrodite genome provides new insights into species adaptation and resources for orchid breeding. Plant Biotechnology Journal. 2018;16:2027–2041. doi: 10.1111/pbi.12936. [DOI] [PMC free article] [PubMed] [Google Scholar]
- Chen et al. (2005).Chen BJ, Wang Y, Hu YL, Wu Q, Lin ZP. Cloning and characterization of a drought-inducible MYB gene from Boea crassifolia. Plant Science. 2005;168:493–500. doi: 10.1016/j.plantsci.2004.09.013. [DOI] [Google Scholar]
- Conesa et al. (2005).Conesa A, Gotz S, Garcia-Gomez JM, Terol J, Talon M, Robles M. Blast2GO: a universal tool for annotation, visualization and analysis in functional genomics research. Bioinformatics. 2005;21:3674–3676. doi: 10.1093/bioinformatics/bti610. [DOI] [PubMed] [Google Scholar]
- Denekamp & Smeekens (2003).Denekamp M, Smeekens SC. Integration of wounding and osmotic stress signals determines the expression of the AtMYB102 transcription factor gene. Plant Physiology. 2003;132:1415–1423. doi: 10.1104/pp.102.019273. [DOI] [PMC free article] [PubMed] [Google Scholar]
- Devaiah et al. (2009).Devaiah BN, Madhuvanthi R, Karthikeyan AS, Raghothama KG. Phosphate starvation responses and gibberellic acid biosynthesis are regulated by the MYB62 transcription factor in Arabidopsis. Molecular Plant. 2009;2:43–58. doi: 10.1093/mp/ssn081. [DOI] [PMC free article] [PubMed] [Google Scholar]
- Du et al. (2012).Du H, Feng BR, Yang SS, Huang YB, Tang YX. The R2R3-MYB transcription factor gene family in maize. PLOS ONE. 2012;7:e37463. doi: 10.1371/journal.pone.0037463. [DOI] [PMC free article] [PubMed] [Google Scholar]
- Dubos et al. (2010).Dubos C, Strack R, Grotewold E, Weisshaar B, Martin C, Lepiniec L. MYB transcription factors in Arabidopsis. Trends in Plant Science. 2010;15:573–581. doi: 10.1016/j.tplants.2010.06.005. [DOI] [PubMed] [Google Scholar]
- Ganesan et al. (2012).Ganesan G, Sankararamasubramanian HM, Harikrishnan M, Ashwin G, Parida A. A MYB transcription factor from the grey mangrove is induced by stress and confers NaCl tolerance in tobacco. Journal of Experimental Botany. 2012;63:4549–4561. doi: 10.1093/jxb/ERS135. [DOI] [PubMed] [Google Scholar]
- Guo et al. (2007).Guo AY, Zhu QH, Chen X, Luo JC. GSDS: a gene structure display server. Hereditas. 2007;29(8):1023–1026. [PubMed] [Google Scholar]
- Hsu et al. (2015).Hsu CC, Chen YY, Tsai WC, Chen WH, Chen HH. Three R2R3-MYB transcription factors regulate distinct floral pigmentation patterning in Phalaenopsis orchids. Plant Physiology. 2015;168:175–191. doi: 10.1104/pp.114.254599. [DOI] [PMC free article] [PubMed] [Google Scholar]
- Jin et al. (2013).Jin Q, Yao Y, Cai YP, Lin Y. Molecular cloning and sequence analysis of a phenylalanine ammonia-lyase gene from Dendrobium. PLOS ONE. 2013;8:e62352. doi: 10.1371/journal.pone.0062352. [DOI] [PMC free article] [PubMed] [Google Scholar]
- Jung et al. (2007).Jung C, Seo JS, Han SW, Koo YJ, Kim CH, Song SI, Nahm BH, Choi YD, Cheong JJ. Overexpression of AtMYB44 enhances stomatal closure to confer abiotic stress tolerance in transgenic Arabidopsis. Plant Physiology. 2007;146:623–635. doi: 10.1104/pp.107.110981. [DOI] [PMC free article] [PubMed] [Google Scholar]
- Katiyar et al. (2012).Katiyar A, Smita S, Lenka SK, Rajwanshi R, Chinnusamy V, Bansal KC. Genome-wide classification and expression analysis of MYB transcription factor families in rice and Arabidopsis. BMC Genommics. 2012;13:544–562. doi: 10.1186/1471-2164-13-544. [DOI] [PMC free article] [PubMed] [Google Scholar]
- Kim et al. (2013).Kim D, Pertea G, Trapnell C, Pimentel H, Kelley R, Salzberg SL. TopHat2: accurate alignment of transcriptomes in the presence of insertions, deletions and gene fusions. Genome Biology. 2013;14:R36. doi: 10.1186/gb-2013-14-4-r36. [DOI] [PMC free article] [PubMed] [Google Scholar]
- Kirik et al. (1998).Kirik V, Kolle K, Wohlfarth T, Misera S, Baumlein H. Ectopic expression of a novel MYB gene modifies the architecture of the Arabidopsis inflorescence. The Plant Journal. 1998;13:729–742. doi: 10.1046/j.1365-313X.1998.00072.x. [DOI] [PubMed] [Google Scholar]
- Lau et al. (2015).Lau SE, Schwarzacher T, Othman RY, Harikrishna JA. dsRNA silencing of an R2R3-MYB transcription factor affects flower cell shape in a Dendrobium hybrid. BMC Plant Biology. 2015;15:194. doi: 10.1186/s12870-015-0577-3. [DOI] [PMC free article] [PubMed] [Google Scholar]
- Li et al. (2017b).Li WB, Ding ZH, Ruan MB, Yu XL, Peng M, Liu YF. Kiwifruit R2R3-MYB transcription factors and contribution of the novel AcMYB75 to red kiwifruit anthocyanin biosynthesis. Scientific Reports. 2017b;7:16861. doi: 10.1038/s41598-017-16905-1. [DOI] [PMC free article] [PubMed] [Google Scholar]
- Li et al. (2017a).Li R, Reddy VA, Jin J, Rajan C, Wang Q, Yue G, Lim CH, Chua NH, Ye J, Sarojam R. Comparative transcriptome analysis of oil palm flowers reveals an EAR-motif containing R2R3-MYB that modulates phenylpropene biosynthesis. BMC Plant Biology. 2017a;17:219. doi: 10.1186/s12870-017-1174-4. [DOI] [PMC free article] [PubMed] [Google Scholar]
- Librado & Rozas (2009).Librado P, Rozas J. DnaSP v5: a software for comprehensive analysis of DNA polymorphism data. Bioinformatic. 2009;25:1451–1452. doi: 10.1093/bioinformatics/btp187. [DOI] [PubMed] [Google Scholar]
- Lippold et al. (2009).Lippold F, Sanchez DH, Musialak M, Schlereth A, Scheible WR, Hincha DK, Udvardi MK. AtMyb41 regulates transcriptional and metabolic responses to osmotic stress in Arabidopsis. Plant Physiology. 2009;149:1761–1772. doi: 10.1104/pp.108.134874. [DOI] [PMC free article] [PubMed] [Google Scholar]
- Livak & Schmittgen (2001).Livak KJ, Schmittgen TD. Analysis of relative gene expression data using real-time quantitative PCR and the 2(−Delta Delta C(T)) Method. Methods. 2001;25:402–408. doi: 10.1006/meth.2001.1262. [DOI] [PubMed] [Google Scholar]
- Matus, Aquea & Arce-Johnson (2009).Matus JT, Aquea F, Arce-Johnson P. Analysis of the grape MYB R2R3 subfamily reveals expanded wine quality-related clades and conserved gene structure organization across Vitis and Arabidopsis genomes. BMC Plant Biology. 2009;8:83. doi: 10.1186/1471-2229-8-83. [DOI] [PMC free article] [PubMed] [Google Scholar]
- Nesi et al. (2001).Nesi N, Jond C, Debeaujon I, Caboche M, Lepiniec L. The Arabidopsis TT2 gene encodes an R2R3 MYB domain protein that acts as a key determinant for proanthocyanidin accumulation in developing seed. The Plant Cell. 2001;13:2099–2114. doi: 10.1105/TPC.010098. [DOI] [PMC free article] [PubMed] [Google Scholar]
- Peng et al. (2016).Peng X, Liu H, Wang D, Shen S. Genome-wide identification of the Jatropha curcas MYB family and functional analysis of the abiotic stress responsive gene JcMYB2. BMC Genomics. 2016;17(1):251–251. doi: 10.1186/s12864-016-2576-7. [DOI] [PMC free article] [PubMed] [Google Scholar]
- Rabinowicz et al. (1999).Rabinowicz PD, Braun EL, Wolfe AD, Bowen B, Grotewold E. Maize R2R3-MYB genes: sequence analysis reveals amplification in the higher plants. Genetics. 1999;153:427–444. doi: 10.1093/genetics/153.1.427. [DOI] [PMC free article] [PubMed] [Google Scholar]
- Reddy et al. (2017).Reddy VA, Wang Q, Dhar N, Kumar N, Sarojam R. Spearmint R2R3-MYB transcription factor MsMYB negatively regulates monoterpene production and suppresses the expression of geranyl diphosphate synthase large subunit (MsGPPS.LSU) Plant Biotechnology Journal. 2017;15:1105–1119. doi: 10.1111/pbi.12701. [DOI] [PMC free article] [PubMed] [Google Scholar]
- Riechmann et al. (2000).Riechmann JL, Heard J, Martin G, Reuber L, Jiang CZ, Keddie J, Adam L, Pineda O, Ratcliffe OJ, Samaha RR, Creelman R, Pilgrim M, Broun P, Zhang JZ, Ghandehari D, Sherman BK, Yu GL. Arabidopsis transcription factors: genome-wide comparative analysis among eukaryotes. Science. 2000;290:2105–2110. doi: 10.1126/science.290.5499.2105. [DOI] [PubMed] [Google Scholar]
- Seo et al. (2009).Seo PJ, Xiang F, Qiao M, Park JY, Park CM. The MYB96 transcription factor mediates abscisic acid signaling during drought stress response in Arabidopsis. Plant Physiology. 2009;151:275–289. doi: 10.1104/pp.109.144220. [DOI] [PMC free article] [PubMed] [Google Scholar]
- Stracke et al. (2007).Stracke R, Ishihara H, Barsch GHA, Mehrtens F, Niehaus K, Weisshaar B. Differential regulation of closely related R2R3-MYB transcription factors controls flavonol accumulation in differene parts of Arabidopsis thaliana seeding. The Plant Journal. 2007;50:660–677. doi: 10.1111/j.1365-313X.2007.03078.x. [DOI] [PMC free article] [PubMed] [Google Scholar]
- Stracke, Werber & Weisshaar (2001).Stracke R, Werber M, Weisshaar B. The R2R3-MYB gene family in Arabidopsis thaliana. Current Opinion in Plant Biology. 2001;4:447–456. doi: 10.1016/S1369-5266(00)00199-0. [DOI] [PubMed] [Google Scholar]
- Tamura et al. (2011).Tamura K, Peterson D, Peterson N, Stecher G, Nei M, Kumar S. MEGA5: molecular evolutionary genetics analysis using maximum likelihood, evolutionary distance, and maximum parsimony methods. Molecular Biology and Evolution. 2011;28:2731–2739. doi: 10.1093/molbev/msr121. [DOI] [PMC free article] [PubMed] [Google Scholar]
- Tang et al. (2013).Tang J, Wang F, Wang Z, Huang ZN, Xiong AS, Hou XL. Characterization and co-expression analysis of WRKY orthologs involved in responses to multiple abiotic stresses in Pak-choi (Brassica campestris ssp. chinensis) BMC Plant Biology. 2013;13:188. doi: 10.1186/1471-2229-13-188. [DOI] [PMC free article] [PubMed] [Google Scholar]
- Trapnell et al. (2012).Trapnell C, Roberts A, Goff L, Pertea G, Kim D, Kelley DR, Pimentel H, Salzberg SL, Rinn JL, Pachter L. Differential gene and transcript expression analysis of RNA-seq experiments with Tophat and Cufflinks. Nature Protocols. 2012;7:562–578. doi: 10.1038/nprot.2012.016. [DOI] [PMC free article] [PubMed] [Google Scholar]
- Vannini et al. (2004).Vannini C, Locatelli F, Bracale M, Magnani E, Marsoni M, Osnato M. Overexpression of the rice Osmyb4 gene increases chilling and freezing tolerance of Arabidopsis thaliana plants. Plant Journal. 2004;37:115–127. doi: 10.1046/j.1365-313X.2003.01938.x. [DOI] [PubMed] [Google Scholar]
- Wilkins et al. (2009).Wilkins O, Nahal H, Foong J, Provart NJ, Campbell MM. Expansion and diversification of populus R2R3-MYB family of transcription factors. Plant Physiology. 2009;149:981–993. doi: 10.1104/pp.108.132795. [DOI] [PMC free article] [PubMed] [Google Scholar]
- Wu, Lim & Yang (2003).Wu XM, Lim SH, Yang WC. Characterization, expression and phylogenetic study of R2R3-MYB genes in orchid. Plant Molecular Biology. 2003;51:959–972. doi: 10.1023/A:1023050110077. [DOI] [PubMed] [Google Scholar]
- Ye (2006).Ye J. WEGO: a web tool for plotting GO annotations. Nucleic Acids Research. 2006;34(Web Server issue):W293–W297. doi: 10.1093/nar/gkl031. [DOI] [PMC free article] [PubMed] [Google Scholar]
- Zhang et al. (2006).Zhang Z, Li J, Zhao XQ, Wang J, Wong GKS, Yu J. KaKs_Calculator: calculating Ka and Ks through model selection and model averaging. Genomics Proteomics and Bioinformatics. 2006;4:259–263. doi: 10.1016/S1672-0229(07)60007-2. [DOI] [PMC free article] [PubMed] [Google Scholar]
- Zhang et al. (2017).Zhang GQ, Liu KW, Li Z, Lohaus R, Hsiao YY, Niu SC, Wang JY, Lin YC, Xu Q, Chen LJ, Yoshida K, Fujiwara S, Wang ZW, Zhang YQ, Mitsuda N, Wang M, Liu GH, Pecoraro L, Huang HX, Xiao XJ, Lin M, Wu XY, Wu WL, Chen YY, Chang SB, Sakamoto S, Ohme-Takagi M, Yagi M, Zeng SJ, Shen CY, Yeh CM, Luo YB, Tsai WC, Van de Peer Y, Liu ZJ. The Apostasia genome and the evolution of orchids. Nature. 2017;549:379–383. doi: 10.1038/nature23897. [DOI] [PMC free article] [PubMed] [Google Scholar]
- Zhong et al. (2008).Zhong RQ, Lee CH, Zhou JL, McCarthy RL, Ye ZH. A battery of transcription factors involved in the regulation of secondary cell wall biosynthesis in Arabidopsis. The Plant Cell. 2008;20:2763–2782. doi: 10.1105/tpc.108.061325. [DOI] [PMC free article] [PubMed] [Google Scholar]
Associated Data
This section collects any data citations, data availability statements, or supplementary materials included in this article.
Supplementary Materials
Data Availability Statement
The following information was supplied regarding data availability:
The raw measurements are available in the Supplemental Files.