

Abstract
Sodium bicarbonate (NaHCO3) slows the decline in kidney function in patients with chronic kidney disease (CKD), yet the mechanisms mediating this effect remain unclear. The Dahl salt-sensitive (SS) rat develops hypertension and progressive renal injury when fed a high salt diet; however, the effect of alkali loading on kidney injury has never been investigated in this model. We hypothesized that NaHCO3 protects from the development of renal injury in Dahl salt-sensitive rats via luminal alkalization which limits the formation of tubular casts, which are a prominent pathological feature in this model. To examine this hypothesis, we determined blood pressure and renal injury responses in Dahl SS rats drinking vehicle (0.1 M NaCl) or NaHCO3 (0.1 M) solutions as well as in Dahl SS rats lacking the voltage-gated proton channel (Hv1). We found that oral NaHCO3 reduced tubular NH4+ production, tubular cast formation, and interstitial fibrosis in rats fed a high salt diet for 2 weeks. This effect was independent of changes in blood pressure, glomerular injury, or proteinuria and did not associate with changes in renal inflammatory status. We found that null mutation of Hv1 also limited cast formation in Dahl SS rats independent of proteinuria or glomerular injury. As Hv1 is localized to the luminal membrane of TAL, our data suggest that alkalization of the luminal fluid within this segment limits cast formation in this model. Reduced cast formation, secondary to luminal alkalization within TAL segments may mediate some of the protective effects of alkali loading observed in CKD patients.
Introduction
In response to evidence from a number of small clinical trials as well as experimental models which have provided evidence that correction of metabolic acidosis may slow the decline in kidney function [1–4], oral sodium bicarbonate (NaHCO3) therapy is now common in chronic kidney disease (CKD) patients. Despite growing clinical use, there are relatively few published studies aimed at understanding the underlying physiological mechanisms mediating the beneficial actions of NaHCO3 treatment on the kidney.
Chronic kidney disease encompasses a diverse range of pathological processes that lead to prolonged reductions in renal function. The Dahl salt-sensitive rat model is a model of salt-sensitive hypertension and progressive renal injury. Importantly, the Dahl salt-sensitive rat model shares a number of pathological phenotypes observed commonly in the African-American population in which salt-sensitivity is prevalent and the risk of developing CKD is significantly greater than in whites [5], including insulin resistance and a low renin form of hypertension [6–10]. The Dahl salt-sensitive rat also develops marked and progressive renal disease following a high salt intake, which is characterized by glomerular sclerosis, medial-intimal vascular thickening, and the formation of numerous tubular proteinaceous casts [11]. As such, the Dahl salt-sensitive rat model provides a unique, naturally occurring, genetic model of progressive renal injury, which may be of particular relevance to the high-risk hypertensive black population.
Despite its wide use as a model of salt-sensitivity and progressive renal disease, the effect of alkali loading on kidney injury in the Dahl salt-sensitive (SS) rat has never been directly investigated. As the mechanisms through which alkali loading may mediate a protective effect on the kidney are still relatively poorly understood, and may differ between experimental models, in the current study, we investigated the effect of oral NaHCO3 loading on blood pressure and renal disease progression in the Dahl SS rat model. As tubular casts are a prominent pathological feature in this model, and precipitation of filtered proteins within the tubular lumen may be enhanced under acidic conditions [12], we hypothesized that NaHCO3 protects from the development of renal injury in Dahl salt-sensitive rats via luminal alkalization which limits tubular cast formation. To examine this hypothesis, we determined blood pressure and renal injury responses in Dahl SS rats following two interventions that would alkalinize the tubular lumen via alternative mechanisms. First, we compared blood pressure and renal injury in Dahl SS rats drinking vehicle (0.1 M NaCl) or NaHCO3 (0.1 M) solutions which would promote both systemic and urinary alkalization. Second, we compared these same parameters in wild-type and Hv1−/− mutant Dahl SS rats, which lack the voltage-gated proton channel (Hv1). As Hv1 promotes proton extrusion from cells and is localized to the luminal membrane of TAL, we predicted that loss of this channel would result in alkalization of the luminal fluid within the thick ascending limb segment and limit protein precipitation and subsequent cast formation in the absence of systemic alkalization. To exclude the possibility that changes in renal hemodynamics or inflammation were responsible for the protective effects of NaHCO3 loading, we measured renal arterial blood velocity, proteinuria, and the polarization (inflammatory/anti-inflammatory) of renal macrophages.
Methods
Animals
Studies used 8–10-week-old male Dahl SS rats obtained from Charles River laboratories (Wilmington MA; where noted) or, when comparing wild-type and Hv1−/− rats, from an in house colony at Augusta University (derived from the Dahl SS rat stain at the Medical College of Wisconsin). Rats were maintained ad libitum on water and a pellet diet containing low 0.4% NaCl (AIN76A; Dyets Inc; Bethlehem PA (LS)). All studies were conducted in accordance with the National Institutes of Health (NIH) Guide for the Care and Use of Laboratory Animals. All of the protocols were approved in advance by the institutional animal care committee at Augusta University. Upon receipt from Charles River Inc., rats were allowed to acclimatize in our animal facility for 1 week prior to surgeries being performed. All rats were initially maintained on a low Na+ diet. All protocols were initiated at least 7 days after surgery to allow time for rats to recover.
Treatment protocol
The treatment protocol, experimental groups entering the protocol and the measurements performed on each group are outlined in Figure 8. To determine the effect of NaHCO3 on renal injury in the Dahl SS rat model, either NaHCO3 or equimolar NaCl was given to high salt fed rats via the drinking water. All rats were initially maintained on LS chow and ad libitum tap water. At the beginning of the experimental protocol, tap water was replaced with water containing either 0.1 M NaHCO3 (Sigma) or equimolar (NaCl 0.1 M) that was made fresh daily and administration maintained for the remainder of the protocol. Following 3 days of treatment, rats were placed in metabolic cages for a 24-h urine collection. The following day, rats were placed on an 8% high salt diet (AIN76A 8%; Dyets; HS) which was maintained for a further 2 weeks. Additional 24-h urine collections were obtained on day 7 and 14 of HS feeding. Following 14 days of HS feeding, rats were anesthetized with isoflurane (2–5%) and tissue harvested for histology and biochemical analysis.
Figure 8. Outline of experimental protocols.
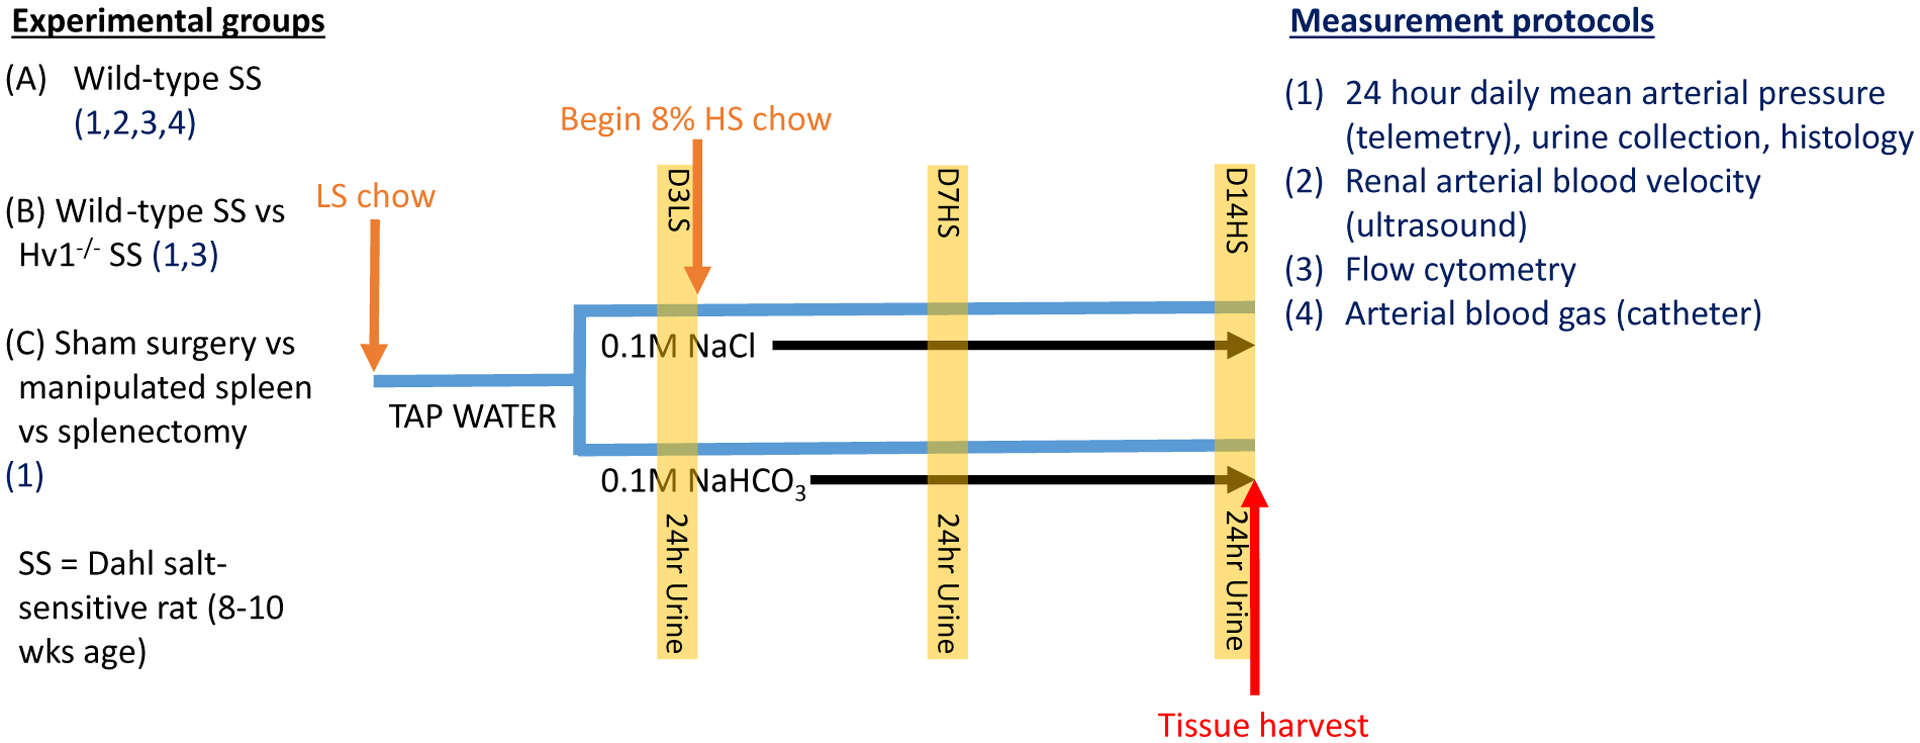
A–C list the comparisons between animal group experiments. Listed with each experimental group (1–4) are the experimental protocols performed on that group. All groups underwent the same treatment protocol outlined in the diagram. All rats were 8–10 weeks old upon entering the protocol and were initially maintained on low salt (LS) chow and tap water. Rats were then switched to either vehicle (0.1 M NaCl) or sodium bicarbonate (0.1 M NaHCO3) instead of tap water. On day 3 of low salt feeding (D3LS) and following 2 days of drinking treated water, a 24-h urine collection was performed (highlighted column; protocol 1 only). Rats were then switched to an 8% high salt (HS) diet for the remainder of the protocol. 24-h urine collections were obtained on day 7 of high salt (D7HS) and day 14 of high salt (D14HS) feeding. Following day 14 of high salt feeding rats were humanely killed and tissue harvested (red arrow); SS, salt-sensitive.
Blood pressure measurement
Rats were anesthetized (2–5% isoflurane) and blood pressure telemeters (Data Sciences International, St Paul, MN) surgically implanted according to the manufacturer’s instructions. Rats were allowed to recover for 1 week before beginning blood pressure recordings. During experimental protocols, blood pressure was recorded from the abdominal aorta 24 h daily in 10-min intervals and mean pressures over 24 h were reported.
Arterial blood gas measurements
Arterial blood gas and plasma electrolyte responses (including, pH, pCO2, pO2, HCO3−, Hct, Na, K, Cl, and glucose) were measured in a separate set of rats. Dahl SS rats obtained from Charles River Laboratories were anesthetized (2–5% isoflurane) and the left femoral artery was catheterized. Surgically implanted catheters were then tunneled under the skin and exposed between the shoulder blades. Catheters were protected by a light wire spring attached to a swivel (Instech Laboratories Inc, Plymouth Meeting, PA), which allows free 360-degree movement of the animal. Rats were individually housed and allowed to recover for 1 week before beginning experimental measurements. Catheters were filled with heparinized saline (30 U/ml) and connected to an infusion pump (Phd2000, Harvard Apparatus, Holliston, MA). Infusions of heparinized saline were maintained at 100 μl/h over the course of the protocol. Arterial blood samples (0.2 ml) were taken prior to placing rats on treated water, on day 3 of LS feeding and on day 7 of HS feeding by disconnecting the catheter from the infusion pump proximal to emergence of the catheter from the rat and drawing arterial blood into a heparinized 1 ml of syringe. Arterial blood gas measurements were performed on a Rapidpoint 4055 Blood gas analyzer (Seimens AG, Munich Germany) within 20 min of taking the sample. Arterial blood gas measurements on day 14 of HS feeding were taken at the time of killing by left ventricular puncture immediately after induction of anesthesia with isoflurane (2–5%).
Urinary analysis
Urine collection
For urine collection, rats were placed in metabolic cages for 24 h (Nalgene, Rochester, NY). Urine was collected and weighed for volume determination. Up to 10 ml of urine was stored at −80°C for later analysis. All urinary data are presented as 24-h urinary excretion.
NH4+ excretion
Urinary NH4+ concentration was determined using an ammonia ion selective electrode (Orion high performance ammonia ion selective electrode; Thermo Fischer Scientific Inc.). Urine samples were diluted in Orion ionplus Solution Alkaline Reagent immediately before measurement as per the manufacturer’s instructions. Measurements were compared with those of a standard curve using serial dilutions of the Thermo Scientific Orion Application Solution 0.1 M NH4+ Ammonium Standard. Final concentrations were calculated using a logarithmic curve (Graphpad Prism 6; Graphpad software Inc, La Jolla, CA).
Proteinuria
Urinary protein concentration was determined by standard Bradford assay (Bio-Rad, Hercules, CA)
Measurement of renal arterial blood velocity
Ultrasound measurement of renal arterial blood velocity, an index of renal blood flow, was performed in a separate group of rats. Ultrasound was performed as described previously [13]. In brief, on the day of measurement rats were anesthetized with isoflurane (2–5%) and imaged in a supine position on a SA-11283 rat platform with integrated temperature sensor, heater, and ECG electrodes (VisualSonics, Toronto, Ontario, Canada). Rectal temperature was maintained at 37.5°C by a UV heating lamp. Depilatory cream (Nair, Ewing, NJ) was used to remove fur from the region of interest and medical ultrasound acoustic gel (Other-Sonic, Pharmaceutical Innovations, Newark, NJ) was used as a coupling fluid between the real-time microvisualization (RMV) scanhead and the skin. Ultrasound imaging was performed using the Vevo 770 system (VisualSonics, Toronto, ON, Canada). Using B-mode imaging, the RMV-716 scanhead was positioned and held immobile using the VisualSonics Vevo Integrated Rail System II to view the rat kidney. Renal artery blood velocity was measured using pulse-wave Doppler (PW-mode). Following a brief stabilization period, several measurements of pulse-wave Doppler blood velocity were obtained from the left renal artery and the mean velocity from all measurements recorded.
Histological analysis
Tissue harvest and fixation
At the end of the study, rats were anesthetized with isoflurane (2–5%), the left and right renal arteries ligated and both kidneys excised. Kidneys were decapsulated, bisected, and placed in 10% formalin solution (Sigma; St Louis, MO) for 48 h before being paraffin embedded, blocked, and processed (Augusta University Core facility).
Assessment of tubular casts
For assessment of tubular cast area, paraffin embedding sections were stained with Gomori’s Trichrome (Gomori’s Trichrome stain kit blue collagen, Richard-Allan Scientific, MI) as per the manufactures’ instructions. In brief, rat kidney sections (5 μm) were deparaffinized and hydrated with deionized water. Sections were then placed in Bouin’s Fluid at 56°C for 1 h. Sections were first stained in Weigert’s iron hematoxylin for 10 min, then stained in Trichrome for 15 min. Sections were then placed in 1% acetic acid solution for 1 min before being rinsed in deionized water, dehydrated, cleared, and mounted. Five nonoverlapping images were taken of each section at low power (5 magnification; (1 papilla region, 2 separate outer medulla regions, 2 separate cortex regions)) using an Olympus×BX40 microscope equipped with an Olympus DP72 camera and Olympus CellSens standard software (Olympus Inc, Japan). At this magnification, all of the medulla and most of the cortex were imaged. Images were then blinded to the investigator and sections were analyzed using MetaMorph offline software (Molecular Devices, Sunnyvale, CA) by color threshold for protein cast as data are expressed as % thresholded area of total tissue area.
Glomerular sclerosis
Gomori’s trichrome stained sections were blinded to the investigator and then scored by a renal pathologist as the % of glomeruli indicating sclerosis.
Fibrosis
Renal tissue fibrosis was determined using a Sirius Red/Fast Green Collagen Staining Kit (Chondrex Inc; Redmond, WA), according to the manufactures’ instructions. In brief, thick 15-μm sections were deparaffinized and hydrated with distilled water. Approximately 200 μl of dye solution was utilized to completely immerse the tissue sections. Sections were then incubated at room temperature in a moist chamber for 30 min. Sections were then rinsed with distilled water before adding 1 ml of dye extraction buffer to elute the dye from the tissue section. The eluate was collected into a 1.5 ml of disposable cuvette and read using a spectrophotometer (Genesys 10S UV-Vis spectrophotometer; Thermo Fischer Scientific Inc.) at OD 540 and 605 nm to determine collagen (an index of fibrosis) and non-collagenous proteins respectively. Data are expressed as collagen/non-collagenous proteins according with the manufacture’s instructions.
Effect of Hv1 on intracellular pH in isolated perfused thick ascending limb
As we suspected NaHCO3 was acting to limit cast formation in Dahl SS rats by alkalinizing the tubular lumen of the thick ascending limb, we investigated whether an alternative approach to promote luminal alkalization would have a similar effect. As Hv1 promotes proton efflux from cells and, within the kidney, Hv1 is localized to the luminal membrane of TAL, we hypothesized that loss of this channel would promote luminal alkalization and prevent cast formation. To confirm that Hv1 promotes H+ efflux in perfused TAL, we measured intracellular pH changes in isolated perfused TAL from wild-type and Hv1−/− Dahl SS rats in response to addition of extracellular NH4Cl. NH4Cl is normally present in the luminal fluid, and due to its rapid uptake in actively transporting TAL, promotes cellular acidification in this segment [14]. LS fed wild-type and Hv1−/− Dahl SS rats (Augusta University) were anesthetized with isoflurane (2–5%), the kidney perfused with chilled Hank’s balanced salt solution (HBSS) pH 7.4 (20 mM HEPES) and isolation of mTAL tissue strips performed as described previously [15]. Renal thick ascending limb were dissected from the inner stripe of the outer medulla, placed on a glass coverslip coated with the tissue adhesive Cell-Tak (BD Biosciences, Bedford, MA). After loading with 2’,7’-bis-(2-carboxyethyl)-5-(and-6)-carboxyfluorescein (BCECF: 6 μmol/l) in Hank’s balanced salt solution for 1 h at room temperature, coverslips were transferred to an imaging chamber mounted on the stage of an inverted microscope (IX81 Olympus) that was maintained at 37°C (Warner Instruments) and allowed the rapid exchange of superfusion buffer. Glass pipettes (Drummond Scientific, Broomail, PA) were pulled to an internal diameter of 8–14 μm. The tip of these micropipettes was beveled and smoothed and mounted on a micromanipulator (World Precision Instruments) on the microscope stage. As our laboratory [16] has previously described, a micropipette was inserted into the open lumen of the mTAL, and the tubule was perfused with HBSS (pH 7.40) at ~10 nl/min. The signal was detected using a high-resolution digital camera (Photometrics Evolve, Roper Scientific). Excitation was provided by a Sutter DG-4 175W xenon arc lamp (Sutter Instruments) that allowed high-speed excitation wavelength switching. Regions of interest containing mTAL epithelial cells were selected within each TAL to quantify changes in fluorescent intensity of the BCECF dye using Metafluor imaging software (Universal Imaging). A BCECF fluorescence lens kit was utilized to collect the fluorescent signal (Chroma Technology Corp., Bellows falls, VT). Following perfusion with HBSS to stimulate transport activity, florescent signals were recorded for 200 s before exchanging the bath solution (HEPES buffered HBSS, pH 7.40) with an identical solution containing 1 mM NH4Cl and fluorescent signals recorded for a further 500 s.
Assessment of effect of NaHCO3 on macrophage polarization in splenic tissue of wild-type and Hv1−/− Dahl SS rats
We recently reported that oral NaHCO3 loading promotes anti-inflammatory M2 macrophage polarization in the spleen, and that these macrophages then infiltrate the kidney [17]. As infiltration of anti-inflammatory immune cells may be renal protective, we examined the effect of NaHCO3 on splenic macrophage polarization in wild-type and Hv1−/− Dahl SS rats. In order to evaluate the effect of NaHCO3 on the inflammatory phenotype of macrophages in wild-type and Hv1−/− Dahl SS rats, we employed a flow cytometry-based strategy as previously described by our group [18–21]. Spleens were harvested from wild-type and Hv1−/− Dahl SS rats at the end of the HS protocol and placed in RPMI + 10% FBS. Spleens were then injected with three 1 ml injections of 100 CD units/ml Collagenase IV (Worthington, Lakewood, NJ, U.S.A.) and placed in 1 ml of 400 CD units/ml Collagenase IV, incubated at 37°C for 30 min and minced. Single-cell suspensions were achieved using a 100 μM cell strainer (BD Biosciences, San Diego, CA) followed by centrifugation (1500 rpm, 10 min) and erythrocytes lysed by incubation with ACK lysing buffer (3 min; catalog no. 10–548E; BioWhittaker, Walkersville, MD, U.S.A.). Cells were then washed twice (10 mM EDTA in Ca/Mg-free PBS).
M1 (inflammatory) macrophages were identified as CD11b/F4/80/TNFα triple positive cells. M2 (regulatory/anti-inflammatory) macrophages were identified as CD11b/CD206/IL10 triple positive cells (Figure 6). Antibodies/reagents utilized are listed in Table 1. Cells were then incubated with antibodies for surface markers for 15 min at 4°C in the dark (all antibodies from Pharmingen-BD-Biosciences, San Jose, CA). Cells were then washed with PBS, fixed, and permeabilized using Cytofix-Cytoperm (eBiosciences, San Diego, CA) for 20 min in the dark at room temperature before incubation with antibodies for intracellular staining of TNFα and IL-10 on ice in the dark for 20 min (BD Biosciences). Cells were then washed and run through a four-color flow cytometer (FACS Calibur, Becton-Dickinson), and data were collected using CellQuest software.
Figure 6. Macrophage polarization in spleens from NaHCO3-treated and Hv1−/− Dahl SS rats.
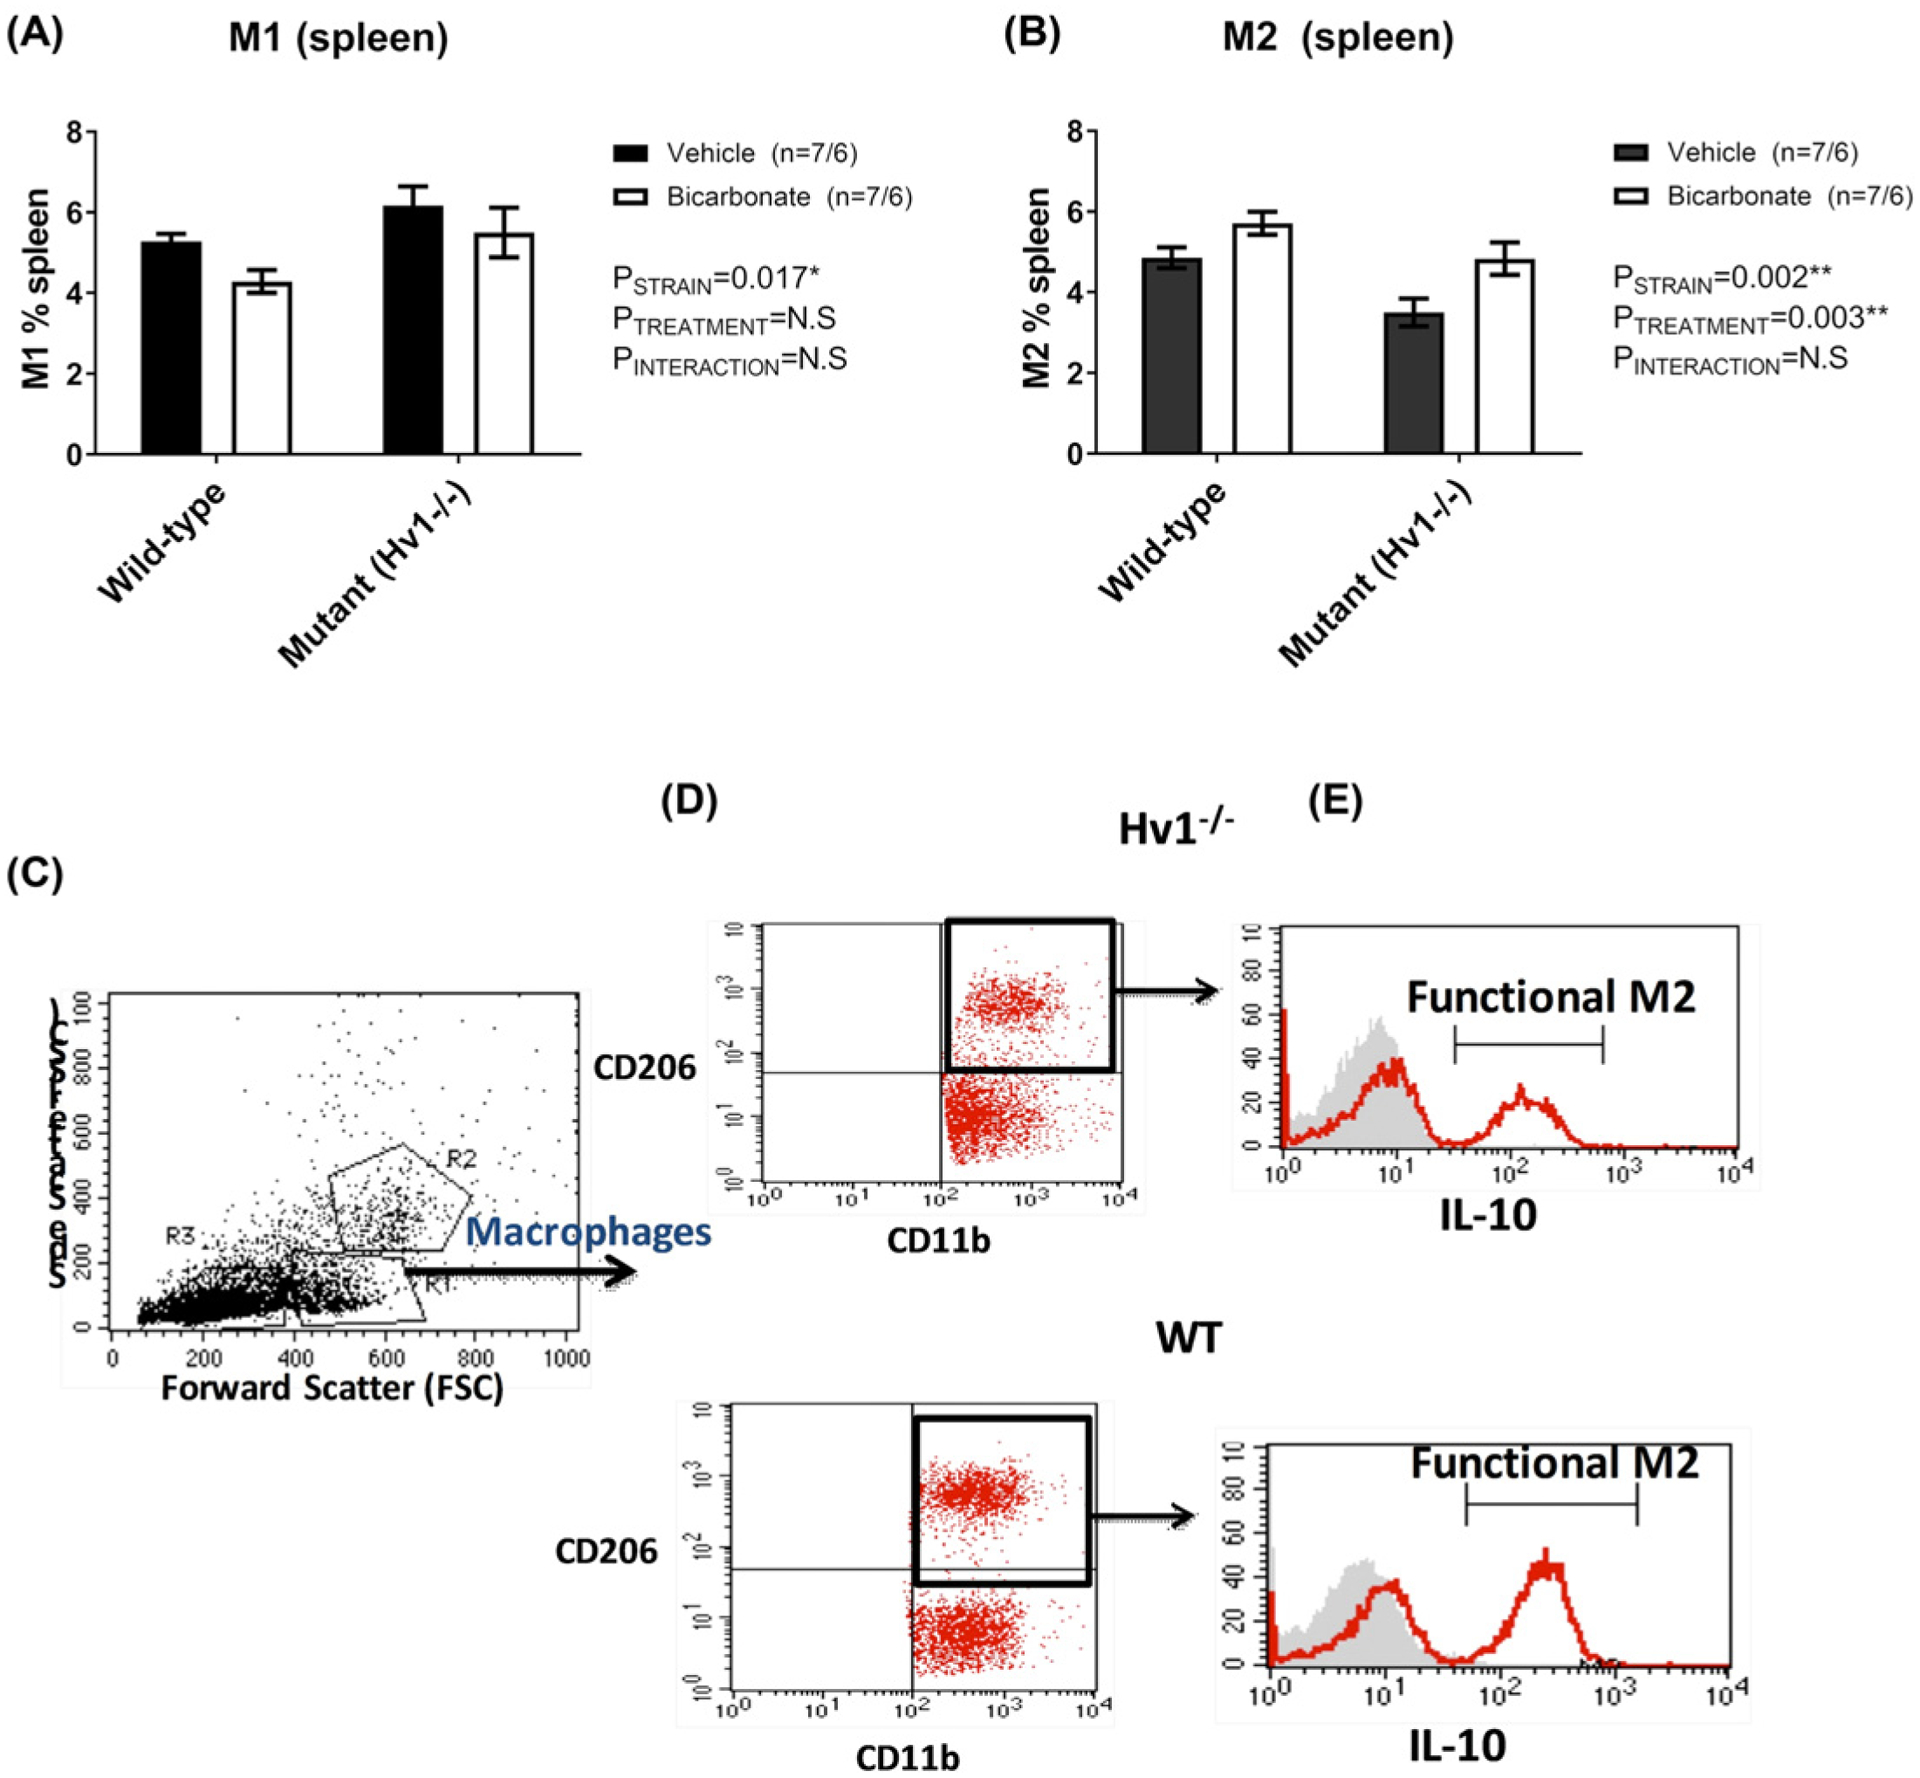
Data from flow cytometric analysis of macrophage polarization (M1/M2), from spleens of male wild-type Dahl SS rats drinking either 0.1 M NaHCO3 (bicarbonate, shaded columns, n=7) or equimolar NaCl (vehicle; open columns; n=7) or male Hv1−/− Dahl SS rats drinking either 0.1 M NaHCO3 (bicarbonate, shaded columns, n=6) or equimolar NaCl (vehicle, open columns, n=6) are presented in Figure 3. Y-axis, percent of splenic macrophages identified as either M1 or M2. X-axis, strain (wild-type or Hv1−/− Dahl SS rats). All data are from rats that were placed on treated water (vehicle or bicarbonate) for 17 days only prior to tissue harvest. Rats were initially maintained on a low salt (0.4%) diet before being transferred to a high salt (8%) diet for 14 days prior to tissue harvest. (A) Percent of total splenic cells identified as M1 macrophages (CD11b/F4/80+/TNFα+ cells) at tissue harvest. (B) Percent of total splenic cells identified as M2 macrophages (CD11b/CD206+/IL10+ cells) at tissue harvest. Flow cytometry analysis (FACS) gating strategy to identify the macrophage subpopulations. Macrophages were gated based on FSC/SSC location (C). Macrophages then gated further to identify the M2 macrophages as CD163+CD206+ (D). Histograms show the expression of IL-10 by M2 macrophages to demonstrate and confirm the activated M2 macrophages (E, the graphs with RED line represent the IL-10 expression while the filled GREY curves show the isotype control)
Table 1.
Reagents/antibodies
| Antibody name | Company | Catalog # | Lot # | Tube amount | Species |
|---|---|---|---|---|---|
| CD11b/c-PE, OX-42 | BD Pharmingen | 554862 | 1.0 ml | anti-rat | |
| CD11b/c-PE, OX-42 | eBioscience | 12-0110-80 | E15919–106 | 125 μl/500 μ1 | α-rat |
| CD206 PerCP/Cy 5.5 | Biolegend | 321122 | B175845 | 0.5 ml | anti-human |
| F4/80-A488, EMRI | Bioss | bs-7058R-A488 | AE084243 | 100 μ1 | rabbit |
| IL-10-Alexa647, CC320 | Novus | NB100–63026AF6477 | 1007–081415 | 250 μ1 | mouse ab |
| TNFα-biotin | Bioss | bs-2081R-biotin | AE081731 | 100 μ1 | rabbit |
| Streptavidin-APC | eBioscience | 17-4317-82 | E07261–1634 | 0.5 ml | |
| Collagenase IV | Sigma (St. Louis, MO) | C5138–500mg | 500 mg | ||
| ACK Lysing Buffer | Quality Biological | 50983220 | 4 × 100 ml |
Samples were double-stained with control IgG and cell markers and were used to assess any spillover signal of fluorochromes; proper compensation was set to ensure that the median fluorescence intensities of negative and positive cells were identical and were both gated populations. Gating was used to exclude dead cells and debris using forward and side scatterplots. In each analysis, 100,000 total events were collected. As a gating strategy, for each sample, isotype-matched controls were analyzed to set the appropriate gates. For each marker, samples were analyzed in duplicate measurements. To minimize false-positive events, the number of double-positive events detected with the isotype controls was subtracted from the number of double-positive cells stained with corresponding antibodies (not isotype control) respectively. Cells expressing a specific marker were reported as a percentage of the number of gated events.
Visualization of the spleen at midline/sham splenectomy: We have recently reported that breaking of fragile mesothelial connections to the spleen by splenic manipulation or total splenectomy, completely abolished the anti-inflammatory effect of NaHCO3 on macrophage polarization in the kidney [17]. Dahl salt-sensitive rats were anesthetized with isoflurane (2–5%) and a midline incision performed. The spleen was either (1) untouched; (2) located and gently moved toward the incision site by hand or with cotton tip applicators, the poles of the spleen visualized, and the spleen returned to its original position; (3) the splenic vessels ligated with silk ties and the spleen removed. The midline incision was then closed and rats allowed to recover. Following the surgical procedures, rats were allowed to recover for 7 days before entering the HS protocol described above.
End-point analysis
For histological scoring (casts, glomerular sclerosis scores), all identifiers were removed and scored by an investigator unaware of the hypothesis being tested. Data were then compiled by the primary investigator who had access to the numbering key. Similarly, identifiers were removed from splenic tissue samples and flow cytometry gating and analysis performed by an investigator who was unaware of the hypothesis being tested. No animals or samples were excluded from any end-point analysis. Rats received from a commercial source (2–3 rats per cage) were randomly allocated to either vehicle or treatment, taking care to allocate at least one animal per cage to each group. Following 1 week of recovery, any animal with a mean arterial blood pressure of greater than 130 mmHg on a LS diet was excluded from further analysis according to prespecified exclusion criteria. One rat was excluded from the study using these criteria prior to any end-point analysis. All data from all other animals that entered the study are included in the analysis.
Statistics
Data were analyzed using GraphPad Prism (GraphPad Inc.) or Microsoft excel (Microsoft corporation, Redmond, WA) software. Blood pressure data were analyzed using two-way repeated measures ANOVA. Multiple comparisons were analyzed using appropriate ANOVA. Specific statistical tests utilized for each analysis are listed in the figure legends. All other comparisons were analyzed via unpaired two-sided Student’s t-test (Microsoft Excel). Significance for all analysis was considered P<0.05.
Results
Effect of high salt diet and NaHCO3 on urinary net acid excretion
HS feeding in Dahl SS rats resulted in increased urinary net acid excretion in rats drinking vehicle, despite the composition of the chow remaining unchanged with the exception of NaCl content (Figure 1). Importantly, this increase in urinary net acid excretion was significantly blunted in rats drinking NaHCO3. Papillary tissue [NH4+] was also significantly reduced in rats drinking NaHCO3 (Figure 1).
Figure 1. Physiological variables in NaHCO3- and NaCl-treated Dahl SS rats.
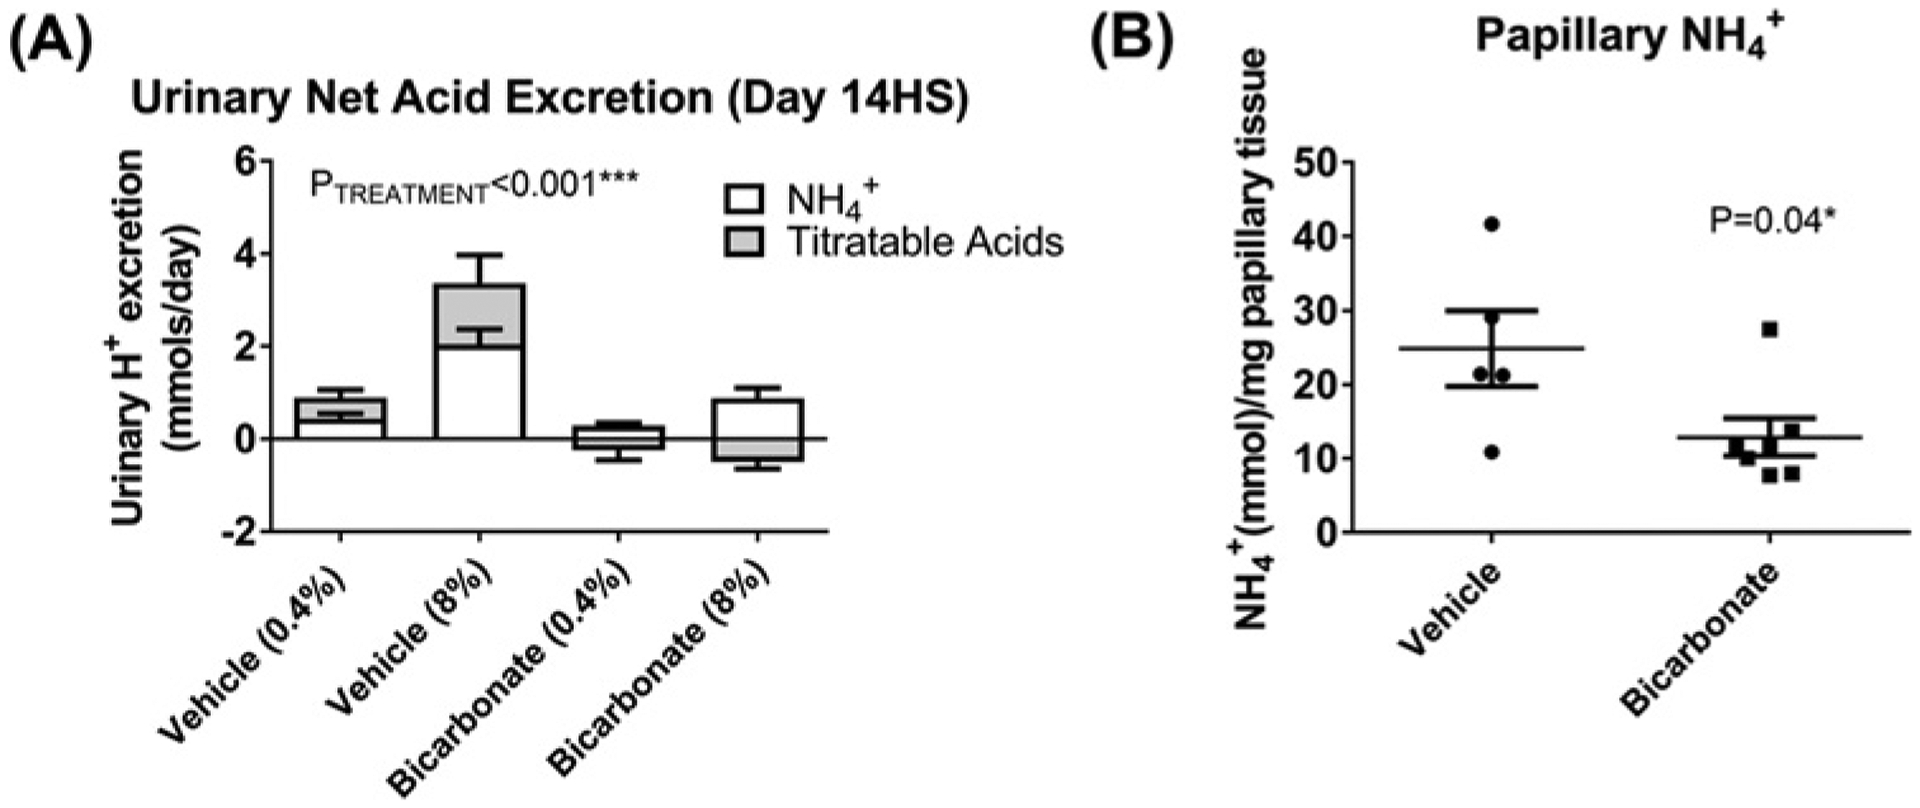
(A) Urinary net acid excretion. Y-axis, 24-h net acid excretion (mmol). Each column is divided into open portions (NH4+ (mmol)) and shaded columns (titratable acid (mmol)). X-axis shows treatment group and time of measurement. Vehicle (0.4%) = vehicle (NaCl in drinking water, n=9) treated animals on day 7 of low salt feeding (7LS); Vehicle (8%) = vehicle (NaCl in drinking water, n=9) treated animals on day 14 of HS feeding (14LS); Bicarbonate (0.4%) = bicarbonate (NaHCO3 in drinking water, n=11) treated animals on day 7 of low salt feeding (7LS); Bicarbonate (8%) = bicarbonate (NaHCO3 in drinking water, n=11) treated animals on day 14 of HS feeding (14LS); Data are mean ± SE; P = results of ANOVA. P<0.05 was considered significant*. (B) Papillary NH +4 content. Y-axis, papillary NH4+ content (mmol) per mg of papillary tissue homogenized; Individual data points are shown with mean ± SE. X-axis, treatment (bicarbonate (n=7) or vehicle (n=5) in drinking water) obtained after 14 days of 8% NaCl feeding (14HS). P = results of unpaired Student’s t-test. P<0.05 was considered significant*.
Effect of high salt diet and NaHCO3 on plasma electrolytes and blood glucose
Addition of NaHCO3 (0.1 M) to the drinking water of Dahl SS rats had no effect on plasma [HCO3−] or pH at any time during the study when compared with NaCl (0.1 M) (Table 2). HS feeding resulted in a significant decrease in plasma [K] in both groups (P<0.001 (ANOVA)) suggesting that the increased acid excretion in these animals may result from hypokalemia (data not shown). Consistent with previous reports in the Dahl SS rat model [8] indicating Dahl SS rats develop insulin resistance when fed an HS diet, plasma glucose increased with HS feeding in Dahl SS rats however, no significant differences in this trend were observed between NaCl- and NaHCO3-treated rats (Table 2).
Table 2.
Blood gas and electrolytes
| Treatment | pH | pCO2 | pO2 | HCO3− | Hct | Na | K | Cl | Glucose | |
|---|---|---|---|---|---|---|---|---|---|---|
| Control | Untreated (n=5) | 7.46 ± 0.00 | 37.4 ± 1.1 | 96.9 ± 2.0 | 26.1 ± 0.5 | 43 ± 1 | 142 ± 1 | 4.12 ± 0.10 | 107 ± 1 | 115 ± 6 |
| Day 3 LS | Vehicle (n=6) | 7.44 ± 0.01 | 33.5 ± 1.1 | 89.4 ± 2.4 | 23.5 ± 0.6 | 39 ± 0 | 135 ± 3 | 3.74 ± 0.38 | 106 ± 0 | 184 ± 36 |
| Bicarbonate (n=8) | 7.43 ± 0.01 | 38.3 ± 1.1* | 93.5 ± 2.4 | 25.2 ± 0.7 | 40 ± 0 | 137 ± 1 | 3.69 ± 0.10 | 112± 2* | 195 ± 25 | |
| Day 7 HS | Vehicle (n=7) | 7.42 ± 0.03 | 44.3 ± 2.6 | 90.6 ± 14 | 26.8 ± 1.2 | 41 ± 1 | 141 ± 1 | 3.47 ± 0.11 | 106 ± 2 | 226 ± 29 |
| Bicarbonate (n=9) | 7.46 ± 0.02 | 39.4 ± 3.2 | 113 ± 16 | 26.9 ± 0.6 | 39 ± 2 | 142 ± 1 | 3.55 ± 0.13 | 106 ± 1 | 160 ± 16 | |
| Day 14 HS | Vehicle (n=6) | 7.42 ± 0.03 | 42.2 ± 5.3 | 85.5 ± 4.5 | 25.5 ± 0.9 | 42 ± 1 | 146 ± 1 | 3.94 ± 0.20 | 101 ± 2 | 272.5 ± 42 |
| Bicarbonate (n=5) | 7.46 ± 0.03 | 37.4 ± 4.9 | 88.7 ± 8.5 | 26.1 ± 1.0 | 41 ± 2 | 145 ± 1 | 3.90 ± 0.19 | 103 ± 3 | 235.4 ± 35 |
All data from blood gas analysis of arterial blood from Dahl salt-sensitive rats drinking either 0.1 M NaHCO3− (bicarbonate) or equimolar NaCl (vehicle) are presented in the table above. pH, plasma pH; pCO2, arterial blood pCO2 (partial pressure(mmHg)); pO2, arterial blood pO2 (partial pressure(mmHg)); HCO3−, arterial blood [HCO3−] (mM) standard (metabolic contribution to the change in bicarbonate); Hct, arterial blood hematocrit (%); Na, arterial plasma [Na+] (mM); K, arterial plasma [K+] (mM); Cl, arterial plasma [Cl−] (mM); glucose, arterial blood [glucose] mg/dl. Groups represent N = 5–9 with absolute numbers for each group are presented in the table (left column). P is the result of unpaired Student’s t-test comparing each treatment group at each individual time point (not data are not repeated measures). P<0.05 was considered significant*.
Hemodynamics indices in NaCl- and NaHCO3-treated Dahl SS rats fed a high salt diet
NaHCO3 had no significant effect on daily mean arterial pressure (Figure 2) or proteinuria (Figure 2) in Dahl SS rats when compared with vehicle. NaHCO3 increased renal arterial blood velocity when animals were fed LS; however, renal arterial blood velocity increased to similar levels in both vehicle- and NaHCO3-treated animals following initiation of an HS diet (Figure 2).
Figure 2. Effect of NaHCO3 on blood pressure and renal injury parameters in Dahl salt-sensitive rats.
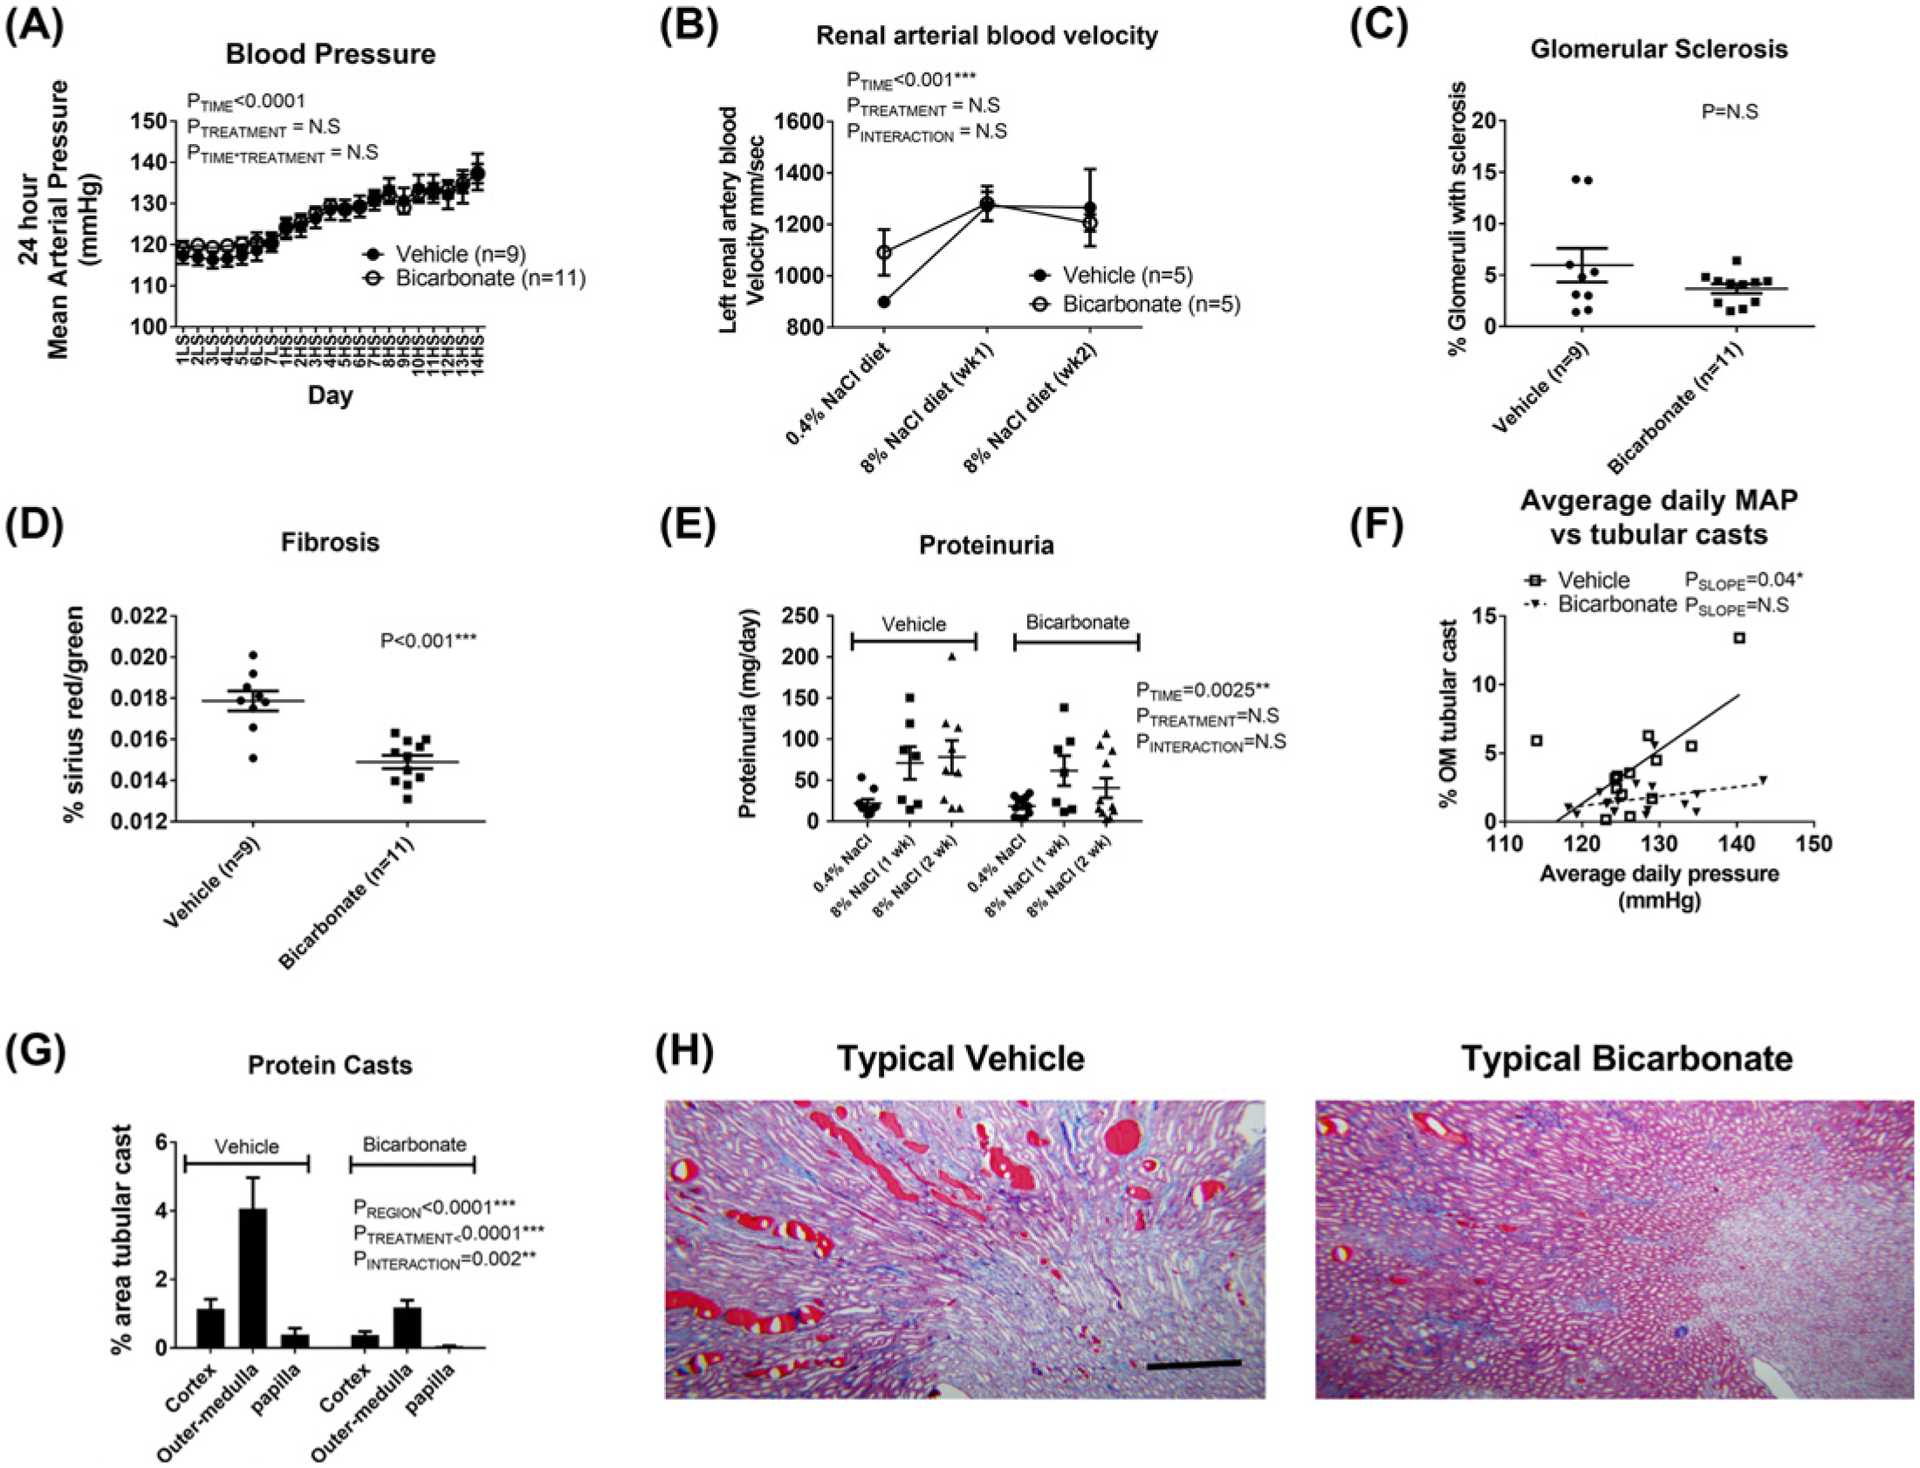
(A) 24-h mean arterial pressures in vehicle (0.1 M NaCl in drinking water; closed circles, n=9) and bicarbonate treated (0.1 M NaHCO3 in the drinking water; open circles, n=11) Dahl salt-sensitive rats. Y-axis, average mean arterial pressure over 24 h measured every 10 min (mmHg). X-axis, time day 1–7 LS (low 0.4% NaCl feeding) followed by day 1–14 HS (8% NaCl feeding). Treated drinking water (vehicle or bicarbonate) was introduced on day 4 LS. Data are mean ± SE; PE = results of two-way repeated measures ANOVA. P<0.05 was considered significant*. (B) Renal arterial blood velocity. Ultrasound measurement of left renal arterial blood velocity, an index of renal arterial blood velocity. Open circles, rats treated with 0.1 M NaHCO3 in drinking water (n=5). Closed circles, rats treated with 0.1 M NaCl (Vehicle) in drinking water (n=5). Y-axis, average renal arterial blood velocity in isoflurane anesthetized rats (mm/s). X-axis, 0.4% NaCl = measurement taken 3 days after addition of treated water (vehicle or bicarbonate) while animals were maintained in low 0.4% NaCl; 8% NaCl diet (week 1) = measurement taken 7 days after initiation of an 8% high NaCl diet while rats were maintained on treated water; 8% NaCl diet (wk2) = measurement taken 14 days after initiation of an 8% high NaCl diet while rats were maintained on treated water. P = results of two-way repeated measures ANOVA; P<0.05 was considered significant*. (C–F) represent data from rats randomized to vehicle (n=9) or bicarbonate-treated (n=11) water fed a 0.4% NaCl diet (low-salt, LS) for 3 days before being switched to an 8% NaCl (HS) diet for an additional 14 days prior to tissue harvest. Individual data points are shown with mean ± SE. P = results of two-way repeated measures ANOVA; P<0.05 was considered significant*. (C) Percent of glomeruli demonstrating signs of sclerosis following 14 days of HS in bicarbonate- or vehicle-treated rats as assessed by a renal pathologist blinded to the treatment groups. Individual data points are shown with mean ± SE. (D) Renal fibrosis (collagen staining) following 14 days of HS in bicarbonate- or vehicle-treated rats expressed as a percent relative to total tissue volume as assessed by Sirius Red/green staining. (D) 24-h urinary protein excretion (mg/day) following 3 days of LS and 7 (1 week) and 14 (2 weeks) days of HS. Individual data points are shown with mean ± SE. (E) Protein casts following 14 days of HS in the renal cortex, outer-medulla, papilla for each treatment (bicarbonate or vehicle in drinking water). Y-axis, % area (cortex, outer-medulla or papilla) represented by tubular casts as determined by color threshold (MetaMorph Imaging software). Data are expressed as mean ± SE. Data for vehicle treated animals are shown on the left (covered by bar (vehicle, n=9)) while data for bicarbonate treated animals are right (covered by bar (bicarbonate, n=11)). P = result of ANOVA. P<0.05 was considered significant*. (F) Y-axis, tubular cast formation in individual animals (as above) plotted against average daily mean arterial pressure (average daily mean arterial pressure across each day of the 17-day protocol) in each animal (X-axis); OM, outer-medulla. Individual animals treated with 0.1 M NaCl in the drinking water are plotted as open squares (n=9). Individual animals treated with 0.1 M NaHCO3 in the drinking water are plotted as closed triangles (n=11). Solid-line, result of model II regression for vehicle-treated animals. Dotted-line, result of model II regression for NaHCO3-treated animals. PSLOPE = result of model II regression to determine whether slope is different to 0. (G) Representative images of trichrome-stained sections of kidney following 14 days of HS in vehicle (left) and bicarbonate (right) treated rats; the dark red staining indicates tubular casts. Original magnification 5×; scale bar = 500 μm.
Renal injury in NaCl- and NaHCO3-treated Dahl SS rats fed a high salt diet
There were no differences in glomerular sclerosis between vehicle- and NaHCO3-treated groups following HS (Figure 2); however, both tubular casts formation (% area: Figure 2) and tissue fibrosis (Sirius Red/green staining: Figure 2) were markedly reduced in NaHCO3 compared with NaCl-treated animals.
Effect of Hv1 and NH4Cl on intracellular pH in isolated perfused mTAL
As we are limited to intracellular measurements using the BCECF-AM dye, to determine whether Hv1 promotes tubular acidification in mTAL of Dahl SS rats, we compared intracellular pH responses in isolated perfused mTAL from wild-type and Hv1−/− rats with and without the presence of NH4+. Consistent with previous observations, addition of NH4Cl to the bath of perfused mTAL resulted in tubular acidification due to the rapid tubular uptake of NH4+ [14]. Acidification was significantly more pronounced in mTAL lacking Hv1 (Figure 3), indicating Hv1 promotes likely H+ efflux, limiting tubular acidification when NH4+ is present.
Figure 3. Intracellular pH responses to NH4Cl in isolated perfused thick ascending limbs from wild-type and Hv1−/− Dahl salt-sensitive rats.
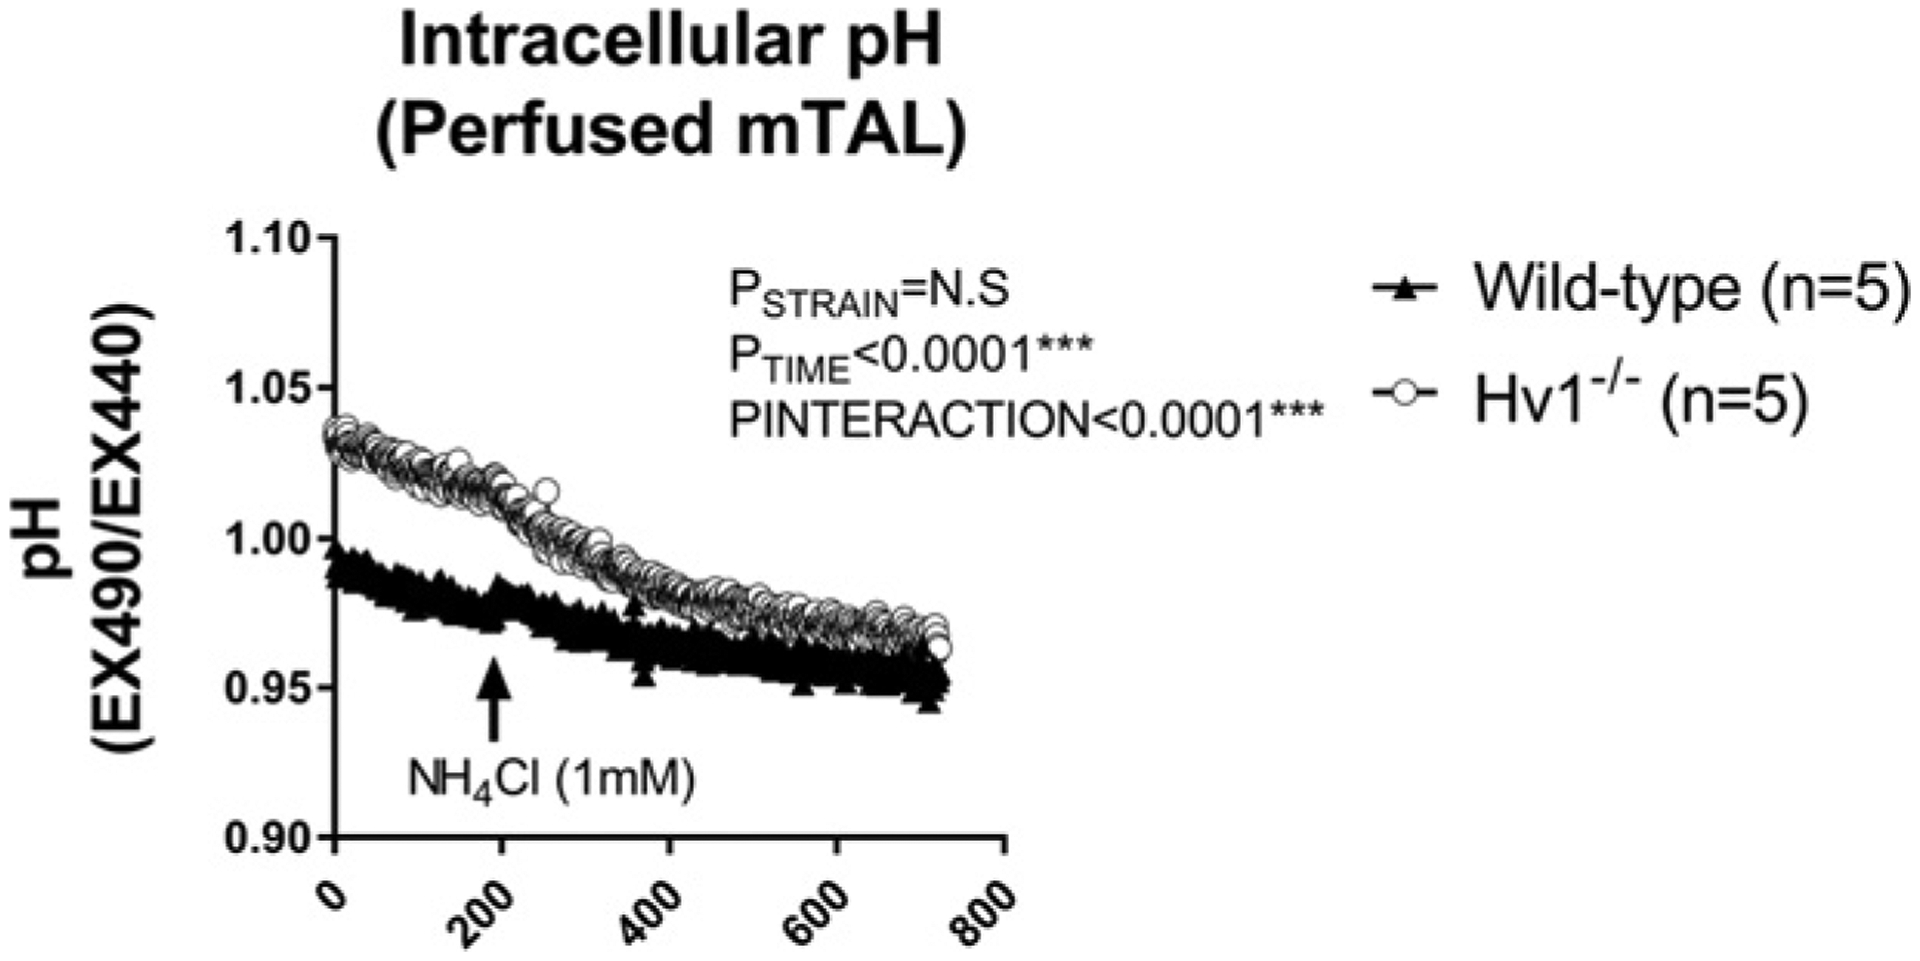
Tubular pH was measured with BCECF-AM, a pH sensitive fluorescent dye in live freshly isolated medullary thick ascending limb tubular segments from wild-type (closed triangles, n=5) and Hv1−/− (open circles, n=5) Dahl salt-sensitive rats. Y-axis, pH (expressed as ratio of fluorescent signal at excitation 490 nm emission 510 nm/excitation 440 nm emission 510 nm (increased ratio is more alkaline). X-axis, time in seconds. The bath contained HBSS/HEPES at pH 7.40 and was maintained at pH 7.40. NH4Cl (1 mM) was added to the perfusion chamber at time = 200 (arrow). P = results of two-way repeated measures ANOVA. P<0.05 was considered significant*.
Blood pressure and proteinuria in wild-type and Hv1−/− Dahl SS rats fed high salt
To determine whether blood pressure responses were similar in untreated wild-type and Hv1−/− rats, we assessed blood pressure and proteinuria in wild-type and Hv1−/− mutant rats with implanted radiotelemetry devices. When measured by 24-h telemetry, blood pressure responses to an HS diet were not different between wild-type and Hv1−/− rats (Figure 4). Further, proteinuria was not different between Hv1−/− and wild-type Dahl SS at any time point measured (Figure 4).
Figure 4. Blood pressure and proteinuria in Hv1−/− versus wild-type Dahl SS rats.
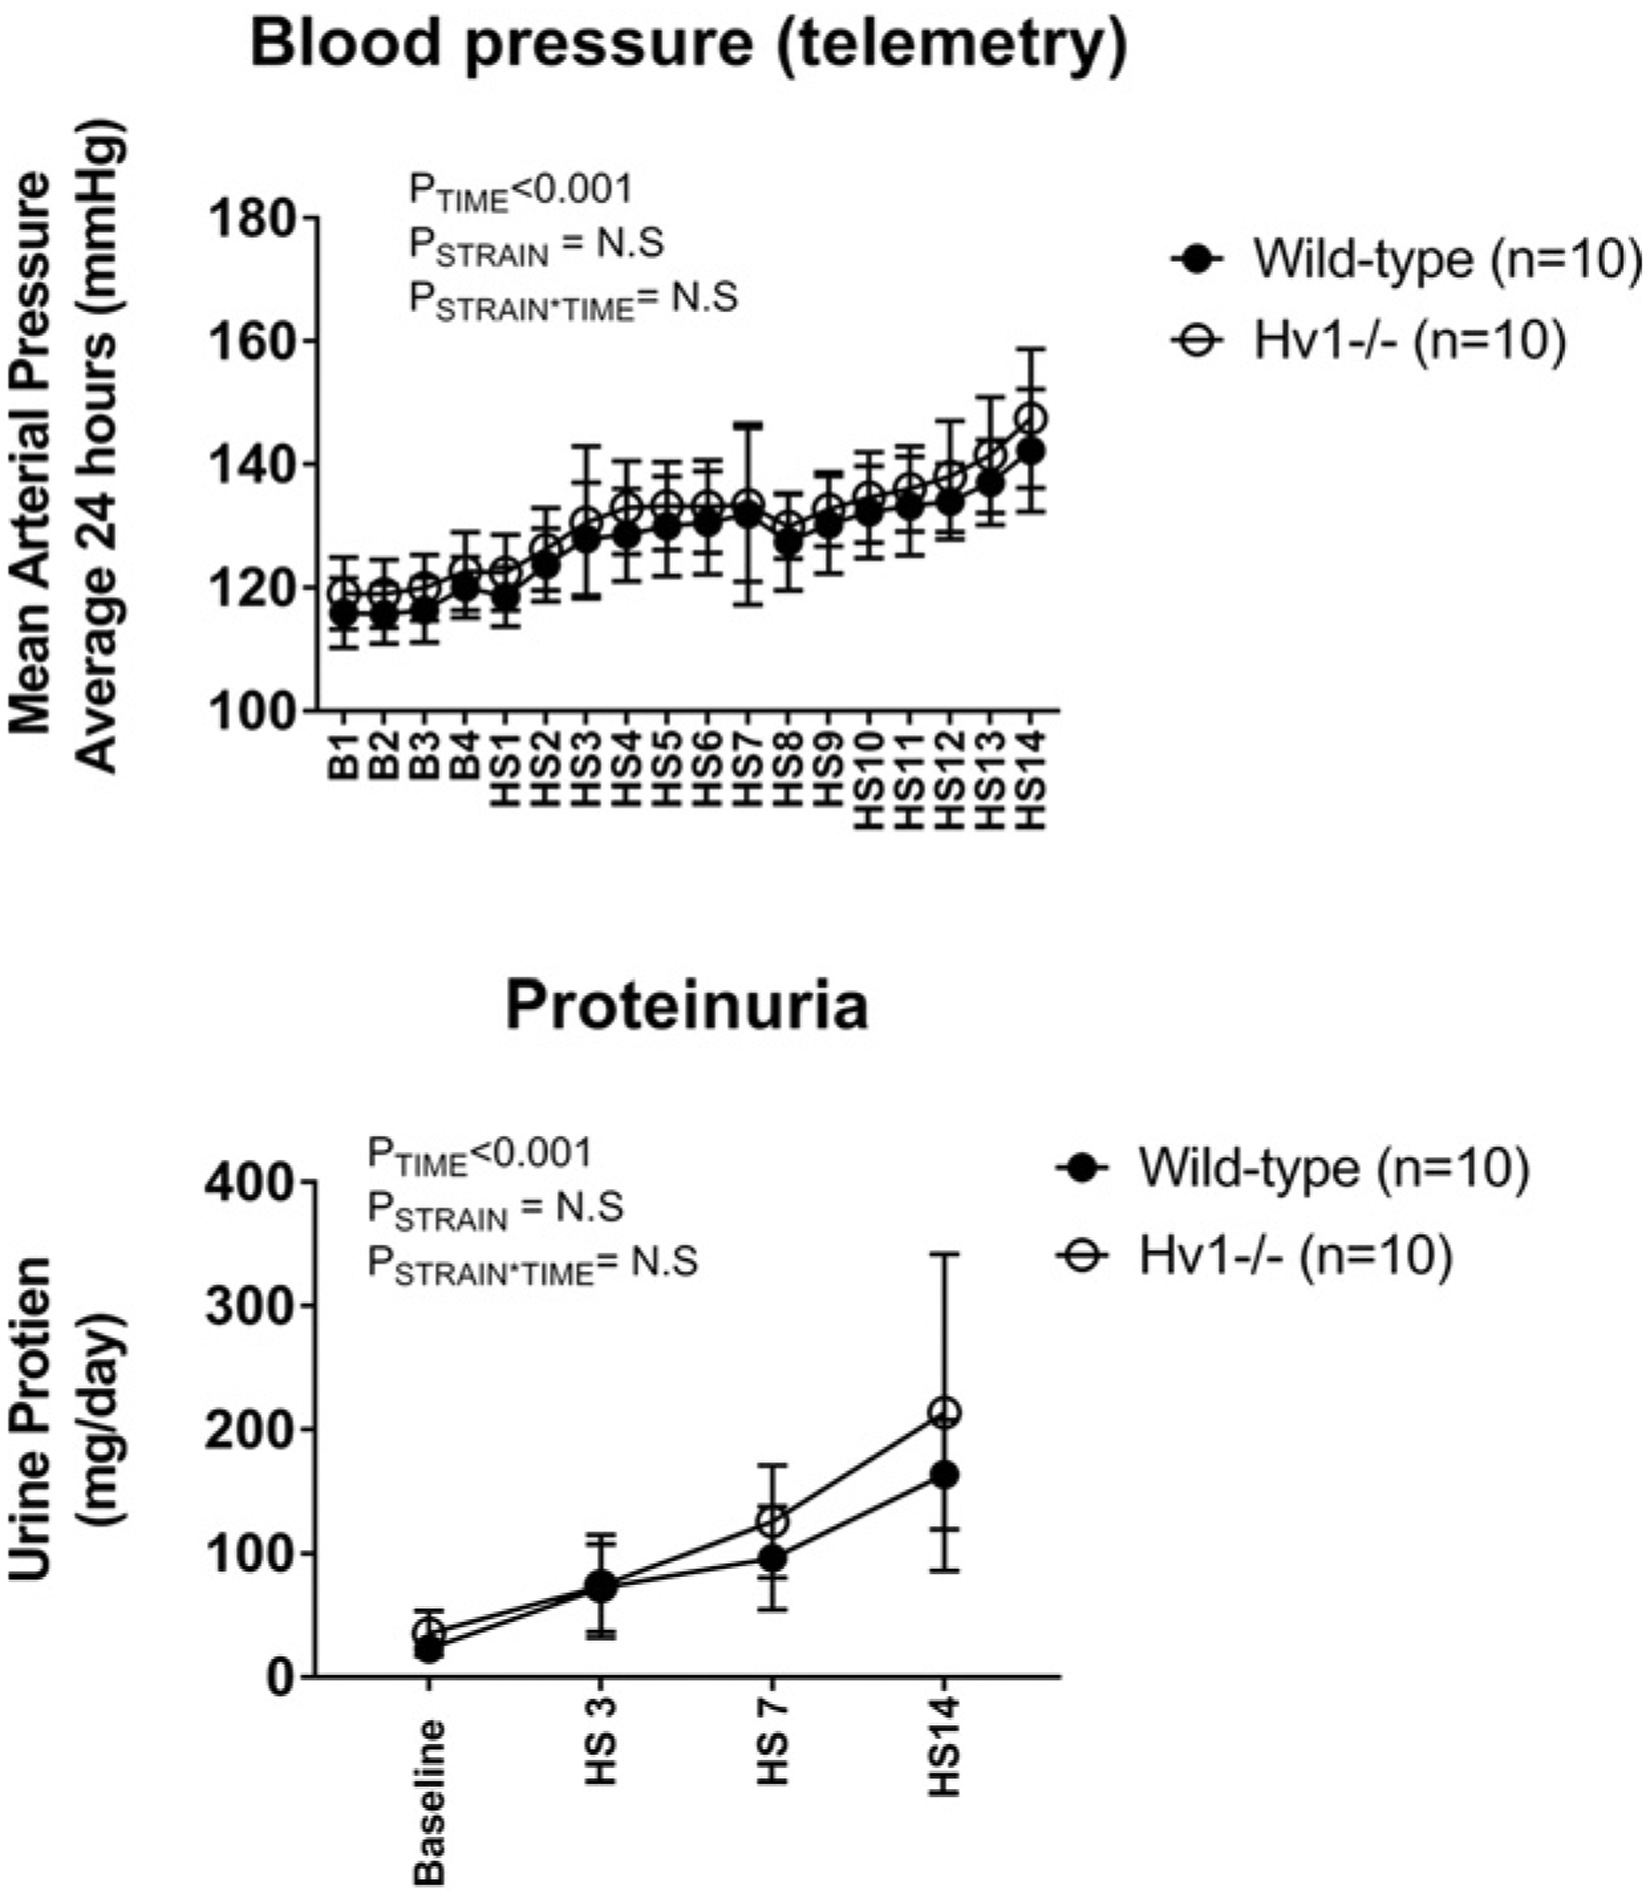
Top panel: 24-h mean arterial pressures in wild-type (closed circles, n=10) and Hv1−/− mutant (open circles, n=10) Dahl salt-sensitive rats as measured by radiotelemetry. Y-axis, average mean arterial pressure over 24 h measured every 10 min (mmHg). X-axis, time day B1–4 (low 0.4% NaCl feeding) followed by day 1–14HS (8% NaCl feeding); P = results of two-way repeated measures ANOVA. P<0.05 was considered significant*. Bottom panel: 24-h urinary protein excretion in wild-type (closed circles, n=10) and Hv1−/− mutant (open circles, n=10) Dahl salt-sensitive rats. Y-axis, proteinuria (μg/day); X-axis, day of measurement. Baseline = B4 in top panel (low 0.4% NaCl feeding) HS3, HS7, and HS14 correspond to days shown in top panel (8% NaCl feeding). P = results of two-way repeated measures ANOVA. P<0.05 was considered significant*.
Effect of NaHCO3 on renal cast formation in wild-type and Hv1−/− Dahl SS rats fed high salt
To determine whether NaHCO3 limits cast formation in Dahl SS rats by inactivating Hv1, we compared cast formation in HS fed wild-type and Hv1−/− rats drinking either NaHCO3 or NaCl. Consistent with our other findings, NaHCO3 reduced cast formation in wild-type Dahl SS rats independent of an effect to reduce blood pressure or proteinuria (Figure 5). Importantly, NaHCO3 lowered cast formation by a similar magnitude in both wild-type and Hv1−/− rats (Figure 5).
Figure 5. Effect of NaHCO3 and Hv1 on blood pressure and renal injury in Dahl SS rats.
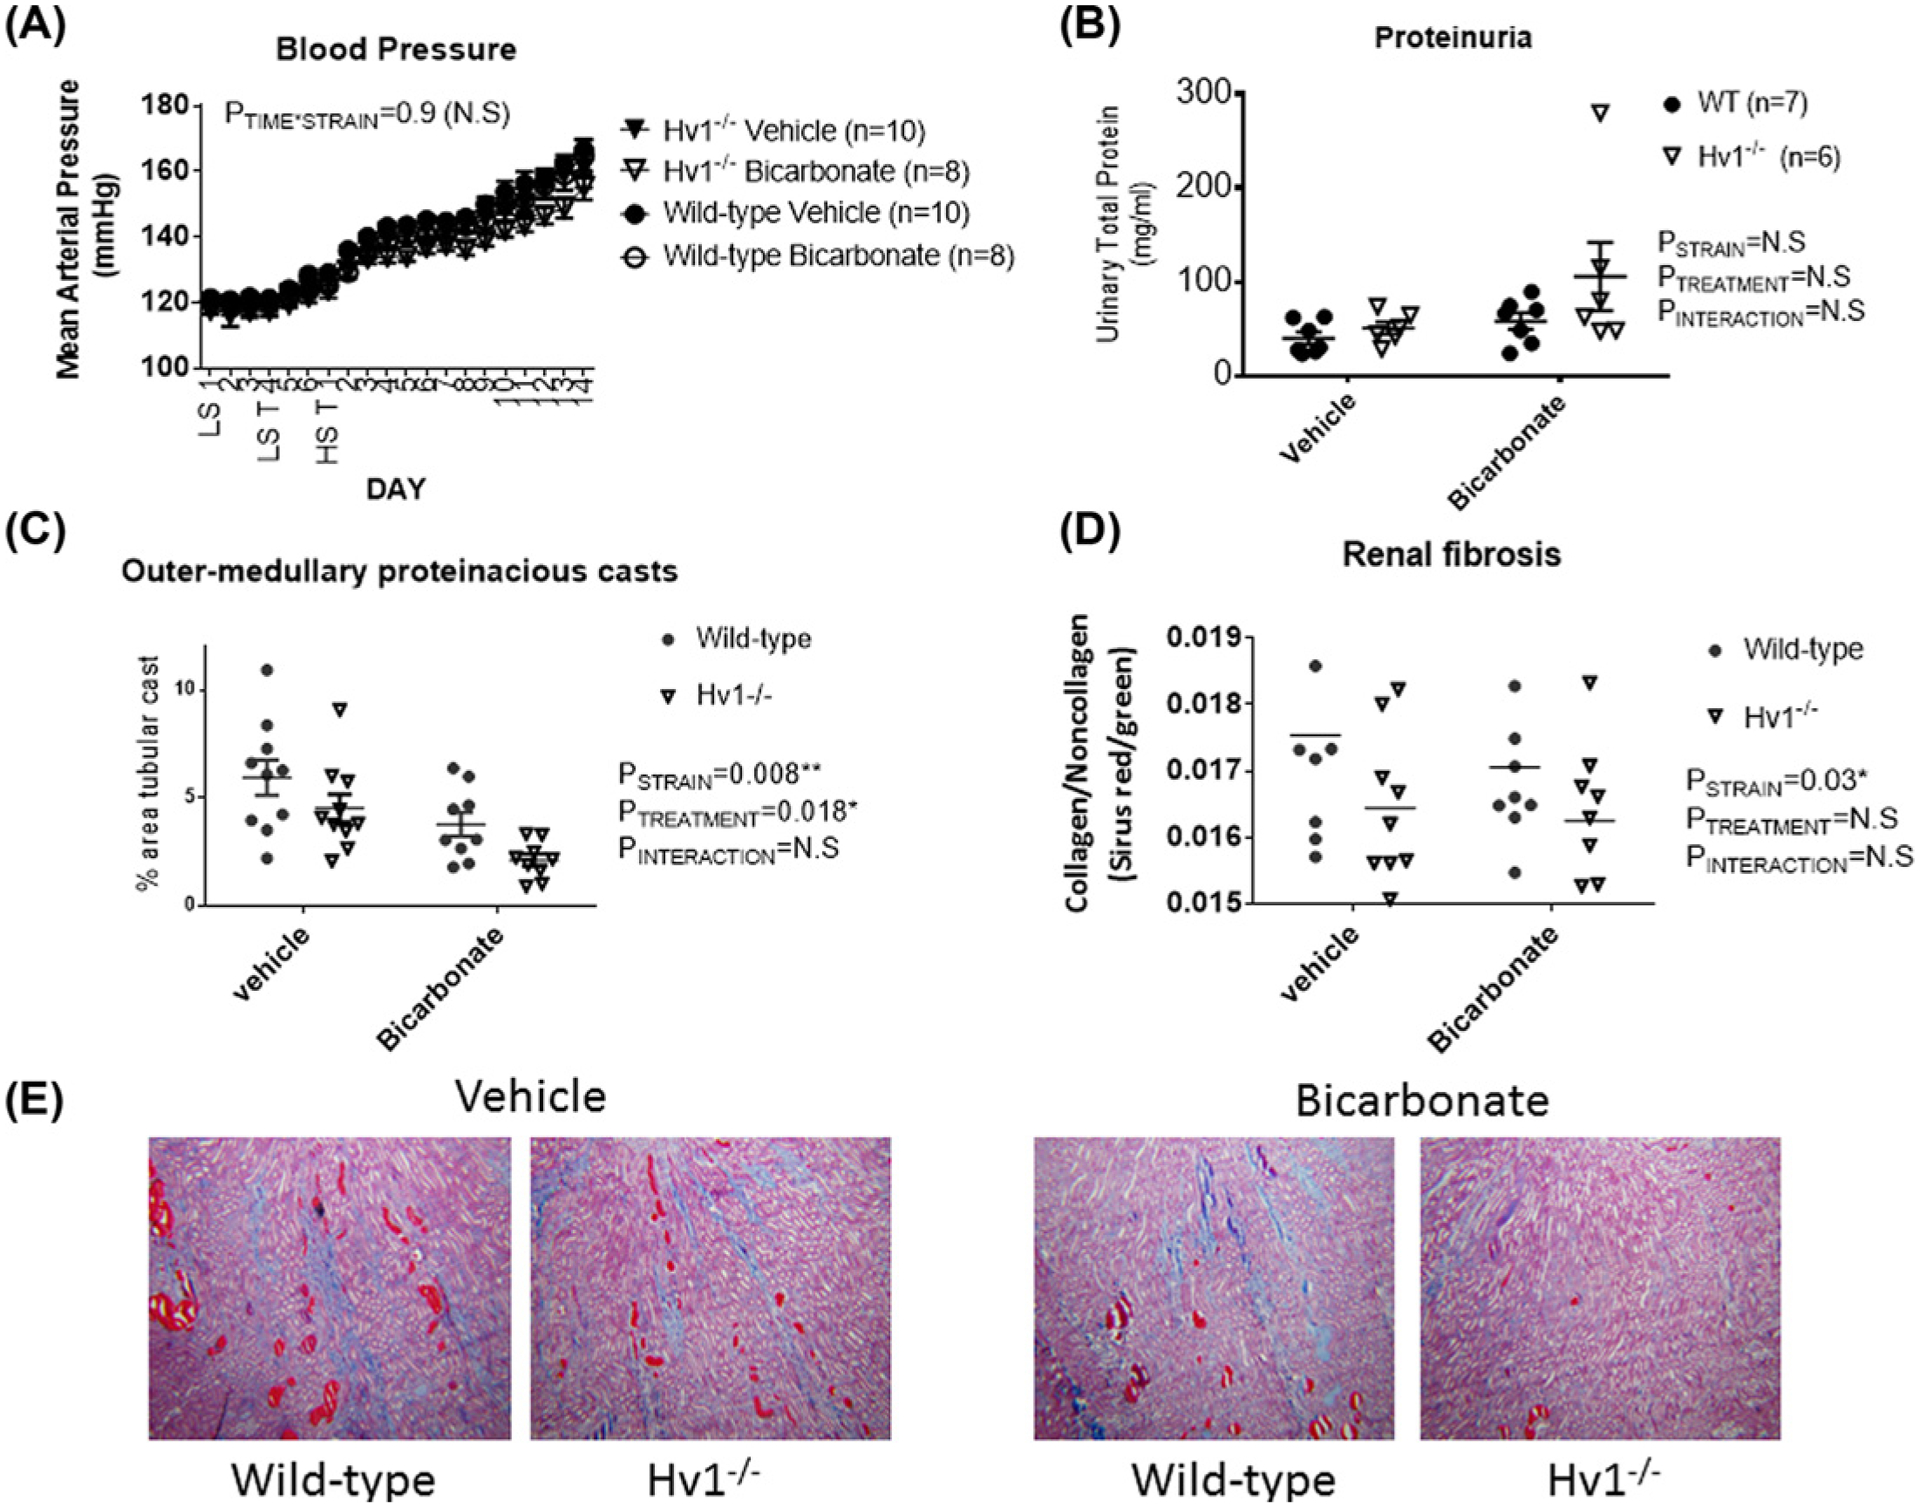
(A) 24-h mean arterial pressures in vehicle (0.1 M NaCl, closed) and bicarbonate (0.1 M NaHCO3, open) treated wild-type (circles) and Hv1−/− (triangles) Dahl salt-sensitive rats (n for each group is given in legend). Y-axis, average mean arterial pressure over 24 h measured every 10 min (mmHg). X-axis, time day 1–3LS (low 0.4% NaCl feeding + tap water) followed by day 4–7—T LS (0.4% NaCl feeding + either vehicle or bicarbonate in drinking water) HS T 1–14 (8% NaCl feeding + either vehicle or bicarbonate in drinking water). Data are mean ± SE; P = results of two-way repeated measures. P<0.05 was considered significant*. (B) 24-h urinary protein excretion (mg/day) at 14 days of HS. Individual data points are shown with mean ± SE. (C) Protein casts following 14 days of HS in the outer-medulla. (D) Renal fibrosis (collagen staining) following 14 days of HS expressed as a percent relative to total tissue volume as assessed by Sirius Red/green staining. (E) Representative images of trichrome stained sections from each strain and treatment group. For (B–E), P = results of two-way repeated measures ANOVA. P<0.05 was considered significant*.
Relationship between blood pressure and tubular casts
The reduction in tubular cast formation in HS fed Dahl SS rats was independent of blood pressure load, with cast formation in individual NaHCO3-treated rats being lower than that of vehicle-treated rats across a similar range of average daily blood pressures (Figure 2).
Effect of NaHCO3 on inflammation in wild-type and Hv1−/− Dahl SS rats
We have recently reported that oral NaHCO3 ingestion promotes inflammatory (M1) to anti-inflammatory (M2) macrophage polarization in the spleen and kidney of Dahl SS rats, and that changes in macrophage polarization are dependent on the presence of the spleen [22]. Flow cytometry data from whole spleen of both wild-type and Hv1−/− mutant Dahl SS rats treated with either vehicle or NaHCO3 after 2 weeks of HS are presented in Figure 6. NaHCO3 treatment resulted in a significant decrease in TNFα expressing macrophages (M1-polarized “inflammatory” macrophages) and increase in IL-10 expressing macrophages (M2-polarized “anti-inflammatory” macrophages) in the spleen in both wild-type and Hv1−/− mutant rats (Figure 6). Loss of Hv1 promoted a more inflammatory macrophage polarization in the spleen independent of treatment (Figure 6).
As we have shown that removal of the spleen (splenectomy) or breaking of fragile mesothelial connections to the spleen [22] abolished the anti-inflammatory effect of NaHCO3 drinking on the kidney to NaHCO3, in order to determine whether the changes in macrophage polarization were responsible for differences in the cast formation observed, we compared cast formation in Dahl SS rats fed HS for 2 weeks and treated with either NaHCO3 and NaCl following either sham surgery, splenectomy or splenic manipulation. While treatment with NaHCO3 was found to significantly reduce cast formation, we observed similar levels of cast formation between sham, splenectomized, and manipulated spleen groups (Figure 7).
Figure 7. Effect of splenectomy and NaHCO3 on outer-medullary protein casts in Dahl SS rats.
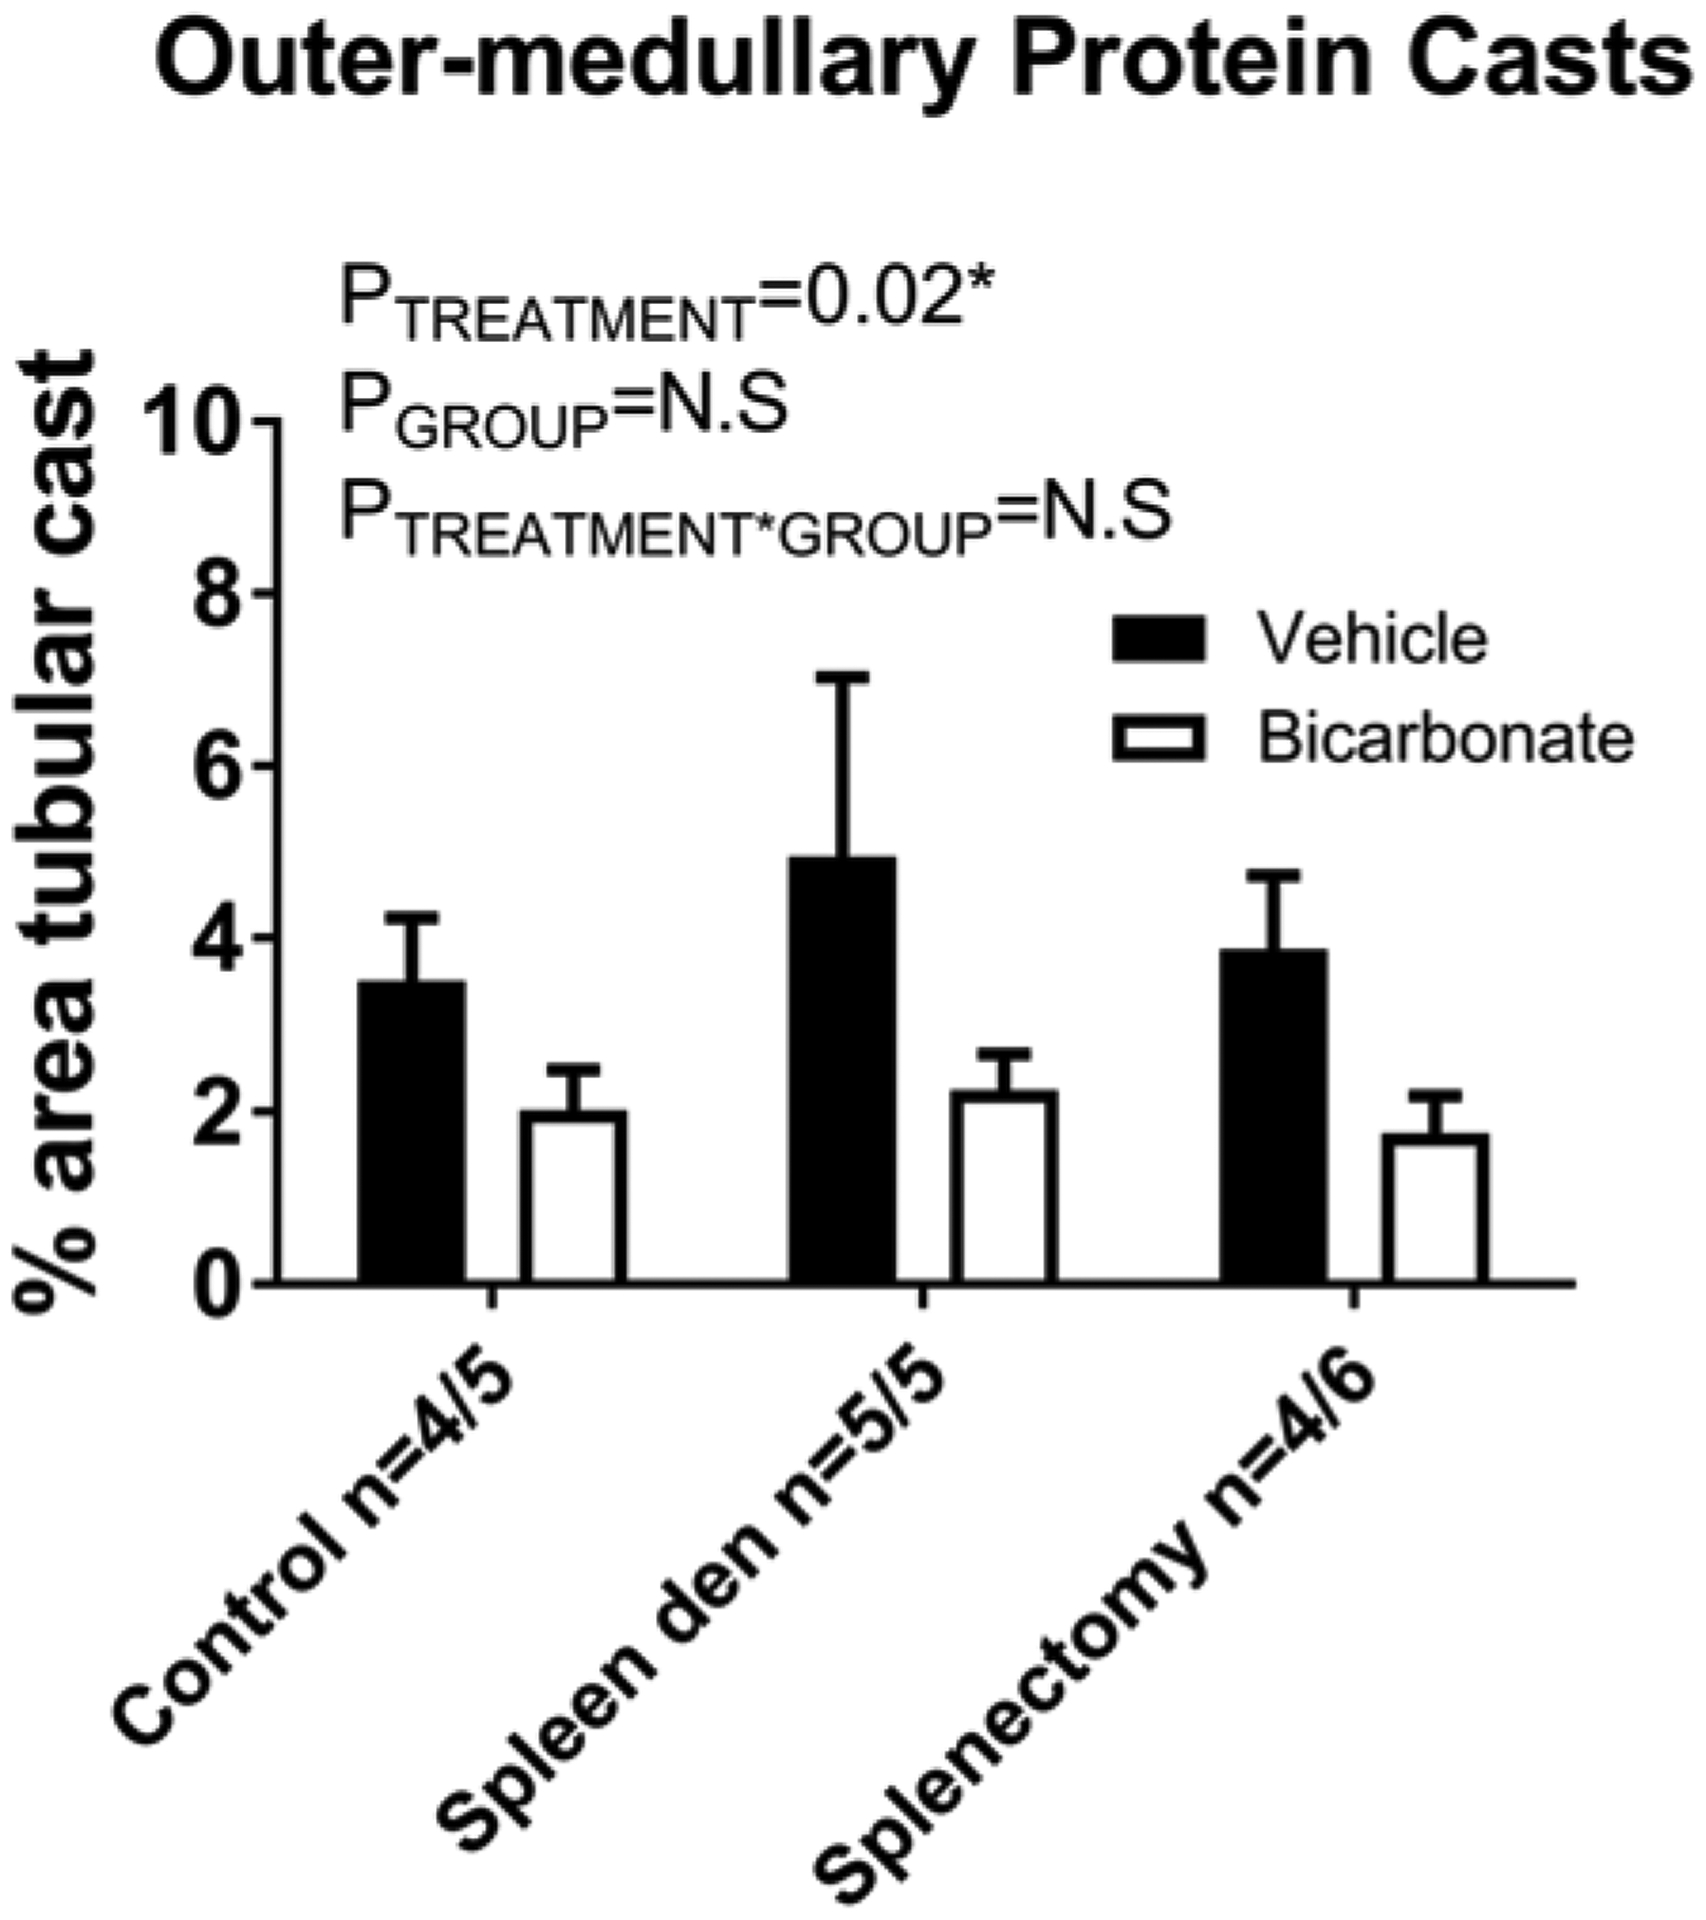
Outer-medullary protein casts (% of outer-medullary area) from untouched (control), manipulated spleen (spleen den), and splenectomy (splenectomy) rats fed an HS diet for 14 days prior to tissue harvest. Solid columns, vehicle-treated animals. Open columns, bicarbonate-treated animals. Data are mean ± SE. P = results of two-way repeated measures ANOVA. P<0.05 was considered significant*.
Discussion
Nephritic proteinuria is an indicator of high glomerular pressure resulting from detrimental renal hemodynamic changes [23]. While to the author’s knowledge, no direct examination of the impact of race on renal protection with NaHCO3 has been reported, the results of the African-American Study of Kidney Disease and Hypertension Study (AASK Trial) indicated that the association between net endogenous acid production and CKD progression was stronger among those without proteinuria [24]. Interestingly, de Bristo-Ashurst et al. [3] reported oral NaHCO3 markedly reduced GFR decline independent of a similar protective effect to reduce proteinuria or blood pressure in stage 4–5 CKD patients. Further, in a 5-year, prospective, randomized, placebo-controlled, blinded interventional study of daily oral NaHCO3 versus NaCl in subjects with macroalbuminuric hypertensive nephropathy and CKD stage 2 eGFR (60–90 ml/min), Mahajan et al. [4] reported that NaHCO3 supplementation reduced GFR decline when compared with control subjects receiving NaCl, and that this was independent of a significant effect on either urinary albumin/creatinine ratio or blood pressure. Together, these clinical findings suggest that alkali may slow GFR decline independent of the renal hemodynamic factors that drive proteinuria.
Apolipoprotein L-1 (APO1) gene variants account for much of the increased risk of African-Americans to develop CKD (20). In contrast with patients of European ancestry, or patients lacking APO1 risk variants, evidence in patients of African ancestry with two-risk variants for the APO1 gene indicates that tubular cast formation may be a prominent histological feature in this high CKD risk population (39). These pathological differences highlight the need to understand the varied pathological processes that may result in nephron loss in different populations and led us to investigate whether beneficial effects of NaHCO3 treatment are observed in an experimental model of progressive renal injury that mimics a number of the features observed in African-Americans with CKD including prominent tubular cast formation, the Dahl SS rat model.
The first major finding of the present study is that oral NaHCO3 loading reduced tubular cast formation and renal fibrosis in the Dahl SS rat model independently of blood pressure, renal arterial blood velocity, glomerular injury, or proteinuria (Figure 2). Marked tubular injury and proteinaceous tubular cast formation are a hallmark of injury in the Dahl SS rat model. While numerous stimuli have been reported to reduce tubular cast formation in the SS rat [11,25–53]. To the best of the author’s knowledge, all of these stimuli have also been reported to limit either blood pressure increases in response to a high salt diet or lower proteinuria or glomerular injury. This distinction is important as injury to the glomerular capillaries is generally thought to initiate tubular injury. Multiple mechanisms may contribute to downstream tubular dysfunction following glomerular injury [54]. Kirz and Lehir [54] argue that tubular injury following damage to the glomerular capillaries most commonly results from misdirected filtration in the damaged glomerulus and eventual sensation of tubular flow. While there is debate as to whether excessive filtration of proteins directly damages the downstream tubules [54,55], increased filtration of protein from the damaged glomerulus can contribute to cast formation [12]. Further, partial cessation of single nephron filtration is thought to exacerbate cast formation by prompting a slowly moving filtrate susceptible to protein aggregation. Finally, as the peritubular capillaries that supply the tubular parenchyma arise primarily from the efferent arterioles of the nephrons parent glomerulus, damage to the glomerular capillaries may lead to ischemia of the downstream tubular segments and subsequent tubular hypoxia and injury [56]. Given we did not observe any differences in blood pressure, glomerular injury or proteinuria, our data indicate that reduced tubular cast formation and fibrosis in kidneys from Dahl SS rats treated with HCO3 probably occurred independently of a protective effect on the renal glomeruli.
The hyaline/waxy casts that are observed in CKD are thought to contain a mix uromodulin, a glycol-protein produced exclusively in the thick ascending limb, and precipitates of other proteins [57,58]. Precipitation of filtered proteins within the tubular lumen has been demonstrated to result in loss of renal function in the absence of tubular necrosis and associated cast formation in nephron segments located within the renal medulla and papillary regions [12]. Evidence indicate that these casts are formed primarily by proteins that precipitate out under acidic conditions [12]. While under normal physiological conditions, hyaline cast formation is thought to occur primarily in the collecting duct where urinary pH is lowest [59], protein precipitation may be enhanced in the TAL region in the Dahl SS rat model secondary to glomerular injury and increased luminal fluid protein concentration as well as enhanced reabsorption of Na and Cl in this segment [60]. As NaHCO3 loading increased urinary pH and HCO3 excretion, these stimuli would have increased pH within the luminal fluid of the TAL segment. We hypothesize that this alkalization of the tubular fluid then limited cast formation. To confirm whether alkalization of TAL luminal fluid prevents cast formation in the Dahl SS rat model, we utilized Dahl SS rats in which the Hv1 had been functionally deleted [15]. We previously reported that voltage-gated proton channels are expressed on the apical membrane of the thick ascending limb [15,61]. To confirm that voltage-gated proton channels participate in luminal H+ secretion in the Dahl SS rat model, we compared intracellular pH changes in isolated perfused mTAL from wild-type and Hv1−/− Dahl SS rats in response to NH4Cl. In perfused tubules in which Na is being actively reabsorbed, NH4+ from the surrounding solution is rapidly taken into the cells by NaKATPase by substituting for K+, resulting in cellular acidification [14]. We confirmed that activation of proton channels buffer this response, indicating that in the presence of NH4+, proton channels probably secrete H+ across the apical membrane, a process that would result in reduced pH of the luminal fluid under normal physiological conditions (when NH4+ is present in the luminal and interstitial fluid) and may promote protein precipitation.
To determine whether loss of Hv1 limits cast formation by luminal alkalinization within the TAL segment, we first investigated whether blood pressure responses and proteinuria were similar in untreated wild-type and Hv1−/− Dahl SS fed a high salt diet. Using radiotelemetry, we found no difference in the blood pressure response to a high salt diet in untreated Hv1−/− and wild-type Dahl SS rats (Figure 4). Further, proteinuria was not different at any time point measured (Figure 4). Importantly, in an additional group of rats we confirmed reduced cast formation in Hv1−/− Dahl SS rats when compared with wild-type independent of differences in glomerular injury or proteinuria (Figure 5). Indeed, our finding that both Hv1−/− and NaHCO3-treated Dahl SS rats share the same rare injury phenotype of reduced cast formation independent of proteinuria, glomerular injury or hypertension strongly implicates tubular acidification as the primary mechanism. Our data indicating that oral NaHCO3 provided an additive effect to reduce cast formation in Hv1−/− rats suggests that the effect was mediated by changes in luminal pH rather than other cellular effects related to loss of the proton channel, which would not be mimicked by HCO3 loading, including reduced superoxide production in the TAL [15]. As we have previously shown that Hv1 activity is higher in mTAL from Dahl SS rats when compared with salt-resistant rats [62], excess H+ secretion in this segment may contribute to the development of cast formation and injury in this model.
Our finding that tubular acidification in the thick ascending limb probably drives renal cast formation and fibrosis in the Dahl SS rat model is consistent with evidence that blood pressure elevation and glomerular injury also promote cast formation in the Dahl SS rat [11]. We observe a clear correlation between average daily blood pressure load and cast formation in vehicle-treated Dahl SS rats (Figure 2). As such, we speculate that more acid pH of the luminal fluid within the TAL, as well as increased protein concentration of the tubular fluid driven by glomerular injury and proteinuria (as well as other possible and yet undefined mechanisms), probably acts synergistically to promote cast formation in Dahl SS rats. Pathological tubuloglomerular interactions such as this may explain the large variation in cast formation observed between renal injury models with similar levels of glomerular injury, proteinuria, and GFR decline. This tubular component (cast formation) of injury probably acts synergistically with other classical pathways including barotrauma to promote nephron injury and loss. As blood pressure and glomerular injury were not different in our study, these (non-cast) mechanisms probably contributed equally to renal injury in both NaCl- and NaHCO3-treated rats over the relatively short time course of our study. If, over longer periods, cast formation promoted greater loss of nephrons in NaCl-treated animals, however, we would expect to see injury from these classical mechanisms be enhanced secondary to greater nephron loss.
While precipitation of proteins and tubular cast formation has been associated with renal functional decline in other models [12,63], and we observed a positive association between cast formation and tubular interstitial fibrosis in our studies (Figure 2), whether cast formation due to enhanced precipitation of luminal proteins contributes significantly to GFR decline in the Dahl SS rat model remains unclear. In our hands, GFR does not decline significantly in Dahl SS rats fed a high salt diet for as long as 4 weeks, and rats normally die of stroke secondary to development of malignant hypertension when maintained on high salt diets for longer periods. Long-term studies in nephrectomized wild-type and Hv1−/− Dahl SS rats fed relatively low salt diets, or similar long-term studies in wild-type Dahl SS rats utilizing NaHCO3 and NaCl loading in which blood pressures are maintained below malignant levels, may allow us to determine whether differences in cast formation can contribute to GFR decline independent of proteinuria in Dahl SS rats.
Recent clinical studies support an important role of dysfunction of tubular origin in the progression of CKD. Numerous clinical studies have demonstrated that rare missense mutations in UMOD result in autosomal dominant tubulointerstitial kidney diseases manifest by tubulointerstitial fibrosis, tubular casts, and a rapid progression to renal failure [64]. A model in which primary tubular dysfunction promotes GFR decline is also consistent with findings in CKD patients which NaHCO3 slowed GFR decline in the absence of a detectable effect on proteinuria [3,4]. That is, by blocking tubular flow, cast formation may reduce GFR independently of glomerular injury/barotrauma and increased proteinuria. While further investigation is required to examine this hypothesis, if it is confirmed, NaHCO3 may represent a particularly useful therapeutic to reduce cast formation and GFR decline in patients with prominent cast formation, including those of African ancestry with APO1 risk variants and UAKD.
Our finding that the blood pressure response in Dahl SS rats did not differ between NaHCO3- and NaCl-treated rats is somewhat surprising given previous reports that non-chloride anions do not promote the same degree of hypertension in this model (25). We speculate that because, in addition to NaHCO3 intake in the drinking water, our animals were fed a high salt chow (8%) chloride intake was sufficient to promote a hypertensive response in our experiments despite a portion of the dietary salt load coming from NaHCO3. In any event, blood pressure was measured across the entire protocol by telemetry, so we are confident that we can rule of any effects that could be attributed to BP differences between our NaCl- and NaHCO3-treated groups.
We have recently reported that oral NaHCO3 promotes an anti-inflammatory phenotype in rats which is dependent on the presence of the spleen including both splenic and renal M1 (inflammatory) to M2 (regulatory) polarization. Evidence from preclinical studies suggests a deleterious effect of inflammatory cytokines on renal function and injury [42]. A potentially significant source of inflammatory cytokines in the kidney is circulating macrophages. Consistent with our prior observations, in the current study, oral NaHCO3 loading was associated with M1 to M2 polarization of splenic macrophages. Either prior manipulation or complete removal of the spleen, which completely abolished the anti-inflammatory effect of oral NaHCO3 however, had no effect to prevent the protective effects of oral NaHCO3 on either cast formation or fibrosis in the Dahl SS model. Further, inflammatory macrophage polarization was greater in Dahl SS rats lacking Hv1, yet cast formation and fibrosis in the kidney were lower than in wild-type rats (Figure 7). These data indicate that anti-inflammatory macrophage polarization does not to underlie the protective effect of NaHCO3 on cast formation and fibrosis we observed in the Dahl SS rat model.
Clinical perspectives.
This study was undertaken to determine whether NaHCO3 was protective against renal injury in the Dahl SS rat model. We found that NaHCO3 limits cast formation and renal fibrosis in Dahl salt-sensitive rats independent of blood pressure, glomerular injury, and hypertension. This protective effect is mediated by luminal alkalization within the TAL segment, where tubular cast formation is most prominent.
These data are significant because, while there is some disagreement [56], utilizing the remnant kidney model, a number of reports have indicated a beneficial effect of alkali loading on the kidney including both reductions in proteinuria and the rate of GFR decline [65,66]. These effects have been attributed to a number of physiological mechanisms including reduced renal angiotensin II [67], reduced complement activation [65], and reduced endothelin levels [68].
By demonstrating NaHCO3 limits cast formation, our data provide an additional and novel potential mechanism through which alkali loading may slow renal injury progression independent of glomerular hemodynamic changes and proteinuria in CKD patients. This mechanism is consistent with clinical findings and may be of particular relevance to CKD populations in which tubular casts are a prominent histological finding.
Funding
This work was supported by a grant to Paul O’Connor [grant number NIH DK099548-01]. Aaron Polichnowski is supported by a Carl Gottschalk Research Scholar Grant from the American Society of Nephrology and a grant from the American Heart Association [grant number 17AIREA33660433].
Abbreviations
- APO1
apolipoprotein L-1
- BCECF
2’,7’-bis-(2-carboxyethyl)-5-(and-6)-carboxyfluorescein
- CKD
chronic kidney disease
- HBSS
Hank’s balanced salt solution
- Hv1
voltage-gated proton channel
- TAL
thick ascending limb
- mTAL
medullary thick ascending limb
- IL-10
interleukin 10
- TNFα
tumor necrosis factor alpha
- GFR
glomerular filtration rate
- eGFR
estimated glomerular filtration rate
Footnotes
Competing Interests
The authors declare that there are no competing interests associated with the manuscript.
References
- 1.Dobre M, Rahman M and Hostetter TH (2014) Current status of bicarbonate in CKD. J. Am. Soc. Nephrol 26, 515–523, 10.1681/ASN.2014020205 [DOI] [PMC free article] [PubMed] [Google Scholar]
- 2.Loniewski I and Wesson DE (2014) Bicarbonate therapy for prevention of chronic kidney disease progression. Kidney Int. 85, 529–535, 10.1038/ki.2013.401 [DOI] [PubMed] [Google Scholar]
- 3.de Brito-Ashurst I, Varagunam M, Raftery MJ and Yaqoob MM (2009) Bicarbonate supplementation slows progression of CKD and improves nutritional status. J. Am. Soc. Nephrol 20, 2075–2084, 10.1681/ASN.2008111205 [DOI] [PMC free article] [PubMed] [Google Scholar]
- 4.Mahajan A, Simoni J, Sheather SJ, Broglio KR, Rajab MH and Wesson DE (2010) Daily oral sodium bicarbonate preserves glomerular filtration rate by slowing its decline in early hypertensive nephropathy. Kidney Int. 78, 303–309, 10.1038/ki.2010.129 [DOI] [PubMed] [Google Scholar]
- 5.McClellan W, Warnock DG, McClure L, Campbell RC, Newsome BB, Howard V et al. (2006) Racial differences in the prevalence of chronic kidney disease among participants in the Reasons for Geographic and Racial Differences in Stroke (REGARDS) Cohort Study. J. Am. Soc. Nephrol 17, 1710–1715, 10.1681/ASN.2005111200 [DOI] [PubMed] [Google Scholar]
- 6.Campese VM (1994) Salt sensitivity in hypertension. Renal and cardiovascular implications. Hypertension 23, 531–550, 10.1161/01.HYP.23.4.531 [DOI] [PubMed] [Google Scholar]
- 7.Kidambi S, Kotchen JM, Krishnaswami S, Grim CE and Kotchen TA (2010) Cardiovascular correlates of insulin resistance in normotensive and hypertensive African Americans. Metabolism 60, 835–842, 10.1016/j.metabol.2010.07.036 [DOI] [PMC free article] [PubMed] [Google Scholar]
- 8.Kotchen TA, Zhang HY, Covelli M and Blehschmidt N (1991) Insulin resistance and blood pressure in Dahl rats and in one-kidney, one-clip hypertensive rats. Am. J. Physiol 261, E692–E697 [DOI] [PubMed] [Google Scholar]
- 9.Zicha J, Dobesova Z, Vokurkova M, Rauchova H, Hojna S, Kadlecova M et al. (2012) Age-dependent salt hypertension in Dahl rats: fifty years of research. Physiol. Res 61, S35–S87 [DOI] [PubMed] [Google Scholar]
- 10.Sullivan JM (1991) Salt sensitivity. Definition, conception, methodology, and long-term issues. Hypertension 17, I61–I68, 10.1161/01.HYP.17.1Suppl.I61 [DOI] [PubMed] [Google Scholar]
- 11.Mori T, Polichnowski A, Glocka P, Kaldunski M, Ohsaki Y, Liang M et al. (2008) High perfusion pressure accelerates renal injury in salt-sensitive hypertension. J. Am. Soc. Nephrol 19, 1472–1482, 10.1681/ASN.2007121271 [DOI] [PMC free article] [PubMed] [Google Scholar]
- 12.Zager RA (1988) Precipitable tissue proteins can cause experimental acute renal failure. Lab. Invest 59, 798–808 [PubMed] [Google Scholar]
- 13.Sullivan JC, Wang B, Boesen EI, D’Angelo G, Pollock JS and Pollock DM (2009) Novel use of ultrasound to examine regional blood flow in the mouse kidney. Am. J. Physiol. Renal Physiol 297, F228–F235, 10.1152/ajprenal.00016.2009 [DOI] [PMC free article] [PubMed] [Google Scholar]
- 14.Watts BA III and Good DW (1994) Effects of ammonium on intracellular pH in rat medullary thick ascending limb: mechanisms of apical membrane NH4+ transport. J. Gen. Physiol 103, 917–936, 10.1085/jgp.103.5.917 [DOI] [PMC free article] [PubMed] [Google Scholar]
- 15.Jin C, Sun J, Stilphen CA, Smith SM, Ocasio H, Bermingham B et al. (2014) HV1 acts as a sodium sensor and promotes superoxide production in medullary thick ascending limb of Dahl salt-sensitive rats. Hypertension 64, 541–550, 10.1161/HYPERTENSIONAHA.114.03549 [DOI] [PMC free article] [PubMed] [Google Scholar]
- 16.Yao B, Xu J, Qi Z, Harris RC. and Zhang MZ. (2006) Role of renal cortical cyclooxygenase-2 expression in hyperfiltration in rats with high-protein intake.. Am. J. Physiol. Renal Physiol 291, F368–74 [DOI] [PubMed] [Google Scholar]
- 17.Ray SC, Baban B, Tucker MA, Seaton AJ, Chul Chang K, Mannon EC et al. (2018) Oral NaHCO3 activates the splenic anti-inflammatory pathway; evidence cholinergic signals are transmitted via mesothelial cells. J. Immunol,, in press [DOI] [PMC free article] [PubMed] [Google Scholar]
- 18.Baban B, Hansen AM, Chandler PR, Manlapat A, Bingaman A, Kahler DJ et al. (2005) A minor population of splenic dendritic cells expressing CD19 mediates IDO-dependent T cell suppression via type I IFN signaling following B7 ligation. Int. Immunol 17, 909–919, 10.1093/intimm/dxh271 [DOI] [PubMed] [Google Scholar]
- 19.Baban B, Chandler PR, Sharma MD, Pihkala J, Koni PA, Munn DH et al. (2009) IDO activates regulatory T cells and blocks their conversion into Th17-like T cells. J. Immunol 183, 2475–2483, 10.4049/jimmunol.0900986 [DOI] [PMC free article] [PubMed] [Google Scholar]
- 20.Baban B, Liu JY and Mozaffari MS (2013) Pressure overload regulates expression of cytokines, gammaH2AX, and growth arrest- and DNA-damage inducible protein 153 via glycogen synthase kinase-3beta in ischemic-reperfused hearts. Hypertension 61, 95–104, 10.1161/HYPERTENSIONAHA.111.00028 [DOI] [PubMed] [Google Scholar]
- 21.Tipton AJ, Baban B and Sullivan JC (2014) Female spontaneously hypertensive rats have a compensatory increase in renal regulatory T cells in response to elevations in blood pressure. Hypertension 64, 557–564, 10.1161/HYPERTENSIONAHA.114.03512 [DOI] [PMC free article] [PubMed] [Google Scholar]
- 22.O’Connor PM, Chen J, Taylor L, Ray SC, Baban B and Sullivan JC (2016) Bicarbonate therapy has no effect on renal T-cell infiltration or blood pressure but markedly reduces tubular casts/fibrosis and is associated with an M1 to M2 polarization in Dahl salt-sensitive rats. FASEB J. 30, 968 [Google Scholar]
- 23.Yoshioka T, Shiraga H, Yoshida Y, Fogo A, Glick AD, Deen WM et al. (1988) “Intact nephrons” as the primary origin of proteinuria in chronic renal disease. Study in the rat model of subtotal nephrectomy. J. Clin. Invest 82, 1614–1623, 10.1172/JCI113773 [DOI] [PMC free article] [PubMed] [Google Scholar]
- 24.Scialla JJ, Appel LJ, Astor BC, Miller ER III, Beddhu S, Woodward M et al. (2012) Net endogenous acid production is associated with a faster decline in GFR in African Americans. Kidney Int. 82, 106–112, 10.1038/ki.2012.82 [DOI] [PMC free article] [PubMed] [Google Scholar]
- 25.Feng D, Yang C, Geurts AM, Kurth T, Liang M, Lazar J et al. (2012) Increased expression of NAD(P)H oxidase subunit p67(phox) in the renal medulla contributes to excess oxidative stress and salt-sensitive hypertension. Cell Metab. 15, 201–208, 10.1016/j.cmet.2012.01.003 [DOI] [PMC free article] [PubMed] [Google Scholar]
- 26.Yum V, Carlisle RE, Lu C, Brimble E, Chahal J, Upagupta C et al. (2017) Endoplasmic reticulum stress inhibition limits the progression of chronic kidney disease in the Dahl salt-sensitive rat. Am. J. Physiol. Renal Physiol 312, F230–F244, 10.1152/ajprenal.00119.2016 [DOI] [PubMed] [Google Scholar]
- 27.Cowley AW Jr, Yang C, Zheleznova NN, Staruschenko A, Kurth T, Rein L et al. (2015) Evidence of the importance of Nox4 in production of hypertension in Dahl salt-sensitive rats. Hypertension 67, 440–450 [DOI] [PMC free article] [PubMed] [Google Scholar]
- 28.Arai K, Tsuruoka H and Homma T (2015) CS-3150, a novel non-steroidal mineralocorticoid receptor antagonist, prevents hypertension and cardiorenal injury in Dahl salt-sensitive hypertensive rats. Eur. J. Pharmacol 769, 266–273, 10.1016/j.ejphar.2015.11.028 [DOI] [PubMed] [Google Scholar]
- 29.Rafiq K, Nishiyama A, Konishi Y, Morikawa T, Kitabayashi C, Kohno M et al. (2014) Regression of glomerular and tubulointerstitial injuries by dietary salt reduction with combination therapy of angiotensin II receptor blocker and calcium channel blocker in Dahl salt-sensitive rats. PLoS One 9, e107853, 10.1371/journal.pone.0107853 [DOI] [PMC free article] [PubMed] [Google Scholar]
- 30.Mattson DL (2014) Infiltrating immune cells in the kidney in salt-sensitive hypertension and renal injury. Am. J. Physiol. Renal Physiol 307, F499–508, 10.1152/ajprenal.00258.2014 [DOI] [PMC free article] [PubMed] [Google Scholar]
- 31.Chen X, Mori T, Guo Q, Hu C, Ohsaki Y, Yoneki Y et al. (2013) Carbonyl stress induces hypertension and cardio-renal vascular injury in Dahl salt-sensitive rats. Hypertens. Res 36, 361–367, 10.1038/hr.2012.204 [DOI] [PMC free article] [PubMed] [Google Scholar]
- 32.Regner KR, Harmon AC, Williams JM, Stelloh C, Johnson AC, Kyle PB et al. (2012) Increased susceptibility to kidney injury by transfer of genomic segment from SHR onto Dahl S genetic background. Physiol. Genomics 44, 629–637, 10.1152/physiolgenomics.00015.2012 [DOI] [PMC free article] [PubMed] [Google Scholar]
- 33.Diaz Encarnacion MM, Warner GM, Gray CE, Cheng J, Keryakos HK, Nath KA et al. (2008) Signaling pathways modulated by fish oil in salt-sensitive hypertension. Am. J. Physiol. Renal Physiol 294, F1323–F1335, 10.1152/ajprenal.00401.2007 [DOI] [PMC free article] [PubMed] [Google Scholar]
- 34.Chao J, Zhang JJ, Lin KF and Chao L (1998) Adenovirus-mediated kallikrein gene delivery reverses salt-induced renal injury in Dahl salt-sensitive rats. Kidney Int. 54, 1250–1260, 10.1046/j.1523-1755.1998.00104.x [DOI] [PubMed] [Google Scholar]
- 35.Chao J, Li HJ, Yao YY, Shen B, Gao L, Bledsoe G et al. (2007) Kinin infusion prevents renal inflammation, apoptosis, and fibrosis via inhibition of oxidative stress and mitogen-activated protein kinase activity. Hypertension 49, 490–497, 10.1161/01.HYP.0000255925.01707.eb [DOI] [PubMed] [Google Scholar]
- 36.Hirawa N, Uehara Y, Suzuki T, Kawabata Y, Numabe A, Gomi T et al. (1999) Regression of glomerular injury by kallikrein infusion in Dahl salt-sensitive rats is a bradykinin B2-receptor-mediated event. Nephron 81, 183–193, 10.1159/000045275 [DOI] [PubMed] [Google Scholar]
- 37.Uehara Y, Hirawa N, Kawabata Y, Akie Y, Ichikawa A, Funahashi N et al. (1997) Immunosuppressant HR-325 attenuates progression of malignant arteritis in the kidney of Dahl salt-sensitive rats. Hypertens. Res 20, 91–97, 10.1291/hypres.20.91 [DOI] [PubMed] [Google Scholar]
- 38.Hirawa N, Uehara Y, Kawabata Y, Ohshima N, Ono H, Nagata T et al. (1994) Mechanistic analysis of renal protection by angiotensin converting enzyme inhibitor in Dahl salt-sensitive rats. J. Hypertens 12, 909–918, 10.1097/00004872-199408000-00008 [DOI] [PubMed] [Google Scholar]
- 39.Uehara Y, Kawabata Y, Ohshima N, Hirawa N, Takada S, Numabe A et al. (1994) New dihydropyridine calcium channel antagonist, pranidipine, attenuates hypertensive renal injury in Dahl salt-sensitive rats. J. Cardiovasc. Pharmacol 23, 970–979, 10.1097/00005344-199406000-00016 [DOI] [PubMed] [Google Scholar]
- 40.Uehara Y, Kawabata Y, Shirahase H, Wada K, Hashizume Y, Morishita S et al. (1993) Oxygen radical scavengers and renal protection by indapamide diuretic in salt-induced hypertension of Dahl strain rats. J. Cardiovasc. Pharmacol 22, S42–S46, 10.1097/00005344-199312050-00008 [DOI] [PubMed] [Google Scholar]
- 41.Uehara Y, Numabe A, Hirawa N, Kawabata Y, Iwai J, Ono H et al. (1991) Antihypertensive effects of cicletanine and renal protection in Dahl salt-sensitive rats. J. Hypertens 9, 719–728, 10.1097/00004872-199108000-00005 [DOI] [PubMed] [Google Scholar]
- 42.Huang B, Cheng Y, Usa K, Liu Y, Baker MA, Mattson DL et al. (2016) Renal tumor necrosis factor alpha contributes to hypertension in Dahl salt-sensitive rats. Sci. Rep 6, 21960, 10.1038/srep21960 [DOI] [PMC free article] [PubMed] [Google Scholar]
- 43.Rudemiller NP, Lund H, Priestley JR, Endres BT, Prokop JW, Jacob HJ et al. (2015) Mutation of SH2B3 (LNK), a genome-wide association study candidate for hypertension, attenuates Dahl salt-sensitive hypertension via inflammatory modulation. Hypertension 65, 1111–1117, 10.1161/HYPERTENSIONAHA.114.04736 [DOI] [PMC free article] [PubMed] [Google Scholar]
- 44.Geurts AM, Mattson DL, Liu P, Cabacungan E, Skelton MM, Kurth TM et al. (2014) Maternal diet during gestation and lactation modifies the severity of salt-induced hypertension and renal injury in Dahl salt-sensitive rats. Hypertension 65, 447–455, 10.1161/HYPERTENSIONAHA.114.04179 [DOI] [PMC free article] [PubMed] [Google Scholar]
- 45.Taylor NE and Cowley AW Jr (2005) Effect of renal medullary H2O2 on salt-induced hypertension and renal injury. Am. J. Physiol. Regul. Integr. Comp. Physiol 289, R1573–R1579, 10.1152/ajpregu.00525.2005 [DOI] [PubMed] [Google Scholar]
- 46.Tian N, Thrasher KD, Gundy PD, Hughson MD and Manning RD Jr (2005) Antioxidant treatment prevents renal damage and dysfunction and reduces arterial pressure in salt-sensitive hypertension. Hypertension 45, 934–939, 10.1161/01.HYP.0000160404.08866.5a [DOI] [PubMed] [Google Scholar]
- 47.Tian N, Gu JW, Jordan S, Rose RA, Hughson MD and Manning RD Jr (2007) Immune suppression prevents renal damage and dysfunction and reduces arterial pressure in salt-sensitive hypertension. Am. J. Physiol. Heart Circ. Physiol 292, H1018–H1025, 10.1152/ajpheart.00487.2006 [DOI] [PubMed] [Google Scholar]
- 48.Tian N, Rose RA, Jordan S, Dwyer TM, Hughson MD and Manning RD Jr (2006) N-Acetylcysteine improves renal dysfunction, ameliorates kidney damage and decreases blood pressure in salt-sensitive hypertension. J. Hypertens 24, 2263–2270, 10.1097/01.hjh.0000249705.42230.73 [DOI] [PubMed] [Google Scholar]
- 49.Tian N, Moore RS, Phillips WE, Lin L, Braddy S, Pryor JS et al. (2008) NADPH oxidase contributes to renal damage and dysfunction in Dahl salt-sensitive hypertension. Am. J. Physiol. Regul. Integr. Comp. Physiol 295, R1858–R1865, 10.1152/ajpregu.90650.2008 [DOI] [PMC free article] [PubMed] [Google Scholar]
- 50.Hirawa N, Uehara Y, Kawabata Y, Numabe A, Ohshima N, Ono H et al. (1995) Subpressor dose of angiotensin II increases susceptibility to the haemodynamic injury of blood pressure in Dahl salt-sensitive rats. J. Hypertens 13, 81–90, 10.1097/00004872-199501000-00013 [DOI] [PubMed] [Google Scholar]
- 51.Uehara Y, Takada S, Hirawa N, Kawabata Y, Ohshima N, Numabe A et al. (1994) Vasoconstrictors and renal protection induced by beta 1-selective adrenoceptor antagonist bisoprolol. J. Cardiovasc. Pharmacol 23, 897–906, 10.1097/00005344-199406000-00007 [DOI] [PubMed] [Google Scholar]
- 52.Kojima N, Williams JM, Slaughter TN, Kato S, Takahashi T, Miyata N et al. (2015) Renoprotective effects of combined SGLT2 and ACE inhibitor therapy in diabetic Dahl S rats. Physiol. Rep 3, 10.14814/phy2.12436 [DOI] [PMC free article] [PubMed] [Google Scholar]
- 53.Slaughter TN, Paige A, Spires D, Kojima N, Kyle PB, Garrett MR et al. (2013) Characterization of the development of renal injury in Type-1 diabetic Dahl salt-sensitive rats. Am. J. Physiol. Regul. Integr. Comp. Physiol 305, R727–R734, 10.1152/ajpregu.00382.2012 [DOI] [PMC free article] [PubMed] [Google Scholar]
- 54.Kriz W and LeHir M (2005) Pathways to nephron loss starting from glomerular diseases-insights from animal models. Kidney Int. 67, 404–419, 10.1111/j.1523-1755.2005.67097.x [DOI] [PubMed] [Google Scholar]
- 55.Tryggvason K and Pettersson E (2003) Causes and consequences of proteinuria: the kidney filtration barrier and progressive renal failure. J. Intern. Med 254, 216–224, 10.1046/j.1365-2796.2003.01207.x [DOI] [PubMed] [Google Scholar]
- 56.Schlondorff DO (2008) Overview of factors contributing to the pathophysiology of progressive renal disease. Kidney Int. 74, 860–866, 10.1038/ki.2008.351 [DOI] [PubMed] [Google Scholar]
- 57.Rutecki GJ, Goldsmith C and Schreiner GE (1971) Characterization of proteins in urinary casts. Fluorescent-antibody identification of Tamm-Horsfall mucoprotein in matrix and serum proteins in granules. N. Engl. J. Med 284, 1049–1052, 10.1056/NEJM197105132841901 [DOI] [PubMed] [Google Scholar]
- 58.Schumann GB, Harris S and Henry JB (1978) An improved technic for examining urinary casts and a review of their significance. Am. J. Clin. Pathol 69, 18–23, 10.1093/ajcp/69.1.18 [DOI] [PubMed] [Google Scholar]
- 59.Bichler KH, Henzler B, Strohmaier WL, Stahl C and Korn S (1995) The significance of citrate, uromucoid and GAG for diagnosis of renal tubular acidosis in patients with urinary calculi. Urol. A 34, 437–443 [PubMed] [Google Scholar]
- 60.Haque MZ, Ares GR, Caceres PS and Ortiz PA (2011) High salt differentially regulates surface NKCC2 expression in thick ascending limbs of Dahl salt-sensitive and salt-resistant rats. Am. J. Physiol. Renal Physiol 300, F1096–F1104, 10.1152/ajprenal.00600.2010 [DOI] [PMC free article] [PubMed] [Google Scholar]
- 61.O’Connor PM, Guha A, Stilphen CA, Sun J and Jin C (2016) Proton channels and renal hypertensive injury: a key piece of the Dahl salt-sensitive rat puzzle? Am. J. Physiol. Regul. Integr. Comp. Physiol 310, R679–R690, 10.1152/ajpregu.00115.2015 [DOI] [PMC free article] [PubMed] [Google Scholar]
- 62.O’Connor PM, Lu L, Liang M and Cowley AW Jr (2009) A novel amiloride-sensitive h+ transport pathway mediates enhanced superoxide production in thick ascending limb of salt-sensitive rats, not na+/h+ exchange. Hypertension 54, 248–254, 10.1161/HYPERTENSIONAHA.109.134692 [DOI] [PMC free article] [PubMed] [Google Scholar]
- 63.Tanner GA and Sophasan S (1976) Kidney pressures after temporary renal artery occlusion in the rat. Am. J. Physiol 230, 1173–1181 [DOI] [PubMed] [Google Scholar]
- 64.Vylet’al P, Kublova M, Kalbacova M, Hodanova K, Baresova V, Stiburkova B et al. (2006) Alterations of uromodulin biology: a common denominator of the genetically heterogeneous FJHN/MCKD syndrome. Kidney Int. 70, 1155–1169, 10.1038/sj.ki.5001728 [DOI] [PubMed] [Google Scholar]
- 65.Nath KA, Hostetter MK and Hostetter TH (1985) Pathophysiology of chronic tubulo-interstitial disease in rats. Interactions of dietary acid load, ammonia, and complement component C3. J. Clin. Invest 76, 667–675, 10.1172/JCI112020 [DOI] [PMC free article] [PubMed] [Google Scholar]
- 66.Wesson DE and Simoni J (2010) Acid retention during kidney failure induces endothelin and aldosterone production which lead to progressive GFR decline, a situation ameliorated by alkali diet. Kidney Int. 78, 1128–1135, 10.1038/ki.2010.348 [DOI] [PubMed] [Google Scholar]
- 67.Goraya N, Simoni J, Jo CH and Wesson DE (2014) Treatment of metabolic acidosis in patients with stage 3 chronic kidney disease with fruits and vegetables or oral bicarbonate reduces urine angiotensinogen and preserves glomerular filtration rate. Kidney Int. 86, 1031–1038, 10.1038/ki.2014.83 [DOI] [PubMed] [Google Scholar]
- 68.Phisitkul S, Hacker C, Simoni J, Tran RM and Wesson DE (2008) Dietary protein causes a decline in the glomerular filtration rate of the remnant kidney mediated by metabolic acidosis and endothelin receptors. Kidney Int. 73, 192–199, 10.1038/sj.ki.5002647 [DOI] [PubMed] [Google Scholar]