Abstract
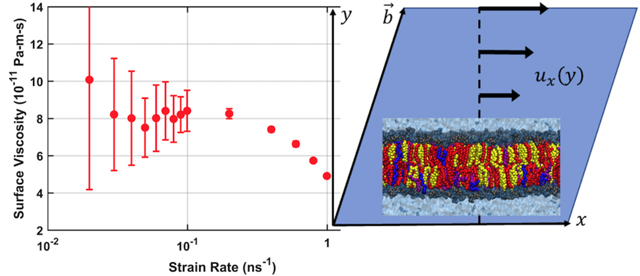
Nonequilibrium simulation protocols based on shear deformations are applied to determine the surface viscosity and interleaflet friction of lipid bilayers. At high shear rates a non-Newtonian shear thinning regime is observed, but lower shear rates yield a Newtonian plateau and results that are consistent with equilibrium measurements based on fluctuation dissipation theorems. Application to all-atom bilayers modeled with the CHARMM36 parameter set yields values for the surface viscosity that are consistent with microscopic measurements based on membrane protein diffusion, but are approximately ten times lower than more macroscopic experimental measurements. The interleaflet friction is about ten times lower than experimental measurements. Trends across different lipids, temperatures, and ternary liquid disordered phase mixtures produce results that are consistent with experimental diffusion constants. Application of the protocol to the liquid-ordered phase fails to yield a Newtonian plateau, suggesting more complex rheology.
Graphical Abstract
Introduction
The time-dependent response of a cell membrane governs many of the properties that are critical to its biological function, such as the diffusion and encounter of membrane proteins and the dynamics of membrane remodeling processes. However, the parameters that describe the dynamic response of a lipid bilayer, such as membrane surface shear viscosity (ηm) and interleaflet friction (b), are not as well characterized experimentally1–5 as equilibrium properties such as the area per lipid, bending modulus, and 2H NMR order parameters. Similarly, only a few studies have calculated these parameters from simulation.6–9 Authors of popular membrane force fields (FF) therefore parameterize models using static thermodynamic quantities such as area per lipid or the solvation free energy of small molecules rather than comparatively more difficult-to-calculate hydrodynamic properties.10–14 As a result, these FF obtain excellent agreement with experiment for chain order parameters (which are highly correlated with surface area) and mechanical properties such as area compressibility, bending constants, and spontaneous curvatures.15 However, their nonequilibrium properties are not well-characterized and may not capture the dynamics of lipid bilayers measured experimentally. The self-diffusion constants of lipids are particularly attractive targets for FF validation because they are readily available from experiment and can be obtained from simulation with high precision. However, the strong effect of periodic boundary conditions on translational diffusion16–18 necessities an extrapolation to infinite system size to compare directly with experiment, and both ηm and b are key parameters in the extrapolation. Although ηm and b may be determined through fits to theory,19–20 an independent means of calculating them greatly enhances the precision of the extrapolation and also provides an independent test of the theory as it applies to both lipids and proteins.
A pair of papers by den Otter and Shkulipa introduced a method for calculating ηm and b using non-equilibrium simulations which impose either a lateral or tangential shear on the membrane, and applied the method to the several lipids in the Martini coarse-grained (CG) FF.7–8 Motivated by their approach, this paper utilizes a related protocol for driving bilayers to a nonequilibrium steady state followed by a calculation of these parameters for homogeneous lipid bilayers in both the Martini CG and the CHARMM36 (C36)11 all-atom force fields. Surface viscosities for C36 liquid ordered (Lo) and disordered (Ld) bilayers are also reported. Other calculations of these properties in the literature for CG systems include interleaflet friction calculated from undulation relaxation rates9, 21–22 and surface viscosity calculated from simulated tether pulling.6 Neither approach has been pursued here, as values calculated from shearing simulations show good agreement with equilibrium approaches.7
Before using non-equilibrium simulations to calculate ηm and b for membranes, we validate the method against published results for a well-characterized system. Water is a natural choice because the viscosity of water in both force fields has been well-established using equilibrium methods.23–24 Once a set of best practices is established for calculating the viscosity of water, we turn to more complex systems, starting with Martini dipalmitoylphosphatidylcholine (DPPC). The results for Martini DPPC are compared to the values published by den Otter and Shkulipa before proceeding to all-atom single component bilayers of DPPC, dioleoylphosphatidylcholine (DOPC), and mixtures of DPPC/DOPC/cholesterol in the liquid ordered (Lo) and liquid disordered (Ld) phases.
Methods
Homogenous Fluid
The stress σij exerted between adjacent layers of a Newtonian fluid is proportional to the transverse velocity gradient according to the relation
| (1) |
where η is the shear viscosity and is the fluid velocity field. This relation may be used to calculate the viscosity of a simulated fluid undergoing steady, uniform shear. Consider a homogenous fluid with a flow field given by
| (2) |
where is the shear rate of the fluid. From Equation 1, this results in a shear stress . This stress is equal to the virial pressure tensor element Pxy after a conventional sign change (under compression, pressure is positive and stress is negative):
| (3) |
We may thus calculate the viscosity of a simulated fluid by imposing a steady, modest shear and computing the resultant shear stress via the virial pressure tensor. In the following, the shear is achieved through a steady deformation of the periodic box at a prescribed strain (hereafter referred to as the box deformation method). The Bussi velocity-rescaling25 thermostat is used for Martini simulations and a Nosé-Hoover chain26–27 is used for C36.
Performing shearing simulations of TIP3P water serves three purposes: (1) to evaluate the efficacy of our shearing protocol for calculating viscosity in the context of an all-atom force field, (2) to validate the results of that calculation using published values calculated from equilibrium simulations, and (3) to identify the relevant time scales and uncertainty in advance of the more extensive series of simulations involving all-atom membranes.
Surface Shear Viscosity
Membrane surface viscosity is a 2D viscosity resisting lateral shear. Since the total change in momentum within a region must equal the stress through its boundary, the stress tensor must have units of force per area in 3D and force per length in 2D. It follows that surface viscosity has units of viscosity × length. For a membrane situated in the xy plane, we can write an expression for surface viscosity
| (4) |
| (5) |
where σij is the viscous stress tensor and ηm is the surface viscosity of a membrane with thickness h and an effective 3D viscosity .
Following the analysis of den Otter and Shkulipa7–8 the membrane stress is equal to the total stress of the system minus the contribution from the solvent
| (6) |
where Lzis the height of the box and ηw is the viscosity of the solvent. Shear rates are varied until a regime is identified where the surface viscosity does not depend on shear rate, i.e. the Newtonian regime. This ensures that the surface viscosity is calculated for systems near equilibrium.
As an additional form of validation, we may check for correspondence with equilibrium simulations by calculating the total viscosity of the system and comparing it with the first term on the RHS of Equation 6. This is possible with either a Green-Kubo relation28
| (7) |
or the equivalent Einstein relation29
| (8) |
where V is the volume of the cell, kB is Boltzmann’s constant, T is the temperature. Equation 7 converges slowly due to pressure fluctuations in the simulation, which are typically large relative to the average pressure. When enough samples are available, the value of the integral will plateau as the upper limit of integration becomes long relative to the relaxation time. However, fewer samples are available at such long times and the calculation becomes unreliable due to statistical error. This is compounded by the restriction that estimates of ηTOT only consider the xy element of the pressure tensor, while those for homogenous fluids may average over all off-diagonal Pαβ. Better results are often available via Equation 8 by fitting the time-averaged value of the integral to the lag time (see Supplemental Figures S1 and S2.)
Equilibrating the membrane to a truly relaxed state is necessary to obtain an accurate calculation of its equilibrium surface viscosity. For a poorly-equilibrated membrane, the surface viscosity calculated from Equation 6 diverges as . This is illustrated by solving Equation 6 for the pressure and adding a constant term Txy to represent the latent stress in the system:
| (9) |
As the shearing contribution to the stress tensor is decreased, the constant contribution from the membrane’s latent stress becomes dominant. If we apply the analysis developed for calculating ηm, assuming Pxy is proportional to the shear rate, this equation results in the divergence as . This divergence allows identification of poorly-equilibrated systems from plots of the apparent surface viscosity as a function of shear rate. For more details see.29
Although the coarse-graining of DPPC in the Martini FF has remained unchanged since the initial publication30, the parameters which den Otter and Shkulipa used in shearing simulations7 have been updated.12, 31–32 In particular, interactions have generally become more attractive both among headgroup beads and between the headgroup beads and water, while interactions between headgroup and tail beads have become more repulsive. Since the overall attraction between lipids has increased, greater surface shear viscosities from simulations using newer Martini parameters relative to the findings of den Otter and Shkulipa is expected. Surface viscosity is computed for DPPC using two versions of Martini: the current version, Martini 2.2,31 and the original version used by den Otter and Shkulipa8 (henceforth “Martini 2004”).
A well-documented difficulty within the CHARMM all-atom force field is the treatment of the nonbonded cutoff lengths.15, 33–34 The lipid force field was parameterized with nonbonded forces switching off over the range of 8–12 Å11 while proteins were parameterized using the range 10–12 Å.35 This inconsistency presents a problem when simulating membranes with embedded proteins. Equilibrium area per lipid is quite sensitive to the treatment of nonbounded force calculations including the cutoff lengths33 and the frequency of recalculating long-range interactions.36 Whenever possible, the same simulation parameters and software should be used as were used to parameterize the force field. Further discrepancies arise among different MD programs due to subtle differences in implementation (e.g., the exact form of the force switching).
One study comparing DPPC area per lipid using different MD programs with various force switching ranges (8–10, 8–12, 10–12) found 8–10 Å to be the most accurate when using GROMACS.33 Thus, we are presented with three choices for the cutoff ranges in our shearing simulations: (1) 8–10, which best agrees with experiment when using GROMACS, but was not used during force field parameterization; (2) 10–12, which was used for protein parameterization, and therefore is the most widely-used; and (3) 8–12, which was used for lipid parameterization and for simulations of lipid diffusion analyzed with the periodic Saffman-Delbrück theory of Camley and Brown.19 Here surface viscosity is calculated using 8–10 and 8–12 for DPPC to discern the significance of the cutoff treatment and only 8–12 for all other membranes.
Interleaflet Friction
Membrane interleaflet friction may also be calculated from non-equilibrium simulations. The definition of interleaflet friction b is given by
| (10) |
where F is the friction force as the leaflets slide past one another and Δv is their relative velocity. The interleaflet friction may be calculated from simulation by applying steady differential traction forces to each leaflet and recording the resulting mean relative velocity of the leaflets. In principle, this can be achieved through any traction force acting on the leaflets. Assuming stick boundary conditions, a parallel shear flow in the solvent with shear rate will exert a traction force on each leaflet given by
| (11) |
Adding the traction forces on each leaflet, b is calculated
| (12) |
| (13) |
The solvent shear rate must be calculated from the simulation trajectory by fitting to an average velocity profile along the shearing directions. Relative velocity is easily obtained by fitting the difference between leaflets as a function of time, where the leaflet position for each frame is given by its center of mass along the direction of the traction forces. The force applied to the membrane must be directly proportional to the relative velocity between the leaflets Δv for Eq. 13 to hold. With stick boundary conditions, this implies a direct relationship between Δv and the solvent shear rate. Thus, for our calculation of b to be accurate, it must be independent of the solvent shear rate calculated from the velocity profile.
Shearing the solvent through box deformation imposes a differential force throughout each leaflet, complicating the task of computing the force exerted at the interface. As a simpler alternative to Lees-Edwards boundary conditions, Fig. 1 depicts a method developed for this study whereby a constant force is applied to all particles near the vertical periodic boundaries. This method creates a nonlinear velocity profile in the vicinity of the forcing which rapidly transitions to a linear velocity gradient toward the center of the box. A linear fit to this part of the velocity profile gives the solvent shear rate at the solvent-membrane interface.
Figure 1:
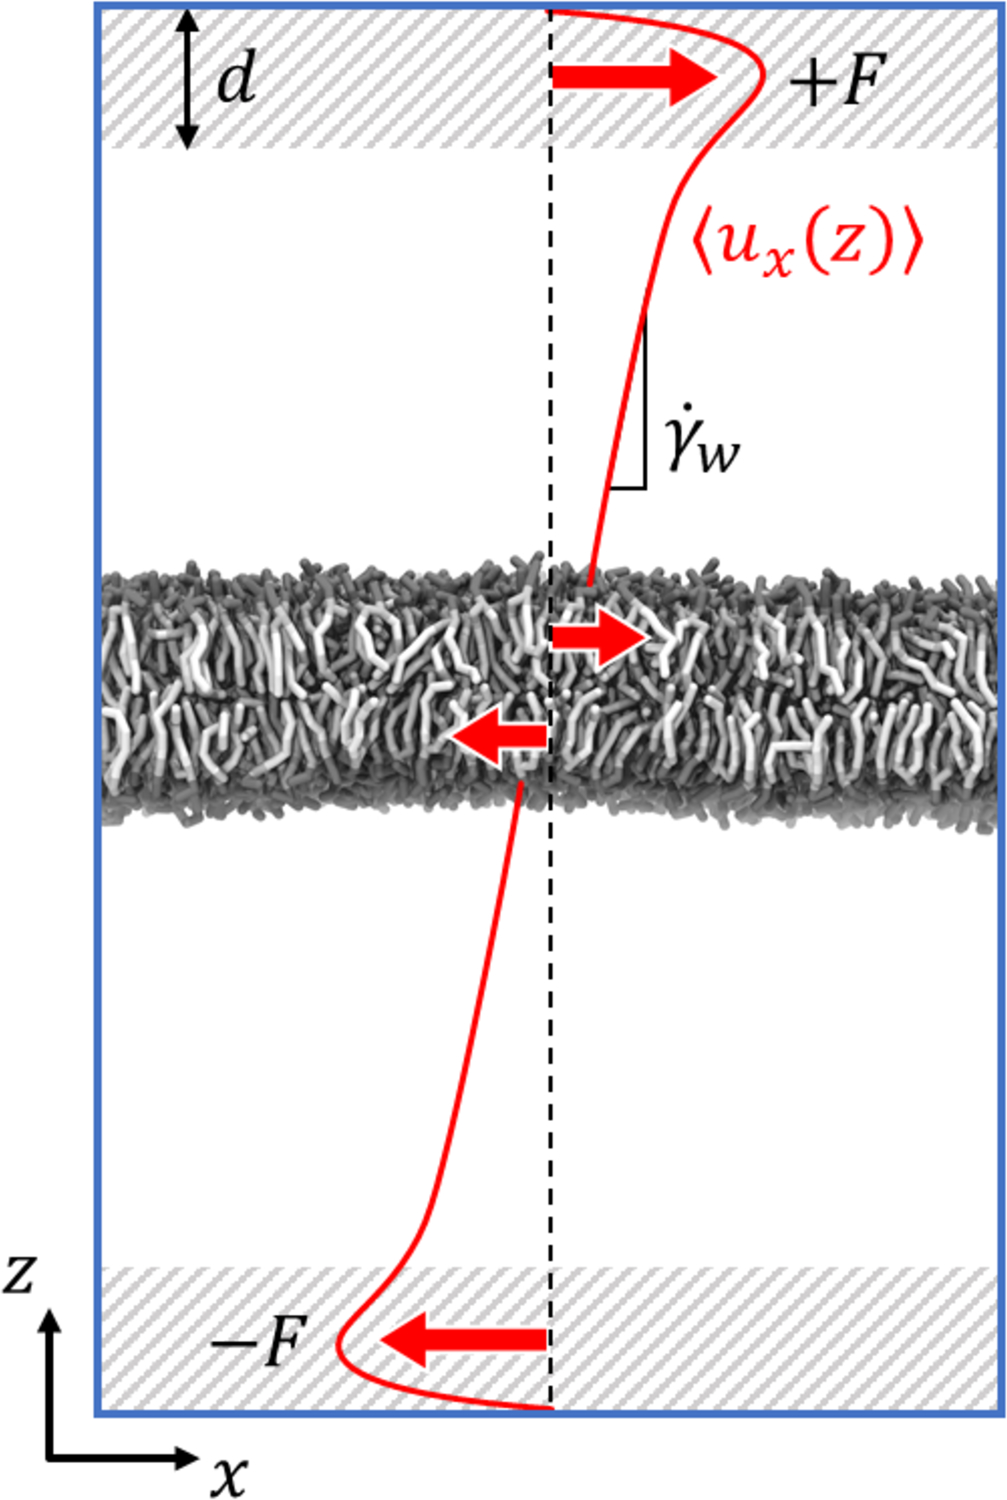
Diagram of the normal direction shear protocol. A uniform force ±F is applied to all particles in the shaded regions of thickness d near the vertical periodic boundaries. Not far from these regions, the x-velocity profile becomes a linear function of z with shear rate . The resulting traction forces on the leaflets are depicted with smaller red arrows.
Obtaining a well-resolved velocity profile requires both spatial and temporal averaging. For each frame of the trajectory, a series of evenly-spaced points are selected along the box dimension normal to the membrane surface, which we can take to be the z axis without loss of generality. The mean velocity for each point may be calculated through a Gaussian-weighted spatial average of all nearby atoms (positions zi) within a certain cutoff. The weights for the jth point located at z = pj are given by
| (14) |
with standard deviation σ controlling the degree of smoothing. The jth point of the velocity profile has velocity uj given by
| (15) |
Where vi are the atom velocities. These profiles are averaged over all frames to obtain the final transverse velocity profile 〈ux (z)〉 and the solvent shear rate . Fits to the profile are performed above and below the membrane separately.
Results
Validation Using Martini Water and CHARMM36 TIP3P
Before running membrane shearing simulations, the viscosity calculation using the box deformation protocol was tested on homogenous cubes of water which may be readily compared with results from equilibrium calculations. Starting with Martini, a 10 nm cube containing c.a. 6100 martini water beads was equilibrated to 1 bar pressure in the NPT ensemble using the parameters from Table S1, then sheared at constant volume in the xy plane using the same parameters with the barostat disabled. Viscosity was calculated using the time average of the pressure tensor element Pxy via Eq. 3. This protocol was carried out over a range of strain rates, so that a Newtonian shear regime could be identified where viscosity does not depend on strain rate.
The analysis is complicated by the fact that time series of Pxy contains large fluctuations. Obtaining precise averages requires significant simulation time, even for systems at steady state. Preliminary simulations were carried out to characterize this uncertainty and inform the necessary length of our production simulations. The average uncertainty of these simulations found diminishing returns for simulations longer than 200 ns, where statistical uncertainty prohibits calculation of viscosity involving off-diagonal stress less than 0.1 bar. In the following, this uncertainty is further mitigated by running a set of independent replica simulations starting from identical initial states but with randomly assigned initial velocities and different seeds for the random number generator.
Production simulations ran for 420 ns with three independent replicas at each strain rate. The first 20 ns were discarded to account for the transient response to initiating the deformation. Fig. 2 depicts the resulting viscosities as the strain rate is varied. Viscosity is uniform over this range, with an inverse-variance weighted average of 0.6920 ± 0.0082 cP, this agrees with the previous calculation of 0.69 cP at 323 K obtained by Fuhrmans, et al.23 and is in agreement with an independent calculation using equilibrium methods (data not shown), but is somewhat higher than the experimentally determined value of 0.55 cP.
Figure 2:
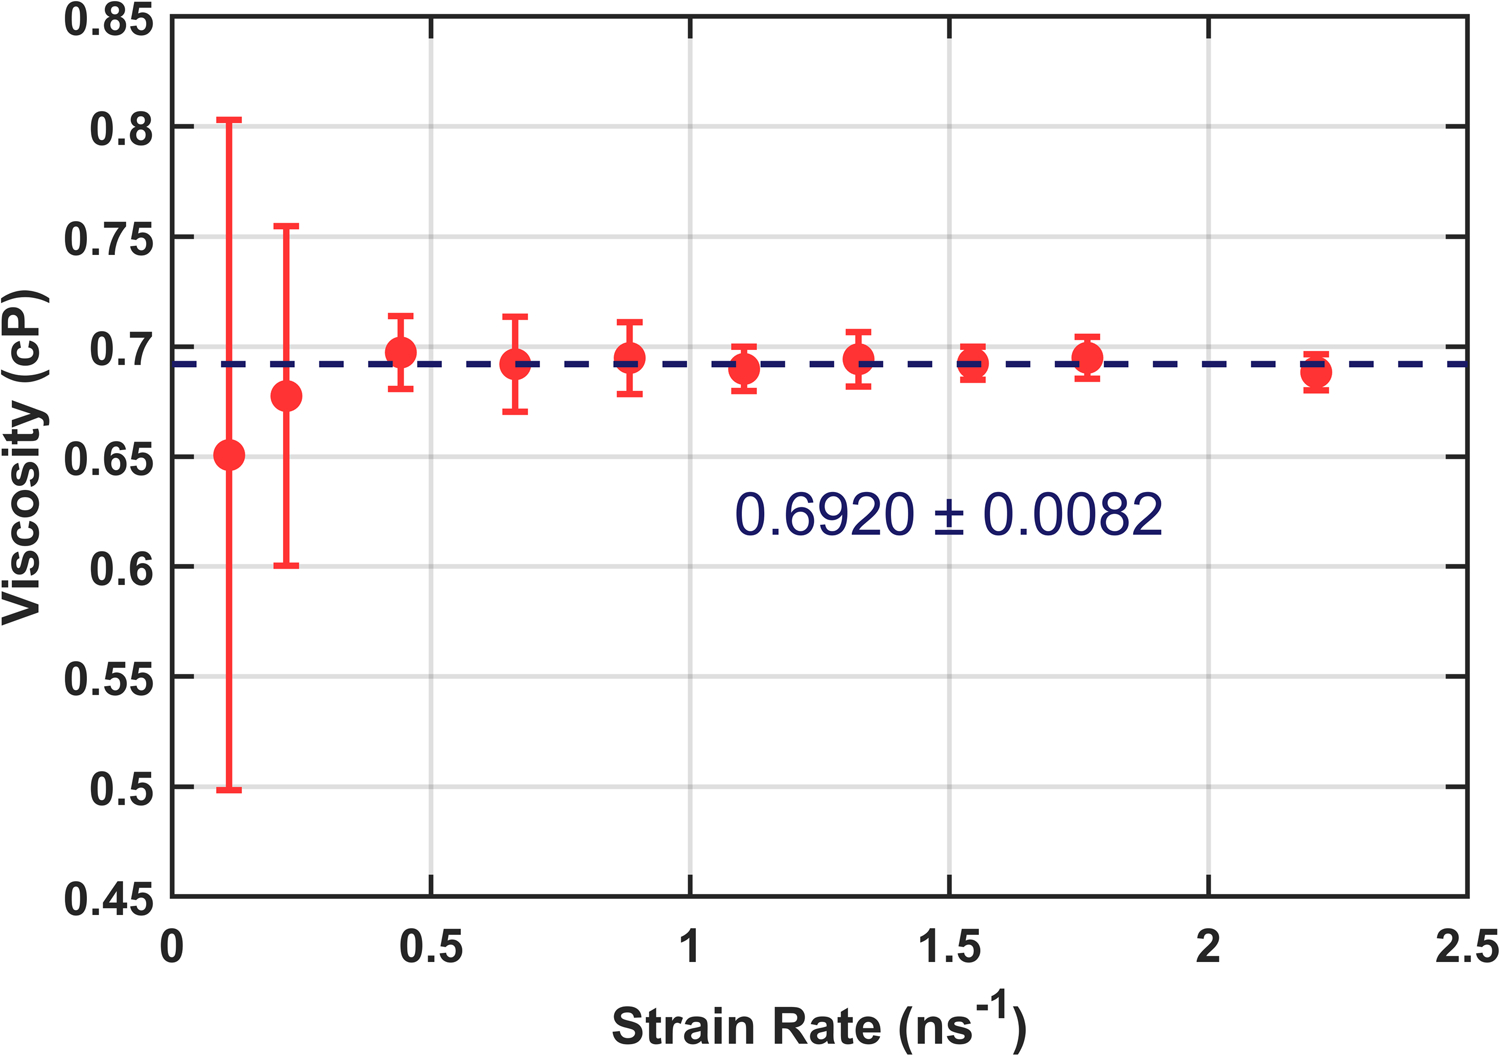
Martini water viscosity as a function of strain rate. Each data point is the average of three 400 ns trials with error bars giving the standard error computed from each set of three trials. The dashed line indicates an inverse-variance weighted average of the data. (see SI for more details)
The TIP3P shearing simulations were carried out on 5 nm cubes containing 4074 TIP3P molecules equilibrated to 1 bar pressure at five temperatures ranging from 293 to 323 K using the parameters from Table S2. Two systems were prepared at each temperature using different treatments of the cutoff for van der Waals interactions, one switching the force to zero over 8–10 Å and the other over 8–12 Å. Both are required in order to test the sensitivity of the solvent viscosity to the cutoff treatment and in anticipation of a discrepancy described in the surface viscosity discussion of the methods.
Each production series includes a range of strain rates from 0.2 to 4.0 ns−1 with five independent replicas used for each rate. Each simulation ran at fixed volume with a shear deformation imposed in the xy plane using the parameters in Table S2 with the barostat disabled. Based on preliminary estimates of the average pressure uncertainty, each simulation was chosen to be 12 ns with the first 2 ns discarded. Viscosity is uniform over the entire range of strain rates for both cutoff treatments. The full data set presented in Fig. 3 compares the present calculation to published results from equilibrium simulations carried out with an 8–12 LJ cutoff and with viscosities obtained using Green-Kubo relations24. There is little difference between the nonequilibrium results, as would be expected because electrostatic interactions dominate water properties. Furthermore, there is excellent agreement over the whole temperature range for the nonequilibrium and reference equilibrium simulations. Note that it is well-established that the viscosity of the TIP3P model is significantly lower than experimentally measured values.
Figure 3:
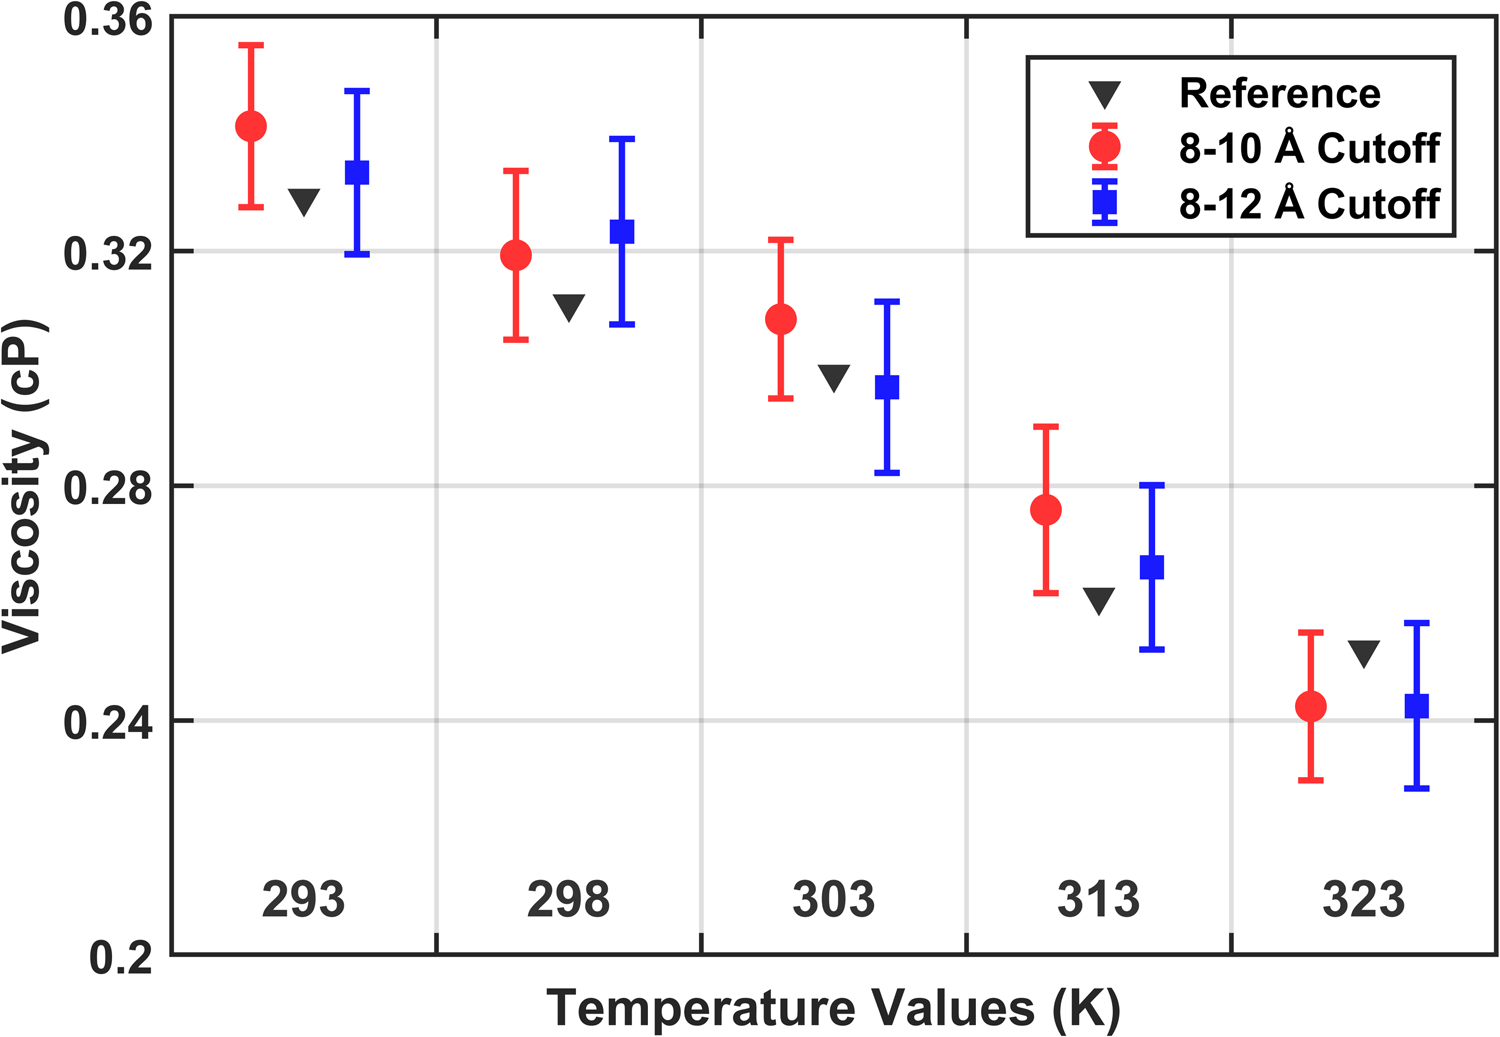
CHARMM36 TIP3P viscosity determined through shearing simulations compared to reference equilibrium calculations. Error bars represent the uncertainty in the weighted fit at each temperature
Surface Shear Viscosity for Martini DPPC
For both Martini 2004 and Martini 2.2, 10 nm membranes consisting of 169 DPPC lipids per leaflet were generated and solvated with a 4 nm layer of Martini water. To reach a state of zero surface tension, ten replicas with different initial velocities were created for both versions and equilibrated over 1 μs using the parameters in Table S3. The final system for both versions was rescaled to equal the inverse-variance weighted average of the box sizes from its ten equilibration simulations (discarding the first 100 ns of each) and run for a further 100 ns in the NVT ensemble to relax disturbances from the box rescaling.
Production simulations were 820 ns with the first 20 ns discarded. They were run at constant volume using the parameters from Table S3 with the barostat disabled and a lateral shear deformation applied in the xy plane. Since the uncertainty in Pxy from a single simulation plateaus around 250 ns, further reductions were achieved by running three replicas for each strain rate with different initial conditions and random seeds. A wide range of strain rates were explored, as shown for Martini 2.2 in Fig. 4. Both the Newtonian plateau and the shear thinning regime are evident from this figure. The danger of simply extrapolating results from the “linear” shear thinning regime is shown in Fig. 5. Without knowing how close one is to the plateau, an extrapolation can significantly over- or underestimate the equilibrium surface viscosity. It is therefore prudent to locate and consider only those strain rates which are slow enough to remain in the Newtonian regime.
Figure 4:
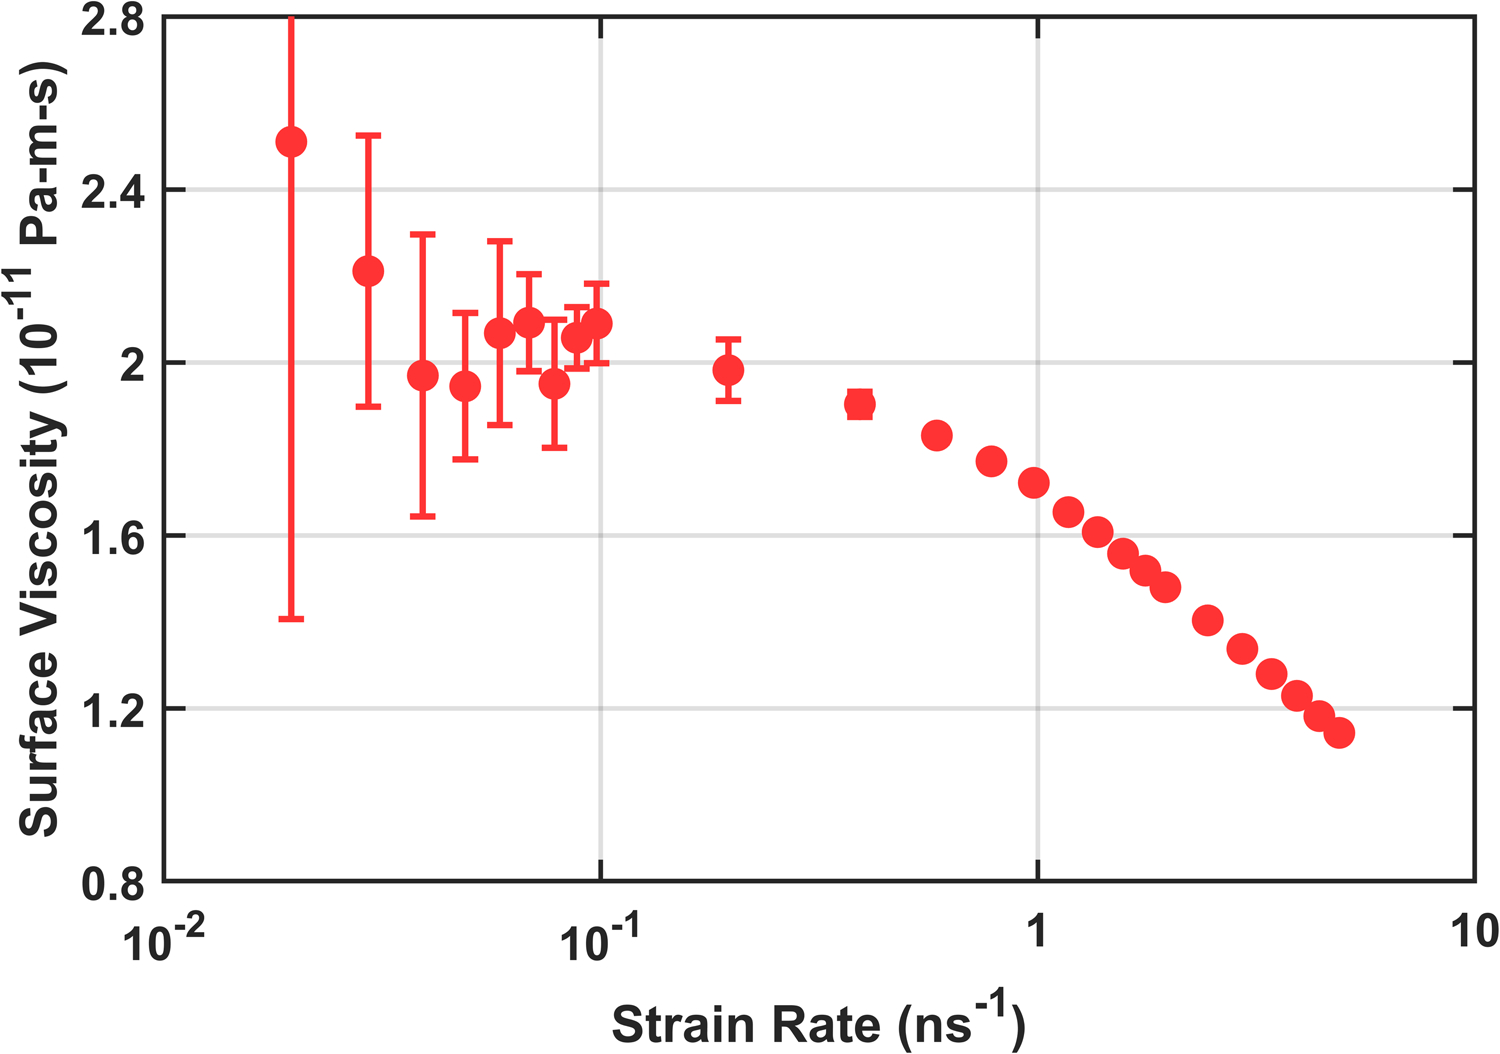
Full range of strain rates demonstrating turnover from Newtonian surface viscosity to shear thinning at higher strain rates for Martini 2.2 DPPC (slowest strain rates omitted for clarity due to large uncertainty bars).
Figure 5:
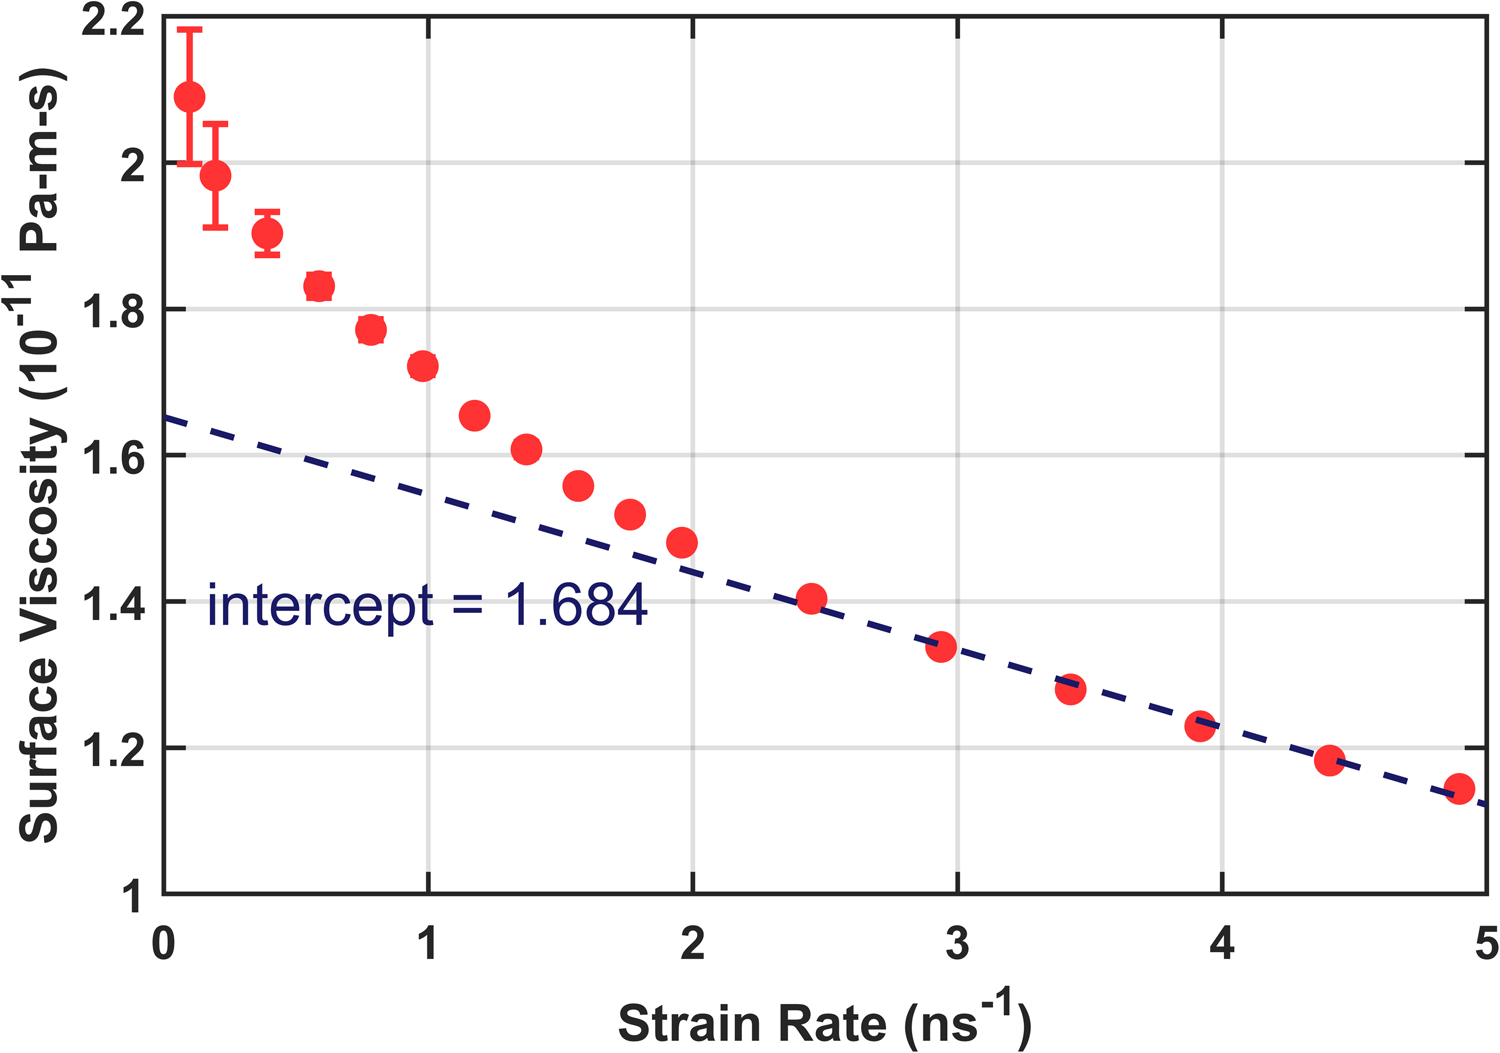
Surface viscosity of Martini DPPC showing only the higher strain rates. An extrapolation from this linear regime (dotted line) significantly underestimates the equilibrium surface viscosity calculated from the low strain regime.
Results from the Newtonian shear regime are shown in Fig. 6. The surface viscosity in Martini 2.2 is higher than Martini 2004, as expected from the increased attraction between lipids. The result for Martini 2004, (1.457 ± 0.043) 10−11 Pa-m-s, compares favorably with the den Otter and Shkulipa result, 1.2 10−11 Pa-m-s,8 considering the implementation differences between MD programs.
Figure 6:
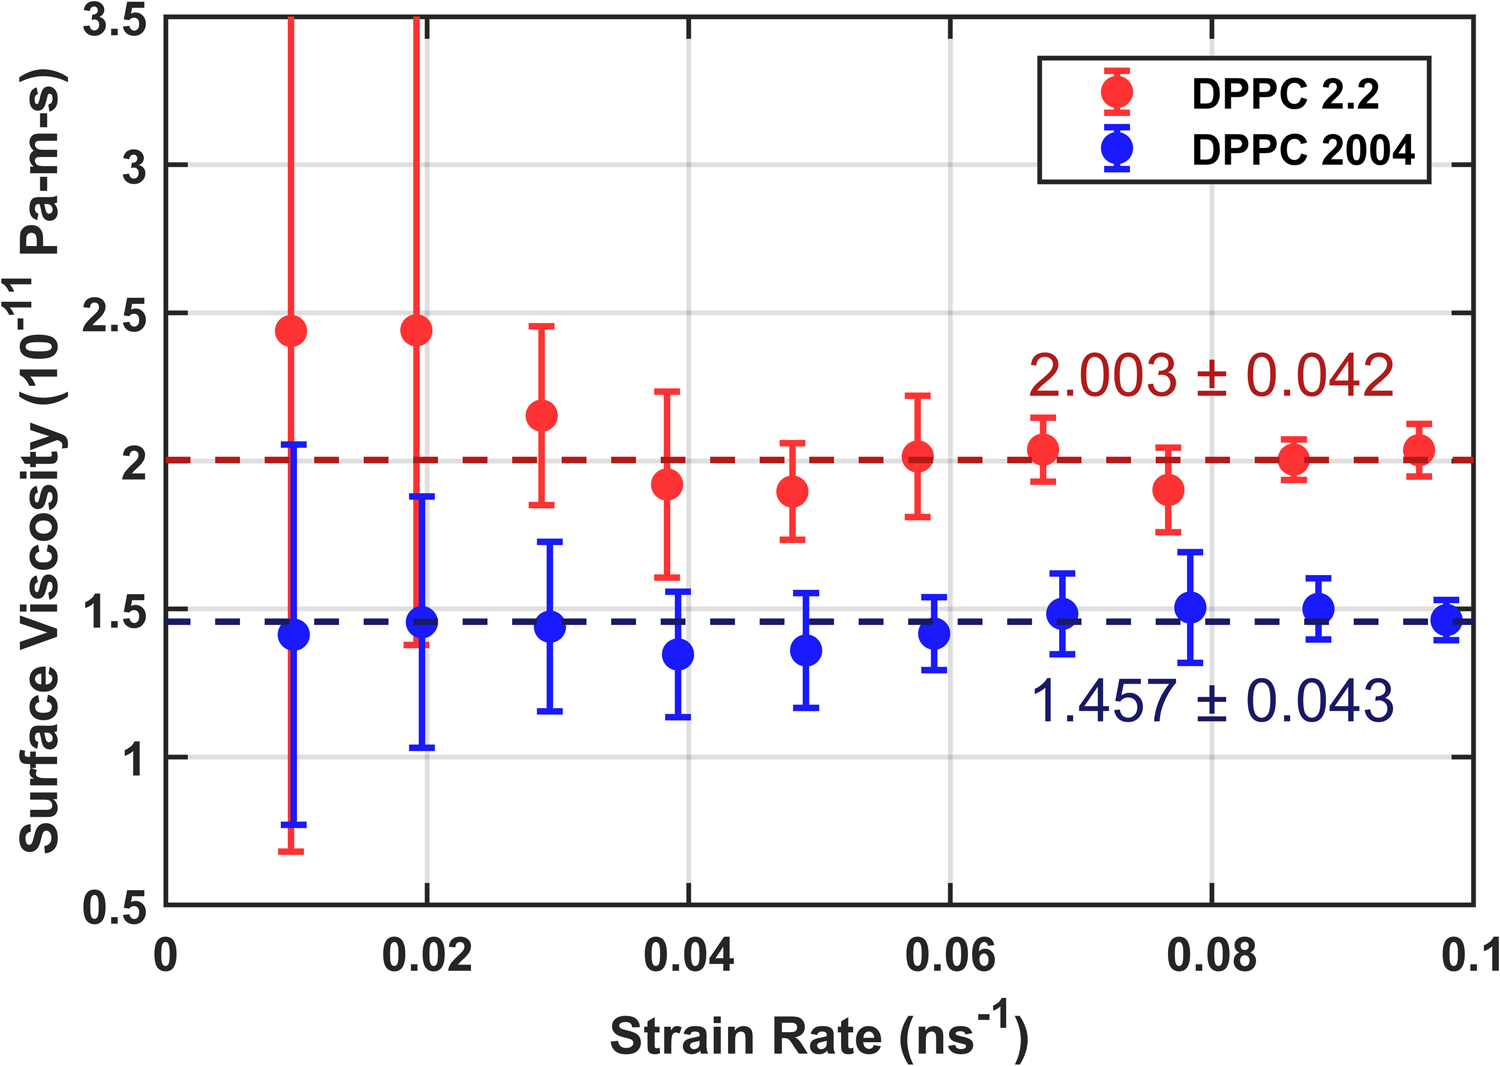
Surface viscosity as a function of strain rate for DPPC membranes using force field parameters for the 2004 version of Martini cited by den Otter and Shkulipa8 and the more recent Martini v2.2. Dotted lines show the result of taking inverse-variance weighted averages for both. Error bars combine the standard error computed from each set of three trials with error propagation.
Total system viscosity (membrane + solvent) for DPPC was calculated from a 1 μs simulation at equilibrium using both the Green-Kubo relation from Equation 7 (Fig. S1) and its equivalent Einstein relation from Equation 8 (Fig. S2). Extracting the total viscosity from the Green-Kubo relationship is difficult as it requires resolving and identifying the “infinite time” plateau, which itself requires precisely resolving long-time correlations. In theory, this plateau extends unbroken to infinite lag times. However, the lack of sampling at long times and the accumulated noise between distant times in the simulation cause the long-time correlations to randomly drift. This leads to a subjective choice over where the plateau is located: where it begins and where it ends. This is avoided when using the Einstein relation, which is calculated using much shorter correlation times. Note that Equation 8 takes the limit of long correlation times. The relevant time scale for comparison is the autocorrelation decay time of the pressure, which decays by 90% in under 1 ps. Hence, the linear fit in Fig. S2 is taken over sufficiently long lag times for the Einstein relation to hold.
The results show close agreement between the weighted average of total viscosity from shearing simulations (2.264 ± 0.042) cP and the average from Einstein relations (2.23 ± 0.21) cP. The uncertainty on the latter figure is obtained by breaking the equilibrium Pxy time series into four equal parts before performing the Einstein relation analysis on each. Fig. S2 shows the result for one of these four.
Surface Shear Viscosity for CHARMM36 Membranes
DPPC was chosen as an initial test case for shearing simulation using the CHARMM36 force field due to its use in experiments and simulations as a standard case. In general, membranes modeled with all-atom force fields are expected to exhibit higher surface viscosities than their coarse-grain counterparts due to the additional conformational freedom of the all-atom fatty acid tails and stronger interactions among their constituent interaction sites. A 10 × 10 nm DPPC membrane patch with 160 lipids per leaflet solvated by a 4 nm layer of TIP3P water was built using the CHARMM-GUI membrane builder.33 The initial equilibration simulations ran for 10 ns using the parameters listed in Table S4. During these simulations, the box size reached a steady lateral size by 2 ns.
Since the shearing simulations run at constant volume and the analysis assumes zero lateral stress at equilibrium, any initial stress in the system will strongly influence the surface viscosity calculation. Careful equilibration is required to avoid this scenario. After creating and minimizing each membrane, nine replicas are created for each with random initial atom velocities and random seeds. The replicas are equilibrated in the NPT ensemble for 12 ns using the parameters from Table S4 with the first 2 ns discarded. The equilibrium area per lipid is computed from the inverse variance weighted average of the remaining data. The membrane closest to this size is then rescaled to match it. This system is then equilibrated at constant volume for an additional 10 ns to relax transient disturbances from the rescaling.
The additional computational burden associated with all-atom simulation necessitates the use of much shorter production simulations. Fortunately, less precision is required from the pressure calculations due to the higher surface viscosity in C36. Preliminary simulations found 20 ns durations sufficient for achieving an average uncertainty of < 1.5 bar. Further use of computational resources was instead directed toward additional replicas for each strain rate. Five 25 ns production simulations were run at each strain rate using the simulation parameters from Table S4 with the barostat disabled. As shown in Fig. 7, a wide range of strain rates was explored for DPPC, with a clear turnover from Newtonian to shear thinning as the strain rate is increased. Fig. 8, shows the substantial (~ 50%) effect of the LJ cutoff treatment on the surface viscosity; the effect on other membrane properties such as equilibrium area per lipid is typically only a few percent.15,34 The error bars on these points combine the statistical uncertainty within each replica with the variance of the replicas.
Figure 7:
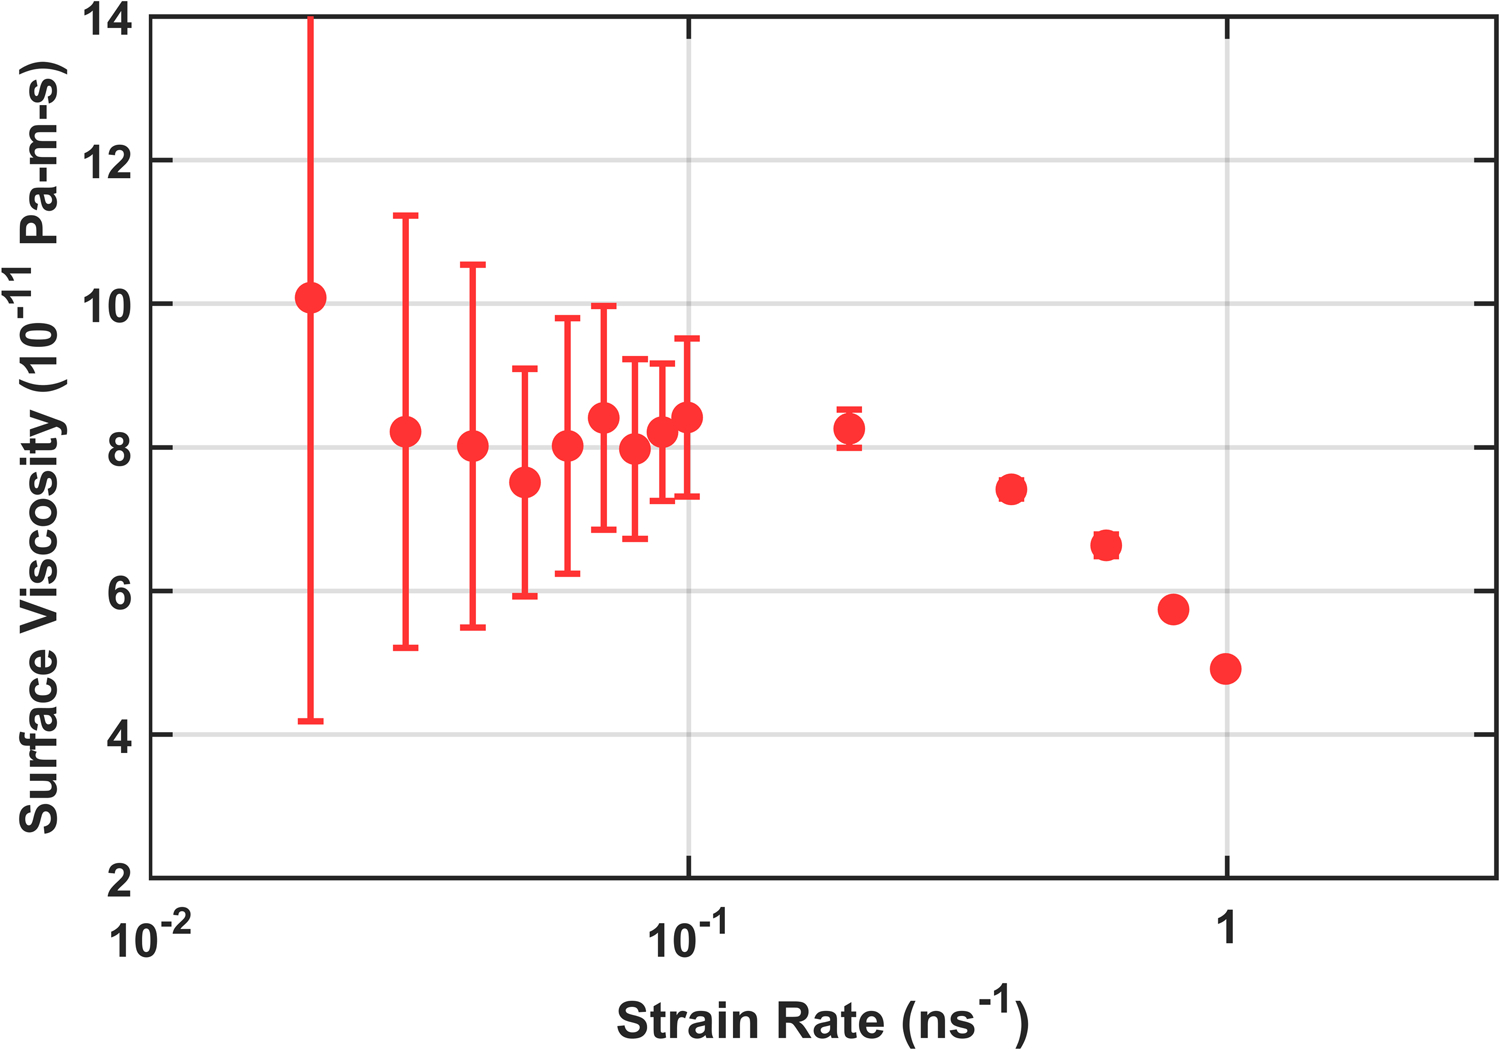
The full range of strain rates for C36 DPPC using 8–10 Å force switching, demonstrating turnover from Newtonian viscosity to shear thinning at higher strain rates.
Figure 8:
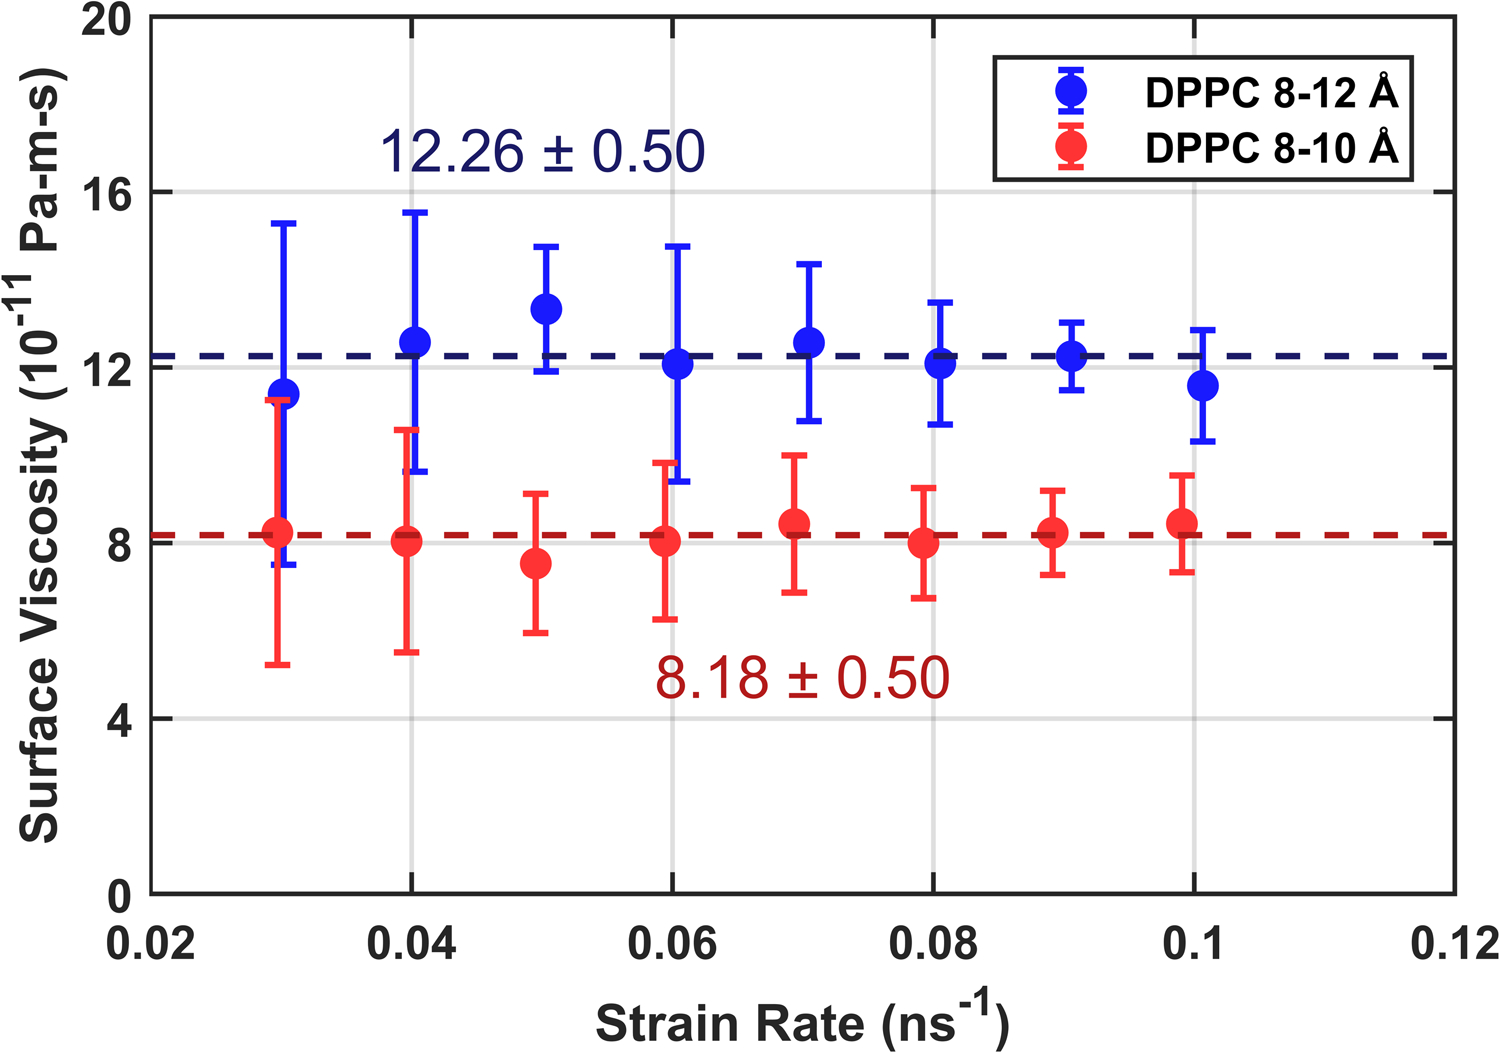
Surface viscosity as a function of strain rate for C36 DPPC using two cutoff treatments: standard 8–12 Å force switching and the 8–10 Å force switching that yields the most accurate area per lipid with the simulation protocol used here. Both series were equilibrated independently to zero surface tension before shearing. Dotted lines show the result of taking inverse-variance weighted averages for each series. Each data point is the average of five trials at the given strain rate.
The same equilibration protocol, shearing simulations, and analysis used for DPPC were repeated for DOPC, and was verified by comparison to equilibrium simulation and analysis via the Green-Kubo relation for DPPC (see SI). The surface viscosity of DOPC membranes is expected to exceed DPPC on the basis of diffusion experiments. This may be the result of enhanced entanglement among the oleyl tails due to bending from the cis unsaturation. Each single component membrane was simulated above its melting temperature (see Table 1). Two ternary mixtures were also measured, one in the liquid ordered (Lo) phase (55% DPPC, 15% DOPC, 30% cholesterol) and another in the liquid disordered (Ld) phase (30% DPPC, 60% DOPC, 10% cholesterol) below the miscibility transition temperature (Tmix), and the same two mixtures above Tmix37. Based on experimental measurements of diffusion, which is slower in Lo, the Lo phase is expected to have higher viscosity.5, 38 This is due to the ordering of the saturated chains in the Lo phase;39–40 which is known to slow diffusion by lowering the area per lipid. Both mixtures were run at 323 K.
Table 1:
Surface areas per lipid (APL) for membranes simulated with C36 using different cutoff treatments compared with values from reference simulations15 and experiments for DPPC, DOPC, and PSM.42–44 Reference simulations were carried out using the CHARMM program with 8–12 Å force switching and 1 fs timesteps. Errors are reported with respect to the reference simulations. References for melting temperatures are DPPC,45 DOPC,46 and PSM.47
| Lipid | Tmelt (K) | Tsim (K) | Experiment APL (Å2) | Reference APL (Å2) | Equilibrium APL (Å2) | Error % |
|---|---|---|---|---|---|---|
| DPPC (8–10) | 314 | 323 | 63.1 | 62.9 | 63.71 | +1.3 |
| DPPC (8–12) | 61.69 | −1.9 | ||||
| DOPC (8–10) | 256 | 303 | 67.4 | 68.9 | 69.72 | +1.2 |
| DOPC (8–12) | 68.33 | −0.8 |
Comparison between areas per lipid (both experimental and from prior simulations) are presented in Table 1. Minor differences between these reference values and those obtained in the present work are expected due to implementation-specific details of the different MD programs (GROMACS vs CHARMM) and differences in timestep (2 vs 1 fsec). Agreement with reference values are excellent for DPPC and DOPC. Although no reference sizes are available for the mixtures, we can infer adequate equilibration from the lack of divergence in their surface viscosity data.
Table 2 reports the surface viscosities. As expected, DOPC has a higher surface viscosity than DPPC and PSM has the highest among the single-component membranes. The ternary mixtures show a more complex behavior. At 323 K, the cholesterol- and DPPC-rich mixture has a higher viscosity than the more DOPC rich mixture, a result of the ordering effect of cholesterol on the saturated hydrocarbon chains. Although at this temperature there is only a single phase, the difference in surface viscosity between the two compositions is consistent with a factor of 3–5 slower diffusion in Lo as measured by pulsed field gradient NMR41. Below Tmix, the Ld phase viscosity increases by more than a factor of 4 as a result of the area per lipid decreasing with temperature. For the Lo phase below Tmix the Newtonian plateau is never observed at attainable shear rate, and so no value is reported. This point will be revisited in the Discussion.
Table 2:
Calculated surface viscosities calculations for assorted membranes simulated with C36.
| Membrane Composition | Surface Viscosity (10−11 Pa-m-s = 10−8 P-cm) |
|---|---|
| DPPC (8–10) | 8.18 ± 0.50 |
| DPPC (8–12) | 12.26 ± 0.50 |
| DOPC (8–12) | 19.68 ± 0.69 |
| Ld 298 K (8–12) | 40.6 ± 1.1 |
| Ld 323 K (8–12) | 9.39 ± 0.47 |
| Lo 298 K (8–12) | n/a |
| Lo 323 K (8–12) | 23.83 ± 0.92 |
Interleaflet Friction for Martini DPPC
Simulations for interleaflet friction calculations were initialized from the systems previously equilibrated for evaluation of surface viscosity. Each was padded with an additional 20 nm of water followed by another 10 ns of equilibration at fixed lateral size with the vertical box dimension coupled to a barostat at 1 bar pressure. The force applied to particles near the vertical boundaries was varied over several orders of magnitude to identify a regime where parallel shear flows appear in the solvent and the traction forces applied to the membrane leaflets cause them to smoothly slide past one another. The units of force used in the simulation (and reported below) are kJ/(mol-nm) ≅ 1.66 pN.
Three replicas with random initial velocities were used for each value of the boundary force magnitude. 1 nm was used for the thickness d of the boundary region in all simulations. Production simulations ran for 1 μs in the NVT ensemble using the parameters from Table S4 with the barostat disabled. Each trajectory was analyzed in three stages: first, verifying that the membrane does not drift vertically over the course of the simulation; second, calculating the relative velocity between leaflets from their separation as a function of time; and last, computing the average velocity profile along z was from the instantaneous particle velocities.
The vertical position of the membrane in each simulation showed little deviation and no overall drift. Thus, their vertical positions may be regarded as fixed and there is no need to be concerned about the possibility of the membrane contaminating the solvent velocity profile during the time averaging. All simulations with boundary forces too weak to generate steady parallel shear flows or apply sufficient traction forces on the leaflets were discarded at this point. These were the simulations with boundary forces less than 0.05 kJ/(mol-nm). Those with values between 0.05 and 0.10 kJ/(mol-nm) were not discarded, though they generally feature unreliable traction forces leading to significantly higher uncertainties in their interleaflet friction calculations.
A typical velocity profile for a boundary force sufficient to generate a parallel shear flow in the solvent is demonstrated in Fig. 9. The location of the membrane, the linear shear flow in the solvent, and nonlinear solvent flows from forcing are all readily identifiable. The vertical periodic boundaries were ignored in the spatial averaging as the velocity profile of the boundary region is not used in the analysis. The spatial averaging kernel (shown in the figure) obscures two features of the profile which are only seen during longer simulations with a narrower kernel. First, the linear velocity profile of the solvent does, despite the smooth appearance in Fig. 9, extend all the way to the solvent-membrane interface. Second, the average velocity does not smoothly vary across the bilayer; the two leaflets move, on average, as independent slabs. Each leaflet moves at a fixed velocity ±vL with an abrupt discontinuity at the membrane center equal in magnitude to Δv = 2vL. Resolving the velocity difference Δv in this way is more error-prone than fitting the average separation as a function of time.
Figure 9:
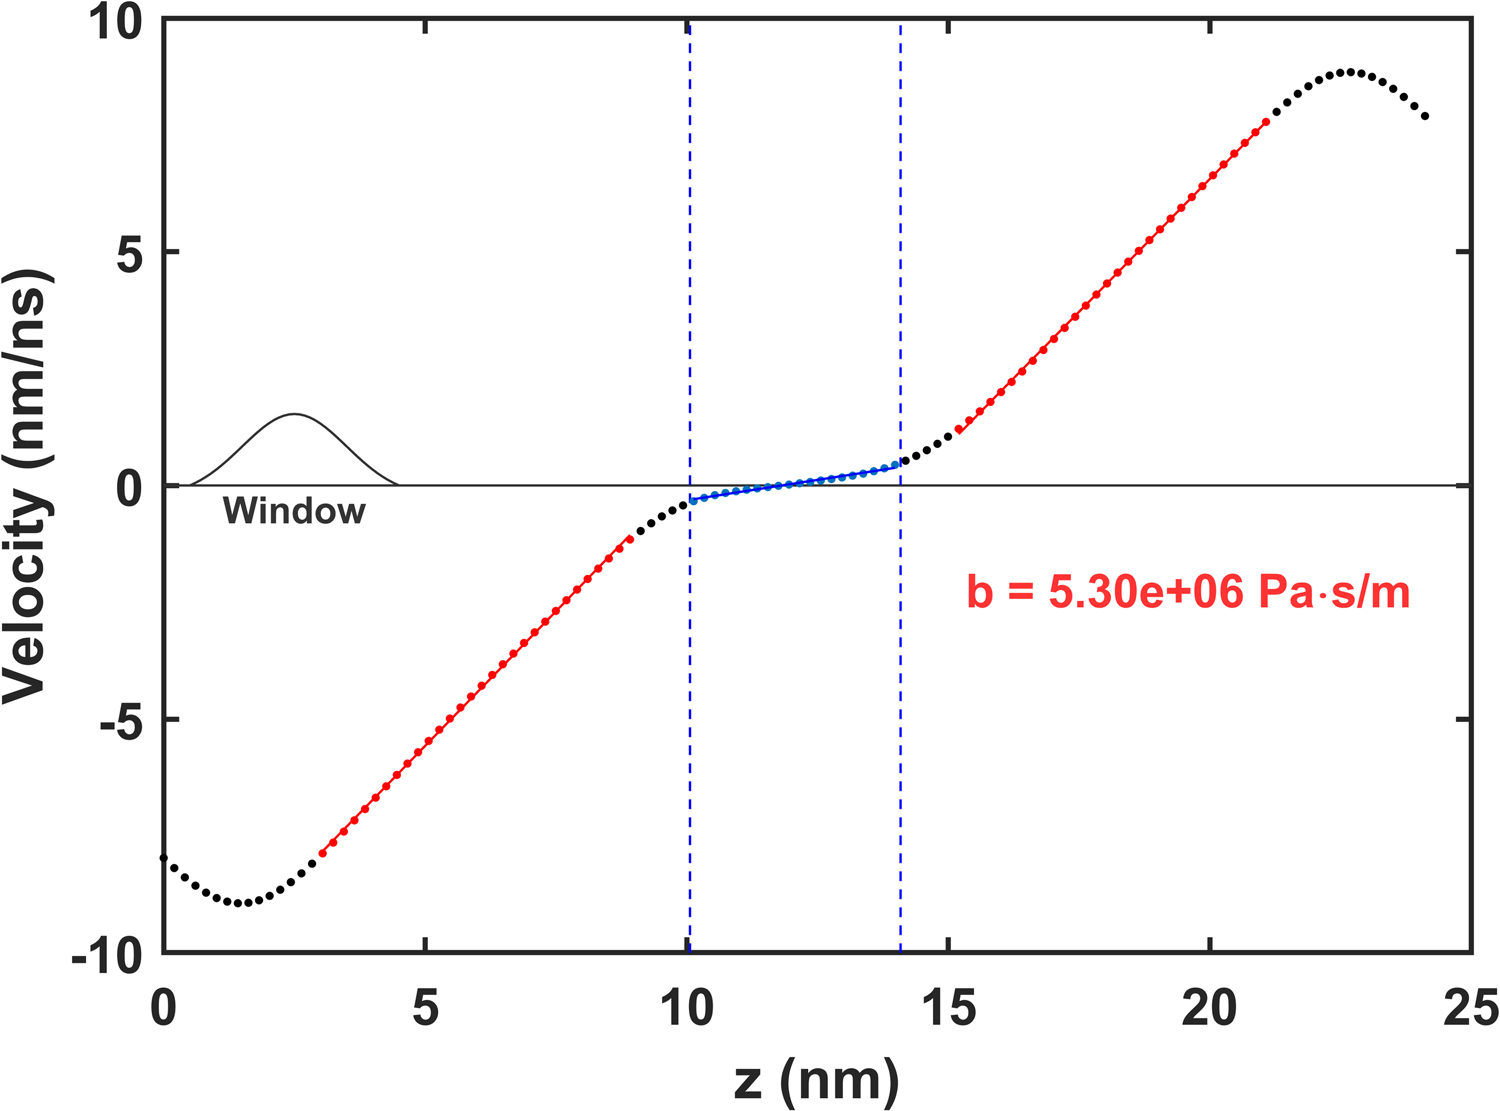
Average velocity profile for Martini DPPC with a 1.0 kJ/(mol-nm) force applied to all particles within 1 nm of the boundary at every timestep. The region corresponding to the membrane is highlighted in blue and the extent of linear parallel shear flow in the solvent is highlighted in red. Fits to these regions are used to determine the solvent shear rates. The spatial averaging window used to create the velocity profile is depicted on the left.
The results of this analysis are shown in Fig. 10 for both sets of Martini DPPC parameters. The newer version of Martini has a significantly higher interleaflet friction (~25%), perhaps owing to the slight increase in attraction among tail beads. The result for Martini 2004 differs almost by a factor of two as den Otter and Shkulipa results7 who report 2.4 × 10⁶ Pa-s/m from nonequilibrium simulations driven by Lees-Edwards boundary conditions and 3.0 × 10⁶ Pa-s/m from equilibrium relaxation of membrane undulations.
Figure 10:
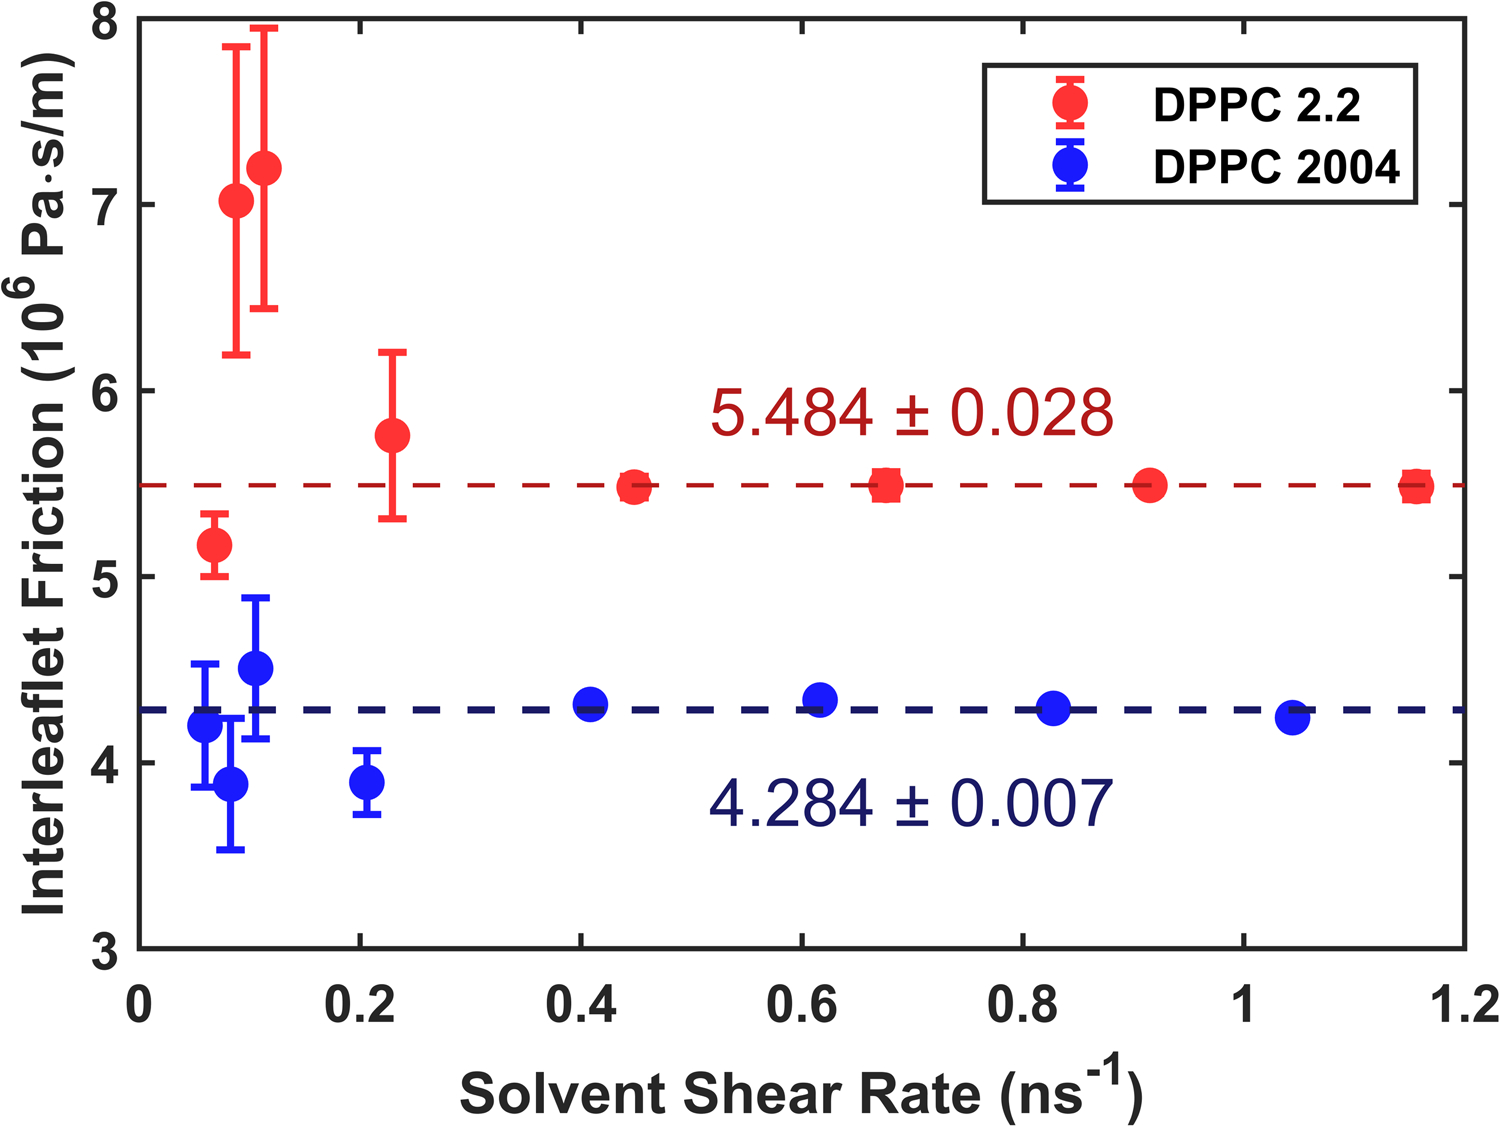
Interleaflet friction as a function of shear rate for DPPC membranes from force field parameters for the 2004 version of Martini used by den Otter and Shkulipa8 and the more recent Martini v2.2. Dotted lines show the result of taking inverse-variance weighted averages in each case. Error bars combine the standard error computed from each set of three trials with error propagation.
Interleaflet Friction for CHARMM36 Membranes
Interleaflet friction for the CHARMM36 force field was calculated using the same procedure as the Martini force field. The shorter timestep necessitated shorter simulations (only 100 ns) and the stronger attraction among CHARMM lipids required higher solvent shear rates to generate steady traction forces. A sample velocity profile is depicted in Fig. S6 and the results for DOPC are shown in Fig. 11. The application of higher solvent shear rates (relative to Martini) leads to a rate dependence which complicates the interpretation of these results. The analysis was extended for POPC and PSM lipids with the results reported in Table 3. Similar results are found for DPPC and PSM with significantly higher friction for DOPC. This suggests that, as expected, interleaflet friction is mostly dependent on overlap of the hydrocarbon chains at the membrane midplane, since PSM and DPPC are similar in this regard, while DOPC tails are more overlapped.
Figure 11:
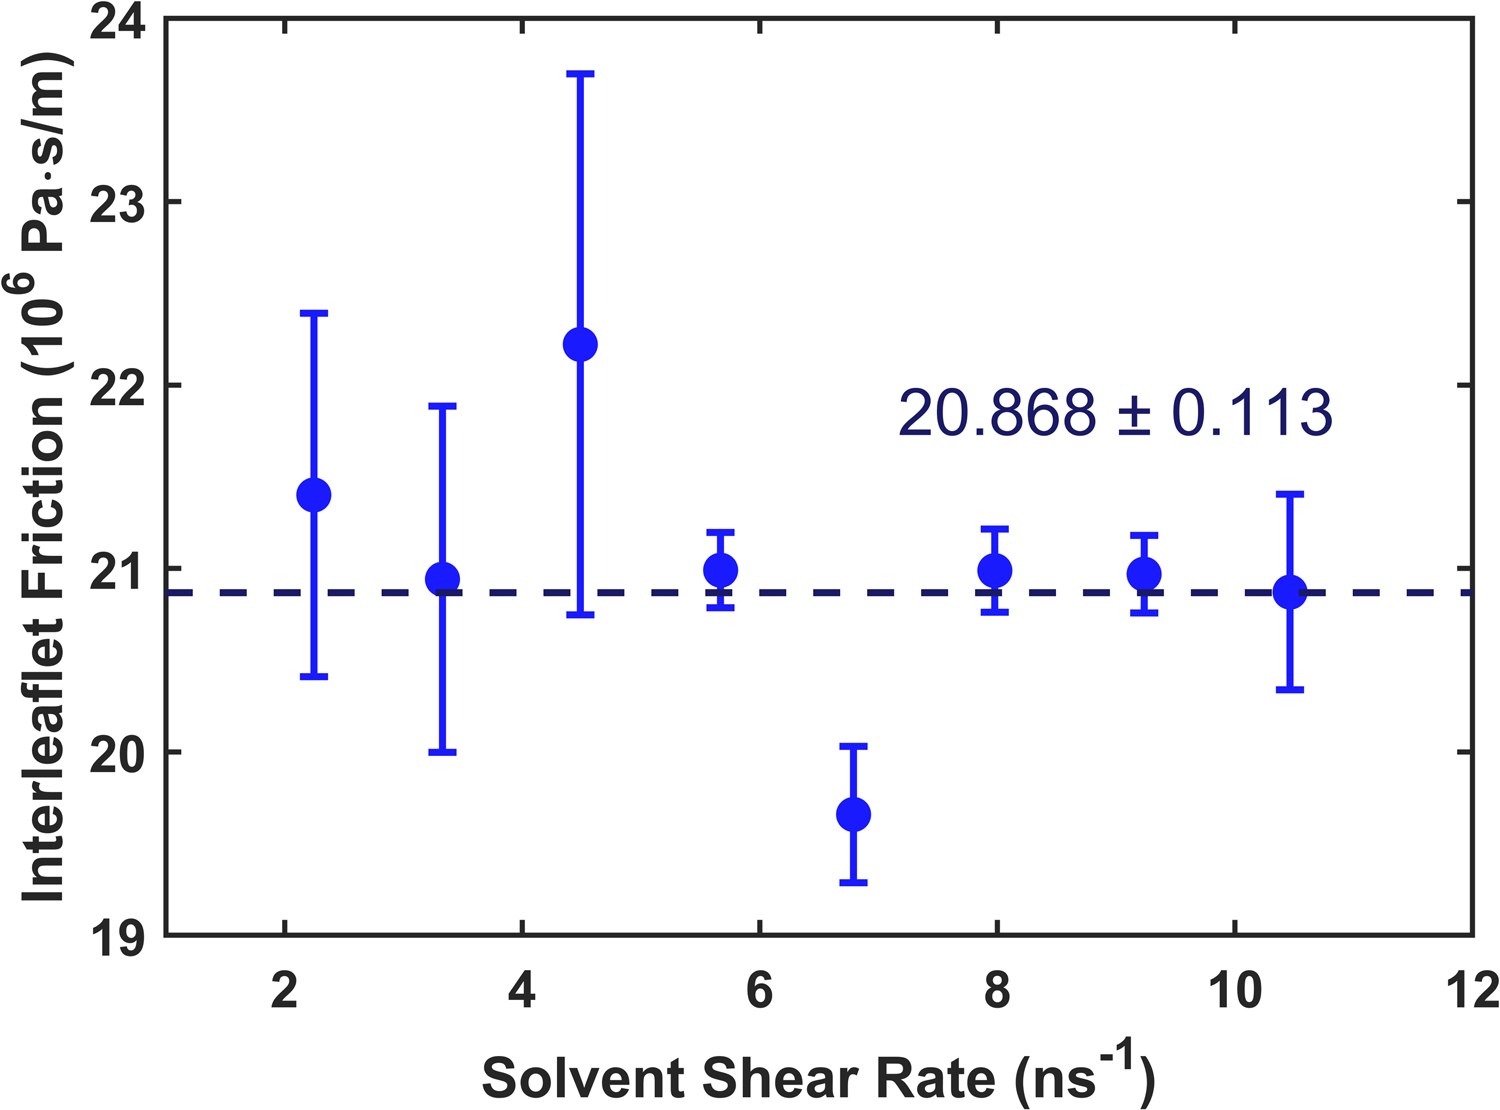
Interleaflet friction as a function of shear rate for CHARMM36 DOPC. Error bars combine the standard error computed from each set of three trials with error propagation.
Table 3:
Interleaflet friction calculations for various CHARMM36 lipids.
| Membrane Composition | Interleaflet Friction (106 Pa-s/m= 105 P/cm) |
|---|---|
| DPPC (8–12) | 11.282 ± 0.034 |
| DOPC (8–12) | 20.87 ± 0.11 |
DISCUSSION
Nonequilibrium protocols based on shearing lipid bilayers in the tangential and normal directions were used to determine the membrane surface viscosity and interleaflet friction. The interleaflet friction results are consistent with a model in which overlap between chains of opposing leaflets controls interleaflet friction, with a nearly 2x larger value for C36 DOPC as compared to DPPC.
The surface shear viscosity of Martini DPPC is version-dependent. The value obtained for an older version of Martini is consistent with earlier results reported by den Otter and Shkulipa7, with newer versions obtaining a slightly higher value due to changes in the model. Results for C36 DPPC using different treatments of the nonbonded cutoff lead to significant differences in the surface viscosity (Table 2), and much larger than for surface area (Table 1).
Comparison between the surface viscosity of a ternary Lo and Ld phase yields an intriguing result: While the Ld phase yields a viscosity higher than the pure systems by virtue of a cholesterol driven increase in lipid packing, for the Lo phase a Newtonian plateau was never observed at computationally tractable shear rates. At a higher temperature, where liquid-liquid phase separation is not observed experimentally, both mixtures obtain Newtonian plateaus and well-defined surface viscosities. This raises the possibility that the Lo phase possesses a frequency-dependent viscosity, hinting at a viscoelastic mechanism underlying reports of subdiffusion in the Lo phase.
Experimental values for surface viscosity have been determined directly by macroscopic (or near macroscopic) methods such as tether pulling,4, 48 falling ball viscosimetry,49 domain flicker spectroscopy,50 and two point microrheology.51 Values range from 3–13 × 10−9 Pa-s-m = 3–13 × 10−6 P-cm for assorted lipids and lipid mixtures, one to two orders of magnitude larger than obtained for the all-atom simulations presented in Table 2. An indirect, and more microscopic, approach for determining ηm is based on fits to diffusion constants of membrane-spanning proteins (each modeled by a cylinder of radius R) to the Saffman-Delbrück52 equation:
| (16) |
where ηf is the bulk viscosity of the surrounding fluid, γ is Euler’s constant, h is the membrane thickness, and is the effective membrane bulk viscosity; the ratio is denoted the Saffman-Delbrück length LSD. The comprehensive study of Poolman and coworkers53 determined LSD =163 nm from diffusion measurements of 7 different peptides and proteins in giant unilamellar DOPC/DOPG vesicles, leading to = 0.8 P, or ηm = 3.0 × 10⁻⁷ P-cm. This membrane bulk viscosity is similar to values used in earlier literature53 to interpret diffusion measurement of membrane proteins, including the original estimate of Saffman and Delbrück52 and close the 1.96 × 10⁻⁷ P-cm obtained here from all-atom simulations of DOPC (Table 2). Using a clever technique based on simultaneous measurement of rotational and translational diffusion, Parthasarathy and coworkers found a significantly higher value for a ternary Ld phase in a black lipid membrane (15 × 10−6 P-cm), but this may be due to the tension imposed by the edge of the pore in the BLM support.2 Membrane surface viscosities of DPPC bilayers for the Martini FF, 2.0 × 10⁻⁸ P-cm for version 2.0, a factor of 5 lower than obtained from the all-atom C36, as expected from the coarse-grained nature of the FF.
Experimental values of the interleaflet friction of bilayers, also from macroscopic measurements, are in the range 107 P/cm (55 and references there in, also 56) a factor of 10 larger than obtained here for the all-atom simulations. The interleaflet frictions for Martini DPPC are approximately half that of the all-atom values. A possible explanation for the discrepancy is that the lengthscale of the simulations does not permit significant undulations, which may have a string influence on the apparent interleaflet friction measured in the experiments.
As noted in the Introduction, lipid self-diffusion constants obtained from simulations carried out with periodic boundary conditions (DPBC) must be extrapolated to infinite system size (D∞). The method used here, developed by Camley et al.,16, 19 is based on the continuum hydrodynamic theory of Saffman-Delbrück. Hence, it is denoted the Periodic Saffman-Delbrück (PSD) model. It is also assumed here that a lipid can be modeled as single leaflet spanning (or monotonic) cylinder. The diffusion constant for a monotonic cylinder is calculated in the PSD model as follows:
| (17a) |
| (17b) |
where ηmono = ηm/2 is the monolayer surface viscosity, L is the edge length of the simulation cell in the plane of the membrane, and H is half the thickness of the water layer; similar expressions for DPBC and D∞ for membrane spanning cylinders do not contain the interleaflet friction b and yield the Saffman-Delbrück result in the limit of infinite system size. Diffusion constants for membrane spanning and monotonic cylinders of radius R can be calculated using https://diffusion.lobos.nih.gov/index.html.
The values of ηm and b obtained here prompt a reanalysis of the system size dependence of the simulations presented by Venable et al.19 Table 4 lists the average diffusion constant Dsim (weighted based on trajectory lengths) for DPPC bilayers for three different system sizes. The system size dependence is clear, with the value from N=288 lipids approximate twice that of N=72. The simulation data were initially fit by setting R=0.45 nm (which yields the correct surface are per lipid) and b=107 P/cm (a consensus experimental value), leaving ηm a free parameter. As is evident from the next to last column of Table 4, ηm = 4.4×10⁻⁸ P-cm provides a good fit; D∞ for these parameters equals 4.8 × 10⁻⁷ cm2/s. However, the present values of ηm and b yield poor agreement of DPBC and Dsim for R=0.45 nm (last column of Table 4; D∞ = 2.4 × 10⁻⁷ cm2/s). A lipid is not a solid cylinder and it is plausible that an effective hydrodynamic radius might be smaller than one consistent with surface area; reducing R to 0.15 nm gives good agreement for N=72 and 144, but less so for 288 (D∞ = 3.0 × 10⁻⁷ cm2/s). It is also possible that lipid diffusion has non-hydrodynamic components that are not well captured by the Saffman-Delbrück model. Gramicidin-A monomers are better represented as monotonic cylinders than lipids and would be expected to provide a better test of the PSD model when computer time allows.
Table 4.
Comparison of DPBC (10−7 cm2/s) for ηm (10−8 P-cm) and b (107 P/cm) from ref 19 and the present work for lipid radius R (nm) = 0.45 and 0.15 nm. Initial five columns list system parameters (number of lipids N, trajectory length Trun, half water layer thickness H, and edge length L), and simulated diffusion constants Dsim.
| Na | Trun | H | L | Dsimb | DPBC | DPBC |
|---|---|---|---|---|---|---|
| (μs) | (nm) | (nm) | (10−7 cm2/s) | ηm= 4.4; b = 1 | ηm= 12.3; b =0.11 | |
| 72 | 8.0 | 1.52 | 4.67 | 1.23 (0.5) | 1.24 (R=0.45) | 0.64(R=0.45); 1.26 (R=0.15) |
| 144 | 4.4 | 1.33 | 6.12 | 1.43 (0.3) | 1.46 (R=0.45) | 0.77 (R=0.45); 1.40 (R=0.15) |
| 288c | 2.3 | 1.45 | 9.56 | 2.24 (0.5) | 1.82 (R=0.45) | 0.95 (R=0.45); 1.57 (R=0.15) |
323 K and 30.4 waters/lipid; see ref 19 for further details
Dsim are the weighted average of all CHARMM and Anton trajectories presented for each N in Table 2 ref 19 unless otherwise noted; the value in parentheses is the range of simulated diffusion constants.
trajectory carried out with Langevin thermostat not included.
The values of D∞ obtained for DPPC from the preceding fits (D∞ = 4.8, 2.4 and 3.0 × 10⁻⁷ cm2/s) are all substantially larger than experiment, 1.5 × 10⁻⁷ cm2/s.56 (Coincidently, Dsim for N=72 and 288 are close to experiment, as was also found for DOPC.24) The overestimate is partly related to the interleaflet friction, which underestimates available experimental values by an order of magnitude. Additionally, the water model, TIP3P, which underestimates the viscosity of water by a factor of 3 at 298 K and 2 at 323 K, the temperatures where DOPC and DPPC bilayers were simulated, respectively. From Eq (17a) increasing b by a factor of 10 decreases D∞ by 12% and increasing ηf to the experimental values of water at 323 K decrease D∞ by 9 and 13% for DPPC and DOPC, respectively. Hence, these discrepancies only account for approximately 20% of the factor of 2–3 difference with experiment. The dominant modulator to diffusion in membranes is ηm within a hydrodynamic treatment.
Two other significant deficiencies in the C36 FF are the lack of long-range Lennard-Jones interactions (i.e., a cutoff is required) and polarizability. While long-range LJ forces are relatively straightforward to include in simulations of bulk liquids,58 a practical method for their implementation was not available for anisotropic systems such as lipid bilayers during the development of C36. Including long-range LJ terms using a recently developed Ewald-like implementation called LJ-PME59 increases the viscosity of hexadecane by approximately 15% (averaged over 303, 310 and 323 K) compared to C36 simulations with a 12 Å LJ cutoff.34 Hence, incorporation of long-range LJ interactions would be expected to increase ηm and decrease D∞ in membrane simulations. The effects of polarizability ηm and b are not as simply predictable as increasing the viscosity of water or alkanes. In principle, the increased physical realism of a polarizable FF should lead to better results than an additive FF, but the complexity of the optimization is a confounding variable. For example, simulations of DPPC bilayers using the Drude polarizable FF yield lipid DPBC = 1–2.5 × 10⁻⁸ cm/s,60 approximately an order of magnitude lower than experiment (Table 4). While an extrapolation was not carried out, it is unlikely to recover the experimental value.
CONCLUSIONS
The results reported here demonstrate that that precise measurement of the shear surface viscosity ηm and interleaflet friction b of all-atom lipid bilayers is feasible with current computational resources. Both ηm and b are sensitive to lipid composition. Specifically, values DOPC (at 298K) are approximately twice that of DPPC (at 323 K), indicating differences in mixing of chains in the midplane.
In principle, ηm and b are important targets for future force field development, especially as results for more lipids become available. Simulations of DPPC and DOPC with the CHARMM36 (C36) FF yielded values of ηm in acceptable agreement with protein diffusion experiments, but not more macroscopic measurements. Values of b underestimated experimental measurements by an order of magnitude. In the future, inclusion of polarizability and long range dispersion interactions will likely increase both values, as has been shown recently for alkanes.33
The surface viscosity and interleaflet friction are also essential parameters in the Periodic Saffman-Delbrück (PSD) model for the extrapolation of lipid diffusion constants evaluated from simulations with periodic boundary conditions to infinite system size. They were used here to reassess a previous analysis and the results suggest that the effective hydrodynamic radius of a cylinder modeling a lipid is smaller than the radius corresponding to the surface area per lipid. Much longer simulations over a larger range of system sizes with both lipid and monotonic peptides will be required for a more definitive test of the PSD model.
Supplementary Material
Acknowledgements.
This work was supported by US National Institutes of Health RO1GM120351 (E.L.) and the Intramural Research Program of the National Institutes of Health, National Heart, Lung and Blood Institute (A.Z. and R.W.P) This work used the Extreme Science and Engineering Discovery Environment (XSEDE), which is supported by US National Science Foundation grant number ACI-1548562.
Footnotes
Supporting Material
Three tables of Supplemental Methods and six figures of Supplemental Results. This information is available free of charge via the Internet at http://pubs.acs.org
References
- 1.Evans EA; Hochmuth RM, Membrane viscoelasticity. Biophys. J 1976, 16, 1–11. [DOI] [PMC free article] [PubMed] [Google Scholar]
- 2.Hormel TT; Kurihara SQ; Brennan MK; Wozniak MC; Parthasarathy R, Measuring Lipid Membrane Viscosity Using Rotational and Translational Probe Diffusion. Phys. Rev. Lett 2014, 112, 188101. [DOI] [PubMed] [Google Scholar]
- 3.Mika JT; Thompson AJ; Dent MR; Brooks NJ; Michiels J; Hofkens J; Kuimova MK, Measuring the Viscosity of the Escherichia coli Plasma Membrane Using Molecular Rotors. Biophys. J 2016, 111, 1528–1540. [DOI] [PMC free article] [PubMed] [Google Scholar]
- 4.Waugh RE, Surface viscosity measurements from large bilayer vesicle tether formation. II. Experiments. Biophys. J 1982, 38, 29–37. [DOI] [PMC free article] [PubMed] [Google Scholar]
- 5.Wu Y; Štefl M; Olzyńska A; Hof M; Yahioglu G; Yip P; Casey DR; Ces O; Humpolíčková J; Kuimova MK, Molecular rheometry: direct determination of viscosity in Lo and Ld lipid phases via fluorescence lifetime imaging. Phys. Chem. Chem. Phys 2013, 15, 14986. [DOI] [PubMed] [Google Scholar]
- 6.Baoukina S; Marrink SJ; Tieleman DP, Molecular structure of membrane tethers. Biophys. J 2012, 102, 1866–1871. [DOI] [PMC free article] [PubMed] [Google Scholar]
- 7.den Otter WK; Shkulipa SA, Intermonolayer Friction and Surface Shear Viscosity of Lipid Bilayer Membranes. Biophys. J 2007, 93, 423–433. [DOI] [PMC free article] [PubMed] [Google Scholar]
- 8.Shkulipa SA; den Otter WK; Briels WJ, Surface viscosity, diffusion, and intermonolayer friction: simulating sheared amphiphilic bilayers. Biophys. J 2005, 89, 823–829. [DOI] [PMC free article] [PubMed] [Google Scholar]
- 9.Shkulipa SA; Den Otter WK; Briels WJ, Thermal undulations of lipid bilayers relax by intermonolayer friction at submicrometer length scales. Phys. Rev. Lett 2006, 96, 1–4. [DOI] [PubMed] [Google Scholar]
- 10.Jämbeck JPM; Lyubartsev AP, An extension and further validation of an all-atomistic force field for biological membranes. J. Chem. Theory Comput 2012, 8, 2938–2948. [DOI] [PubMed] [Google Scholar]
- 11.Klauda JB; Venable RM; Freites JA; O’Connor JW; Tobias DJ; Mondragon-Ramirez C; Vorobyov I; MacKerell AD; Pastor RW, Update of the CHARMM All-Atom Additive Force Field for Lipids: Validation on Six Lipid Types. J. Phys. Chem. B 2010, 114, 7830–7843. [DOI] [PMC free article] [PubMed] [Google Scholar]
- 12.Marrink SJ; Risselada HJ; Yefimov S; Tieleman DP; De Vries AH, The MARTINI force field: Coarse grained model for biomolecular simulations. J. Phys. Chem. B 2007, 111, 7812–7824. [DOI] [PubMed] [Google Scholar]
- 13.Pastor RW; MacKerell AD, Development of the CHARMM Force Field for Lipids. Journal of Physical Chemistry Letters 2011, 2, 1526–1532. [DOI] [PMC free article] [PubMed] [Google Scholar]
- 14.Schmid N; Eichenberger AP; Choutko A; Riniker S; Winger M; Mark AE; Van Gunsteren WF, Definition and testing of the GROMOS force-field versions 54A7 and 54B7. Eur. Biophys. J 2011, 40, 843–856. [DOI] [PubMed] [Google Scholar]
- 15.Venable RM; Brown FLH; Pastor RW, Mechanical properties of lipid bilayers from molecular dynamics simulation. Chem. Phys. Lipids 2015, 192, 60–74. [DOI] [PMC free article] [PubMed] [Google Scholar]
- 16.Camley BA; Lerner MG; Pastor RW; Brown FLH, Strong influence of periodic boundary conditions on lateral diffusion in lipid bilayer membranes. J. Chem. Phys 2015, 143. [DOI] [PMC free article] [PubMed] [Google Scholar]
- 17.Vögele M; Hummer G, Divergent Diffusion Coefficients in Simulations of Fluids and Lipid Membranes. J. Phys. Chem. B 2016, 120, 8722–8732. [DOI] [PubMed] [Google Scholar]
- 18.Vögele M; Köfinger J; Hummer G, Hydrodynamics of Diffusion in Lipid Membrane Simulations. Phys. Rev. Lett 2018, 120, 268104. [DOI] [PubMed] [Google Scholar]
- 19.Venable RM; Ingólfsson HI; Lerner MG; Perrin BS; Camley BA; Marrink SJ; Brown FLH; Pastor RW, Lipid and Peptide Diffusion in Bilayers: The Saffman-Delbrück Model and Periodic Boundary Conditions. J. Phys. Chem. B 2017, 121, 3443–3457. [DOI] [PMC free article] [PubMed] [Google Scholar]
- 20.Zgorski A; Lyman E, Toward Hydrodynamics with Solvent Free Lipid Models: STRD Martini. Biophys. J 2016, 111, 2689–2697. [DOI] [PMC free article] [PubMed] [Google Scholar]
- 21.Bitbol A-F; Fournier J-B; Angelova MI; Puff N, Dynamical membrane curvature instability controlled by intermonolayer friction. J. Phys.: Condens. Matter 2011, 23, 284102. [DOI] [PubMed] [Google Scholar]
- 22.Fournier JB, On the hydrodynamics of bilayer membranes. Int. J. Non-Lin. Mech 2015, 75, 67–76. [Google Scholar]
- 23.Fuhrmans M; Sanders BP; Marrink S-J; de Vries AH, Effects of bundling on the properties of the SPC water model. Theor. Chem. Acc 2010, 125, 335–344. [Google Scholar]
- 24.Venable RM; Hatcher E; Guvench O; MacKerell AD; Pastor RW, Comparing simulated and experimental translation and rotation constants: Range of validity for viscosity scaling. J. Phys. Chem. B 2010, 114, 12501–12507. [DOI] [PMC free article] [PubMed] [Google Scholar]
- 25.Bussi G; Donadio D; Parrinello M, Canonical sampling through velocity rescaling. J. Chem. Phys 2007, 126. [DOI] [PubMed] [Google Scholar]
- 26.Hoover WG, Canonical dynamics: Equilibrium phase-space distributions. Phys. Rev. A 1985, 31, 1695–1697. [DOI] [PubMed] [Google Scholar]
- 27.Nosé S, A molecular dynamics method for simulations in the canonical ensemble. Mol. Phys 1984, 52, 255–268. [Google Scholar]
- 28.Zwanzig R, Time-Correlation Functions and Transport Coefficients in Statistical Mechanics. Annu. Rev. Phys. Chem 1965, 16, 67–102. [Google Scholar]
- 29.Zgorski A, Mesoscale simulation of lipid bilayers: Quasi2D hydrodynamics and shear viscosity. 2018. University of Delaware Theses and Dissertations Database; http://udspace.udel.edu/bitstream/handle/19716/24020/Zgorski_udel_0060D_13532.pdf?isAllowed=y&sequence=1 (accessed August 25, 2019) [Google Scholar]
- 30.Marrink SJ; de Vries AH; Mark AE, Coarse Grained Model for Semiquantitative Lipid Simulations. J. Phys. Chem. B 2004, 108, 750–760. [Google Scholar]
- 31.De Jong DH; Singh G; Bennett WFD; Arnarez C; Wassenaar TA; Schäfer LV; Periole X; Tieleman DP; Marrink SJ, Improved parameters for the martini coarse-grained protein force field. J. Chem. Th. Comput 2013, 9, 687–697. [DOI] [PubMed] [Google Scholar]
- 32.Monticelli L; Kandasamy SK; Periole X; Larson RG; Tieleman DP; Marrink SJ, The MARTINI coarse grained force field: extension to proteins. J. Chem. Theory Comput 2008, 4, 819–834. [DOI] [PubMed] [Google Scholar]
- 33.Lee J; Cheng X; Swails JM; Yeom MS; Eastman PK; Lemkul JA; Wei S; Buckner J; Jeong JC; Qi Y; Jo S; Pande VS; Case DA; Brooks CL; MacKerell AD; Klauda JB; Im W, CHARMM-GUI Input Generator for NAMD, GROMACS, AMBER, OpenMM, and CHARMM/OpenMM Simulations Using the CHARMM36 Additive Force Field. J. Chem. Theory Comput 2016, 12, 405–413. [DOI] [PMC free article] [PubMed] [Google Scholar]
- 34.Leonard AN; Simmonett AC; Pickard FC; Huang J; Venable RM; Klauda JB; Brooks BR; Pastor RW, Comparison of Additive and Polarizable Models with Explicit Treatment of Long-Range Lennard-Jones Interactions Using Alkane Simulations. J. Chem. Theory Comput 2018, 14, 948–958. [DOI] [PMC free article] [PubMed] [Google Scholar]
- 35.Best RB; Zhu X; Shim J; Lopes PEM; Mittal J; Feig M; MacKerell AD, Optimization of the additive CHARMM all-atom protein force field targeting improved sampling of the backbone φ, ψ and side-chain χ1and χ2Dihedral Angles. J. Chem. Theory Comput 2012, 8, 3257–3273. [DOI] [PMC free article] [PubMed] [Google Scholar]
- 36.Reißer S; Poger D; Stroet M; Mark AE, Real Cost of Speed: The Effect of a Time-Saving Multiple-Time-Stepping Algorithm on the Accuracy of Molecular Dynamics Simulations. J. Chem. Theory Comput 2017, 13, 2367–2372. [DOI] [PubMed] [Google Scholar]
- 37.Veatch SL; Polozov IV; Gawrisch K; Keller SL, Liquid Domains in Vesicles Investigated by NMR and Fluorescence Microscopy. Biophys. J 2004, 86, 2910–2922. [DOI] [PMC free article] [PubMed] [Google Scholar]
- 38.Wu H-M; Lin Y-H; Yen T-C; Hsieh C-L, Nanoscopic substructures of raft-mimetic liquid-ordered membrane domains revealed by high-speed single-particle tracking. Sci. Rep 2016, 6, 20542. [DOI] [PMC free article] [PubMed] [Google Scholar]
- 39.Filippov A; Orädd G; Lindblom G, The effect of cholesterol on the lateral diffusion of phospholipids in oriented bilayers. Biophys. J 2003, 84, 3079–3086. [DOI] [PMC free article] [PubMed] [Google Scholar]
- 40.Sodt AJ; Sandar ML; Gawrisch K; Pastor RW; Lyman E, The Molecular Structure of the Liquid-Ordered Phase of Lipid Bilayers. J. Am. Chem. Soc 2014, 136, 725–732. [DOI] [PMC free article] [PubMed] [Google Scholar]
- 41.Orädd G; Westerman PW; Lindblom G, Lateral diffusion coefficients of separate lipid species in a ternary raft-forming bilayer: A Pfg-NMR multinuclear study. Biophys. J 2005, 89, 315–320. [DOI] [PMC free article] [PubMed] [Google Scholar]
- 42.Kučerka N; Nagle JF; Sachs JN; Feller SE; Pencer J; Jackson A; Katsaras J, Lipid Bilayer Structure Determined by the Simultaneous Analysis of Neutron and X-Ray Scattering Data. Biophys. J 2008, 95, 2356–2367. [DOI] [PMC free article] [PubMed] [Google Scholar]
- 43.Kučerka N; Nieh M-P; Katsaras J, Fluid phase lipid areas and bilayer thicknesses of commonly used phosphatidylcholines as a function of temperature. Biochimica et Biophysica Acta (BBA) - Biomembranes 2011, 1808, 2761–2771. [DOI] [PubMed] [Google Scholar]
- 44.Maulik PR; Sripada PK; Shipley GG, Structure and thermotropic properties of hydrated N-stearoyl sphingomyelin bilayer membranes. BBA - Biomembranes 1991, 1062, 211–219. [DOI] [PubMed] [Google Scholar]
- 45.Biltonen RL; Lichtenberg D, The use of differential scanning calorimetry as a tool to characterize liposome preparations. Chem. Phys. Lipids 1993, 64, 129–142. [Google Scholar]
- 46.Ulrich AS; Sami M; Watts A, Hydration of DOPC bilayers by differential scanning calorimetry. Biochimica et Biophysica Acta (BBA) - Biomembranes 1994, 1191, 225–230. [DOI] [PubMed] [Google Scholar]
- 47.Maulik PR; Shipley GG, N-Palmitoyl Sphingomyelin Bilayers: Structure and Interactions with Cholesterol and Dipalmitoylphosphatidylcholine. Biochemistry 1996, 35, 8025–8034. [DOI] [PubMed] [Google Scholar]
- 48.Waugh RE, Surface viscosity measurements from large bilayer vesicle tether formation. I. Analysis. Biophys. J 1982, 38, 19–27. [DOI] [PMC free article] [PubMed] [Google Scholar]
- 49.Dimova R; Dietrich C; Hadjiisky A; Danov K; Pouligny B, Falling ball viscosimetry of giant vesicle membranes: Finite-size effects. Eur. Phys. J. B 1999, 12, 589–598. [Google Scholar]
- 50.Camley BA; Esposito C; Baumgart T; Brown FLH, Lipid bilayer domain fluctuations as a probe of membrane viscosity. Biophys. J 2010, 99, L44–L46. [DOI] [PMC free article] [PubMed] [Google Scholar]
- 51.Hormel TT; Reyer MA; Parthasarathy R, Two-Point Microrheology of Phase-Separated Domains in Lipid Bilayers. Biophys. J 2015, 109, 732–736. [DOI] [PMC free article] [PubMed] [Google Scholar]
- 52.Saffman PG; Delbrück M, Brownian motion in biological membranes. Proc Natl Acad Sci USA 1975, 72, 3111–3113. [DOI] [PMC free article] [PubMed] [Google Scholar]
- 53.Ramadurai S; Holt A; Krasnikov V; van den Bogaart G; Killian JA; Poolman B, Lateral Diffusion of Membrane Proteins. J. Am. Chem. Soc 2009, 131 (35), 12650–12656. [DOI] [PubMed] [Google Scholar]
- 54.Vaz WLC; Goodsaid-Zalduondo F; Jacobson K, Lateral diffusion of lipids and proteins in bilayer membranes. FEBS Lett. 1984, 174 (2), 199–207. [Google Scholar]
- 55.Camley BA; Brown FLH, Diffusion of complex objects embedded in free and supported lipid bilayer membranes: role of shape anisotropy and leaflet structure. Soft Matter 2013, 9, 4767. [Google Scholar]
- 56.Blosser MC; Honerkamp-Smith AR; Han T; Haataja M; Keller SL, Transbilayer Colocalization of Lipid Domains Explained via Measurement of Strong Coupling Parameters. Biophys. J 2015, 109, 2317–2327. [DOI] [PMC free article] [PubMed] [Google Scholar]
- 57.Scheidt HA; Huster D; Gawrisch K, Diffusion of Cholesterol and Its Precursors in Lipid Membranes Studied by 1H Pulsed Field Gradient Magic Angle Spinning NMR. Biophys. J 2005, 89 (4), 2504–2512. [DOI] [PMC free article] [PubMed] [Google Scholar]
- 58.Allen MP; Tildesley DJ, Computer simulation of liquids. Oxford University Press; 1991. [Google Scholar]
- 59.Wennberg CL; Murtola T; Páll S; Abraham MJ; Hess B; Lindahl E, Direct-Space Corrections Enable Fast and Accurate Lorentz–Berthelot Combination Rule Lennard-Jones Lattice Summation. J. Ch. Theory Comput 2015, 11 (12), 5737–5746. [DOI] [PubMed] [Google Scholar]
- 60.Li H; Chowdhary J; Huang L; He X; MacKerell AD; Roux B, Drude Polarizable Force Field for Molecular Dynamics Simulations of Saturated and Unsaturated Zwitterionic Lipids. J. Ch. Theory Comput 2017, 13 (9), 4535–4552. [DOI] [PMC free article] [PubMed] [Google Scholar]
Associated Data
This section collects any data citations, data availability statements, or supplementary materials included in this article.


