

Abstract
Visual perception plays a key role in the selection of nutritious and healthy foods. Color, as one of the most important senses of vision, can be used as an indicator of food quality/defects and grade. It is recommended consumers include various colors in their plate to obtain various vitamins and minerals. Color is also thought to be related to antioxidant capacity. Within this regard, this study investigated the relationship between color and antioxidant capacity in various fruits and vegetables. The results indicate the color hues analyzed by computer vision based image analysis can be related with TAC of fruits and vegetables, but with some limitations and can be used as a guide for food selection to increase daily antioxidant intake. Most of fruits and vegetables having hue values above 180° and below 20°, have high antioxidant capacity (>10 mmol TE/kg fresh weight). The results also emphasized the importance of the serving size of fruits and vegetables in terms of their contribution to daily antioxidant intake. Based on these results, fruits and vegetables could be categorized into low-, medium-, and high-antioxidant groups according to their TAC and potential contributions to fulfill the recommended daily antioxidant intake. Finally, daily antioxidant intake was evaluated with a healthier scenario created by doubling vegetable portion and reducing fruit portion by half in the meal.
Keywords: Fruits and vegetables, Antioxidant capacity, Color, Classification, Dietary guidance
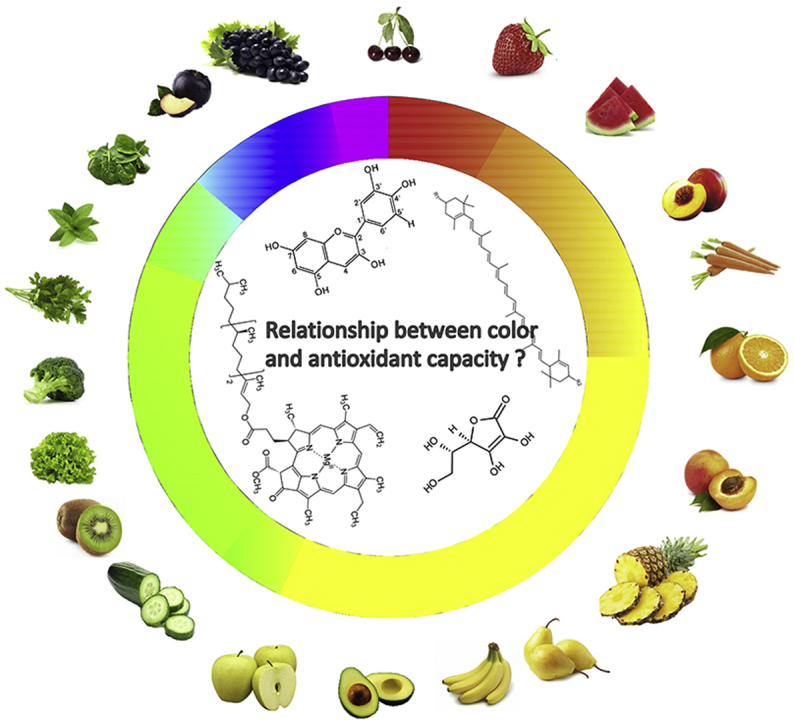
Graphical abstract
Highlights
-
•
Color is related to antioxidant capacity in some fruits and vegetables.
-
•
Anthocyanin-rich purple, red, blue fruits and vegetables have more TAC.
-
•
Serving size should be considered when evaluating the overall antioxidant contribution of a meal.
-
•
Food selection could be guided by color to increase TAC content, while also considering total calorie intake.
1. Introduction
Fruits and vegetables have important roles in human health as they contain many essential nutrients and phytochemicals that may prevent or reduce the risk of chronic diseases including cardiovascular diseases, diabetes, obesity, certain types of cancer, inflammation, stroke and septic shock (Steinmetz and Potter, 1996). Historically, several dietary guidelines including basic seven, basic four, food wheel, MyPyramid, and MyPlate have been established for years to build healthy eating patterns by making healthy choices across the food groups (Center for Nutrition Poli, 2018). Fruits and vegetables have been always taken part in these guidelines with higher serving size than other food groups. The last guideline, MyPlate encourages people to fill the half of their plate with fruits and vegetables. In addition, it is recommended eating more vegetables than fruits, as they contain less sugar and are lower in calories (Center for Nutrition Poli, 2018).
Dietary guidelines rely on an adequate food classification to inform general recommendations on human daily diet, and particularly healthy choices. In the literature, fruits and vegetables have been classified based on their botanical family, part of plant, color and total antioxidant capacity (TAC) (Pennington, 2003, Pennington and Fisher, 2009, Patras et al., 2011). It has been also emphasized that TAC of fruits and vegetables represents an overall concentration of bioactive compounds including ascorbic acid, tocopherols, carotenoids, and phenolic compounds. Some of these antioxidant compounds are known to be pigmented and have a characteristic color (Pennington and Fisher, 2009). For example, anthocyanins being one of the main phenolic groups found in fruits and vegetables are responsible for red, blue and purple color in fruits and vegetables (Melo et al., 2009). Carotenoids are associated with red or orange color, while chlorophyll gives the green color to fruits and vegetables present in.
Among color spaces, the CIELAB color scale is commonly used in the food industry to express the color of foods. It consists of L*, a*, b* coordinates, where L* value indicates lightness, a* indicates redness or greenness, and b* indicates yellowness or blueness. Hue angle (h*) is considered the qualitative attribute of color and is related to the traditional color expressions reddish, yellowish etc. It is used to define color difference with reference to grey color with the same lightness and calculated by the following equation:
Many studies have used hue angle as a color attribute to correlate with pigments in fruits and vegetables. For example, the hue value was correlated with extracted chlorophyll a and b content of dried parsley leaves (Berset and Caniaux, 1983). Total carotenoid content of pumpkins and squash (Cucurbita spp.) was also found to have a moderate correlation (r = −0.83) with their hue value (Itle and Kabelka, 2009). Another study indicated that hue angle and saturation values could be used to differentiate among the anthocyanin structures (Van Buren et al., 1974).
Color as one of the most important senses of vision, is also considered in relation with antioxidant capacity. However, there is a lack of studies on investigating the relationship between the color (hue value) of fruits and vegetables and their TAC.
This study aims to investigate the association between the color of fruits and vegetables with one of their main nutritional composition properties, TAC. The color of fruits and vegetables was evaluated through their hue values analyzed by computer vision-based image analysis and TAC of fruits and vegetables were determined using the QUENCHER approach and calculated with a novel approach by taking into account their serving size. Different vegetables and fruits were also grouped as high-, medium- and low-antioxidant foods based on their potential contributions to fulfill the daily needs of antioxidants. Another contribution of this paper is that TAC of fruits and vegetables have been determined with QUENCHER assay for the first time, which let to measure TAC without an extraction or hydrolysis method and to evaluate their antioxidant capacity more accurately. The findings give valuable information to assist researchers and dietitians providing dietary guidance and, in addition, it gives scientific principles to assist consumers in making adequate dietary choices based on visual perception through the color of fruits and vegetables.
2. Materials and methods
2.1. Chemicals
All chemicals and solvents used were of analytical grade, unless otherwise stated. Potassium peroxodisulfate, cellulose powder, 2,2-azinobis (3-ethylbenzothiazoline-6-sulfonic acid) (ABTS), 2,2-diphenyl-1-picrylhydrazyl (DPPH), 6-hydroxy-2,5,7,8-tetramethyl- chroman-2 carboxylic acid (Trolox), ethyl alcohol and phosphoric acid were purchased from Sigma- Aldrich Chemie (Steinheim, Germany). 28 varieties of fruits and 32 varieties of vegetables reflecting the various colors were chosen as sample set. All of vegetables and fruits were purchased from the local market in Turkey and their raw forms were used in analysis.
2.2. Antioxidant capacity measurement by QUENCHER approach
The antioxidant capacity of fruits and vegetables was measured by direct QUENCHER procedure using ABTS·+ and DPPH radical solution (Serpen et al., 2012). All edible parts of raw fruits and vegetables were mashed using a blender. To prevent the enzymatic browning, 0.2 M phosphoric acid was added to apples, banana, pear, nectarine, peach, eggplant, cabbage, potato, mushroom, cauliflower, iceberg and lettuce during mashing. The samples were diluted with cellulose (1:1) to measure the antioxidant capacity according to QUENCHER approach in fresh weight basis. Ten mg of diluted samples were transferred into a test tube and the reaction was started by adding 10 mL of ABTS·+ or DPPH working solution. Following the vigorous shake in an orbital shaker (at 350 rpm for 27 min) in the dark, the tube was centrifuged at 6080×g for 2 min. After total 30-min of reaction time, the optically clear supernatant (2 mL) was transferred into a cuvette, and absorbance was measured at 734 nm (for ABTS) or 525 nm (for DPPH) using a Shimadzu model 2100 variable wavelength UV−visible spectrophotometer (Shimadzu Corp., Kyoto, Japan). A calibration curve was built with Trolox in the concentration range between 0 and 600 mg L−1. The results were given as mmol Trolox equivalent (TE) per kg in fresh weight. All experiments were performed in triplicate.
2.3. Color measurement
The colors of the fruits and vegetables were measured by using computer vision-based image analysis in MATLAB® R2016a (The MathWorks, Inc., Natick, Massachusetts, United States). Digital images were taken from an image acquisition system consisting of a digital camera placed vertically at a distance of 25 cm from the sample as described previously (Mogol and Gokmen, 2014). The angle between the axes of the lens and the sources of illumination (day light fluorescent lamps with a color temperature 6500 K) is adjusted to approximately 45°. Captured images were stored in a personal computer in jpeg format without compression. The HSV values were calculated from RGB values of the images by using a built-in function of MATLAB on the region of interest of the digital image, where H, S, and V indicate hue, saturation and value, respectively (Appendix). The hue angle values were used for further investigations. Each measurement was performed in triplicate.
2.4. Classification of fruits and vegetables
Fruits and vegetables were classified according to their measured TAC and calculated potential contributions to meet recommended daily antioxidant intake. They were grouped based on their measured TAC, namely “high capacity”, “medium capacity”, and “low capacity” if they have TAC more than 20 mmol TE/kg, between 10 and 20 mmol TE/kg, and lower than 10 mmol TE/kg, respectively. Ten mmol TE/kg was selected as a threshold based on the study conducted by Prior et al. (2007) where the antioxidant capacity need was approximately calculated as 10 mmol TE per day for a normal individual consuming 2250 kcal per day (Prior et al., 2007). Taking the serving size of fruits and vegetables and recommended daily antioxidant intake per day, potential contributions to meet recommended daily antioxidant intake for them were calculated using the following equation:
They were also categorized based on their potential to meet recommended daily antioxidant intake and called as “high capacity”, “medium capacity”, and “low capacity” if they meet recommended daily antioxidant intake more than 20%, between 20% and 10%, and lower than 10%, respectively.
3. Results and discussion
3.1. Relationship between color and TAC of fruits and vegetables
Hue, a dimension of the HSV color space, represents the color of edible and descriptive part of fruits and vegetables and is expressed as an angular position in color space or color wheel. The h* takes both a* and b* values into account, therefore it could be more indicative on color than a single color attribute, such as L*. For example, discoloration on meat due to the oxidation of oxymyoglobin was better correlated to a change in both a* and b* than L*, which ended up indicative change in h* (Macdougall, 2010). The color of fruits and vegetables reflects the presence of different pigmented components. It is known that chlorophyll gives the green color to the most of vegetables, while carotenoids are generally responsible for the orange or yellow color. Blue, purple and red color of fruits and vegetables refer to anthocyanins in their tissues. In addition, these pigmented bioactive compounds come into prominence when accounting for their antioxidant capacity. With this respect, the relationship between the antioxidant capacity of fruits and vegetables and the descriptive color of edible parts was investigated.
According to Fig. 1a, the fruits and vegetables such as sour cherry, red cabbage, cranberry bean, black grape, berries including blueberry, red currant, having hue values above 180° have high antioxidant capacity (>10 mmol TE/kg fresh weight) in addition to strawberry, red apple and red pepper having hue values below 20°. However, watermelon, red grapefruit, tomato, fig, plum, and red onion are the exceptions with their low antioxidant capacities in this region. The fruits and vegetables having hue values between 20° and 180° indicating orange, yellow and green colors have relatively lower antioxidant capacity (<10 mmol TE/kg fresh weight) than others and corresponds to a second region in the graph. It is evident that green apple (h~80) and green vegetables including parsley (h~99), spinach (h~101), cress (h~96), rocket salad (h~95), and mint (h~97) are the exceptions in this region as having antioxidant capacity above 10 mmol TE/kg fresh weight.
Fig. 1.

Relationship between hue and (a) total antioxidant capacity (TAC) of fruits and vegetables measured by the ABTS assay, and (b) potential contributions to meet the recommended daily TAC requirement calculated per serving size of fruits and vegetables.
A similar relationship was found between color and TACDPPH· of fruits and vegetables (Fig. S1a). It is not surprising that there is a high positive correlation (r = 0.841) between the results of TACABTS and TACDPPH· of fruits and vegetables as both assays have the same approach based on an electron transfer. Similar to Fig. 1a, two regions were observed according to the relationship between TACDPPH· and color of fruits and vegetables (Fig. S1a). However, in contrast to the results of TACABTS, the chlorophyll-containing green vegetables have low antioxidant capacity according to TACDPPH. A possible explanation for these results might be the inefficiency of DPPH assay to measure the antioxidant capacity of chlorophyll containing Mg2+ ions in its structure. It is known that the presence of metal ions may impair the reaction between antioxidant compounds and DPPH radical (Pekal and Pyrzynska, 2015) leading to less antioxidant capacity than their actual potential. In addition, many large antioxidant compounds may slowly react with DPPH radical or may even be inert in this assay by the reason of steric inaccessibility of antioxidants to the radical (Magalhaes et al., 2008). As a large molecule, chlorophyll may not react with DPPH efficiently; and therefore, the antioxidant capacity of chlorophyll-containing vegetables might be underestimated.
The color of fruits and vegetables is consistent with their antioxidant content and consequently with their antioxidant capacity. Table 1 summarizes the content of antioxidant groups and pigmented compounds, such as chlorophyll, carotenoids, and anthocyanin, found in fruits and vegetables. Fruits and vegetables having high antioxidant capacity including black grape, blueberry, red apple, red currant, strawberry, sour cherry, cranberry bean, red cabbage, and red pepper have high anthocyanin and total phenol contents (Table 1). The green vegetables, spinach, rocket salad, cress, and mint show also high antioxidant activity as they are very high in total phenolic content in addition to chlorophyll content (Table 1). Watermelon and tomato have low antioxidant capacity despite their red color as they are rich in carotenoids that have relatively low antioxidant capacity, especially lycopene. In addition, a possible explanation for the low antioxidant capacities of some purple fruits and vegetables such as fig, plum, eggplant and red onion might be that anthocyanins are concentrated in the skin and the color of inner part of these three foods is totally different than the color of the outer part. As the measurements were performed with the whole fruit, flesh/skin ratio of fruits might be decisive on their antioxidant capacities. Therefore, they are not in the high-antioxidant capacity region even though they are expected to be in there based on visual color perception.
Table 1.
Antioxidant composition of various fruits and vegetables.
GAE: Gallic Acid Equivalent.
*mg malvidin-3-glucoside equivalent/100 g fresh weight.
mg cyanidin-3-glucoside equivalent/100 g fresh weight.
Other researchers also classified fruits and vegetables based on their antioxidant activity, levels of antioxidant groups and color measured by using the Hunter-Lab color meter (Patras et al., 2011). Similarly, they showed that berries exhibited high anti-radical power with high total phenol levels while high-antioxidant red pepper differed from berries with its high ascorbic acid content. They also concluded that carotenoid-rich carrot and tomato were in the same group with chlorophyll-rich lettuce, whereas onion, grape, and broccoli were characterized with low levels of antioxidant capacity. However, they didn't indicate any significant relationship between color and antioxidant capacity. Their findings indicated that only the L values have an influence on the classification of grape and yellow onion. However, L value is not sufficient to distinguish fruits and vegetables according to the color, as it merely indicates the level of lightness. According to International Electrotechnical Commission and the International Commission on Illumination (1987), the h coordinate (hue) is associated to the perceived hue: red, yellow, green, blue, or combinations of two of these consecutive colors (Commission Electrotechniq, 1987).
It is important to note that total antioxidant capacity expressed as mmol Trolox Equivalent (TE) per kg fresh weight may mislead readers during determination of antioxidant capacity. As an alternative perspective for evaluating antioxidant capacities of foods, not only antioxidant compounds concentration but also their serving size in the diet has great importance within their antioxidant activity evaluation. Prior et al. (2007) estimated the daily antioxidant intake needed was approximately 10 mmol TE per day for a normal individual consuming 2250 kcal per day (Prior et al., 2007). With this basis, in this study, the TAC of fruits and vegetables were calculated by taking the serving size of fruits and vegetables into account. Accordingly, the calculated potential contributions to meet recommended daily antioxidant intake for each fruit and vegetable are illustrated in Table 2.
Table 2.
Hue values, measured TAC values (per kg), calculated TAC values (per serving size) of fruits and vegetables, and their potential contributions to meet the recommended daily TAC requirement calculated per serving size or according to the created scenario (aScenario was created by doubling vegetable portion and reducing fruit portion by half).
| Fruits and Vegetables | Serving size (kg)a | Hue (°) | Measured TAC (mmol TE/kg) |
Calculated TAC (mmol TE/serving size) |
(%) Potential contributions to meet recommended daily TAC requirement |
Scenarioa (%) Potential contributions to meet recommended daily TAC requirement |
||||
|---|---|---|---|---|---|---|---|---|---|---|
| ABTS | DPPH | ABTS | DPPH | ABTS | DPPH | ABTS | DPPH | |||
| Strawberry | 0.15 | 11.1 | 31.88 ± 0.74 | 31.27 ± 2.95 | 4.85 | 4.75 | 48.45 | 47.53 | 24.23 | 23.76 |
| Black grape | 0.14 | 215.5 | 32.25 ± 0.04 | 22.79 ± 1.30 | 4.45 | 3.15 | 44.50 | 31.45 | 22.25 | 15.73 |
| Cranberry bean | 0.20 | 307.4 | 22.06 ± 3.24 | 16.95 ± 3.64 | 4.30 | 3.31 | 43.02 | 33.05 | 43.02 | 33.05 |
| Red pepper | 0.15 | 5.0 | 19.84 ± 2.54 | 20.04 ± 0.55 | 2.96 | 2.99 | 29.56 | 29.86 | 59.12 | 59.72 |
| Sour cherry | 0.16 | 346.7 | 18.37 ± 0.33 | 15.66 ± 1.07 | 2.85 | 2.43 | 28.47 | 24.27 | 14.24 | 12.14 |
| Red cabbage | 0.09 | 282.8 | 28.38 ± 0.77 | 28.38 ± 0.45 | 2.53 | 2.53 | 25.26 | 25.26 | 12.63 | 12.63 |
| Blueberry | 0.15 | 208.7 | 16.20 ± 1.10 | 13.13 ± 0.91 | 2.40 | 1.94 | 23.97 | 19.44 | 11.99 | 9.72 |
| Red apple | 0.11 | 9.0 | 19.24 ± 2.30 | 21.70 ± 2.06 | 2.10 | 2.37 | 20.97 | 23.66 | 10.49 | 11.83 |
| Red currant | 0.11 | 314.0 | 18.33 ± 0.44 | 22.95 ± 2.08 | 2.05 | 2.57 | 20.53 | 25.70 | 10.27 | 12.85 |
| Green apple | 0.14 | 80.1 | 14.23 ± 1.28 | 14.65 ± 1.03 | 2.02 | 2.08 | 20.21 | 20.81 | 10.10 | 10.40 |
| Grapefruit | 0.23 | 50.3 | 7.77 ± 0.95 | 3.10 ± 0.98 | 1.79 | 0.71 | 17.87 | 7.13 | 8.93 | 3.56 |
| Yellow pepper | 0.19 | 48.0 | 9.57 ± 0.44 | 8.39 ± 0.64 | 1.78 | 1.56 | 17.80 | 15.61 | 35.60 | 31.23 |
| Corn | 0.17 | 49.8 | 10.31 ± 0.74 | 9.74 ± 0.79 | 1.71 | 1.62 | 17.11 | 16.17 | 34.22 | 32.34 |
| Mango | 0.17 | 55.6 | 10.19 ± 0.50 | 6.42 ± 0.16 | 1.68 | 1.06 | 16.81 | 10.60 | 8.40 | 5.30 |
| Golden apple | 0.15 | 65.9 | 10.69 ± 1.05 | 12.06 ± 0.30 | 1.65 | 1.86 | 16.46 | 18.58 | 8.23 | 9.29 |
| Plum | 0.17 | 290.8 | 9.84 ± 0.78 | 9.81 ± 0.52 | 1.62 | 1.62 | 16.24 | 16.18 | 8.12 | 8.09 |
| Orange | 0.19 | 31.6 | 8.68 ± 0.42 | 6.23 ± 0.39 | 1.61 | 1.15 | 16.05 | 11.53 | 8.03 | 5.76 |
| Cherry | 0.14 | 238.9 | 11.48 ± 0.07 | 11.73 ± 1.45 | 1.58 | 1.62 | 15.85 | 16.18 | 7.92 | 8.09 |
| Kiwi | 0.18 | 81.6 | 7.76 ± 0.33 | 6.96 ± 0.40 | 1.40 | 1.25 | 13.98 | 12.52 | 6.99 | 6.26 |
| Banana | 0.15 | 59.7 | 9.29 ± 1.41 | 15.29 ± 2.30 | 1.39 | 2.29 | 13.93 | 22.93 | 6.97 | 11.47 |
| Red grapefruit | 0.23 | 9.1 | 5.65 ± 0.42 | 5.98 ± 0.04 | 1.30 | 1.38 | 12.99 | 13.75 | 6.49 | 6.88 |
| Pear | 0.14 | 63.6 | 8.47 ± 0.07 | 9.15 ± 0.32 | 1.19 | 1.28 | 11.86 | 12.81 | 5.93 | 6.41 |
| Eggplant | 0.08 | 195.6 | 14.41 ± 1.93 | 13.27 ± 0.16 | 1.18 | 1.09 | 11.82 | 10.88 | 23.64 | 21.77 |
| Zucchini | 0.12 | 72.9 | 9.40 ± 0.68 | 1.24 ± 0.44 | 1.17 | 0.15 | 11.65 | 1.53 | 23.31 | 3.07 |
| Red onion | 0.16 | 335.0 | 7.25 ± 0.11 | 3.77 ± 0.60 | 1.16 | 0.60 | 11.60 | 6.04 | 23.20 | 12.08 |
| Nectarine | 0.14 | 25.5 | 8.02 ± 0.15 | 12.47 ± 0.64 | 1.15 | 1.78 | 11.47 | 17.84 | 5.74 | 8.92 |
| Parsley | 0.06 | 99.3 | 18.14 ± 0.38 | 8.57 ± 0.25 | 1.09 | 0.51 | 10.89 | 5.14 | 21.77 | 10.29 |
| Green bean | 0.24 | 84.4 | 4.46 ± 0.74 | 1.84 ± 0.16 | 1.07 | 0.44 | 10.70 | 4.43 | 21.40 | 8.85 |
| Pineapple | 0.17 | 50.2 | 6.47 ± 0.04 | 6.46 ± 0.08 | 1.07 | 1.07 | 10.68 | 10.66 | 5.34 | 5.33 |
| Peach | 0.15 | 31.5 | 6.84 ± 2.08 | 6.63 ± 0.15 | 1.05 | 1.02 | 10.53 | 10.22 | 5.26 | 5.11 |
| Radish | 0.12 | 323.5 | 8.87 ± 0.61 | 2.80 ± 0.20 | 1.03 | 0.32 | 10.29 | 3.25 | 20.57 | 6.50 |
| Avocado | 0.15 | 55.6 | 6.79 ± 0.08 | 7.14 ± 0.08 | 1.02 | 1.07 | 10.19 | 10.72 | 5.09 | 5.36 |
| Red grape | 0.15 | 25.6 | 6.34 ± 0.56 | 9.20 ± 1.22 | 0.96 | 1.39 | 9.58 | 13.90 | 4.79 | 6.95 |
| Scallion | 0.10 | 84.6 | 8.24 ± 0.79 | 3.27 ± 0.28 | 0.82 | 0.33 | 8.24 | 3.27 | 16.49 | 6.55 |
| Grape | 0.09 | 67.2 | 8.74 ± 0.50 | 7.11 ± 1.44 | 0.80 | 0.65 | 8.04 | 6.54 | 4.02 | 3.27 |
| Cauliflower | 0.11 | 65.0 | 7.28 ± 0.15 | 6.50 ± 0.40 | 0.78 | 0.70 | 7.79 | 6.96 | 15.58 | 13.92 |
| Cress | 0.05 | 96.2 | 14.76 ± 0.75 | 7.18 ± 0.03 | 0.74 | 0.36 | 7.38 | 3.59 | 14.76 | 7.18 |
| Spinach | 0.03 | 100.6 | 22.36 ± 0.76 | 9.18 ± 0.07 | 0.67 | 0.28 | 6.71 | 2.75 | 13.42 | 5.51 |
| Melon | 0.18 | 59.7 | 3.71 ± 0.30 | 1.68 ± 0.48 | 0.66 | 0.30 | 6.58 | 2.97 | 3.29 | 1.49 |
| Onion | 0.16 | 78.0 | 4.09 ± 0.74 | 2.07 ± 0.04 | 0.65 | 0.33 | 6.54 | 3.32 | 13.08 | 6.63 |
| Yellow cherry | 0.14 | 45.3 | 4.59 ± 0.15 | 3.59 ± 0.72 | 0.63 | 0.50 | 6.34 | 4.96 | 3.17 | 2.48 |
| Tomato | 0.18 | 12.2 | 3.31 ± 0.29 | 3.59 ± 0.12 | 0.60 | 0.65 | 5.96 | 6.46 | 11.93 | 12.92 |
| Mushroom | 0.07 | 59.6 | 8.32 ± 0.66 | 6.44 ± 0.04 | 0.58 | 0.45 | 5.82 | 4.51 | 11.65 | 9.01 |
| Apricot | 0.16 | 43.5 | 3.72 ± 0.18 | 6.66 ± 0.08 | 0.58 | 1.03 | 5.76 | 10.32 | 2.88 | 5.16 |
| Green pepper | 0.15 | 89.3 | 3.64 ± 0.18 | 4.28 ± 1.11 | 0.54 | 0.64 | 5.43 | 6.37 | 10.86 | 12.75 |
| Lemon | 0.06 | 54.6 | 8.48 ± 0.30 | 8.10 ± 0.67 | 0.49 | 0.47 | 4.92 | 4.70 | 9.84 | 9.39 |
| Fig | 0.05 | 290.0 | 8.71 ± 0.75 | 6.06 ± 0.44 | 0.44 | 0.30 | 4.36 | 3.03 | 2.18 | 1.52 |
| Potato | 0.08 | 53.8 | 5.20 ± 0.15 | 4.23 ± 0.60 | 0.39 | 0.32 | 3.90 | 3.17 | 7.80 | 6.35 |
| Red leaf lettuce | 0.03 | 37.2 | 12.86 ± 0.34 | 10.23 ± 1.20 | 0.36 | 0.29 | 3.60 | 2.87 | 7.20 | 5.73 |
| Carrot | 0.13 | 21.0 | 2.43 ± 0.29 | 4.65 ± 0.52 | 0.31 | 0.60 | 3.11 | 5.95 | 6.22 | 11.91 |
| Cabbage | 0.06 | 66.5 | 5.50 ± 1.04 | 8.34 ± 1.44 | 0.31 | 0.47 | 3.08 | 4.67 | 6.16 | 9.34 |
| Lettuce | 0.04 | 87.7 | 8.50 ± 0.40 | 8.73 ± 0.28 | 0.31 | 0.31 | 3.06 | 3.14 | 6.12 | 6.28 |
| Watermelon | 0.15 | 6.0 | 1.96 ± 0.08 | 1.55 ± 0.42 | 0.30 | 0.24 | 3.01 | 2.39 | 1.51 | 1.19 |
| Broccoli | 0.04 | 94.6 | 6.78 ± 0.23 | 5.44 ± 0.04 | 0.27 | 0.22 | 2.71 | 2.18 | 5.42 | 4.35 |
| Iceberg | 0.07 | 73.4 | 3.64 ± 0.82 | 2.56 ± 0.16 | 0.26 | 0.18 | 2.62 | 1.84 | 5.24 | 3.69 |
| Cucumber | 0.05 | 100.6 | 3.89 ± 0.23 | 1.51 ± 0.30 | 0.20 | 0.08 | 2.02 | 0.79 | 4.05 | 1.57 |
| Rocket salad | 0.01 | 94.6 | 13.74 ± 1.77 | 4.32 ± 0.28 | 0.14 | 0.04 | 1.37 | 0.43 | 2.75 | 0.86 |
| Dill | 0.01 | 110.1 | 9.03 ± 0.53 | 7.26 ± 1.18 | 0.08 | 0.06 | 0.80 | 0.65 | 1.61 | 1.29 |
| Purple basil | 0.00 | 293.6 | 13.89 ± 0.30 | 18.30 ± 0.68 | 0.03 | 0.05 | 0.35 | 0.46 | 0.69 | 0.91 |
| Mint | 0.00 | 97.2 | 16.57 ± 1.11 | 25.69 ± 0.80 | 0.03 | 0.05 | 0.33 | 0.51 | 0.66 | 1.03 |
Serving size from USDA National Nutrient Database for Standard Reference (https://ndb.nal.usda.gov/ndb/search/list).
Fig. 1b show the relationship between the color of fruits and vegetables and their potential contributions to meet the recommended daily TAC requirement. The anthocyanin-rich foods including strawberry, black grape, cranberry bean, red pepper, sour cherry, red cabbage, blueberry, red apple and red currant with hues ranging from 180° to 360° and to a less extent 0°–20° can contribute to more than 20% of the recommended daily TAC requirement. Plum (h~291), cherry (h~234), eggplant (h~196), red onion (h~335), and fig (h~290) are the exceptions in this region as mentioned before. The second region, hue values from 20° to 80°, involves the fruits and vegetables containing dominantly phenolic compounds, ascorbic acid, and carotenoids in their structure and consequently they can contribute to fulfill relatively small amount of recommended daily TAC requirement (<20%) than others. However, ascorbic acid-, phenolic compounds- (except anthocyanins), and carotenoid-rich fruits and vegetables could not be differentiated from each other depending on their color. Although green vegetables rich in chlorophyll where the hue values are between 80° and 180°, have TAC above 10 mmol TE/kg fresh weight, they contribute a few amounts of recommended daily TAC requirement (<10%) (Fig. 1b). However, green apple and kiwi are the exceptions in this region by contributing more than 15% of recommended daily antioxidant intake as they contain high amount of ascorbic acid in their structure.
Overall, to evaluate the variations in antioxidant capacities of fruits and vegetables in different color group, the colors were divided into five regions based on their hue values as red (<20° and >330°), yellow (between 20° and 80°), green (between 80° and 160°), blue (between 160° and 270°) and magenta (between 270° and 330°) (Fig. 2a). Box-and-whisker plots were used to display the variation of the same color group relation with TAC of fruits and vegetables. Despite the exceptions in each group, the color of fruits and vegetables could be ranked as magenta, blue, red, green, and yellow based on their TACABTS (Fig. 2a) and TACDPPH· (Fig. S2a). The ranking could be as blue, magenta, red, yellow and green when considering their serving size and evaluating their potential contributions to meet the recommended daily TACABTS requirement (Fig. 2b). However, magenta ranked lower than red when the TAC was based on DPPH (Fig. S2b). Wide variation in red color group was related to the fact that lycopene and anthocyanins both indicated the red color. In addition, the color inhomogeneity in some fruits and vegetables such as fig and purple basil also caused large variation within the magenta sub classification. Even so, it is obvious that anthocyanin-rich fruits and vegetables in blue, red, and magenta color have high antioxidant capacity, while those rich in carotenoid or chlorophyll that are yellow or green in color have lower antioxidant capacity than others. These results support the view that most of the phenolic compounds including anthocyanins are more powerful antioxidants than other antioxidant groups (Rice-Evans et al., 1996). These findings are also in line with previous studies where anthocyanins > carotenoids > chlorophyll > ascorbic acid were sorted according to their TAC (Sozgen Baskan et al., 2013, Cömert and Gökmen, 2017). On the other hand, ascorbic acid-rich orange- and yellow-colored fruits and vegetables such as grapefruit, mango, yellow pepper, orange, banana, pear, nectarine, and pineapple were observed to have more antioxidant capacity than chlorophyll- and carotenoid-rich fruits and vegetables. If the level of ascorbic acid is much higher than that of carotenoids, fruits and vegetables containing ascorbic acid show more antioxidant capacity than those containing carotenoids and chlorophyll (Table 1). It should also be noted that potential contributions to meet recommended daily antioxidant TAC requirement calculated in this study are indicative for the fruits and vegetables studied but it might not reflect the variation within the fruit itself, such as ripeness state or different peel/flesh ratio.
Fig. 2.

Box-and-whisker plots for color classification of fruits and vegetables based on (a) their TAC (per kg) measured by the ABTS assay and (b) potential contributions to meet the recommended daily TAC (per serving size). The top and bottom of the box represent the 25th and 75th percentiles (quartiles), while the ends of the whiskers are the 10th and 90th percentiles, respectively.
3.2. Categorization of fruits and vegetables based on their TAC and its relation with color
In Table 3, the fruits and vegetables were categorized according to the measured TAC values and the potential contributions to meet the recommended daily TAC requirement. Comparing the two results of TAC considering with or without serving size, it can be concluded that the classification of fruits and vegetables can be achieved according to their total antioxidant capacity considering serving size. This categorization is also coherent with color classification based on TAC such that the fruits and vegetables in red, blue and magenta color are in the high antioxidant group, while green ones are in low antioxidant group. According to these results, when one consumes high-antioxidant foods from the first region, about 20% of required daily antioxidant intake can be potentially fulfilled. Conversely, about 10% and 20% of daily antioxidant intake can be contributed by the consumption of ascorbic acid and total phenol and some carotenoid-rich fruits and vegetables, categorized as medium-antioxidant foods. Chlorophyll- and some other carotenoid-rich fruits and vegetables are listed in Table 3 as low-antioxidant group that can potentially contribute to meet only less than 10% of daily antioxidant intake.
Table 3.
Classification of fruits and vegetables according to their measured TAC values (per kg) or potential contributions to meet the recommended daily TAC requirement (per serving size).
| Classification based on measured TAC values | Classification based on potential contributions to meet the recommended daily TAC requirement | ||
|---|---|---|---|
| High-antioxidant (>20 mmol TE/kg) | Black grape, strawberry, red cabbage, spinach, cranberry bean, red pepper, red apple, sour cherry, red currant | High-antioxidant (>20%) | Black grape, strawberry, red cabbage, cranberry bean, red pepper, red apple, sour cherry, red currant, green apple |
| Medium-antioxidant (10–20 mmol TE/kg) | Parsley, mint, blueberry, cress, eggplant, green apple, purple basil, rocket salad, red leaf lettuce, cherry, golden apple | Medium-antioxidant (10–20%) | Grapefruit, yellow pepper, corn, mango, golden apple, plum, orange, cherry, kiwi, banana, red grapefruit, pear, eggplant, zucchini, red onion, nectarine, parsley, green bean, pineapple, peach, radish, avocado, red grape |
| Low-antioxidant (<10 mmol TE/kg) | Corn, mango, plum, yellow pepper, zucchini, banana, dill, radish, grape, fig, orange, lettuce, lemon, pear, mushroom, scallion, nectarine, grapefruit, kiwi, cauliflower, red onion, peach, avocado, broccoli, pineapple, red grape, red grapefruit, cabbage, potato, yellow cherry, green bean, onion, cucumber, apricot, melon, green pepper, iceberg, tomato, carrot, watermelon | Low-antioxidant (<10%) | Scallion, grape, cauliflower, cress, spinach, melon, onion, yellow cherry, tomato, mushroom, apricot, green pepper, lemon, fig, potato, red leaf lettuce, carrot, cabbage, lettuce, watermelon, broccoli, iceberg, cucumber, rocket salad, dill, purple basil, mint |
In a related study, the fruits and vegetables were categorized into 10 groups based on the combination of botanic family, color, part of plant and TAC (Pennington and Fisher, 2009). However, the influence of TAC on this classification was not emphasized in this study and the serving size of fruits and vegetables was not considered. The same study also divided fruits and vegetables into subgroups based on their food component content and classification variables. According to this classification, watermelon, tomato and red pepper took part in the same category (Pennington and Fisher, 2010). However, in the present study, the antioxidant capacity of red pepper was found very high and ranked as high-antioxidant vegetable, while watermelon and tomato had low antioxidant capacity (Table 3). The cited study also categorized all legumes including kidney or cranberry bean, green bean in the same group (Pennington and Fisher, 2010). Nevertheless, according to our approach, TAC of cranberry bean and green bean are totally different from each other in parallel with their antioxidant contents, and this led to classify them in high-antioxidant and medium-antioxidant groups, respectively (Table 2). Moreover, the study conducted by Pennington and Fisher (2010) separated fruits and vegetables into 9 groups; however 14 fruits and 20 vegetables including apple, melon, kiwi, banana, mushrooms, and zucchini could not be categorized in one of these groups and all these were then categorized as ‘other’ (Pennington and Fisher, 2010). Differently, in the present study, all of these fruits and vegetables were evaluated based on their TAC per serving size that is in line with their antioxidant content (ascorbic acid, total phenol, carotenoid, and chlorophyll content) considering with their color.
3.3. Dietary recommendations for daily antioxidant intake with fruits and vegetables in different colors
USDA Dietary Guidelines report pointed out that one should focus on variety, amount and nutritional value of diet for healthy life. They developed eating guidelines in 2011 called as MyPlate and recommended making half of the plate with fruits and various vegetables (Center for Nutrition Poli, 2018, Department of Health Human Services U.S, 2018). However, another important consideration for dietary guidelines is to encourage people for consuming less sugar in their daily diet. It is very well known that fruits contain more sugar than vegetables; therefore, dietary guidelines recommended consuming more vegetables than fruits in the diet. Eating more vegetables is important since they provide vitamins, minerals and antioxidant compounds with their low calories (Center for Nutrition Policy and Promotion (CNPP) United States Department of Agriculture (USDA), 2018). They also emphasized that the recommended amount of fruits and vegetables should be determined depending on the healthy style eating pattern at the specific calorie level in specific groups (Department of Health Human Services U.S, 2018). For a normal individual consuming 2250 kcal per day, the amount of fruits and vegetables might be 2 cups-equivalents and 3 cups-equivalents, respectively (Department of Health Human Services U.S, 2018). Taking the total calorie intake into account, a variety of vegetables low in calories should be included to the diet, at the same time the anthocyanin-rich fruits have a high antioxidant capacity and meet the most of daily antioxidant intake. In the light of these considerations, a scenario was evaluated by doubling the serving size of vegetables (2 servings) and by reducing fruits portion to half (0.5 portion) in the plate and their relationship with color were investigated. TAC per plate was calculated according to this ratio as listed in the scenario column of Table 2. In that case, no differentiation based on the color of fruits and vegetables was observed. Red pepper, cranberry, yellow pepper, corn, strawberry, eggplant, zucchini, red onion, black grape, parsley, green bean and radish can potentially contribute between 59% and 20% of daily antioxidant intake and are categorized as high-antioxidant fruits and vegetables. Besides, scallion, cauliflower, cress, sour cherry, spinach, onion, red cabbage, blueberry, tomato, mushroom, green pepper, red apple, red currant, and green apple have medium antioxidant capacity by contributing between 10% and 16% of recommended daily antioxidant intake. The remaining fruits and vegetables listed in Table 2 rank as low-antioxidant foods. The USDA Dietary Guidelines give tips to people on choosing vegetables rich in different colors. They also recommend including vegetables that are red, orange or green on the plate, as they are full of vitamins and minerals. While their intention is not solely based on optimizing the consumption of foods with high antioxidant capacity, however these guidelines align with the purpose of the present study.
4. Conclusion
Visual perception exerts a crucial influence on selecting nutritious, safe, and healthy foods, the most significant function of human brain. In fact, color, as one of the most important sensory attributes, may be an indicator evolved as an adaptation for primates to select the more energy-rich red fruits among the dark green forest (Spence et al., 2016). This perception has still played a central role in human decision making to select nutritious and healthy foods in their diet. Similarly, in recent years, consumers prefer the red, blue or purple fruits and vegetables due to their potential health benefits through the antioxidant compounds in their structure. So, the relationship between the color of fruits and vegetables and their nutritional composition becomes important. This study was able to associate the color of fruits and vegetables with their antioxidant capacity in parallel with antioxidant content with some limitations. The most obvious finding that emerged from this study is that anthocyanin rich magenta, blue and red color fruits and vegetables are in the high-antioxidant foods category by potentially contributing more than 20% of required daily antioxidant intake, while the chlorophyll-rich green vegetables are among the low-antioxidant foods. Moreover, the study provides an approach to factor in food consumption (serving size) onto the potential of these foods to fulfill antioxidant daily requirements. This approach will be useful in expanding our understanding of how much antioxidant intake is potentially met by different color of fruits and vegetables. On the other hand, the limitations of this approach need to be considered. Three limitations encountered during prediction of the TAC according to the color are that 1) some fruits and vegetables have different color in their inner and outer part, 2) anthocyanins and lycopene are both related with red color but have different antioxidant capacity, and 3) some fruits and vegetables contain other antioxidant compounds in addition to pigmented ones. It is also important to keep in mind that including different colors in a meal should be considered together with the total calorie intake. It is essential to balance between the calorie and antioxidant intake by consuming fruits and vegetables in variable colors instead of bringing one group into the forefront.
Declaration of Competing Interest
The authors declare that they have no known competing financial interests or personal relationships that could have appeared to influence the work reported in this paper.
Footnotes
Supplementary data to this article can be found online at https://doi.org/10.1016/j.crfs.2019.11.001.
Appendix A. Supplementary data
The following are the Supplementary data to this article:
References
- Berset C., Caniaux P. Relationship between color evaluation and chlorophyllian pigment content in dried parsley leaves. J. Food Sci. 1983;48:1854–1857. [Google Scholar]
- Bhagwat S., Haytowitz D.B. Vol. 3.2. 2015. (USDA Database for the Flavonoid Content of Selected Foods- Release). [Google Scholar]
- Bohn T., Walczyk T. Determination of chlorophyll in plant samples by liquid chromatography using zinc–phthalocyanine as an internal standard. J. Chromatogr. A. 2004;1024:123–128. doi: 10.1016/j.chroma.2003.10.067. [DOI] [PubMed] [Google Scholar]
- Center for nutrition policy and promotion (CNPP) United States department of agriculture (USDA). A brief history of USDA food guides. https://www.choosemyplate.gov/brief-history-usda-food-guides/2018
- Center for Nutrition Policy and Promotion (CNPP) United States Department of Agriculture (USDA) MyPlate food guide- 10 tips: add more vegetables to your day. 2018. https://www.choosemyplate.gov/ten-tips-add-more-vegetables-to-your-day/
- Cömert E.D., Gökmen V. Antioxidants bound to an insoluble food matrix: their analysis, regeneration behavior, and physiological importance. Compr. Rev. Food Sci. Food Saf. 2017;16:382–399. doi: 10.1111/1541-4337.12263. [DOI] [PubMed] [Google Scholar]
- Commission Electrotechnique Internationale and Commission Internationale L'Eclairage. International Lighting Vocabulary; Geneva, Switzerland: 1987. [Google Scholar]
- Curutchet A., Dellacassa E., Ringuelet J.A., Chaves A.R., Viña S.Z. Nutritional and sensory quality during refrigerated storage of fresh-cut mints (Mentha×piperita and M. spicata) Food Chem. 2014;143:231–238. doi: 10.1016/j.foodchem.2013.07.117. [DOI] [PubMed] [Google Scholar]
- Department of Health Human Services U.S Department of agriculture. 2015–2020 dietary guidelines for Americans. 2018. http://health.gov/dietaryguidelines/2015/guidelines/
- Dueñas M., Pérez-Alonso J.J., Santos-Buelga C., Escribano-Bailón T. Anthocyanin composition in fig (Ficus carica L.) J. Food Compos. Anal. 2008;21:107–115. [Google Scholar]
- Ferretti G., Bacchetti T., Belleggia A., Neri D. Cherry antioxidants: from farm to table. Molecules. 2010;15:6993–7005. doi: 10.3390/molecules15106993. [DOI] [PMC free article] [PubMed] [Google Scholar]
- Fu L., Xu B.-T., Xu X.-R., Gan R.-Y., Zhang Y., Xia E.-Q., Li H.-B. Antioxidant capacities and total phenolic contents of 62 fruits. Food Chem. 2011;129:345–350. doi: 10.1016/j.foodchem.2011.04.079. [DOI] [PubMed] [Google Scholar]
- Itle R.A., Kabelka E.A. Correlation between lab color space values and carotenoid content in pumpkins and squash (Cucurbita spp.) Hortscience. 2009;44(3):633–637. [Google Scholar]
- Kallithraka S., Mohdaly A.A.A., Makris D.P., Kefalas P. Determination of major anthocyanin pigments in Hellenic native grape varieties (Vitis vinifera sp.): association with antiradical activity. J. Food Compos. Anal. 2005;18:375–386. [Google Scholar]
- Kalt W., Forney C.F., Martin A., Prior R.L. Antioxidant capacity, vitamin C, phenolics, and anthocyanins after fresh storage of small fruits. J. Agric. Food Chem. 1999;47:4638–4644. doi: 10.1021/jf990266t. [DOI] [PubMed] [Google Scholar]
- Kaur T., Bhat H.A., Raina A., Koul S., Vyas D. Glutathione regulates enzymatic antioxidant defence with differential thiol content in perennial pepperweed and helps adapting to extreme environment. Acta Physiol. Plant. 2013;35:2501–2511. [Google Scholar]
- Kim D.-O., Jeong S.W., Lee C.Y. Antioxidant capacity of phenolic phytochemicals from various cultivars of plums. Food Chem. 2003;81:321–326. [Google Scholar]
- Kopsell D.A., Kopsell D.E., Curran-Celentano J. Carotenoid and chlorophyll pigments in sweet basil grown in the field and greenhouse. Hortscience: public. Am. Soc. Hortic. Sci. 2005;40:1230–1233. [Google Scholar]
- Kruk J. Occurrence of chlorophyll precursors in leaves of cabbage heads – the case of natural etiolation. J. Photochem. Photobiol. B Biol. 2005;80:187–194. doi: 10.1016/j.jphotobiol.2005.04.003. [DOI] [PubMed] [Google Scholar]
- Larsen E., Christensen L.P. Simple saponification method for the quantitative determination of carotenoids in green vegetables. J. Agric. Food Chem. 2005;53:6598–6602. doi: 10.1021/jf050622+. [DOI] [PubMed] [Google Scholar]
- Lisiewska Z., Kmiecik W. Effect of freezing and storage on quality factors in Hamburg and leafy parsley. Food Chem. 1997;60:633–637. [Google Scholar]
- Lisiewska Z., Kmiecik W., Słupski J. Contents of chlorophylls and carotenoids in frozen dill: effect of useable part and pre-treatment on the content of chlorophylls and carotenoids in frozen dill (Anethum graveolens L.), depending on the time and temperature of storage. Food Chem. 2004;84:511–518. [Google Scholar]
- Macdougall D.B. Colour measurement of food: principles and practice. In: Gulrajani M.L., editor. Woodhead Publishing Series in Textiles, Colour Measurement. Woodhead Publishing; 2010. pp. 312–342. [Google Scholar]
- Magalhaes L.M., Segundo M.A., Reis S., Lima J.L.F.C. Methodological aspects about in vitro evaluation of antioxidant properties. Anal. Chim. Acta. 2008;613:1–19. doi: 10.1016/j.aca.2008.02.047. [DOI] [PubMed] [Google Scholar]
- McGhie T.K., Ainge G.D. Color in fruit of the genus Actinidia: carotenoid and chlorophyll compositions. J. Agric. Food Chem. 2002;50:117–121. doi: 10.1021/jf010677l. [DOI] [PubMed] [Google Scholar]
- Melo M.J., Pina F., Andary C. Anthocyanins: nature's glamorous palette. In: Stevens C.V., editor. Handbook of Natural Colorants. John Wiley & Sons, Ltd; 2009. pp. 135–150. [Google Scholar]
- Mogol B.A., Gokmen V. Computer vision-based analysis of foods: a non-destructive colour measurement tool to monitor quality and safety. J. Sci. Food Agric. 2014;94:1259–1263. doi: 10.1002/jsfa.6500. [DOI] [PubMed] [Google Scholar]
- Patras A., Brunton N.P., Downey G., Rawson A., Warriner K., Gernigon G. Application of principal component and hierarchical cluster analysis to classify fruits and vegetables commonly consumed in Ireland based on in vitro antioxidant activity. J. Food Compos. Anal. 2011;24:250–256. [Google Scholar]
- Pekal A., Pyrzynska K. Effect of pH and metal ions on DPPH radical scavenging activity of tea. Int. J. Food Sci. Nutr. 2015;66:58–62. doi: 10.3109/09637486.2014.959899. [DOI] [PubMed] [Google Scholar]
- Pennington J.A.T., Fisher R.A. Classification of fruits and vegetables. J. Food Compos. Anal. 2009;22:S23–S31. [Google Scholar]
- Pennington J.A.T., Fisher R.A. Food component profiles for fruit and vegetable subgroups. J. Food Compos. Anal. 2010;23:411–418. [Google Scholar]
- Pennington J.A.T. Definitions and classifications for fruit and vegetables. In: Vainio H., Bianchini F., editors. vol. 8. IARC Press; Lyon, France: 2003. pp. 1–21. (IARC Handbooks of Cancer Prevention). [Google Scholar]
- Prior R.L., Go L., Wu X., Jacob R.A., Sotoudeh G., Kader A.A., Cook R.A. Plasma antioxidant capacity changes following a meal as a measure of the ability of a food to alter in vivo antioxidant status. J. Am. Coll. Nutr. 2007;26:170–181. doi: 10.1080/07315724.2007.10719599. [DOI] [PubMed] [Google Scholar]
- Rice-Evans C.A., Miller N.J., Paganga G. Structure-antioxidant activity relationships of flavonoids and phenolic acids. Free Radic. Biol. Med. 1996;20:933–956. doi: 10.1016/0891-5849(95)02227-9. [DOI] [PubMed] [Google Scholar]
- Sanchez C., Baranda A.B., Martinez de Maranon I. The effect of High Pressure and High Temperature processing on carotenoids and chlorophylls content in some vegetables. Food Chem. 2014;163:37–45. doi: 10.1016/j.foodchem.2014.04.041. [DOI] [PubMed] [Google Scholar]
- Serpen A., Gökmen V., Fogliano V. Total antioxidant capacities of raw and cooked meats. Meat Sci. 2012;90:60–65. doi: 10.1016/j.meatsci.2011.05.027. [DOI] [PubMed] [Google Scholar]
- Sozgen Baskan K., Tutem E., Ozer N., Apak R. Spectrophotometric and chromatographic assessment of contributions of carotenoids and chlorophylls to the total antioxidant capacities of plant foods. J. Agric. Food Chem. 2013;61:11371–11381. doi: 10.1021/jf403356h. [DOI] [PubMed] [Google Scholar]
- Spence C., Okajima K., Cheok A.D., Petit O., Michel C. Eating with our eyes: from visual hunger to digital satiation. Brain Cogn. 2016;110:53–63. doi: 10.1016/j.bandc.2015.08.006. [DOI] [PubMed] [Google Scholar]
- Steinmetz K.A., Potter J.D. Vegetables, fruit, and cancer prevention: a review. J. Am. Diet. Assoc. 1996;96:1027–1039. doi: 10.1016/S0002-8223(96)00273-8. [DOI] [PubMed] [Google Scholar]
- Turkmen N., Poyrazoglu E.S., Sari F., Velioglu Y.S. Effects of cooking methods on chlorophylls, pheophytins and colour of selected green vegetables. Int. J. Food Sci. Technol. 2006;41:281–288. [Google Scholar]
- United States Department of Agriculture Agricultural Research Service USDA food composition databases. 2018. https://ndb.nal.usda.gov/ndb/search/list
- Van Buren J.P., Hrazdina G., Robinson W.B. Color of anthocyanin solutions expressed in lightness and chromaticity terms. Effect of pH and type of anthocyanin. J. Food Sci. 1974;39:325–328. [Google Scholar]
- Wu X., Beecher G.R., Holden J.M., Haytowitz D.B., Gebhardt S.E., Prior R.L. Concentrations of anthocyanins in common foods in the United States and estimation of normal consumption. J. Agric. Food Chem. 2006;54:4069–4075. doi: 10.1021/jf060300l. [DOI] [PubMed] [Google Scholar]
Associated Data
This section collects any data citations, data availability statements, or supplementary materials included in this article.