

Abstract
Osteoporosis is a complex disease with developmental origins. It is therefore important to understand the genetic contribution to pediatric areal bone mineral density (aBMD). Individual skeletal site phenotyping has been primarily used to identify pediatric aBMD loci. However, this approach is limited because there is a degree of aBMD discordance across skeletal sites. We, therefore, applied a novel multi-dimensional phenotyping approach to further understand the genetic regulation of pediatric aBMD. Our sample comprised a prospective, longitudinal cohort of 1,293 children of European ancestry (52% female; up to 7 annual measurements). Principal components analysis was applied to dual energy X-ray absorptiometry derived aBMD Z-scores for total hip, femoral neck, spine and distal radius to generate multi-dimensional aBMD phenotypes (i.e. principal component scores). We tested the association between a genetic score (percentage of bone lowering alleles at 63 loci) and each principal component. We also performed a genome wide association (GWAS), using the multi-ethnic baseline data (N=1,885) to identify novel loci associated with these principal components. The first component (PC1) reflected a concordant phenotypic model of the skeleton (e.g., higher loading score=higher BMD across all sites). In contrast, PC2 was discordant for distal radius versus spine and hip aBMD, and PC3 was discordant for spine versus distal radius and hip aBMD. The genetic score was associated with PC1 (beta=−0.05, P=3.9×10⁻¹⁰), but was not associated with discordant PC2 or PC3. Our GWAS discovered variation near CPED1 that associated with PC2 (rs67991850, P=2.5×10⁻¹¹) and near RAB11FIP5 (rs58649746, P=4.8×10⁻⁹) that associated with PC3. In conclusion, an established bone fragility genetic summary score was associated with a concordant skeletal phenotype, but not discordant skeletal phenotypes. Novel associations were observed for the discordant multi-dimensional skeletal phenotypes that provide new biological insights into the developing skeleton.
Keywords: Genetic, GWAS, bone mineral density, children
Introduction
Osteoporosis is a common complex disease, more prevalent among women than men(1,2), with a substantial genetic component(3,4). Low areal bone mineral density (aBMD), estimated by dual energy X-ray absorptiometry (DXA) at the lumbar spine or femoral neck, surpassing a T-score ≤−2.5, is used to diagnose osteoporosis in adults(1,2,5). Among U.S. women over the age of 50, osteoporosis prevalence varies by skeletal site; it is estimated at 9.8% at the femoral neck, 11.6% at the lumbar spine osteoporosis, and 16.5% at either skeletal site(2). The observation of a higher prevalence of lumbar spine osteoporosis is interesting, and from a clinical standpoint aBMD discordance is often observed (e.g., a patient with normal femoral neck, but clinically low lumbar spine aBMD)(6). Such discordance has not been systematically addressed in genetic studies to date; it is known that the genetic contributors to lumbar spine and femoral neck osteoporosis do not exactly overlap(7). Furthermore, osteoporosis may have developmental origins if bone accretion is insufficient in childhood(8). Thus, understanding the genetics of skeletal site aBMD concordance and discordance across the lifespan is particularly crucial.
Over the past decade, large-scale genomic studies have discovered in excess of 60 common and low frequency variants that are associated with pediatric and adult aBMD(7,9–18). In the adult setting, lumbar spine and femoral neck aBMD primarily have been studied, and emerging evidence highlights genetic skeletal site heterogeneity. Specifically, tests of heterogeneity have indicated that variants near MPP7, INSIG2 and KCNMA1 are associated more strongly with lumbar spine aBMD(7), whereas variants near KLHDC5/PTHLH, XKR9/LACTB2 and SALL1/CYLD are aligned more with femoral neck aBMD(7). In the pediatric setting, Kemp et al. derived skeletal regional phenotypes by dividing total body less head (TBLH) aBMD into lower limb and upper limb segments(10). Similar to findings in the adult setting, evidence of genetic skeletal region heterogeneity was observed (e.g., variants near RIN3 were more strongly associated with lower limb aBMD, whereas variants near CPED1 and WNT16 were more strongly associated with upper limb aBMD)(10). In addition, we previously reported genetic associations in the pediatric setting with distal radius aBMD near CPED1(9), with spine aBMD near IZUMO3(19), and with femoral neck aBMD within TBPL2(19).
Investigating genetic variation and its associations with individual skeletal sites/regions has led to important findings. However, these studies have not directly addressed skeletal site aBMD discordance. One approach would be to define both higher and lower aBMD cutoffs for each skeletal site and group participants into discordant and concordant categories. However, defining cutoffs is not straightforward, and there is the inherent problem that belonging to one category assumes being very different from another, even if close or very far from the cutoff boundary(20). Indeed, in contrast to adults, in children osteoporosis is not diagnosed on the basis of densitometric criteria alone, because optimal cutoffs are not known(21). We therefore elected to use a multi-dimensional phenotyping approach that combined information from individual skeletal sites, without the need to categorize, called principal component analysis(22,23). We specifically applied principal component analyses to generate multi-dimensional phenotypes(22,23) using estimates of aBMD at the lumbar spine, femoral neck, total hip, and distal radius derived from the Bone Mineral Density in Childhood Study (BMDCS)(24,25). In the process, we identified four principal components that provide concordant and discordant phenotypic models for the pediatric skeleton. In this study we: 1) present the results from the principal component analysis and describe the multi-dimensional phenotypes generated; 2) determine if established genetic variants are associated with the principal component phenotypes; and 3) used the principal component phenotypes to perform a genome wide association study (GWAS) in an effort to uncover novel aBMD loci.
Methods
Sample
The Bone Mineral Density in Childhood Study (BMDCS) enrolled 6- to 18-year-olds, in 2002–2003, who were followed annually until 2008–2009, at one of five clinical centers in the U.S.: Los Angeles, (CA), Cincinnati (OH), Omaha (NE), Philadelphia (PA), and New York (NY)(25). All participants were considered “healthy”. The inclusion criteria were: males aged 6–16 years, females aged 6–15 years, term birth (≥37 weeks gestation), birth weight >2.3 kg, no evidence of precocious or delayed puberty, and height, weight and body mass index (BMI) within the 3rd to the 97th percentiles for age. The exclusion criteria were: multiple fractures (more than two fractures if age <10 years or more than three fractures if age >10 years), current or previous medication use or medical condition known to affect bone health, extended bed rest, and same sex siblings. In 2006–2007, the BMDCS additionally enrolled 5 and 19 year olds, who were followed annually until 2008–2009. At the final study visit (2008–2009), blood or saliva were collected for the purpose of extracting and genotyping DNA. As part of the DNA collection effort, additional cross-sectional samples of children were recruited at the Cincinnati (OH) and Omaha (NE) sites to serve as a replication cohort. The same eligibility criteria and study protocol were applied to all cohorts. For participants under the age of 18, parent/guardian written informed consent and participants assent were provided. Written informed consent was obtained from participants aged 18 years or older. Institutional Review Boards at each study site approved the BMDCS protocol.
Bone Density Phenotyping
Dual energy X-ray absorptiometry (DXA) scans were performed annually. The skeletal sites scanned included the lumbar spine, distal radius and proximal femur (total hip and femoral neck). The following Hologic, Inc. (Bedford, MA) densitometers were used throughout: QDR4500A, QDR4500W, Delphi A and Apex models. All scans were centrally analyzed at the University of California, San Francisco’s DXA Core Laboratory to estimate aBMD for each skeletal site. For quality control purposes scan results were adjusted to account for the cross-calibration of DXA devices and longitudinal calibration stability. Site-specific aBMD Z-scores were calculated using the BMDCS reference values(25,26). Each Z-score was adjusted for height using the height-for-age Z-score method. This method adjusts for the effect of stature on aBMD during growth, and has been shown to be the least biased height adjustment method (26).
There is a degree of correlation between aBMD Z-scores across the four skeletal sites included in our study, but the correlations are not equal to one (Supplementary Figure 1). This suggests that there is some discordance in aBMD Z-scores between skeletal sites (e.g., low spine aBMD, but high total hip aBMD). There are no established cutoffs to define higher and lower aBMD in the pediatric setting to attempt to group participants into discordant and concordant categories. As noted above, there are limitations with such categorization(20). We therefore used principal component analysis to reduce our data to principal component loading scores that represent multi-dimensional continuous aBMD phenotypes. We used the pca command in Stata (StataCorp LLC, version 14.2, College Station, TX) for this purpose, using all available BMDCS data. We then calculated Z-scores for each principal component loading score, using the sample means and standard deviations, to standardize the loading score units for the analyses. This approach has been applied in previous related studies to generate multi-dimensional phenotypes(22,23). For example, Karasik et al. included 1,180 men and 1,758 women from the Framingham Osteoporosis Study and the following were entered into a principal component model to identify multi-dimensional bone and musculoskeletal phenotypes: DXA estimates of spine aBMD, femoral neck aBMD, hip geometry, and lower leg lean mass, along with ultrasound estimates of heel bone properties(22).
Genotyping and Genetic Variables
All DNA samples were genome-wide genotyped using the Illumina Infinium™ II OMNI Express plus Exome BeadChip (Illumina, San Diego) at the Center for Applied Genomics(27). PLINK (v1.07), an open source toolkit for genotype-based analyses(28), was used for quality control purposes to exclude: 1) those with incorrect sex assignment (or if sex could not be determined by genotype), 2) those with a missing rate per person >5% (i.e., excessive missing genotype data for an individual), 3) SNPs with a call rate <95% (i.e., removal of SNPs for which the alleles could not be readily identified at a rate of 95% or higher in the sample), and 4) SNPs with a minor allele frequency (MAF) <0.5% (i.e., variants that are too rare). Next, we imputed genotypes using the 1000 Genome Phase I Integrated Release Version 3 reference panel to provide greater resolution of variation across each participant’s genome. A two-step imputation process was applied: 1) SHAPEIT software was used for haplotype phasing to align alleles from the same chromosome, and allow for more efficient imputation(29); and 2) IMPUTE2 software was used for imputation of missing genotypes using phased haplotypes(30). For the X chromosome we used the specific chrX flag in SHAPEIT and IMPUTE2. Imputed genotypes were only used when directly assayed genotypes were unavailable.
Genetic Ancestry Markers
Population ancestry was defined using genetic markers. First we, pruned the autosomal genotyped SNPs using PLINK(28) to remove any pairs of SNPs within a window of 200 markers that were in linkage disequilibrium (LD; r2=0.05). After pruning, 35,000 SNPs remained and were used to estimate each participant’s ancestry using ADMIXTURE(31). This software applies a maximum likelihood estimation approach that models the probability of observed genotypes using ancestry proportions and ancestral population allele frequencies. The clustering method was set to group individuals in three ancestral populations (K=3), corresponding to African, European, and Asian ancestry components. Participants were assigned to one of these groups based on their highest fraction of estimated ancestry proportions (>0.50), using the HapMap Phase 2 population labels as a reference. The ancestry plot is given in Supplementary Figure 2.
Covariates
A physician or nurse with expertise in pediatric endocrinology assessed pubertal stage by physical exam. Participants were categorized as pre-pubertal, pubertal and post-pubertal (Tanner stages I, II to IV, and V, respectively)(32). Height (m) and weight (kg) were measured to allow for the calculation of BMI (kg/m2) and BMI Z-scores using U.S. standards(33). Dietary calcium intakes (g/d) were assessed from foods and drinks reported using a semi-quantitative food frequency questionnaire (Block Dietary Data Systems, Berkeley, CA)(34). Physical activity (hours per day) was estimated using the modified Slemenda questionnaire that included activities related to sports, leisure and activities of daily living(35,36).
Statistical Analyses: Candidate Loci Analyses
For the candidate loci analysis we calculated a bone fragility genetic risk score (GRS) using 63 common variants that have been GWAS-implicated with adult aBMD(7). Specifically, all bi-allelic variants were coded so that the aBMD lowering alleles were summed (i.e., a higher score means that more aBMD-lowering alleles are carried). The percentage of aBMD lowering alleles carried for each participant was calculated. In addition to the common variants, we also included the low frequency variant rs11692564, near EN1, as part of the candidate loci analyses (this variant was not included in the calculation of the genetic scores)(14).
Linear mixed models were used to test for associations between the genetic scores and the principal component loading scores, using all available data provided by those of European ancestry (longitudinal data from the discovery cohort and cross-sectional data from the replication cohort). The between-subject variability was modeled as a random effect and we used the method of maximum likelihood estimation. Robust standard errors (i.e., Huber-White standard errors) were calculated to ensure that the assumption of heteroskedasticity was achieved, using the robust option in Stata. We first tested if there was a main association between each genetic score and each principal component loading score, with BMI Z-score, dietary calcium, sex, Tanner stage, and physical activity included as covariates. We then tested for sex and age statistical interactions with respect to the genetic score. For the age interactions we considered quadratic and cubic age interactions to account for potential non-linear age modifications. The same modeling process was done for the low frequency variant rs11692564 (EN1). For the candidate loci analyses, P-values <0.05 were used as the threshold for statistical significance and these analyses were completed using Stata (StataCorp LLC, version 14.2, College Station, TX).
Statistical Analyses: GWAS
For the GWAS, we analyzed all genotyped and imputed SNPs for our trans-ethnic sample and for a sample restricted to European ancestry. We used cross-sectional data for these analyses because there are no established methods available for longitudinal GWAS. Linear mixed models were used to test for an association between each SNP and the principal component loading scores using GEMMA software(37). This approach accounts for population stratification and relatedness, using the Wald test and restricted maximum likelihood estimation of the beta coefficients. The statistical significance thresholds in the discovery, replication and combined cohorts were set at P<5×10⁻⁸, P<0.05 and P<5×10⁻⁸, respectively. We performed sex-combined and sex-stratified analyses and study site was included as a covariate in all models; cohort (discovery or replication) was included as covariate when both cohorts were analyzed together; and sex was included as a covariate when both sexes were analyzed together.
Results
The characteristics of the 1,234 European ancestry participants in the longitudinal study sample, used for the candidate gene analysis, are presented in Table 1. The characteristics of the 1,885 participants in the cross-sectional multi-ethnic sample used in the GWAS are presented in Supplementary Table 3.
Table 1.
Descriptive statistics for the longitudinal European Ancestry sample used for the candidate loci analyses
| Visit 1 (N=1,234) | Visit 2 (N=680) | Visit 3 (N=658) | Visit 4 (N=562) | Visit 5 (N=542) | Visit 6 (N=509) | Visit 7 (N=430) | |
|---|---|---|---|---|---|---|---|
| Longitudinal Cohort (5–20y), N | 769 | 680 | 658 | 562 | 542 | 509 | 430 |
| Cross-sectional Sample (5–19y), N | 465 | ||||||
| Age, mean (SD), years | 11.4 (4.5) | 10.8 (3.5) | 11.7 (3.4) | 13.5 (3.0) | 14.4 (3.0) | 15.1 (2.8) | 15.4 (2.4) |
| Female, N (%) | 644 (52.2) | 363 (53.4) | 350 (53.2) | 294 (52.3) | 291 (53.7) | 266 (52.3) | 234 (54.4) |
| BMI, mean (SD), Z-score | 0.29 (0.81) | 026 (0.86) | 0.26 (0.87) | 0.23 (0.88) | 0.23 (0.92) | 0.24 (0.91) | 0.23 (0.87) |
| Dietary Calcium, mean (SD), mg/d | 931 (493) | 934 (495) | 934 (489) | 916 (524) | 899 (550) | 890 (510) | 845 (470) |
| Total Physical Activity, mean (SD), h/d | 1.5 (1.2) | 1.5 (1.2) | 1.8 (1.2) | 1.8 (1.2) | 1.8 (1.2) | 1.8 (1.2) | 1.7 (1.3) |
| Tanner I, N (%) | 579 (46.9) | 358 (52.7) | 289 (43.9) | 138 (24.6) | 92 (17.0) | 63 (12.4) | 101 (23.5) |
| Tanner II–IV, N (%) | 322 (26.1) | 174 (25.6) | 178 (27.1) | 186 (33.1) | 181 (33.4) | 161 (31.6) | 83 (19.3) |
| Tanner V, N (%) | 333 (27.0) | 148 (21.8) | 191 (29.0) | 238 (42.4) | 269 (49.6) | 285 (56.0) | 246 (57.2) |
Multi-Dimensional Bone Phenotypes
Our principal component analysis yielded four principal components (PC1-PC4) that explained 68.1%, 18.6%, 10.5% and 2.8% of the variance, respectively (Table 2). The PC1 beta coefficients were directionally consistent for each skeletal site. This translates to a concordant phenotypic model of the skeleton, i.e. those with a higher PC1 loading score have higher aBMD at each skeletal site, and conversely those with a lower PC1 loading score have lower aBMD at each skeletal site (Figure 1). In contrast, PC2 and PC3 reflect discordant phenotypic models of the skeleton. The PC2 beta coefficients were negative for spine, total hip and femoral neck aBMD, but positive for distal radius aBMD (Table 2 and Figure 1), whereas the beta coefficients for PC3 were positive for spine aBMD, but negative for total hip, femoral neck and distal radius aBMD (Table 2 and Figure 1). Therefore, PC2 represents a phenotype discordant for distal radius versus hip and spine aBMD (Figure 1), and PC3 represents a phenotype discordant for spine versus hip and distal radius aBMD (Figure 1). Finally, given that PC4 explained only a relatively small proportion of the variance (2.8%) this phenotype was not included in the genetic analyses.
Table 2.
Principal components analysis results and derived multi-dimensional phenotypes
| Principal Component | Variance | Skeletal Site | Beta | SE | 95% CI |
|---|---|---|---|---|---|
| PC1 | 68.1 | Spine | 0.5009 | 0.004 | (0.4931,0.5087) |
| Total Hip | 0.5609 | 0.0027 | (0.5556,0.5662) | ||
| Femoral Neck | 0.549 | 0.0031 | (0.5430,0.5550) | ||
| Distal Radius | 0.3647 | 0.0066 | (0.3519,0.3776) | ||
| PC2 | 18.6 | Spine | −0.077 | 0.0152 | (−0.1067,−0.0472) |
| Total Hip | −0.2442 | 0.0073 | (−0.2586,−0.2299) | ||
| Femoral Neck | −0.2924 | 0.0083 | (−0.3087,−0.2761) | ||
| Distal Radius | 0.9214 | 0.0034 | (0.9146,0.9281) | ||
| PC3 | 10.5 | Spine | 0.8604 | 0.0027 | (0.8551,0.8656) |
| Total Hip | −0.3027 | 0.0071 | (−0.3166,−0.2889) | ||
| Femoral Neck | −0.3883 | 0.0073 | (−0.4026,−0.3739) | ||
| Distal Radius | −0.1316 | 0.0159 | (−0.1628,−0.1004) | ||
| PC4 | 2.8 | Spine | 0.0538 | 0.0061 | (0.0419,0.0656) |
| Total Hip | −0.7308 | 0.0026 | (−0.7360,−0.7256) | ||
| Femoral Neck | 0.68 | 0.0032 | (0.6737,0.6862) | ||
| Distal Radius | 0.0266 | 0.0043 | (0.0181,0.0350) |
PC1, principal component 1 (concordant phenotypic model); PC2, principal component 2 (discordant phenotypic model for distal radius versus the hip and spine aBMD); PC3, principal component 3 (discordant phenotypic model for spine versus the hip and distal radius aBMD).
Figure 1.

Correlations between standardized principal component scores and each aBMD bone Z-score.
Candidate Loci Results
Each 1% increase in the genetic score was associated with lower PC1 loading score (Table 3, beta=−0.047, P=2.69×10⁻¹⁴). This association was directionally consistent for both males and females, but stronger in the latter (beta=−0.061, P=2.18×10⁻¹³; sex interaction P-value=0.011), and was directionally consistent across the age range of 5 to 19 years (Figure 1, age interaction P-value=0.100). On the other hand, the genetic score was not associated with PC2 or PC3 (Table 3 and Figure 2).
Table 3.
Genetic risk score and EN1 variant associations with the principal component scores
| PC1 | PC2 | PC3 | |||||||
|---|---|---|---|---|---|---|---|---|---|
| Exposure | Sex | Obs | N | Beta (95% CI) | P-value | Beta (95% CI) | P-value | Beta (95% CI) | P-value |
| GRS63 | Both | 4615 | 1263 | −0.047 (−0.059,−0.035) | 2.69E-14 | −0.002 (−0.014,0.010) | 0.732 | 0.008 (−0.006,0.021) | 0.278 |
| GRS63 | Female | 2760 | 711 | −0.061 (−0.078,−0.045) | 2.18E-13 | −0.017 (−0.034,−0.001) | 0.042 | 0.015 (−0.002,0.032) | 0.086 |
| GRS63 | Male | 2537 | 662 | −0.034 (−0.050,−0.018) | 2.72E-05 | 0.016 (−0.001,0.032) | 0.062 | 0.005 (−0.015,0.025) | 0.612 |
| GRS63#Sex | Both | 4615 | 1263 | 0.011 | 0.003 | 0.444 | |||
| rs11692564-T | Both | 4730 | 1294 | 0.463 (0.050,0.877) | 0.028 | −0.378 (−0.753,−0.004) | 0.048 | −0.322 (−0.633,−0.011) | 0.043 |
| rs11692564-T | Female | 2820 | 726 | 0.763 (0.356,1.170) | 2.42E-04 | −0.112 (−0.619,0.396) | 0.667 | −0.394 (−0.738,−0.049) | 0.025 |
| rs11692564-T | Male | 2606 | 681 | −0.394 (−0.943,0.155) | 0.160 | −0.352 (−0.872,0.169) | 0.185 | −0.196 (−0.598,0.206) | 0.339 |
| rs11692564-T#Sex | 4730 | 1294 | 0.002 | 0.222 | 0.391 | ||||
Abbreviations: Obs, total number of observation included in the longitudinal models; GRS, genetic risk score. PC1, principal component 1 (concordant phenotypic model); PC2, principal component 2 (discordant phenotypic model for distal radius versus the hip and spine aBMD); PC3, principal component 3 (discordant phenotypic model for spine versus the hip and distal radius aBMD). The frequency of the T allele for rs11692564 is 1%. The betas represent the change in principal component Z-scores per additional 1% increase in the genetic score, or per additional rs11692564 effect allele.
Figure 2.
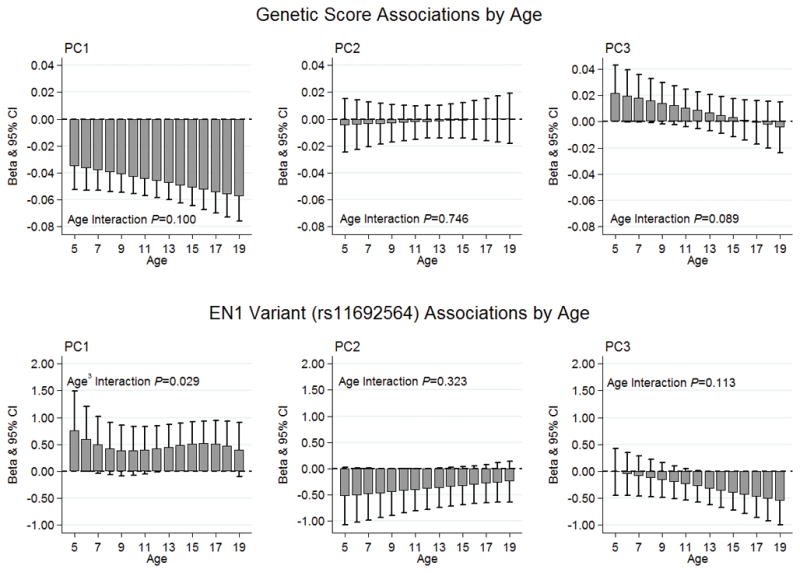
Candidate loci associations by age. Top row: no evidence of statistical genetic score-age interactions for PC1, PC2, or PC3. Bottom row: a quadratic, non-linear rs11692564-age interaction for PC1 (P=0.029); no statistical rs11692564-age interactions for PC2 or PC3. PC1, principal component 1 (concordant phenotypic model); PC2, principal component 2 (discordant phenotypic model for distal radius versus the hip and spine aBMD); PC3, principal component 3 (discordant phenotypic model for spine versus the hip and distal radius aBMD).
The low frequency T allele of rs11692564, near EN1, was positively associated with PC1 (Table 3, beta=0.46, P=0.028), and strongest in females (beta=0.76, P=2.4×10⁻⁴; sex interaction P-value=0.002). Furthermore, this association varied over the 5-to-19-year-old age range in a non-linear pattern: positive associations were observed at ages 5 and 6 and again at ages 13 to 18 (Figure 2, age3 interaction P-value=0.029). In contrast, a negative association was observed between rs11692564 and both PC2 (beta=−0.38, P=0.048) and PC3 (beta=−0.32, P=0.043) (Table 3). However, as the standard errors were relatively large these PC2 and PC3 associations were borderline and should therefore be interpreted with caution. Finally, there was no statistical evidence of sex or age interactions with respect to rs11692564 and PC2 or PC3 (Table 3 and Figure 2, interaction P-values >0.05).
GWAS Results
In the trans-ethnic sample, we observed three genome wide significant associations (Table 4 and Figure 3). The strongest signal was for the C allele of rs67991850 near CPED1 with PC2. In the sex-combined analyses, this variant was positively associated with the PC2 loading score (discovery and replication combined beta=0.24, SE=0.04, P=2.5×10⁻¹¹). This positive association was also observed when the sample was restricted to females only (discovery and replication combined beta=0.33, SE=0.05, P=3.7×10⁻¹²). In addition to a strong signal nearest to CPED1, there was an indication of a weaker secondary signal at the 7q31.31 locus for PC2 nearest to WNT16 (Figure 3). We therefore performed a conditional analysis on our lead CPED1 variant (rs34249834) to observe if the partial signal nearest to WNT16 changed. The signal above WNT16 gained slightly in strength when conditioned on the CPED1 lead SNP, but it did not reach genome wide significance (Supplementary Figure 3).
Table 4.
Trans-ethnic GWAS signals observed for the principal component loading scores
| Discovery (N=1,399) | Replication (N=486) | Combined (N=1,885) | ||||||||||||||
|---|---|---|---|---|---|---|---|---|---|---|---|---|---|---|---|---|
| Phenotype | Sex | Chr. | SNP | Positiona | Allele | EAF | Beta | SE | P-value | Beta | SE | P-value | Beta | SE | P-value | Nearest Gene |
| PC1 | F | 8 | rs75321045 | 40483038 | G | 0.95 | 0.63 | 0.12 | 2.16E-07 | 0.59 | 0.25 | 0.020 | 0.61 | 0.11 | 2.50E-08 | ZMAT4 |
| PC2 | MF | 7 | rs67991850 | 120813920 | C | 0.65 | 0.23 | 0.04 | 5.80E-08 | 0.26 | 0.07 | 1.01E-04 | 0.24 | 0.04 | 2.51E-11 | CPED1 |
| PC2 | F | 7 | rs34249834 | 120774116 | C | 0.66 | 0.34 | 0.06 | 1.48E-09 | 0.28 | 0.08 | 9.02E-04 | 0.33 | 0.05 | 3.66E-12 | CPED1 |
| PC3 | F | 2 | rs58649746 | 73351806 | G | 0.86 | -0.43 | 0.08 | 3.08E-08 | −0.40 | 0.17 | 0.018 | −0.42 | 0.07 | 4.76E-09 | RAB11FIP5 |
Abbreviations: EAF, effect allele frequency; F, female; M, male; SE, standard error, SNP, single nucleotide polymorphism. PC1, principal component 1 (concordant phenotypic model); PC2, principal component 2 (discordant phenotypic model for distal radius versus the hip and spine aBMD); PC3, principal component 3 (discordant phenotypic model for spine versus the hip and distal radius aBMD).
Reference genome: GRCh37 (hg19). The betas represent the change in principal component Z-scores per additional effect allele.
Figure 3.


Regional plots illustrating the trans-ethnic GWAS signals among females for the concordant phenotypic model (PC1) and the discordant phenotypic models of the skeleton (PC2 and PC3).
In females, the G allele of rs58649746 (RAB11FIP5) was associated with PC3 (discovery and replication combined beta=−0.42, SE=0.07, P=4.76×10⁻⁹), and the G allele of rs75321045 (ZMAT4) was associated with PC1 (discovery and replication combined beta=0.61, SE=0.11, P=2.5×10⁻⁸). The same findings were observed in the sample restricted to participants of European ancestry (Supplementary Table 4).
Discussion
We used principal components analyses to generate multi-dimensional phenotypes by leveraging measures of aBMD at the lumbar spine, femoral neck, total hip and distal radius. Beyond the first component (PC1), which reflected a phenotype with concordant aBMD at all the skeletal sites examined, we also identified two discordant phenotypic models, namely PC2 (aBMD discordant for distal radius versus spine and hip) and PC3 (aBMD discordant for spine versus distal radius and hip). Importantly, we observed that a bone fragility genetic score, comprised of 63 known GWAS implicated aBMD loci, was associated with a lower PC1 loading score, but not with the PC2 or PC3 loading scores. These striking contrasts suggest that the majority of genetic aBMD discoveries thus far have been related to a concordant phenotypic model of the skeleton, while it further suggest that genetic discoveries can still be made using discordant phenotypic models of the skeleton. Indeed, our GWAS implicated a novel locus with the discordant phenotypic model for PC3 among females (RAB11FIP5). This multi-dimensional phenotyping approach is in its relative infancy, but has been used to uncover novel genetic loci for multi-dimensional anthropometric phenotypes and musculoskeletal phenotypes in adults(22,23). Our study serves as proof of principle for larger scale genomic efforts in the future to further unveil the genetic regulation of concordant and discordant phenotypic models of the pediatric skeleton.
The bone fragility genetic score association with PC1 was in the expected negative direction, which translates to lower aBMD at the spine, hip sites and distal radius with a greater proportion of aBMD lowering alleles carried. Likewise, the relatively infrequent T allele of rs11692564 (EN1) was associated with PC1 in the expected positive direction, translating to higher aBMD at the spine, hip sites and distal radius for each additional copy of this aBMD increasing allele. In contrast, there were no genetic score associations with either of the discordant phenotypes, while there was only borderline association with rs11692564 (EN1). Overall, our candidate locus analyses suggest that genetic discoveries related to bone fragility thus far provide biological insight into a concordant model of the skeleton and are not applicable to less common, more complex discordant aBMD profiles. Given that a proportion of osteoporosis diagnoses are indeed discordant in nature, it is important to study the genetic basis of this discordancy in order to fully understand the underlying biology, which in turn could inform alternative treatments and preventive measures.
Our strongest GWAS signal was located near CPED1 for the discordant PC3, and was particularly strong among females. Indeed, our previously reported individual skeletal site GWAS had already implicated variants at this same locus with distal radius aBMD(9,19); therefore, our new findings with these discordant phenotypes build on that original observation. Our findings are in line with another pediatric study, which modeled individual skeletal regions that reported an association between this locus and upper limb, but not lower limb, aBMD(10).
There are functional data to support the CPED1 signal with bone biology. SNP rs67991850 resides at the 7q31.31 locus and its proxies interestingly span two topologically associated domains (TADs)(38) (Supplementary Figure 4), so that the full list of possibly causal genes include WNT16 and FAM3C (hg19 start-end TAD domain positions: 120750000 - 121670000) plus ING3 and TSPAN12 (hg19 TAD domain start-end positions: 120425000 - 120750000) (Supplementary Tables 5 and 6). Zheng et al. discovered a low frequency variant near CPED1 that associated with adult aBMD and this variant was correlated with DNA accessibility at the WNT16 promoter (r=0.43, P=2.2×10⁻¹⁵), and to a lesser extent at the TSPAN12 promoter (r=0.17, P=0.003), in over 300 cell types(14). Overall, given the known biology, WNT16 is the most likely causative gene at the 7q31.31 locus regulating aBMD; after all, Wnt16 knockout animals have lower total body and femur bone mineral content, aBMD and bone area compared to wild-types(11); they also have lower femur shaft total area, bone area, marrow area, cortical thickness compared to wild-types(39), plus they have lower bone strength at the femur and tibia compared to wild-types(39). However, TSPAN12 is also a plausible candidate given that it is also involved in the regulation of WNT signaling (TSPAN12 facilitates the binding of Norrin to the Frizzled Receptor 4 [FZD4] and this complex binds to LDL Receptor-related Protein 5 [LRP5])(40).
We also found that variation near RAB11FIP5 was associated with the phenotype discordant for spine versus hip and distal radius aBMD among females. This principal component has potential clinical relevance since it is discordant for skeletal sites used to diagnose osteoporosis, so warrants further investigation, particularly from a potential personalized medicine perspective. In addition, we observed a novel signal near ZMAT4 for the concordant phenotypic model among females. Because roles for these loci have not previously been implicated in bone density related phenotypes, fewer functional data are available to support our observed signals. RAB11FIP5 resides at the 2p13.2 locus, with the signal residing in a TAD that includes four other genes: NOTO, SFXN5, SPR and EMX1. We queried the International Mouse Phenotyping Consortium (IMPC) phenotyping catalog(41), and Rab11fip5 knockouts did not exhibit any impact on bone phenotypes. No aBMD, BMC or bone area data were available for Noto, Sfxn5, Spr and Emx1 knockouts. However, Emx1 knockouts do exhibit decreased grip strength, along with decreased circulating insulin and infertility in females. Importantly, aBMD, BMC and bone area in Wnt16 knockouts within this catalog are similar to wild type; therefore, the IMPC DXA effort may not always yield results that reflect the biology in humans.
The major strengths of our study are the multi-dimensional phenotyping approach; the extensive longitudinal data used for the candidate loci analyses consisting of over 4,600 observations; and the use of both trans-ethnic and European ancestry specific samples in our GWAS analyses. We elected to use measures of aBMD at the spine, hip (total and femoral neck) and the distal radius, as the spine and hip are used to diagnose osteoporosis while the distal radius is the most common fracture site in childhood. Our study, though, does have some limitations. We observed concordant and discordant phenotypic models of the skeleton, but it is not known if these multi-dimensional phenotypes are typical in the population or if they are a unique feature of the BMDCS sample; therefore, it will be important for independent studies to replicate our phenotypic models across the pediatric and adult age spectra. The inclusion of hip geometry and lean mass phenotypes, as reported by Karasik et al.(22), may prove valuable in a future principal component based phenotyping effort. Similarly, combining DXA estimates of aBMD with p-QCT estimates of volumetric BMD could also be leveraged for a future principal component phenotyping approach. Our candidate locus analyses were restricted to participants of European ancestry as the variants used were discovered among adults of European ancestry(7,14). Furthermore, we only included GWAS-implicated aBMD variants for calculating the genetic score and not GWAS-implicated variants associated with p-QCT bone phenotypes(42,43), because we only include aBMD, and not volumetric BMD, estimates in our study. Lastly, while we replicated our GWAS discovery signals, our sample size for the GWAS analyses overall is relatively small and we are likely underpowered to detect variants with small effect sizes in the constrained settings dictated by our principal components.
In conclusion, established bone fragility variants were associated with a concordant phenotypic model of the pediatric skeleton, but not with discordant phenotypic models. We discovered a novel locus that was associated with the multi-dimensional phenotype of discordant spine versus hip and distal radius aBMD. These findings provide insight into the underlying biology of aBMD concordance and discordance, plus place previously reported loci in context. Our observations have the potential to drive the development of individualized approaches to the diagnosis and treatment of osteoporosis.
Supplementary Material
Acknowledgments
The study was funded by R01 HD58886; the Eunice Kennedy Shriver National Institute of Child Health and Human Development (NICHD) contracts (N01-HD-1-3228, -3329, -3330, -3331, -3332, -3333); and the CTSA program Grant 8 UL1 TR000077. Jonathan Mitchell was supported by K01 HL123612. The funders had no role in the design and conduct of the study; collection, management, analysis, and interpretation of the data; preparation, review, or approval of the manuscript; and decision to submit the manuscript for publication. We appreciate the dedication of the study participants and their families, and the support of Dr. Karen Winer, Scientific Director of the Bone Mineral Density in Childhood Study.
Footnotes
Disclosure: The authors have no conflicts of interest to disclose.
Study conception and design: JM, SG and BZ. Acquisition of data: SG, BZ, HK, JL, VG, SO and JS. Data analysis: JM, AC and DC. Interpretation of data: JM, AC, DC, SM, SR, HK, JL, VG, SO, JS, AK, BS and SG. Drafting manuscript: JM. Revising manuscript content: AC, DC, SM, SR, HK, JL, VG, SO, JS and AK. Approving final version of manuscript: JM, AC, DC, SM, SR, HK, JL, VG, SO, JS, AK, BS and SG. JM takes full responsibility for the integrity of the data analysis.
References
- 1.Wright NC, Looker AC, Saag KG, et al. The recent prevalence of osteoporosis and low bone mass in the United States based on bone mineral density at the femoral neck or lumbar spine. J Bone Miner Res. 2014;29(11):2520–6. doi: 10.1002/jbmr.2269. [DOI] [PMC free article] [PubMed] [Google Scholar]
- 2.Looker AC, Sarafrazi Isfahani N, Fan B, Shepherd JA. Trends in osteoporosis and low bone mass in older US adults, 2005–2006 through 2013–2014. Osteoporosis international: a journal established as result of cooperation between the European Foundation for Osteoporosis and the National Osteoporosis Foundation of the USA. 2017;28(6):1979–88. doi: 10.1007/s00198-017-3996-1. [DOI] [PMC free article] [PubMed] [Google Scholar]
- 3.Kemp JP, Medina-Gomez C, Tobias JH, Rivadeneira F, Evans DM. The case for genome-wide association studies of bone acquisition in paediatric and adolescent populations. Bonekey Rep. 2016;5:796. doi: 10.1038/bonekey.2016.23. [DOI] [PMC free article] [PubMed] [Google Scholar]
- 4.Mitchell JA, Cousminer DL, Zemel BS, Grant SF, Chesi A. Genetics of pediatric bone strength. Bonekey Rep. 2016;5:823. doi: 10.1038/bonekey.2016.50. [DOI] [PMC free article] [PubMed] [Google Scholar]
- 5.Kanis JA, Melton LJ, 3rd, Christiansen C, Johnston CC, Khaltaev N. The diagnosis of osteoporosis. J Bone Miner Res. 1994;9(8):1137–41. doi: 10.1002/jbmr.5650090802. [DOI] [PubMed] [Google Scholar]
- 6.El Maghraoui A, Mouinga Abayi DA, Rkain H, Mounach A. Discordance in diagnosis of osteoporosis using spine and hip bone densitometry. J Clin Densitom. 2007;10(2):153–6. doi: 10.1016/j.jocd.2006.12.003. [DOI] [PubMed] [Google Scholar]
- 7.Estrada K, Styrkarsdottir U, Evangelou E, et al. Genome-wide meta-analysis identifies 56 bone mineral density loci and reveals 14 loci associated with risk of fracture. Nat Genet. 2012;44(5):491–501. doi: 10.1038/ng.2249. [DOI] [PMC free article] [PubMed] [Google Scholar]
- 8.Weaver CM, Gordon CM, Janz KF, et al. The National Osteoporosis Foundation’s position statement on peak bone mass development and lifestyle factors: a systematic review and implementation recommendations. Osteoporosis international: a journal established as result of cooperation between the European Foundation for Osteoporosis and the National Osteoporosis Foundation of the USA. 2016;27(4):1281–386. doi: 10.1007/s00198-015-3440-3. [DOI] [PMC free article] [PubMed] [Google Scholar]
- 9.Chesi A, Mitchell JA, Kalkwarf HJ, et al. A trans-ethnic genome-wide association study identifies gender-specific loci influencing pediatric aBMD and BMC at the distal radius. Human molecular genetics. 2015;24(17):5053–9. doi: 10.1093/hmg/ddv210. [DOI] [PMC free article] [PubMed] [Google Scholar]
- 10.Kemp JP, Medina-Gomez C, Estrada K, et al. Phenotypic dissection of bone mineral density reveals skeletal site specificity and facilitates the identification of novel loci in the genetic regulation of bone mass attainment. PLoS genetics. 2014;10(6):e1004423. doi: 10.1371/journal.pgen.1004423. [DOI] [PMC free article] [PubMed] [Google Scholar]
- 11.Medina-Gomez C, Kemp JP, Estrada K, et al. Meta-analysis of genome-wide scans for total body BMD in children and adults reveals allelic heterogeneity and age-specific effects at the WNT16 locus. PLoS genetics. 2012;8(7):e1002718. doi: 10.1371/journal.pgen.1002718. [DOI] [PMC free article] [PubMed] [Google Scholar]
- 12.Mitchell JA, Chesi A, McCormack SE, et al. Rare EN1 Variants and Pediatric Bone Mass. J Bone Miner Res. 2016 doi: 10.1002/jbmr.2833. [DOI] [PMC free article] [PubMed]
- 13.Timpson NJ, Tobias JH, Richards JB, et al. Common variants in the region around Osterix are associated with bone mineral density and growth in childhood. Human molecular genetics. 2009;18(8):1510–7. doi: 10.1093/hmg/ddp052. [DOI] [PMC free article] [PubMed] [Google Scholar]
- 14.Zheng HF, Forgetta V, Hsu YH, et al. Whole-genome sequencing identifies EN1 as a determinant of bone density and fracture. Nature. 2015;526(7571):112–7. doi: 10.1038/nature14878. [DOI] [PMC free article] [PubMed] [Google Scholar]
- 15.Rivadeneira F, Styrkarsdottir U, Estrada K, et al. Twenty bone-mineral-density loci identified by large-scale meta-analysis of genome-wide association studies. Nat Genet. 2009;41(11):1199–206. doi: 10.1038/ng.446. [DOI] [PMC free article] [PubMed] [Google Scholar]
- 16.Duncan EL, Danoy P, Kemp JP, et al. Genome-wide association study using extreme truncate selection identifies novel genes affecting bone mineral density and fracture risk. PLoS genetics. 2011;7(4):e1001372. doi: 10.1371/journal.pgen.1001372. [DOI] [PMC free article] [PubMed] [Google Scholar]
- 17.Richards JB, Rivadeneira F, Inouye M, et al. Bone mineral density, osteoporosis, and osteoporotic fractures: a genome-wide association study. Lancet. 2008;371(9623):1505–12. doi: 10.1016/S0140-6736(08)60599-1. [DOI] [PMC free article] [PubMed] [Google Scholar]
- 18.Styrkarsdottir U, Halldorsson BV, Gretarsdottir S, et al. Multiple genetic loci for bone mineral density and fractures. N Engl J Med. 2008;358(22):2355–65. doi: 10.1056/NEJMoa0801197. [DOI] [PubMed] [Google Scholar]
- 19.Chesi A, Mitchell JA, Kalkwarf HJ, et al. A Genomewide Association Study Identifies Two Sex-Specific Loci, at SPTB and IZUMO3, Influencing Pediatric Bone Mineral Density at Multiple Skeletal Sites. J Bone Miner Res. 2017;32(6):1274–81. doi: 10.1002/jbmr.3097. [DOI] [PMC free article] [PubMed] [Google Scholar]
- 20.Altman DG, Royston P. The cost of dichotomising continuous variables. BMJ. 2006;332(7549):1080. doi: 10.1136/bmj.332.7549.1080. [DOI] [PMC free article] [PubMed] [Google Scholar]
- 21.Gordon CM, Leonard MB, Zemel BS International Society for Clinical D. 2013 Pediatric Position Development Conference: executive summary and reflections. J Clin Densitom. 2014;17(2):219–24. doi: 10.1016/j.jocd.2014.01.007. [DOI] [PubMed] [Google Scholar]
- 22.Karasik D, Cheung CL, Zhou Y, Cupples LA, Kiel DP, Demissie S. Genome-wide association of an integrated osteoporosis-related phenotype: is there evidence for pleiotropic genes? J Bone Miner Res. 2012;27(2):319–30. doi: 10.1002/jbmr.563. [DOI] [PMC free article] [PubMed] [Google Scholar]
- 23.Ried JS, Jeff MJ, Chu AY, et al. A principal component meta-analysis on multiple anthropometric traits identifies novel loci for body shape. Nat Commun. 2016;7:13357. doi: 10.1038/ncomms13357. [DOI] [PMC free article] [PubMed] [Google Scholar]
- 24.Kalkwarf HJ, BSZ, VG, et al. The bone mineral density in childhood study: bone mineral content and density according to age, sex, and race. Clin Endocrinol Metab. 2007;92:2087–99. doi: 10.1210/jc.2006-2553. [DOI] [PubMed] [Google Scholar]
- 25.Zemel BS, Kalkwarf HJ, Gilsanz V, et al. Revised reference curves for bone mineral content and areal bone mineral density according to age and sex for black and non-black children: results of the bone mineral density in childhood study. The Journal of clinical endocrinology and metabolism. 2011;96(10):3160–9. doi: 10.1210/jc.2011-1111. [DOI] [PMC free article] [PubMed] [Google Scholar]
- 26.Zemel BS, Leonard MB, Kelly A, et al. Height adjustment in assessing dual energy x-ray absorptiometry measurements of bone mass and density in children. The Journal of clinical endocrinology and metabolism. 2010;95(3):1265–73. doi: 10.1210/jc.2009-2057. [DOI] [PMC free article] [PubMed] [Google Scholar]
- 27.Hakonarson H, Grant SF, Bradfield JP, et al. A genome-wide association study identifies KIAA0350 as a type 1 diabetes gene. Nature. 2007;448(7153):591–4. doi: 10.1038/nature06010. [DOI] [PubMed] [Google Scholar]
- 28.Purcell S, Neale B, Todd-Brown K, et al. PLINK: a tool set for whole-genome association and population-based linkage analyses. American journal of human genetics. 2007;81(3):559–75. doi: 10.1086/519795. [DOI] [PMC free article] [PubMed] [Google Scholar]
- 29.Delaneau O, Zagury JF, Marchini J. Improved whole-chromosome phasing for disease and population genetic studies. Nat Methods. 2013;10(1):5–6. doi: 10.1038/nmeth.2307. [DOI] [PubMed] [Google Scholar]
- 30.Howie BN, Donnelly P, Marchini J. A flexible and accurate genotype imputation method for the next generation of genome-wide association studies. PLoS genetics. 2009;5(6):e1000529. doi: 10.1371/journal.pgen.1000529. [DOI] [PMC free article] [PubMed] [Google Scholar]
- 31.Alexander DH, Novembre J, Lange K. Fast model-based estimation of ancestry in unrelated individuals. Genome research. 2009;19(9):1655–64. doi: 10.1101/gr.094052.109. [DOI] [PMC free article] [PubMed] [Google Scholar]
- 32.Zachmann M, Prader A, Kind HP, Hafliger H, Budliger H. Testicular volume during adolescence. Cross-sectional and longitudinal studies. Helv Paediatr Acta. 1974;29(1):61–72. [PubMed] [Google Scholar]
- 33.Kuczmarski RJ, Ogden CL, Grummer-Strawn LM, et al. CDC growth charts: United States. Adv Data. 2000;(314):1–27. [PubMed]
- 34.Ollberding NJ, Gilsanz V, Lappe JM, et al. Reproducibility and intermethod reliability of a calcium food frequency questionnaire for use in Hispanic, non-Hispanic Black, and non-Hispanic White youth. J Acad Nutr Diet. 2015;115(4):519–27. e2. doi: 10.1016/j.jand.2014.12.016. [DOI] [PMC free article] [PubMed] [Google Scholar]
- 35.Slemenda CW, Miller JZ, Hui SL, Reister TK, Johnston CC., Jr Role of physical activity in the development of skeletal mass in children. J Bone Miner Res. 1991;6(11):1227–33. doi: 10.1002/jbmr.5650061113. [DOI] [PubMed] [Google Scholar]
- 36.Mitchell JA, Chesi A, Elci O, et al. Physical Activity Benefits the Skeleton of Children Genetically Predisposed to Lower Bone Density in Adulthood. J Bone Miner Res. 2016 doi: 10.1002/jbmr.2872. [DOI] [PMC free article] [PubMed] [Google Scholar]
- 37.Zhou X, Stephens M. Genome-wide efficient mixed-model analysis for association studies. Nat Genet. 2012;44(7):821–4. doi: 10.1038/ng.2310. [DOI] [PMC free article] [PubMed] [Google Scholar]
- 38.Dixon JR, Selvaraj S, Yue F, et al. Topological domains in mammalian genomes identified by analysis of chromatin interactions. Nature. 2012;485(7398):376–80. doi: 10.1038/nature11082. [DOI] [PMC free article] [PubMed] [Google Scholar]
- 39.Zheng HF, Tobias JH, Duncan E, et al. WNT16 influences bone mineral density, cortical bone thickness, bone strength, and osteoporotic fracture risk. PLoS genetics. 2012;8(7):e1002745. doi: 10.1371/journal.pgen.1002745. [DOI] [PMC free article] [PubMed] [Google Scholar]
- 40.Gilmour DF. Familial exudative vitreoretinopathy and related retinopathies. Eye (Lond) 2015;29(1):1–14. doi: 10.1038/eye.2014.70. [DOI] [PMC free article] [PubMed] [Google Scholar]
- 41.Koscielny G, Yaikhom G, Iyer V, et al. The International Mouse Phenotyping Consortium Web Portal, a unified point of access for knockout mice and related phenotyping data. Nucleic acids research. 2014;42(Database issue):D802–9. doi: 10.1093/nar/gkt977. [DOI] [PMC free article] [PubMed] [Google Scholar]
- 42.Paternoster L, Lorentzon M, Lehtimaki T, et al. Genetic determinants of trabecular and cortical volumetric bone mineral densities and bone microstructure. PLoS genetics. 2013;9(2):e1003247. doi: 10.1371/journal.pgen.1003247. [DOI] [PMC free article] [PubMed] [Google Scholar]
- 43.Paternoster L, Lorentzon M, Vandenput L, et al. Genome-wide association meta-analysis of cortical bone mineral density unravels allelic heterogeneity at the RANKL locus and potential pleiotropic effects on bone. PLoS genetics. 2010;6(11):e1001217. doi: 10.1371/journal.pgen.1001217. [DOI] [PMC free article] [PubMed] [Google Scholar]
Associated Data
This section collects any data citations, data availability statements, or supplementary materials included in this article.