

Abstract
Abnormal red blood cell (RBC) deformability contributes to hemolysis, thrombophilia, inflammation, and microvascular occlusion in various circulatory diseases. A quantitative and objective assessment of microvascular occlusion mediated by RBCs with abnormal deformability would provide valuable insights into disease pathogenesis and therapeutic strategies. To that end, we present a new functional microfluidic assay, OcclusionChip, which mimics two key architectural features of the capillary bed in the circulatory system. First, the embedded micropillar arrays within the microchannel form gradient microcapillaries, from 20 μm down to 4 μm, which mimic microcapillary networks. These precisely engineered microcapillaries retain RBCs with impaired deformability, such that stiffer RBCs occlude the wider upstream microcapillaries, while less stiff RBCs occlude the finer downstream microcapillaries. Second, the micropillar arrays are coupled with two side passageways, which mimic the arteriovenous anastomoses that act as shunts in the capillary bed. These side microfluidic anastomoses prevent microchannel blockage, and enable versatility and testing of clinical blood samples at near-physiologic hematocrit levels. Further, we define a new generalizable parameter, Occlusion Index (OI), which is an indicative index of RBC deformability and the associated microcapillary occlusion. We demonstrate the promise of OcclusionChip in diverse pathophysiological scenarios that result in impaired RBC deformability, including mercury toxin, storage lesion, end-stage renal disease, malaria, and sickle cell disease (SCD). Hydroxyurea therapy improves RBC deformability and increases fetal hemoglobin (HbF%) in some, but not all, treated patients with SCD. HbF% greater than 8.6% has been shown to improve clinical outcomes in SCD. We show that OI associates with HbF% in 16 subjects with SCD. Subjects with higher HbF levels (HbF>8.6%) displayed significantly lower OI (0.88% ± 0.10%, N=6) compared with those with lower HbF levels (HbF≤8.6%) who had greater OI (3.18% ± 0.34%, N=10, p<0.001). Moreover, hypoxic OcclusionChip assay revealed a significant correlation between hypoxic OI and subject-specific sickle hemoglobin (HbS) level in SCD. OcclusionChip enables versatile in vitro assessment of microvascular occlusion mediated by RBCs in a wide range of clinical conditions. OI may serve as a new parameter to evaluate the efficacy of treatments improving RBC deformability, including hemoglobin modifying drugs, anti-sickling agents, and genetic therapies.
INTRODUCTION
Deformability of red blood cells (RBCs) is critical for continuous blood flow in the microcirculation1, 2. Healthy RBCs are highly deformable, allowing them to pass through minuscule blood vessels to facilitate oxygen delivery. However, in microcirculatory disorders associated with RBCs, such as in sickle cell disease (SCD) and in malaria, RBC deformability is pathologically altered. In SCD, abnormal RBC deformability is induced by intracellular polymerization of sickle hemoglobin (HbS) under deoxygenated conditions3. Impaired RBC deformability significantly contributes to the pathophysiological hallmarks of this disorder, including hemolysis, inflammation, microvascular occlusion, and consequent organ failures and stroke4, 5. In malaria, progressively diminished RBC deformability is caused by membrane-protein network modifications associated with maturing Plasmodium parasites6, 7. Unparasitized RBCs can also lose their deformability in severe malaria8. Thus, loss of RBC deformability has been associated with severe malaria9, 10. Consequently, there is a strong impetus to develop robust, functional in vitro RBC deformability assays for standardized and quantitative assessment of disease status and severity. However, sampling large quantities of RBCs in near physiological hematocrit levels is often a limiting factor in developing such assays, since the pathological cells often constitute a small fraction of the entire RBC population. Therefore, a large number of RBCs need to be tested simultaneously to acquire meaningful data, as we demonstrate here using OcclusionChip microfluidic system.
Conventional techniques developed for RBC deformability assessment can be divided into single cell techniques and bulk flow techniques. Single cell techniques, including atomic force microscopy11, micropipette aspiration12, 13, and optical tweezers14, 15, measure cell deformability individually. However, these techniques are typically skill-demanding and time-consuming, which require professional personnel or expensive facilities, and therefore are not capable of providing sufficient blood processing volume throughput to measure a subset of pathological RBCs over a large cell population. Bulk flow techniques, including micropore filtration16 and ektacytometry17, 18, measure the average deformability of bulk cells, but provide obscure information on subpopulations of diseased cells. Recent advancement in microfluidic technologies have yielded various methods for assessing RBC deformability, based on RBC stretching under shear flow19–21, capillary obstruction22, wedging in tempered constrictions23, 24, transit velocity or transit time through constrictions25, 26, as well as transit pressure through constrictions27–29. While all these methods greatly improved in vitro RBC deformability analysis, they remain relatively low-throughput in terms of processing volume, and have significant limitations in testing near-physiological hematocrit blood samples.
Microfluidic filtration has been used to sort cells based on deformability, and has been applied to separating circulating tumor cells from blood30, 31, and leukocytes from RBCs32. Studies have employed microspheres to mimic the mechanical filtration of poorly deformable RBCs by the human spleen33, 34. This method yielded retention rates for pathological RBCs, but provides indirect observation as they pass through the device. Other studies utilized polymer mechanical filtering units (micropillar arrays or capillary networks) achieved by soft lithography to mimic the capillary networks and to assess occlusive events induced by poorly deformable RBCs35–38. While these methods demonstrate improvements and they directly measure capillary obstruction, challenges remain around not being able to process samples at near physiologic hematocrit levels.
In the circulatory system, capillary blood vessel size is not uniform, on the contrary, it gradually changes from the arterioles to microcapillaries and to venules (Fig. 1A). Arteriovenous anastomoses are a critical part of the circulatory system providing alternate flow paths around capillary beds39, 40. Anastomotic passageways help regulate blood flow in the event of constrictions or blockages in smaller microcapillaries. Here, we present a new microfluidic design embodied in OcclusionChip (Fig. 1B), which mimics two key features of the capillary bed: a gradient of microcapillary networks in the form of micropillar arrays, and side passageways mimicking the arteriovenous anastomoses (Fig. 1C). The embedded micropillar arrays form a gradient of microcapillaries from 20 μm spacing down to 4 μm spacing along the flow direction. In this design, red blood cells (RBCs) with significantly impaired deformability are retained by upstream coarser micropillar arrays, while those with mildly impaired deformability are retained by finer downstream micropillar arrays. If the upstream micropillar arrays are fully occluded, blood cells can still flow around and into the downstream micropillar arrays through the anastomotic side passages (Fig. 1D). This design allows versatility and processing of near-physiological hematocrit level clinical blood samples and full utilization of the entire microcapillary domain. Leveraging such capabilities of OcclusionChip, we report RBC mediated microcapillary occlusion for a wide spectrum of conditions and disorders, including heavy metal toxin exposure (i.e., mercury), banked blood, and microcirculatory diseases, such as end stage renal disease, malaria, and SCD. We present the design, fabrication, and clinical testing of OcclusionChip for standardized assessment of RBC deformability and associated microvascular occlusion. We introduce a new generalizable parameter, ‘Occlusion Index’, which may serve as an in vitro benchmark of microvascular health, function, and may allow clinical assessment of treatments that target improving RBC deformability.
Figure 1. OcclusionChip design mimics the capillary bed with arteriovenous anastomoses.
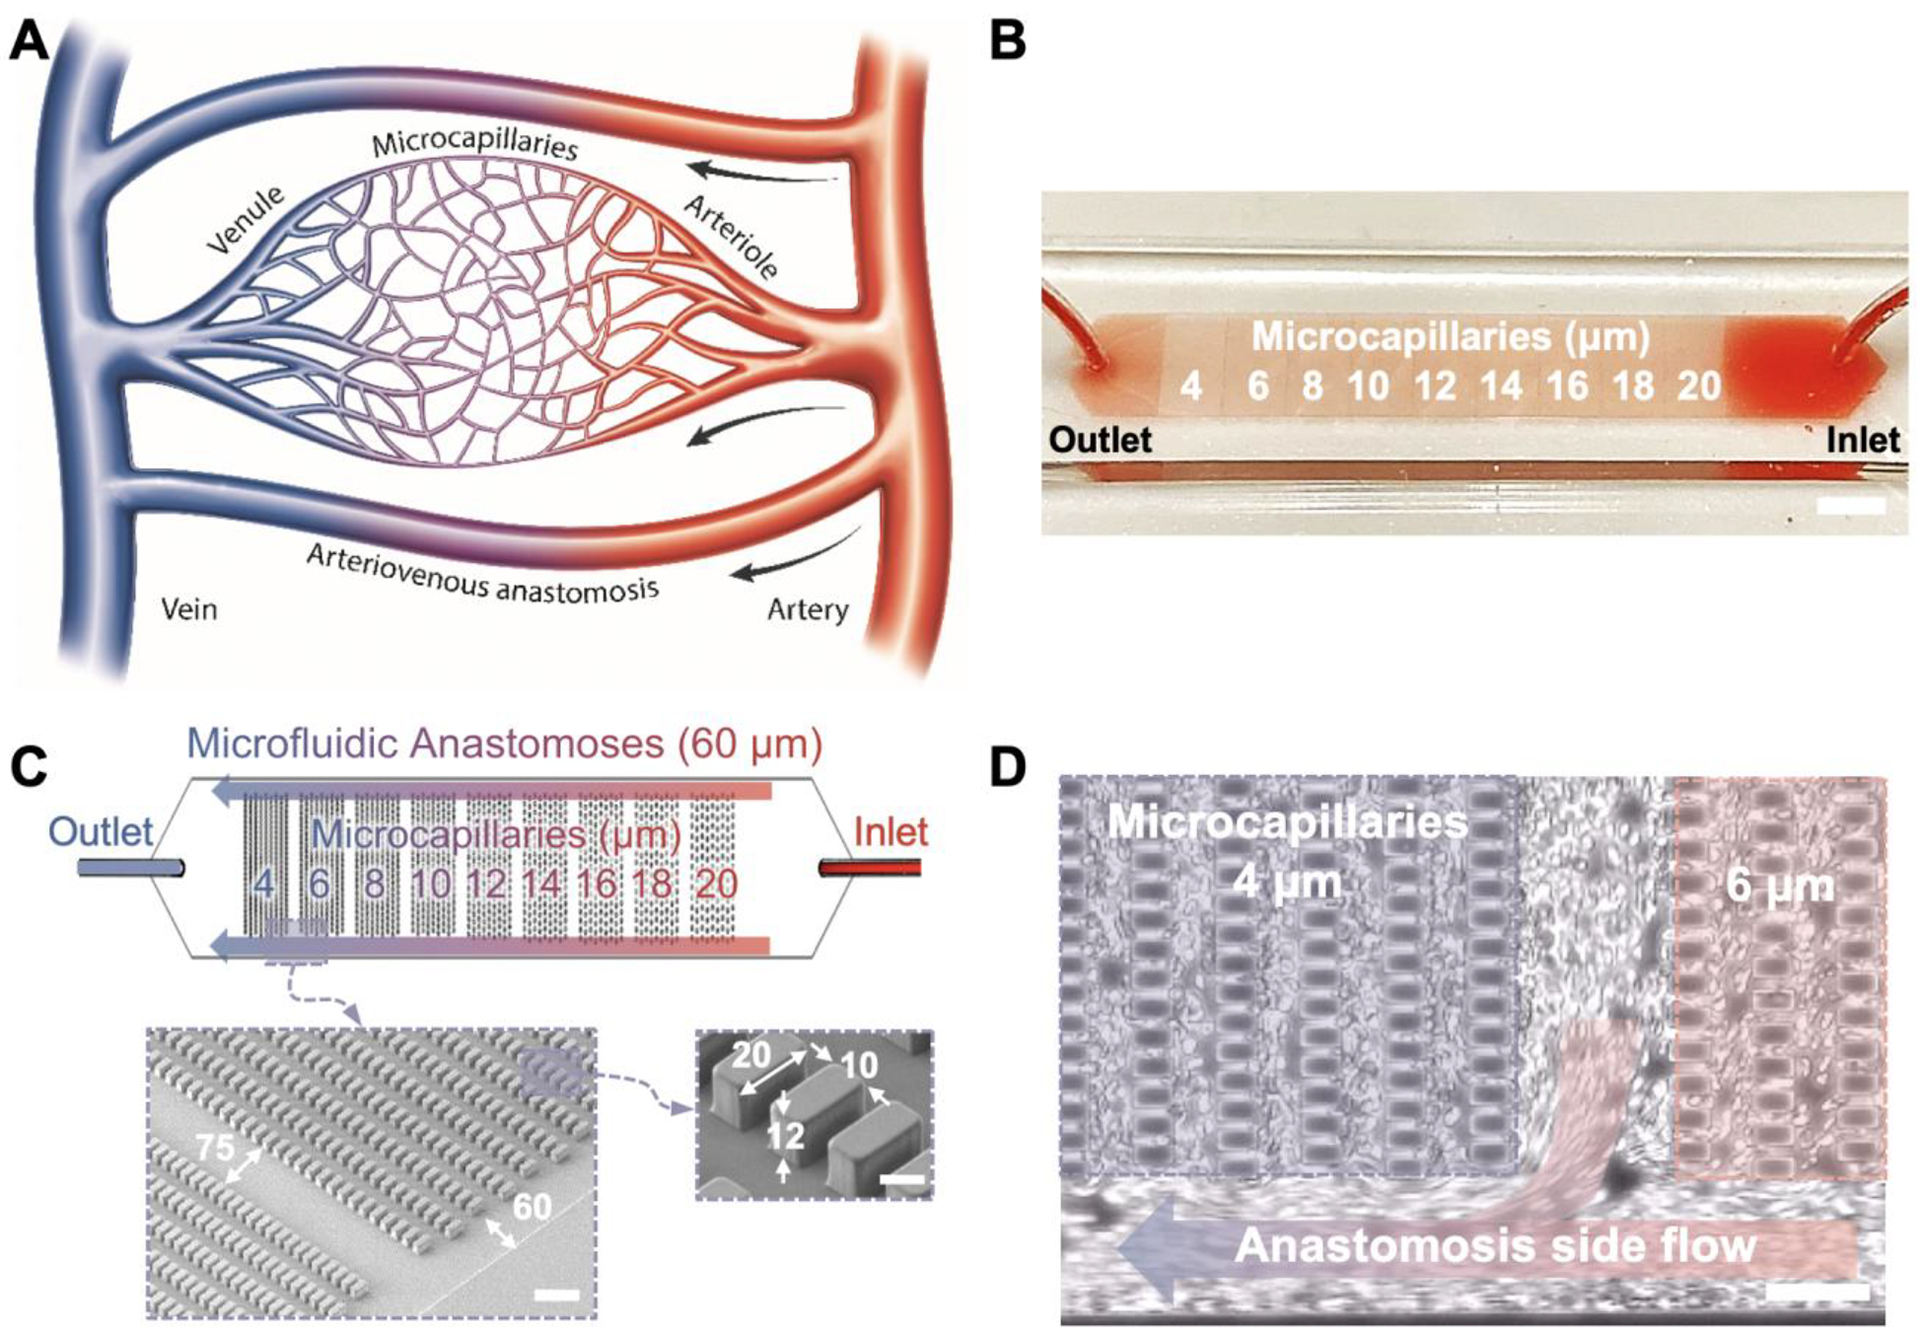
(A) A schematic representation of the human capillary bed consisting of arterioles, microcapillaries, venules and arteriovenous anastomoses. (B) Macro view of the OcclusionChip with a clinical blood sample at near physiological hematocrit flowing through the microchannel. Scale bar represents a length of 2 mm. (C) OcclusionChip design features nine micropillar arrays with openings ranging from 20 μm down to 4 μm, with anastomosis-mimicking side passages that are 60 μm wide. Inset: scanning electron microscopy images showing the organization of micropillar arrays and side microfluidic anastomosis, with dimensions in micrometers. Scale bars represent a length of 100 μm and 10 μm, respectively. (D) Anastomosis side flow takes place around occluded microcapillaries (i.e., 4 μm array in this panel). Scale bar represents a length of 50 μm.
RESULTS
OcclusionChip design and characterization
We have designed the OcclusionChip featuring embedded micropillar arrays forming uniform microcapillaries within each array and overall finer microcapillaries along the flow direction from 20 μm down to 4 μm, coupled with two 60-μm side passages. Microfluidic system design was based on the information available in the literature on human capillary bed and arteriovenous anastomoses39, 40. OcclusionChip mimics the narrow capillaries, small venules, and arteriovenous anastomoses in the human capillary bed (Fig. 1A&B). Characterization of the fabricated PDMS block with micropillar features were achieved by scanning electron microscopy, from which the geometry and dimension of the fabricated PDMS block with microcapillary dimensions were confirmed (Fig. 1C). Briefly, the fabricated PDMS micropillars are of 12-μm height, 20-μm length, and 10-μm width. Each micropillar array is 2-mm long and the distance between two successive micropillar arrays is 75 μm (Fig. 1C). Two 60-μm anastomosis-mimicking side passages were designed to prevent full blockade of the microfluidic channel (Fig. 1C&D). Testing of the micropillar retention mechanism and the function of anastomosis-mimicking side passages was achieved using glutaraldehyde-stiffened RBCs (Video S1). RBCs deform and pass through the microcapillaries where no occlusion presented. Such observation confirmed that the micropillar arrays served as a retention mechanism, which is critical for deformability assessment. Further, once severe microcapillary occlusion is induced in the near-inlet portion of the micropillar array (Fig. 1D and Video S1), local RBC flow is diverted to the nearest anastomotic passage such that full blockade of the microchannel is prevented. The flow environment was characterized via a 2-D numerical simulation performed by a commercially available FEA software package COMSOL 4.3 (Burlington, MA) with the assumption of Newtonian behavior41. The boundary conditions at the inlet and outlet were set to pressure inlet and pressure outlet respectively, where the RBC suspension was modeled with a dynamic viscosity and density of 0.001 Pa s and 993 kg/m3 42. The possible effects of fluid-structure interactions on the flow were neglected in the simulation by treating PDMS structures as rigid bodies. Typical velocity distributions are shown at the micropillar array (Fig. S1A), as is estimated maximum velocity and shear rate values across the microchannel (Fig. S1B).
Validation testing of OcclusionChip micropillar arrays with rigid fluorescent microbeads
The functional validation of the OcclusionChip was carried out using rigid fluorescent microbeads (Polysciences Inc., Warrington, PA) at 4, 6, or 10-μm diameter. Solutions containing fluorescent microbeads were prepared by mixing the microbead stock solution with BlockAid blocking solution (Thermo Fisher) at a ratio of 1:200 v/v. A visually clear line was observed by the blockage of the 10-μm microbeads at the beginning of the micropillar array with 8-μm gaps (Fig. S2A). The same field of view of all the three tests using the three different diameters of microbeads are shown, in which the microbeads were retained within gaps smaller than their outer diameter (Fig. S2B&C). This result further confirmed that the micropillar arrays served as a retention mechanism, which is essential to RBC deformability assessment.
Occlusion Index (OI) as a biomarker to assess RBC mediated microcapillary occlusion
To assess the overall RBC mediated microcapillary occlusion in specific samples, we defined a new generalizable parameter ‘Occlusion Index’ (OI) using the following equation,
| (1) |
Where
I = The No.of the capillary network (from the outlet)
c1 = The smallest capillary dimension
s = Step change of capillary dimension
n = Total number of capillary networks within the area of interest
Ni=Total number of capillaries formed in the ith capillary network
Oi=Total number of capillary occlusions induced in the ith capillary network
The OI represents percent occlusion of a microcapillary network, therefore it is generalizable, and can be applied to any microfluidic platform employing capillary networks to assess occlusions due to cellular blockage. We used a microfluidic model employing micropillar arrays assessing RBC deformability in three different scenarios, normal (HbAA) in normoxia (Fig. S3A), SCD (homozygous HbSS) in normoxia (Fig. S3B), and SCD (homozygous HbSS) in hypoxia (Fig. S3C), to demonstrate the generalization of OI. Detailed OI generalization is shown in Supplementary Materials.
OcclusionChip test repeatability
A manual syringe pump was adopted in the experimental process to provide constant pressure source, which significantly improved the cost efficiency of the OcclusionChip assay (Fig. S4A&B). To evaluate the repeatability of the experimental process, we tested one normal sample using RBCs from a healthy donor, and one glutaraldehyde-treated sample using RBCs from another healthy donor. Each sample was run four times, using four different OcclusionChip units, to assess the repeatability of testing. The deformability distribution was highly consistent, where the OIs for the normal sample were 0.19, 0.21, 0.23, and 0.21 (%) (mean ± standard error of the mean (SEM)=0.21% ± 0.01%), and the OIs for the glutaraldehyde-treated sample were 3.18, 3.66, 3.36, and 3.54 (%) (mean ± SEM=3.44% ± 0.11%). Together, these data show that the variation is minimal, and the test is repeatable.
Occlusion Index to assess chemically treated RBCs with glutaraldehyde, diamide, or mercuric ion
Glutaraldehyde, a non-specific protein cross-linker, and diamide, a thiol group oxidant inducing disulfide cross-linking of band 3, were used to stiffen RBCs in order to mimic impaired RBC deformability, seen in pathological conditions43, 44. Precisely controlled exposure of RBC to graded concentrations of glutaraldehyde or diamide was utilized to verify OcclusionChip functionality. RBCs from healthy donors exposed to graded concentrations, 0.00% (as control), 0.02%, 0.04%, and 0.08% (w/v), of glutaraldehyde were mixed with untreated normal RBCs to achieve 1% treated cells and were suspended in PBS at 20% hematocrit for microfluidic assessment. RBCs exposed to the same graded concentrations of diamide were directly suspended in PBS for microfluidic assessment. RBCs with impaired deformability were mostly retained at the 4-μm microcapillaries (Fig. 2A), with a smaller number retained at the 6, 8, and 10-μm microcapillaries (not shown). No appreciable occlusion was observed elsewhere. The retained RBCs were fluorescently labeled with anti-glycophorin A (CD235a, Abcam, Cambridge, MA) antibodies. Results obtained with RBCs from the same blood sample that was exposed to graded concentrations of glutaraldehyde are shown (Fig. 2B, control not shown). Of note, the distribution of retained RBCs within the channel revealed an important aspect of the microfluidic device: it generated distinct patterns in response to the heterogeneous RBC deformability that was induced by various concentrations of glutaraldehyde (Fig. 2C). At the end of the test, numbers of occlusions induced by poorly-deformable RBCs within each micropillar array were quantified (Fig. 2D–F). The number of occlusions induced by RBCs increased as the concentration of glutaraldehyde or diamide increased. The maximum difference in total occlusion level was observed with glutaraldehyde treatment at a concentration of 0.08% (w/v), where the rate of increase was more than 16-fold compared to the control. Further, we defined the area of interest as the 4-μm to 10-μm micropillar arrays to compute the OI to assess the overall RBC deformability of individual samples, since typical capillary dimension is 5–10 μm. Our results show that the OI generated by RBCs exposed to glutaraldehyde or diamide increased in a concentration dependent manner (glutaraldehyde: Fig. 2G, p<0.001, one-way ANOVA, mean ± SEM=0.31% ± 0.03% for control, 1.57% ± 0.25% for 0.02% glutaraldehyde, 2.17% ± 0.56% for 0.04% glutaraldehyde, 6.10% ± 0.74% for 0.08% glutaraldehyde, and diamide: Fig. 2H, p=0.01, one-way ANOVA, mean ± SEM=0.37% ± 0.07% for control, 0.42% ± 0.05% for 0.02% diamide, 0.58% ± 0.09% for 0.04% diamide, and 0.82% ± 0.11% for 0.08% diamide), which indicates that the defined OI reflect the deformability of the entire RBC population.
Figure 2. Assessment of microvascular occlusion mediated by chemically treated RBCs in the OcclusionChip.

(A) A bright field and EGFP overlay image showing microcapillary occlusions induced by poorly deformable RBCs. (B) (Top to bottom) Overview of retained RBCs stiffened by glutaraldehyde with the concentration of 0.02%, 0.04% and 0.08% (w/v) (control not shown) in the microfluidic device. Scale bars represent a length of 500 μm. Arrows indicate flow direction. Blue dash zones indicate each micropillar array. (C) Schematics of the patterns of the retained RBCs stiffened by graded glutaraldehyde. Profiles of occlusions within the four micropillar arrays generated by RBCs exposed to graded concentrations of (D) glutaraldehyde, (E) diamide, and (F) mercuric ion, and the accordingly computed Occlusion Index generated by RBCs exposed to graded concentrations of (G) glutaraldehyde, (H) diamide, and (I) mercuric ion are shown (N=4 in each group). Error bars represent standard error of the mean.
Mercury is a toxic heavy metal that binds to RBC membranes with high affinity and results in RBC hemolysis45, 46. Mercuric ions induce membrane conformational changes and impair RBC deformability47. In this study, we interrogated the effect of short-term exposure of mercuric ion on RBC deformability, at both low (5μM Hg2+) and high levels (50 μM Hg2+), as the range of the mercury level in vivo has been reported at 16,000 μg/L (58 μM) to 11 μg/L (0.055 μM) in blood48. Hg2+-exposed RBC samples were perfused through the OcclusionChip, and enhanced retention of poorly deformable RBCs was observed at the 4-μm microcapillaries for all Hg2+-treated samples (Fig. 2F), suggesting moderate impairment in RBC deformability following short-term mercuric ion exposure. The OI generated by Hg2+-exposed RBCs increased in a mercuric ion concentration dependent manner (Fig. 2I, p=0.007, Kruskal-Wallis, median ± SEM=0.29% ± 0.03% for control, 0.50% ± 0.08% for 5 μM, and 1.00% ± 0.15% for 50 μM mercury). Scanning electron microscopy results confirm that mercury induced morphologic changes in the RBCs, including the loss of the characteristic biconcave shape and the formation of spiked cell membrane (Fig. S5). Detailed sample processing for scanning electron microscopy is summarized in Supplementary Materials. Taken together, our results demonstrate that short-term mercuric ion exposure induces RBC morphology change and moderately reduces RBC deformability, which can be assessed using OcclusionChip.
Occlusion Index to assess impaired RBC deformability induced by Plasmodium falciparum infection, blood storage lesion, or end-stage renal disease
To demonstrate the versatility and clinical relevance of OcclusionChip, we tested RBCs from a stored blood unit, exposed to Plasmodium falciparum infection, from subjects with end-stage renal disease, or from healthy donors. Typical retained Hoechst-labeled Plasmodium falciparum-infected RBCs (pf-iRBCs) within the microchannel are shown (Fig. S6). We observed that the pf-iRBCs were preferentially retained by various sizes of microcapillaries, which generated a significantly higher level of OIs, compared to normal, non-infected RBCs (Fig. 3, N=5, malaria: mean ± SEM=4.09% ± 1.06%, and normal: N=5, 0.15% ± 0.03%, p=0.012, Mann-Whitney). In addition, the OI of one blood sample stored for up to 6 weeks were closely monitored, from which we observed the OI increased as the storage progressed, indicating the progressively decreased deformability of the stored RBCs (Fig. 3, mean=0.27% for fresh, 0.39% for week 1–2, 0.50% for week 3–4, and 0.55% for week 5–6). The progressively reduced deformability of stored RBCs is also reflected by the hemolysis level, glucose consumption, and lactate production (Fig. S7A–D). Furthermore, RBCs from hemodialyzed samples were assessed, from which we observed a small change of OI due to the retention of poorly deformable RBCs primarily within the 4-μm micropillar array, suggesting a moderate reduction of RBC deformability in subjects with end-stage renal disease. (Fig. 3, N=2, mean ± SEM=0.43% ± 0.01%).
Figure 3. Versatility of OcclusionChip revealed by the spectrum of Occlusion Indices (OIs) of RBCs from various pathological conditions.

These OIs were generated by abnormal RBCs in various conditions including non-specific protein cross-linking (Glutaraldehyde), cytoskeletal-specific stiffening (Diamide), heavy metal toxin (HgCl2), storage lesion, and circulatory diseases (renal failure or end-stage renal disease, malaria, sickle cell disease: SCD). Stars (*) at the top of the bars indicate statistically significant difference (*: p<0.05; **: p<0.01; *: p<0.001). These results indicate the versatility of OcclusionChip assay for a wide variety of clinical and pathological conditions that impact RBC deformability and function.
Occlusion Index to assess pathologically impaired RBC deformability in SCD
To further demonstrate the clinical and pathophysiological relevance of OcclusionChip, we assessed RBCs from 16 adult subjects with homozygous (HbSS) SCD (Fig. 3). The close-up view of microcapillaries in OcclusionChip show that, the occlusions of 4-μm microcapillaries were induced by a morphologically heterogeneous RBC population from subjects with SCD, including disc-shaped (indicated in orange zone), mildly sickled (indicated in rose zone), and highly sickled (indicated in red zone) cell morphologies within the same field of view (Fig. 4A). Notably, HbSS RBCs from subjects with SCD appeared to stagnate around the front surface of the micropillars due to the local flow environment (the dead zone showed in Fig. S1A). The numbers of occlusions induced by HbSS RBCs across the device were quantified (Fig. 4B). OI of HbSS RBCs from subjects with SCD was significantly higher compared to normal RBCs (HbAA) from healthy donors (Fig. 4C, HbSS: N=16, mean ± SEM=2.32% ± 0.36%, and HbAA: N=5, 0.15% ± 0.03%, p=0.001, Mann-Whitney).
Figure 4. Assessment of microvascular occlusion mediated by pathologically abnormal RBCs from subjects with SCD in the OcclusionChip.

(A) Representative fluorescent image of retained HbSS RBCs across the microfluidic device. Typical morphologies of retained HbSS RBCs within microcapillaries are shown in subsequent insets. Scale bar represents a length of 500 μm, 50 μm, and 10 μm, respectively. Arrow indicates flow direction. (B) Profiles of numbers of microcapillary occlusions induced by normal (HbAA) RBCs and SCD (HbSS) RBCs (5 HbAA and 16 HbSS) in each arrays. (C) The Occlusion Index (OI) of HbSS RBCs is significantly higher compared to that of HbAA RBCs (p=0.001, Mann-Whitney).
Occlusion Index associates with fetal hemoglobin level (HbF%) in subjects with SCD
HbF% level in blood has been shown to associate with clinical outcomes in SCD and it is inducible via Hydroxyurea therapy49, although the treatment response is heterogeneous among patients50, 51. HbF level greater than 8.6% has been considered as a clinically therapeutic threshold in SCD52. Therefore, we investigated the association between OI measured by OcclusionChip and the subject-specific HbF% in the 16 adult subjects with SCD (Fig. 5). We observed that subjects with higher HbF levels (>8.6%, N=6) had significantly lower OIs (Fig. 5A, N=6, mean ± SEM=0.88% ± 0.10%), compared to those with lower HbF levels (≤8.6%) who had significantly higher OIs (N=10, mean ± SEM=3.18% ± 0.34%) as measured by OcclusionChip (p<0.001, one-way ANOVA). Among the 11 subjects tested who were on Hydroxyurea therapy, 5 subjects had HbF% less than 8.6% and higher OI (Fig. 5B, red circles), while the other 6 subjects had HbF% greater than 8.6% and lower OIs (Fig. 5B, black circles). Subjects on Transfusion therapy had HbF% less than 8.6% as well as higher OIs (Fig. 5B, triangles) compared with subjects who were on Hydroxyurea with HbF greater than 8.6%.
Figure 5. Red blood cell mediated microcapillary occlusion in vitro and the resultant Occlusion Index (OI) associate with fetal hemoglobin level (HbF%) in subjects with sickle cell disease (SCD).

(A) HbF% has been shown to associate with improved clinical outcomes in SCD, where HbF>8.6% is considered as a therapeutic threshold. OI associates with blood HbF level in SCD, where subjects with higher HbF levels (HbF>8.6%) displayed significantly lower OIs (mean ± SEM = 0.88% ± 0.10%, N=6), compared with those with lower HbF levels (HbF≤8.6%) (mean ± SEM = 3.18% ± 0.34%, N=10, p<0.001, one-way ANOVA). Error bars represent standard error of the mean (SEM). (B) Hydroxyurea therapy is known to improve RBC deformability and to increase HbF% in some but not all patients with SCD. Among the 11 subjects tested who were on Hydroxyurea therapy (circles), 5 subjects presented lower HbF levels (HbF≤8.6%) and higher OIs (red circles), while the other 6 subjects presented higher HbF levels (HbF>8.6%) and lower OIs (black circles). All 5 subjects on Transfusion therapy displayed HbF levels less than 8.6% and higher OIs (red triangles) compared with subjects who were on Hydroxyurea with HbF greater than 8.6%. These results suggest that OI would be useful in assessing the clinical outcomes and treatment efficacy in SCD, along with other important clinical parameters, such as HbF%.
Hypoxic Occlusion Index associates with sickle hemoglobin level (HbS%) in subjects with SCD
Since hypoxia regulates hemoglobin desaturation and therefore the pathophysiological process in SCD, we created a deoxygenation system to couple OcclusionChip to study the behavior of RBCs in post-capillary networks in SCD (Fig. 6A). We utilized a custom gas exchanger to deoxygenate the blood flow developed in one of our previous studies (Fig. 6B), which desaturates hemoglobin in the sample to an approximate SpO2 of 83%53. We designed the custom gas exchange tubing and the gas exchange microchannel to stabilize the oxygen level within the microchannel as the gas permeability of PDMS was recognized (Fig. 6C). The detailed fabrication process is presented in Supplementary Materials. Validation of oxygen diffusion was performed by introducing an oxygen-sensitive luminescence probe tris (4,7-diphenyl-1,10-phenanthroline) ruthenium (II) dichloride complex (Santa Cruz Biotechnology, Dallas, TX) (1 mg/ml in PBS) into the microchannel (Fig. S8). Molecular oxygen can quench the luminescence of this probe; thus the dissolved oxygen level can be measured by the luminescent intensity54. In our experiment, a controlled gas flow (95% N2 plus 5% CO2) was allowed at 0 s and the luminescence was monitored under illumination at 488 nm. Gas exchange was completed at approximately 420 s as the luminescent intensity saturated (Fig. 6D).
Figure 6. Hypoxia-mediated HbS-carrying RBC sickling and microcapillary occlusion in the OcclusionChip.

(A) Macroscale view of the OcclusionChip integrated with the custom designed gas exchange tubing and the gas exchange microchannel. (B) Schematic of axisymmetric cross section of the gas exchange tubing showing oxygen diffusion. Arrows indicate the flow direction. (C) Schematic of the fabrication of the gas exchange microchannel. Cross-sectional view shows the oxygen level stabilization within the microchannel. (D) Normalized gray-level intensity measured near the outlet of the microchannel when a solution containing the oxygen-sensitive luminescence probe was flushed at 0 s. (E) Identification of hypoxia-mediated cell sickling of HbS-carrying RBCs from two frames of Video S2. (F) Scanning electron microscopy images showing hypoxia-enhanced microcapillary occlusion, which confirm that the deformability of HbS-carrying RBCs is mediated by hypoxia. (G) The Occlusion Index (OI) of HbS-carrying RBCs increased in response to hypoxia while that of HbAA RBCs remained hypoxia non-responsive. (H) Profiles of microcapillary occlusions induced by HbS-carrying RBCs within the microchannel under normoxic or hypoxic conditions. (I) A strong positive correlation (PCC=0.7636, p=0.046, N=7) was observed between the OI and the subject-specific HbS levels under hypoxia.
RBCs from 7 subjects with SCD (4 homozygous HbSS, and 3 compound-heterozygous HbSC subjects, all termed as HbS-carrying) and 3 healthy donors were tested under ambient or hypoxic conditions. Although it has been reported that the sickling of HbS-carrying RBCs depends on the blood oxygen level55, here we observed heterogeneous levels of cell sickling and changes in morphology under identical degrees of hypoxia (Fig. 6E and Video S2). As expected, HbAA RBCs showed no change in morphology under hypoxic conditions (not shown). We tested the effect of hypoxia on the OI of HbS-carrying RBCs and HbAA RBCs. The sample perfusion duration was decreased to 2 minutes in order to prevent saturation in hypoxic OcclusionChip. Our scanning electron microscopy results show that when oxygen level is reduced, HbS-carrying RBCs undergoing sickling were unable to pass through the microcapillaries, thereby inducing enhanced microchannel occlusion and resistance to blood flow (Fig. 6F). Detailed sample processing for scanning electron microscopy is summarized in Supplementary Materials. The OI was significantly greater in hypoxic sickle RBCs compared to sickle RBCs examined under ambient conditions. As expected, the OI of HbAA RBCs did not change under hypoxia (Fig. 6G, HbS-carrying RBCs: N=7, mean ± SEM=0.25% ± 0.03% vs 57.31% ± 4.79%, and HbAA: N=3, 0.05% ± 0.01% vs 0.05% ± 0.01% for normoxia vs. hypoxia). Profiles of occlusions induced by HbAA RBCs and HbS-carrying RBCs in hypoxic conditions are shown, from which full saturation of the 4-μm and 6-μm micropillar arrays were observed for all HbS-carrying RBC samples (Fig. 6H). A statistically significant correlation between the OI and HbS% of the subjects was observed (Fig. 6I, PCC=0.78, p=0.04, N=7). Of note, we observed recovery of sickled HbS-carrying RBCs (Video S3) as well as clearance of retained HbS-carrying RBCs within the microchannel (Video S4) by stopping the controlled gas flow, which demonstrates that the intracellular HbS polymerization and RBC sickling due to hypoxia is reversible, and OcclusionChip is capable of detecting this effect.
DISCUSSION
In OcclusionChip, embedded micropillar arrays are coupled with side passageways mimicking arteriovenous anastomoses in the capillary bed. Other capillary microfluidic systems that we are aware of lack these side passages around capillary openings56, 57. This design feature enables versatility for a wide variety of clinical and pathological conditions (Fig. 3), such that if the upstream micropillar arrays are blocked in a severe case, blood cells can still reach downstream arrays through the microfluidic anastomoses (Fig. 1D). OcclusionChip design allows processing of clinical blood samples near physiological hematocrit levels (20% hematocrit), while other microcapillary based microfluidic systems typically accommodate low hematocrit levels (e.g., 1% hematocrit in recent studies26, 58). Near-physiological hematocrit blood sample processing of OcclusionChip was vital for testing a wide variety of clinical blood samples presented in this work (Fig. 3). OcclusionChip design allows more than three orders of magnitude greater throughput in processing volume (3,000,000 cells per minute) compared to other microfluidic designs that we are aware of (e.g., 600 cells per minute in a recently published study58, or ~0.5 million cells per hour as reported in another microfluidic system29). Typical blood sample flow rate in OcclusionChip was measured to be approximately 1.5 μL/minute at near-physiological (20%) hematocrit level, which translates to processing of 3,000,000 cells per minute (with estimated 2 million cells/μL of blood at 20% hematocrit59). OcclusionChip design enables a wide dynamic OI range. Previous microfluidic systems utilized single size constrictions by design, and therefore, if the constrictions are too large or too small, the system is not sufficiently sensitive to interrogate cells with mildly or severely compromised deformability. For example, if the constrictions are too narrow, such systems are swiftly saturated by cells with severely compromised deformability, which significantly reduces the dynamic detection range. In OcclusionChip, stiff RBCs are retained by upstream, coarser micropillar arrays, while those less stiff flow through the side anastomoses and are interrogated and/or retained by finer downstream micropillar arrays. These characteristics contribute to the wide dynamic range of OI measurement of OcclusionChip.
To verify the retention mechanism and demonstrate the physiological relevance of the OcclusionChip, we utilized precisely controlled exposure of normal RBCs to glutaraldehyde or diamide, which are widely used to verify new RBC deformability measurement techniques. We further interrogated abnormal RBC deformability that is induced by exposure to mercuric ion. We found that short-term mercuric ion exposure altered RBC deformability in a concentration dependent manner (Fig. 2I, Fig. 3), which is in accordance with early in vitro studies on the hemolytic effect of inorganic mercuric ion on RBCs compromising membrane fragility and cell deformability47, 60.
Envisioning a universal RBC deformability assessment tool for all circulatory diseases, we further used the OI to assess the abnormal deformability of in vitro malaria-infected RBCs, and RBCs from patients with end-stage renal disease (Fig. 3). Early ex vivo studies have revealed the impaired deformability of malaria infected RBCs, which is stage dependent, decreasing as intra-erythrocytic parasites mature33, 61, 62. In full agreement with this, we observed enhanced occlusions within multiple micropillar arrays induced by malaria infected RBCs, with a markedly increased OI compared to normal RBCs (Fig. 3, Fig. S6B). It has been shown that RBC lifetime is significantly reduced in patients with end-stage renal disease due to uremic toxins, mechanical and osmotic trauma63, 64. Lipidic and phospholipidic compositions on cell membrane are significantly altered65 in these patients. However, it is still not clear why the uremic state leads to impaired RBC deformability and reduced lifetime in circulation66. Previous studies using membrane filters demonstrated that RBCs from patients with end-stage renal disease required more time to pass through and thus they were less deformable compared to normal RBCs67–69. In full agreement, we observed that RBCs from subjects on hemodialysis presented mildly elevated OIs, suggesting that RBCs from individuals with end-stage renal disease display mildly impaired deformability.
SCD is one of the common inherited blood disorders worldwide, which results in abnormal intracellular hemoglobin polymerization and reduced RBC deformability70, 71. As expected, RBCs from subjects with homozygous SCD (HbSS) resulted in significantly greater OIs compared with RBCs from healthy donors (HbAA) (Fig. 4C). Assessing RBC deformability is of great importance in SCD, since earlier studies revealed a significant association between the incidence of microcirculatory vaso-occlusive events and impaired cellular deformability72, 73. Hydroxyurea therapy is a widely utilized Food and Drug Administration (FDA)-approved, pharmaceutical treatment for SCD, which stimulates HbF production, reducing sickling and improving RBC deformability49, 74. Hydroxyurea increases blood HbF% in some, but not all, treated patients with SCD50, 51, hence close monitoring of clinical outcomes is essential75. It has been reported that high levels of HbF (>8.6%) associates with improved clinical outcomes and survival in SCD52. In line with these findings, we observed that OI associates with HbF% in subjects with SCD (Fig. 5A). Furthermore, subjects with higher HbF levels (>8.6%) displayed significantly lower RBC mediated microcapillary occlusion in vitro as indicated by lower OIs (Fig. 5B) compared to those with lower HbF levels (≤8.6%). Importantly, among the SCD subjects tested, 5 out of 11 subjects who were on Hydroxyurea therapy, displayed HbF levels lower than 8.6% and higher OIs (Fig. 5B). The remaining 6 subjects on Hydroxyurea displayed HbF levels greater than 8.6% and lower OIs (Fig. 5B). These findings suggest that OcclusionChip and OI may serve as an in vitro therapeutic benchmark in SCD to help identify subjects who may not sufficiently respond to Hydroxyurea with an increased HbF% to a therapeutically effective level. Taken together, the presented OcclusionChip platform, together with other clinical laboratory tests, would be clinically useful in assessing RBC associated microvascular occlusion in SCD.
Recent studies showed that RBCs become less deformable after storage76–78. In accordance, our results indicated that during the 6-week storage period, the OI of the stored RBCs increased modestly over time (Fig. 3). Transfusion therapy is one of the main treatments utilized in SCD, in which stored RBCs from healthy donors are exchanged with patient’s own RBCs to lower the sickle RBC fraction in the circulatory system. The quality of the stored blood units may significantly impact the clinical outcomes of transfusion therapy, especially in anemic hematological disorders such as SCD79. A quantitative assessment of RBC mediated microcapillary occlusion, as described here, would ensure additional quality control for stored blood. Improved quality control in transfusion medicine may considerably enhance outcomes by reducing the frequency of needed transfusions and thereby alleviating the incidence of transfusion-related complications, such as allergic reaction, infection, iron overload, and transfusion-related acute lung injury80–83. Our previous studies showed that subjects with SCD who are on transfusion therapy present significantly higher RBC adhesion to heme-activated endothelium compared to subjects with SCD who are not on transfusion therapy84. Results presented here suggest that HbF level stays less than 8.6% (as expected), while OI remains higher in 5 subjects with SCD compared with subjects on Hydroxyurea therapy with HbF% greater than 8.6% (Fig. 5B).
Hypoxia and hemoglobin desaturation play an essential role in regulating pathophysiological processes in SCD85, 86. Hypoxia induces intracellular polymerization of sickle hemoglobin, sickling of RBCs, and impairment of RBC deformability and adhesiveness87. Therefore, a functional in vitro assay for RBC deformability and microcapillary occlusion under hypoxia may significantly benefit the development and assessment of novel therapeutic strategies that directly target the hemoglobin content of the RBCs, such as anti-sickling drugs and genetic therapies in SCD88–90. To that end, we coupled the OcclusionChip assay with hypoxia control, and assessed RBC mediated microcapillary occlusion under hypoxia in subjects with SCD (Fig. 6A–F). Using hypoxic OcclusionChip assay we revealed a significant association between RBC mediated microcapillary occlusion in vitro (Fig. 6G&H), the resulting hypoxic OI, and the subject-specific HbS levels in SCD (Fig. 6I, Pearson Correlation Coefficient: 0.78, p: 0.04). The finding suggests that hypoxic OI would be essentially helpful in assessing therapies that target sickle hemoglobin polymerization to improve RBC deformability90, 91 or genetic therapies that aim at reducing the sickle hemoglobin content in blood along with improving RBC qualities in hemoglobin disorders89, 92, 93. For example, Aes-103 (5-hydroxymethylfurfural) is a putative anti-sickling agent that is in clinical trials for potential treatment of SCD94, and therefore we would expect to observe a difference in terms of OI when testing sickle RBCs before and after Aes-103 treatment under hypoxia. On the other hand, a recent study reported that after receiving gene therapy, the fraction of sickle RBCs under hypoxia significantly decreased92. Consequently, the OI of RBCs from individuals with SCD measured under hypoxia is expected to drop after receiving gene therapy, which could be considered as a functional assessment of the therapy outcome.
In conclusion, we present a functional microfluidic assay, the OcclusionChip, for assessing microvascular occlusion mediated by RBCs. The significant aspects of this functional assay are anastomosis-mimicking side passageways, the ability to process clinical blood samples at near-physiologic hematocrit, and the versatility of the assay for its potential use in various clinical conditions and diseases. We validated the OcclusionChip assay initially by testing control samples and glutaraldehyde or diamide-treated RBCs. Clinical relevance and versatility of the assay was demonstrated by testing toxic mercuric ion-exposed RBCs, stored blood, subjects with end-stage renal disease, malaria-infected RBCs, and subjects with SCD. Importantly, in subjects with SCD, we show that the OI, an indicative index of RBC mediated microcapillary occlusion, associates with subject’s blood HbF% in a clinically meaningful way. Moreover, hypoxic OcclusionChip assay helped us reveal a significant correlation between hypoxic OI and subject-specific HbS% in SCD. Taken together, these findings suggest that OcclusionChip functional microfluidic assay and the OI can be utilized for quantitative assessment of microvascular occlusion mediated by RBCs. OcclusionChip and OI would be applicable to a wide range of clinical conditions and in assessment of novel targeted and curative therapies that improve RBC quality, such as anti-sickling drugs and gene therapies in SCD.
MATERIALS AND METHODS
OcclusionChip fabrication and assembly
The OcclusionChip was fabricated based on standard lithography techniques (Fig. S9). A negative template on a 3-inch silicon wafer (University Wafers, Boston, MA) was initially fabricated through photolithography. Briefly, a layer of negative photoresist SU8–2010 (Thermo Fisher Scientific, Waltham, MA) was spin-coated on the wafer at a thickness of 12 μm. After being soft-baked at 95°C for 4 min, the wafer was exposed to UV light with alignment to selectively cure the photoresist. Following the post-exposure bake, in which the wafer was baked in the same condition as soft-bake, the wafer was developed in a photoresist solvent propylene glycol monomethyl ether acetate (PGMEA, Sigma Aldrich, St. Louis, MO), and hard-baked at 110°C overnight. A 2-hour surface passivation using trichloro (1H, 1H, 2H, 2H-perfluorooctyl) saline (Sigma Aldrich, St. Louis, MO) was performed under vacuum to facilitate the separation of the molded polymer from the master wafer. Next, a polydimethylsiloxane (PDMS, Thermo Fisher Scientific, Waltham, MA) pre-polymer was mixed with the curing agent at a ratio of 10:1 (v/v) and degassed in a desiccator to remove any air bubbles. The mixture was poured over the master wafer and cured at 80 °C overnight. Two 0.5 mm-diameter holes were punched as the inlet and the outlet after the PDMS block was separated from the master wafer. Excessive saline was removed by sonicating with isopropanol for 5 min. Tubing was assembled after the PDMS block was bonded to a microscope glass slide (Microscopy Sciences) through surface modification under oxygen-plasma treatment. The fabricated microchannel was rinsed in 100% ethanol and phosphate-buffered saline (PBS), and incubated with 2% bovine serum albumin (BSA, ProSpec-Tany TechnoGene Ltd, East Brunswick, NJ). Prior to introducing blood samples, the microchannel was rinsed with PBS to remove excessive BSA.
Blood sample collection and preparation
All experiments were performed in accordance with the study protocol approved by the Institutional Review Board (IRB) committee at University Hospitals Cleveland Medical Center (IRB 05-14-07C). Study participants were fully informed regarding the purposes of the study and consent was obtained. Blood samples from healthy donors (HbAA) and SCD subjects (homozygous HbSS and heterozygous HbSC) were anticoagulated with ethylenediaminetetraacetic acid (EDTA) and stored at 4°C. Healthy RBCs were treated with glutaraldehyde, Diamide, and mercuric ion according to protocols detailed in Supplementary Materials. Pf-iRBCs were cultured at 4% hematocrit under standard conditions in RPMI 1640 according to published protocols95. Parasitized RBCs were labeled with Hoechst 33342 for 30 minutes in room temperature. The mean parasitemia of the five malaria samples tested was 4.55 ± 0.29 % (± SEM). Stored blood samples were obtained from Hemanext (Avon, MA). Briefly, packed RBCs were prepared from whole blood anticoagulated with citrate-phosphate-double dextrose (CP2D) anticoagulant after centrifugation and removal of the plasma. The RBCs were re-suspended in AS3 red cell storage solution and stored in a conventional storage bag for 42 days at 4°C. A total of seven blood samples were tested over a six-week period. These samples were shipped to us individually over time, which originated from the same unit of stored blood. Lactate production and glucose consumption were analyzed to determine the metabolic activities of the stored RBCs. Hemolysis levels were well below FDA guidelines of 1%, maximum allowable limit for red cell product for transfusion. Blood samples from patients on hemodialysis were obtained from the clinics at University Hospitals, with IRB approval. HbF% and HbS% levels in whole blood samples were determined using HPLC (VARIANT™ II, Bio-Rad Laboratories, Inc., Hercules, California).
Microfluidic assessment of blood samples
Whole blood samples were centrifuged at 500 × g for 5 min at 4°C, plasma was removed, and the RBCs were washed twice in PBS, and re-suspended at a 20% hematocrit value. The OcclusionChip was placed on an Olympus IX83 inverted motorized microscope stage for high-resolution imaging. The RBC samples were perfused through the microchannel under constant pressure for 20 min. Non-retained RBCs were rinsed away by injecting PBS into the microchannel under the same pressure. Negligible contamination by platelets and white blood cells was observed by visual inspection. Phase contrast, bright field, and fluorescent images were recorded at 20X using the Olympus Cell Sense live imaging software (excitation/emission wavelength, 488/505–580 for Green Fluorescent Protein, GFP). Recorded images were post-processed using Adobe Photoshop (San Jose, CA), and the number of occlusions in each micropillar array was counted manually. When a microcapillary formed by two neighbored micropillars was obstructed by an RBC, it was counted as one occlusion. Typically, it takes less than 1 hour to complete the microfluidic processing, imaging, and image analysis for testing one clinical blood sample. Oxygen tension was controlled in hypoxia experiments using a custom designed gas exchange setup as described in Supplementary Materials. Scanning electron microscopy was performed on the micropillars and RBCs as described in Supplementary Materials. OcclusionChip microfluidic system was designed to be single use and disposable, to prevent any cross-contamination between the samples tested. Each data point in this manuscript was generated with a single use OcclusionChip.
Statistical analyses
The data are reported as mean ± SEM in this study. A test of normality was performed. One-way ANOVA was used for normally distributed data with Tukey’s post hoc analysis for more than two groups. Non-parametric Mann-Whitney U-test or Kruskal-Wallis H tests with Dunn’s post hoc analysis for comparing more than two groups for non-normally distributed data. Statistical significance was defined with p-value less than 0.05 (p < 0.05). Statistical analyses were performed using Minitab 19 (Minitab, Inc., State College, PA) and Matlab (Mathworks, MA, USA).
Supplementary Material
SIGNIFICANCE OF THE WORK.
Here, we present OcclusionChip, a standardized microfluidic approach to assess microvascular occlusion mediated by red blood cells, which may serve as a clinical benchmark of microcirculatory health and function in a wide range of pathological and clinical conditions. OcclusionChip microfluidic design embodies the two key features of the capillary bed: a gradient of microcapillary networks and side passageways mimicking the arteriovenous anastomoses.
ACKNOWLEDGMENTS
The authors greatly thank Grace Gongaware from Cleveland Institute of Art for crafting the scientific illustration. The authors also acknowledge Dr. Thomas Hostetter for providing blood samples from hemodialysis patients, and Dr. Samuel Coker from Hemanext for providing the stored blood samples. The authors acknowledge with gratitude the contributions of patients and clinicians at Seidman Cancer Center (University Hospitals, Cleveland). UAG would like to thank the Case Western Reserve University, University Center for Innovation in Teaching and Education (UCITE) for the Glennan Fellowship, which supports the scientific art program and the art student internship in CASE-BML.
FUNDING
This work was supported by National Science Foundation (NSF) CAREER Award 1552782, National Heart, Lung, and Blood Institute (NHLBI) R01HL133574, OT2HL152643, U01HL117659, and T32HL134622.
Footnotes
CONFLICT OF INTERESTS
The authors declare no conflict interest.
REFERENCES
- 1.Mohandas N and Gallagher PG, Blood, 2008, 112, 3939–3948. [DOI] [PMC free article] [PubMed] [Google Scholar]
- 2.Chien S, Microvascular research, 1985, 29, 129–151. [DOI] [PubMed] [Google Scholar]
- 3.Rees DC, Williams TN and Gladwin MT, Lancet, 2010, 376, 2018–2031. [DOI] [PubMed] [Google Scholar]
- 4.Barabino GA, Platt MO and Kaul DK, Annual review of biomedical engineering, 2010, 12, 345–367. [DOI] [PubMed] [Google Scholar]
- 5.Alapan Y, Fraiwan A, Kucukal E, Hasan MN, Ung R, Kim M, Odame I, Little JA and Gurkan UA, Expert review of medical devices, 2016, 13, 1073–1093. [DOI] [PMC free article] [PubMed] [Google Scholar]
- 6.Moxon CA, Grau GE and Craig AG, British journal of haematology, 2011, 154, 670–679. [DOI] [PMC free article] [PubMed] [Google Scholar]
- 7.Dondorp AM, Pongponratn E and White NJ, Acta tropica, 2004, 89, 309–317. [DOI] [PubMed] [Google Scholar]
- 8.Dondorp AM, Angus BJ, Hardeman MR, Chotivanich KT, Silamut K, Ruangveerayuth R, Kager PA, White NJ and Vreeken J, Am J Trop Med Hyg, 1997, 57, 507–511. [DOI] [PubMed] [Google Scholar]
- 9.Moxon CA, Grau GE and Craig AG, British journal of haematology, 2011, 154, 670–679. [DOI] [PMC free article] [PubMed] [Google Scholar]
- 10.Rey J, Buffet PA, Ciceron L, Milon G, Mercereau-Puijalon O and Safeukui I, Sci Rep, 2014, 4, 3767–3767. [DOI] [PMC free article] [PubMed] [Google Scholar]
- 11.Dulinska I, Targosz M, Strojny W, Lekka M, Czuba P, Balwierz W and Szymonski M, Journal of biochemical and biophysical methods, 2006, 66, 1–11. [DOI] [PubMed] [Google Scholar]
- 12.Hochmuth RM, Journal of biomechanics, 2000, 33, 15–22. [DOI] [PubMed] [Google Scholar]
- 13.Hebbel RP, Leung A and Mohandas N, Blood, 1990, 76, 1015–1020. [PubMed] [Google Scholar]
- 14.Dao M, Lim CT and Suresh S, J Mech Phys Solids, 2003, 51, 2259–2280. [Google Scholar]
- 15.Henon S, Lenormand G, Richert A and Gallet F, Biophys J, 1999, 76, 1145–1151. [DOI] [PMC free article] [PubMed] [Google Scholar]
- 16.Reid HL, Barnes AJ, Lock PJ, Dormandy JA and Dormandy TL, Journal of clinical pathology, 1976, 29, 855–858. [DOI] [PMC free article] [PubMed] [Google Scholar]
- 17.Parrow NL, Violet PC, Tu H, Nichols J, Pittman CA, Fitzhugh C, Fleming RE, Mohandas N, Tisdale JF and Levine M, Journal of visualized experiments : JoVE, 2018, DOI: 10.3791/56910. [DOI] [PMC free article] [PubMed] [Google Scholar]
- 18.Baskurt OK, Hardeman MR, Uyuklu M, Ulker P, Cengiz M, Nemeth N, Shin S, Alexy T and Meiselman HJ, Biorheology, 2009, 46, 251–264. [DOI] [PubMed] [Google Scholar]
- 19.Zheng Y, Cachia MA, Ge J, Xu ZS, Wang C and Sun Y, Lab Chip, 2015, 15, 3138–3146. [DOI] [PubMed] [Google Scholar]
- 20.Katsumoto Y, Tatsumi K, Doi T and Nakabe K, Int J Heat Fluid Fl, 2010, 31, 985–995. [Google Scholar]
- 21.Zheng Y, Nguyen J, Wang C and Sun Y, Lab Chip, 2013, 13, 3275–3283. [DOI] [PubMed] [Google Scholar]
- 22.Shelby JP, White J, Ganesan K, Rathod PK and Chiu DT, P Natl Acad Sci USA, 2003, 100, 14618–14622. [DOI] [PMC free article] [PubMed] [Google Scholar]
- 23.Santoso AT, Deng XY, Lee JH, Matthews K, Duffy SP, Islamzada E, McFaul SM, Myrand-Lapierre ME and Ma HS, Lab Chip, 2015, 15, 4451–4460. [DOI] [PubMed] [Google Scholar]
- 24.Lizarralde Iragorri MA, El Hoss S, Brousse V, Lefevre SD, Dussiot M, Xu T, Ferreira AR, Lamarre Y, Silva Pinto AC, Kashima S, Lapoumeroulie C, Covas DT, Le Van Kim C, Colin Y, Elion J, Francais O, Le Pioufle B and El Nemer W, Lab Chip, 2018, 18, 2975–2984. [DOI] [PubMed] [Google Scholar]
- 25.Adamo A, Sharei A, Adamo L, Lee B, Mao S and Jensen KF, Anal Chem, 2012, 84, 6438–6443. [DOI] [PMC free article] [PubMed] [Google Scholar]
- 26.Sosa JM, Nielsen ND, Vignes SM, Chen TG and Shevkoplyas SS, Clin Hemorheol Micro, 2014, 57, 275–289. [DOI] [PMC free article] [PubMed] [Google Scholar]
- 27.Guo Q, Reiling SJ, Rohrbach P and Ma HS, Lab Chip, 2012, 12, 1143–1150. [DOI] [PubMed] [Google Scholar]
- 28.Myrand-Lapierre ME, Deng XY, Ang RR, Matthews K, Santoso AT and Ma HS, Lab Chip, 2015, 15, 159–167. [DOI] [PubMed] [Google Scholar]
- 29.Guo Q, Duffy SP, Matthews K, Deng X, Santoso AT, Islamzada E and Ma H, Lab Chip, 2016, 16, 645–654. [DOI] [PubMed] [Google Scholar]
- 30.Qin X, Park S, Duffy SP, Matthews K, Ang RR, Todenhofer T, Abdi H, Azad A, Bazov J, Chi KN, Black PC and Ma HS, Lab Chip, 2015, 15, 2278–2286. [DOI] [PubMed] [Google Scholar]
- 31.Vona G, Sabile A, Louha M, Sitruk V, Romana S, Schutze K, Capron F, Franco D, Pazzagli M, Vekemans M, Lacour B, Brechot C and Paterlini-Brechot P, Am J Pathol, 2000, 156, 57–63. [DOI] [PMC free article] [PubMed] [Google Scholar]
- 32.Guo Q, Duffy SP, Matthews K, Islamzada E and Ma HS, Sci Rep, 2017, 7. [DOI] [PMC free article] [PubMed] [Google Scholar]
- 33.Deplaine G, Safeukui I, Jeddi F, Lacoste F, Brousse V, Perrot S, Biligui S, Guillotte M, Guitton C, Dokmak S, Aussilhou B, Sauvanet A, Hatem DC, Paye F, Thellier M, Mazier D, Milon G, Mohandas N, Mercereau-Puijalon O, David PH and Buffet PA, Blood, 2011, 117, E88–E95. [DOI] [PMC free article] [PubMed] [Google Scholar]
- 34.Diakite SAS, Ndour PA, Brousse V, Gay F, Roussel C, Biligui S, Dussiot M, Prendki V, Lopera-Mesa TM, Traore K, Konate D, Doumbia S, Cros J, Dokmak S, Fairhurst RM, Diakite M and Buffet PA, Malaria J, 2016, 15. [DOI] [PMC free article] [PubMed] [Google Scholar]
- 35.Picot J, Ndour PA, Lefevre SD, El Nemer W, Tawfik H, Galimand J, Da Costa L, Ribeil JA, de Montalembert M, Brousse V, Le Pioufle B, Buffet P, Le Van Kim C and Francais O, American journal of hematology, 2015, 90, 339–345. [DOI] [PubMed] [Google Scholar]
- 36.Du E, Diez-Silva M, Kato GJ, Dao M and Suresh S, P Natl Acad Sci USA, 2015, 112, 1422–1427. [DOI] [PMC free article] [PubMed] [Google Scholar]
- 37.Ciciliano JC, Abbaspour R, Woodall J, Wu C, Bakir MS and Lam WA, Lab Chip, 2017, DOI: 10.1039/c7lc00720e. [DOI] [PubMed] [Google Scholar]
- 38.Shevkoplyas SS, Yoshida T, Gifford SC and Bitensky MW, Lab Chip, 2006, 6, 914–920. [DOI] [PubMed] [Google Scholar]
- 39.Hudetz AG, Microcirculation, 1997, 4, 233–252. [DOI] [PubMed] [Google Scholar]
- 40.Delaney JP, Am J Physiol, 1969, 216, 1556–1561. [DOI] [PubMed] [Google Scholar]
- 41.Baaijens JPW, Vansteenhoven AA and Janssen JD, Biorheology, 1993, 30, 63–74. [PubMed] [Google Scholar]
- 42.Kucukal E, Little JA and Gurkan UA, Integr Biol-Uk, 2018, 10, 194–206. [DOI] [PMC free article] [PubMed] [Google Scholar]
- 43.Forsyth AM, Wan JD, Ristenpart WD and Stone HA, Microvascular research, 2010, 80, 37–43. [DOI] [PubMed] [Google Scholar]
- 44.Pantaleo A, Ferru E, Giribaldi G, Mannu F, Carta F, Matte A, De Franceschi L and Turrini F, Biochem J, 2009, 418, 359–367. [DOI] [PubMed] [Google Scholar]
- 45.Zolla L, Lupidi G, Bellelli A and Amiconi G, Biochimica et biophysica acta, 1997, 1328, 273–280. [DOI] [PubMed] [Google Scholar]
- 46.Zolla L, Lupidi G and Amiconi G, Toxicology in vitro : an international journal published in association with BIBRA, 1994, 8, 483–490. [DOI] [PubMed] [Google Scholar]
- 47.Mel HC and Reed TA, Cell Biophys, 1981, 3, 233–250. [DOI] [PubMed] [Google Scholar]
- 48.Nuttall KL, Ann Clin Lab Sci, 2004, 34, 235–250. [PubMed] [Google Scholar]
- 49.Charache S, Terrin ML, Moore RD, Dover GJ, Barton FB, Eckert SV, McMahon RP and Bonds DR, The New England journal of medicine, 1995, 332, 1317–1322. [DOI] [PubMed] [Google Scholar]
- 50.Steinberg MH, Br J Haematol, 2005, 129, 465–481. [DOI] [PubMed] [Google Scholar]
- 51.Chand AR, Xu H, Wells LG, Clair B, Neunert C, Spellman AE, Clay LJ, Natrajan K and Kutlar A, Journal, 2014. [Google Scholar]
- 52.Platt OS, Brambilla DJ, Rosse WF, Milner PF, Castro O, Steinberg MH and Klug PP, The New England journal of medicine, 1994, 330, 1639–1644. [DOI] [PubMed] [Google Scholar]
- 53.Kim M, Alapan Y, Adhikari A, Little JA and Gurkan UA, Microcirculation, 2017, 24. [DOI] [PMC free article] [PubMed] [Google Scholar]
- 54.Hartmann P, Leiner MJ and Lippitsch ME, Anal Chem, 1995, 67, 88–93. [Google Scholar]
- 55.Kaul DK and Xue H, Blood, 1991, 77, 1353–1361. [PubMed] [Google Scholar]
- 56.Kim J, Lee H and Shin S, Journal of Cellular Biotechnology, 2015, 1, 63–79. [Google Scholar]
- 57.Tomaiuolo G and Guido S, J Vasc Res, 2015, 52, 15–15. [Google Scholar]
- 58.Islamzada E, Matthews K, Guo Q, Santoso AT, Duffy SP, Scott MD and Ma H, Lab Chip, 2019, DOI: 10.1039/c9lc01058k. [DOI] [PubMed] [Google Scholar]
- 59.Judy HE and Price NB, Journal of the American Medical Association, 1958, 167, 563–566. [DOI] [PubMed] [Google Scholar]
- 60.Kerek E, Hassanin M and Prenner EJ, Bba-Biomembranes, 2018, 1860, 710–717. [DOI] [PubMed] [Google Scholar]
- 61.Safeukui I, Correas JM, Brousse V, Hirt D, Deplaine G, Mule S, Lesurtel M, Goasguen N, Sauvanet A, Couvelard A, Kerneis S, Khun H, Vigan-Womas I, Ottone C, Molina TJ, Treluyer JM, Mercereau-Puijalon O, Milon G, David PH and Buffet PA, Blood, 2008, 112, 2520–2528. [DOI] [PubMed] [Google Scholar]
- 62.Suwanarusk R, Cooke BM, Dondorp AM, Silamut K, Sattabongkot J, White NJ and Udomsangpetch R, The Journal of infectious diseases, 2004, 189, 190–194. [DOI] [PubMed] [Google Scholar]
- 63.Sotirakopoulos N, Tsitsios T, Stambolidou M, Athanasiou G, Peiou M, Kokkinou V and Mavromatidis K, Renal Failure, 2004, 26, 179–183. [DOI] [PubMed] [Google Scholar]
- 64.Ertan NZ, Bozfakioglu S, Ugurel E, Sinan M and Yalcin O, Plos One, 2017, 12, e0171371. [DOI] [PMC free article] [PubMed] [Google Scholar]
- 65.Dessi M, Noce A, Bertucci P, Noce G, Rizza S, De Stefano A, di Villahermosa SM, Bernardini S, De Lorenzo A and Di Daniele N, Lipids Health Dis, 2014, 13. [DOI] [PMC free article] [PubMed] [Google Scholar]
- 66.Forman S, Bischel M and Hochstein P, Ann Intern Med, 1973, 79, 841–843. [DOI] [PubMed] [Google Scholar]
- 67.Kikuchi Y, Koyama T, Koyama Y, Tozawa S, Arai T, Horimoto M and Kakiuchi Y, Nephron, 1982, 30, 8–14. [DOI] [PubMed] [Google Scholar]
- 68.Brown CD, Ghali HS, Zhao ZH, Thomas LL and Friedman EA, Kidney Int, 2005, 67, 2066–2067. [DOI] [PubMed] [Google Scholar]
- 69.Zachee P, Boogaerts MA, Lins RL, Denbroeck V and Debroe ME, Clin Nephrol, 1986, 25, 315–315. [PubMed] [Google Scholar]
- 70.Piel FB, Steinberg MH and Rees DC, The New England journal of medicine, 2017, 377, 305. [DOI] [PubMed] [Google Scholar]
- 71.Man Y, Goreke U, Kucukal E, Hill A, An R, Liu S, Bode A, Solis-Fuentes A, Nayak LV, Little JA and Gurkan UA, Blood Cells Mol Dis, 2020, 83, 102424. [DOI] [PMC free article] [PubMed] [Google Scholar]
- 72.Lande WM, Andrews DL, Clark MR, Braham NV, Black DM, Embury SH and Mentzer WC, Blood, 1988, 72, 2056–2059. [PubMed] [Google Scholar]
- 73.Ballas SK, Larner J, Smith ED, Surrey S, Schwartz E and Rappaport EF, Blood, 1988, 72, 1216–1223. [PubMed] [Google Scholar]
- 74.Nader E, Grau M, Fort R, Collins B, Cannas G, Gauthier A, Walpurgis K, Martin C, Bloch W, Poutrel S, Hot A, Renoux C, Thevis M, Joly P, Romana M, Guillot N and Connes P, Nitric Oxide, 2018, 81, 28–35. [DOI] [PubMed] [Google Scholar]
- 75.Marahatta A and Ware RE, Blood Cells Mol Dis, 2017, 67, 135–142. [DOI] [PubMed] [Google Scholar]
- 76.Bennett-Guerrero E, Veldman TH, Doctor A, Telen MJ, Ortel TL, Reid TS, Mulherin MA, Zhu H, Buck RD, Califf RM and McMahon TJ, Proceedings of the National Academy of Sciences of the United States of America, 2007, 104, 17063–17068. [DOI] [PMC free article] [PubMed] [Google Scholar]
- 77.Henkelman S, Dijkstra-Tiekstra MJ, de Wildt-Eggen J, Graaff R, Rakhorst G and van Oeveren W, Transfusion, 2010, 50, 941–948. [DOI] [PubMed] [Google Scholar]
- 78.Frank SM, Abazyan B, Ono M, Hogue CW, Cohen DB, Berkowitz DE, Ness PM and Barodka VM, Anesth Analg, 2013, 116, 975–981. [DOI] [PMC free article] [PubMed] [Google Scholar]
- 79.García-Roa M, Del Carmen Vicente-Ayuso M, Bobes AM, Pedraza AC, González-Fernández A, Martín MP, Sáez I, Seghatchian J and Gutiérrez L, Blood Transfus, 2017, 15, 222–231. [DOI] [PMC free article] [PubMed] [Google Scholar]
- 80.Domen RE and Hoeltge GA, Archives of pathology & laboratory medicine, 2003, 127, 316–320. [DOI] [PubMed] [Google Scholar]
- 81.Wagner SJ, Vox sanguinis, 2005, 88, 60. [DOI] [PubMed] [Google Scholar]
- 82.Harmatz P, Butensky E, Quirolo K, Williams R, Ferrell L, Moyer T, Golden D, Neumayr L and Vichinsky E, Blood, 2000, 96, 76–79. [PubMed] [Google Scholar]
- 83.Firth PG, Tsuruta Y, Kamath Y, Dzik WH, Ogilvy CS and Peterfreund RA, Canadian journal of anaesthesia = Journal canadien d’anesthesie, 2003, 50, 895–899. [DOI] [PubMed] [Google Scholar]
- 84.Kucukal E, Ilich A, Key NS, Little JA and Gurkan UA, American journal of hematology, 2018, DOI: 10.1002/ajh.25159. [DOI] [PMC free article] [PubMed] [Google Scholar]
- 85.Yuan C, Quinn E, Kucukal E, Kapoor S, Gurkan UA and Little JA, Blood Cells Mol Dis, 2019, 79, 102350. [DOI] [PMC free article] [PubMed] [Google Scholar]
- 86.Rotz SJ, Ann O’riordan M, Kim C, Langer N, Cruz C, Schilz R, Lance C and Little JA, American journal of hematology, 2016, 91, E355–356. [DOI] [PubMed] [Google Scholar]
- 87.Kim M, Alapan Y, Adhikari A, Little JA and Gurkan UA, Microcirculation, 2017, 24. [DOI] [PMC free article] [PubMed] [Google Scholar]
- 88.Telen MJ, Malik P and Vercellotti GM, Nat Rev Drug Discov, 2019, 18, 139–158. [DOI] [PMC free article] [PubMed] [Google Scholar]
- 89.Romero Z, DeWitt M and Walters MC, Expert Opin Biol Ther, 2018, 18, 1123–1136. [DOI] [PubMed] [Google Scholar]
- 90.Ferrone FA, Semin Hematol, 2018, 55, 53–59. [DOI] [PubMed] [Google Scholar]
- 91.Dufu K, Patel M, Oksenberg D and Cabrales P, Clin Hemorheol Microcirc, 2018, 70, 95–105. [DOI] [PMC free article] [PubMed] [Google Scholar]
- 92.Ribeil JA, Hacein-Bey-Abina S, Payen E, Magnani A, Semeraro M, Magrin E, Caccavelli L, Neven B, Bourget P, El Nemer W, Bartolucci P, Weber L, Puy H, Meritet JF, Grevent D, Beuzard Y, Chretien S, Lefebvre T, Ross RW, Negre O, Veres G, Sandler L, Soni S, de Montalembert M, Blanche S, Leboulch P and Cavazzana M, The New England journal of medicine, 2017, 376, 848–855. [DOI] [PubMed] [Google Scholar]
- 93.Orkin SH and Bauer DE, Annu Rev Med, 2019, 70, 257–271. [DOI] [PubMed] [Google Scholar]
- 94.Kato GJ, Lawrence MP, Mendelsohn LG, Saiyed R, Wang X, Conrey AK, Starling JM, Grimes G, Taylor JG and McKew J, Journal, 2013. [Google Scholar]
- 95.Willie N, Mehlotra RK, Howes RE, Rakotomanga TA, Ramboarina S, Ratsimbasoa AC and Zimmerman PA, Am J Trop Med Hyg, 2018, 98, 1683–1691. [DOI] [PMC free article] [PubMed] [Google Scholar]
Associated Data
This section collects any data citations, data availability statements, or supplementary materials included in this article.