

Abstract
An analytical method using electrospray ionization and high- performance liquid chromatography/tandem mass spectrometry (LC/ESI–MS/MS) was developed to quantify the vitamin B metabolites found in the folate one-carbon metabolism, using 50 μL of human plasma. Analytes in plasma were extracted using protein precipitation after being stabilized in 1% ascorbic acid. The analytes were separated using a Kinetex 2.6 μm Pentafluorophenyl (2.1 × 30 mm) column utilizing a gradient mobile phase system of 0.1% formic acid in water and 100% acetonitrile in a 13.2 min run. The MS detector run using a positive multiple reaction monitoring with parameters optimized for each analyte’s ion pair. The assay was selective and linear for all analytes at defined dynamic ranges. The recoveries were generally above 80% except for the folate metabolites whose recoveries dipped possibly due to the drying process. The inter-day precision (%coefficient of variation) and accuracy (%calculated concentration of the nominal concentrations) for six replicates of all quality control samples were ≤14% and within 12.2%, respectively. The lower limit of quantification ranged from 0.2 to 3.9 nM. No significant instability was observed after repeated freezing and thawing or in processed samples.
The LC–MS/MS assay was found applicable for sensitive, accurate and precise quantitation of vitamin B metabolites in plasma of healthy volunteers and colorectal cancer patients.
Keywords: Metabolites, LC–MS/MS, Vitamin B, Folates, Plasma, Colorectal cancer
1. Introduction
Vitamin B is a family of water-soluble nutritional factors that play a significant role in maintaining wellness. In contrast, deficiencies in various isoforms of Vitamin B have been linked closely to the pathogenesis of several disorders including macrocytic anemia, cardiovascular disease [1-3], thromboembolic processes [4], neural tube defects [5,6], adverse pregnancy outcomes [7,8], neuropsychiatric disorders [9] and colorectal cancer (CRC) [10-15]. Vitamin B isoforms, which include B2, B6, folates (B9), and B12, are critical mediators and co-factors mediating biological reactions found in the folate one-carbon metabolism (FOCM) cycle. The FOCM cycle produces essential metabolites required for transmethylation reactions such as S-adenosyl methionine (SAM), the primary methyl donor, which is required for the methylation of various substrates to biosynthesize DNA, phospholipids, neurotransmitters and proteins. Folates are pteroyl glutamates that serve as the primary methyl carriers essential for intracellular transmethylation reactions such as nucleic acids biosynthesis and methylation reactions that are critical for gene regulation (Fig. 1). In addition, folates and their metabolites have been shown to enhance genomic stability through regulating nucleic acid biosynthesis, repair, and methylation [16]. Folates are also required to transfer methyl groups that are needed to synthesize the nucleotides needed to build DNA and modulate gene expressions through selective DNA site methylation.
Fig. 1.

The FOCM cycle which drives DNA methylation, synthesis and repair. DHFR, dihydrofolate reductase; 5-MTHF, 5-methyltetrahydrofolate; 5,10-MeTHF, 5,10-methylenetetrahydrofolate; CBS, Cystathionine-β-synthase; MAT, Methionine adenosyl transferase; MTR, methionine synthase; MTRR, methionine synthase reductase; MTHFR, methylenetetrahydrofolate reductase; SAM, S-adenosylmethionine; SAH, S-adenosylhomocysteine; SHMT, Serine hydroxymethyltransferase; THF, tetrahydrofolate; TYMS, thymidylate synthase; dUMP, deoxyuridine monophosphate; dTMP, deoxythymidine monophosphate.
Folates are available for metabolic reactions when ingested as either synthetic folic acid (FA) or 5-methyltetrahydrofolate (5MTHF). The dietary folates (primarily 5MTHF) are found in high concentrations in green leafy vegetables. Metabolically active folate, 5MTHF, serves as the secondary methyl donor in the FOCM serving as a coenzyme for methionine synthase (MTR) to convert homocysteine to methionine as summarized in Fig. 1. To become an active coenzyme folate, FA must be reduced to dihydrofolate (DHF) and then further metabolized into tetrahydrofolate (THF), a reaction mediated by dihydrofolate reductase (DHFR).
Vitamin B are important co-factors in the FOCM, where their levels can impact the rate of enzymatic activities. Previously, studies relating to FOCM measured plasma folates used microbiological-based assays. Bacteria lacking specific genes to synthesize various cofactors are employed, where the exogenous source of these co-factors facilitated survival and growth. The limitation of these microbiological growth assays is that they are unable to distinguish the various folate metabolite(s) that are present in blood, and thus incapable of identifying the metabolite that is responsible the biological activity. To more accurately identify which vitamin B metabolite(s) is responsible for exerting their biological activities, it is necessary to identify and quantify the specific metabolites accurately and precisely. Although several liquid chromatography-mass spectrometry (LC–MS) assays for vitamin B analytes have been developed [17-23], none of them can simultaneously quantify the metabolites of folates, pyridoxines and flavins which are implicated in most FOCM-related diseases like CRC.
To address this gap, a more specific, accurate, and sensitive assay is required to quantify the various vitamin B metabolites. This paper presents a validated multi-analyte LC–MS method that can simultaneously quantify the endogenous plasma levels of FOCM-related vitamin B metabolites in healthy volunteers and CRC patients.
2. Materials and methods
2.1. Chemicals and reagents
Analytical grades of ascorbic acid, flavin mononucleotide (FMN), folic acid (FA), pyridoxine (B6), pyridoxal (PL) hydrochloride, pyridoxamine (PM) dihydrochloride, and 4-pyridoxic acid (4PA) were bought from Sigma (St Louis, MO, USA). Riboflavin (B2) was bought from Alfa Aesar and 5-methyltetrahydrofolate (5MTHF), dihydrofolate (DHF) and tetrahydrofolate (THF) were acquired from Cayman Chemicals (Ann Arbor, MI, USA). Methotrexate (MTX), purchased from Enzo Life Sciences (Farmingdale, NY, USA), was used as an internal standard (IS) for the assay. The purity of each standard was above 97%, except DHF and THF which were 90% and 95% respectively. Ultrapure HPLC-grade water, LCMS-grade methanol, LCMS-grade acetonitrile and formic acid were purchased from Fisher Scientific (Pittsburg, PA, USA) and were used for sample processing and mobile phase systems.
2.2. Biosamples
Filtered and charcoal-stripped human blank plasma was obtained from Bioreclamation Inc (Long Island, NY) were used for assay development and validation. Samples used to test the assay’s applicability were also obtained from Bioreclamation Inc. These samples were collected from subjects consented for such analyses.
2.3. Preparation of stock solutions
A stock solution of each standard was prepared at concentrations ranging from 0.34 to 9.6 mg/mL using nitrogen-purged dimethylsuphoxide. The stock solutions were stored at −80 °C from where they were retrieved and diluted with 1% ascorbic acid to give an appropriately stabilized mixture of standards for use.
2.4. Standards and quality control samples
The stock solutions of the standards were mixed to form a working solution the composition of which is defined in Table 1. The constituent amount of each standard in the working solution was estimated at about twice the upper reference limit.
Table 1.
Concentration of FOCM components in working solution
| Metabolite | Concentration (μM) |
|---|---|
| 4PA | 3.28 |
| 5MTHF | 0.24 |
| B2 | 1.22 |
| B6 | 3.55 |
| DHF | 1.22 |
| FA | 0.24 |
| FMN | 1.01 |
| PL | 3.59 |
| PM | 3.57 |
| THF | 0.24 |
The working solution summarized in Table 1 was used to prepare calibration standards. The quality control (QC) samples were prepared from the stock solutions. Working solution was freshly prepared daily and further diluted using 1% ascorbic acid in water to prepare the required concentrations. Ten calibration standards were prepared at dilutions ranging from 1/2 to 1/1000. To each standard 30 ng/mL of methotrexate (MTX) was added as an internal standard. Plasma standards were prepared by spiking 50 μL of the appropriate standard solution into 50 μL of charcoal-treated pooled plasma. Suitable factors of working solution were spiked into the blank plasma to make high, medium and low QC samples by adding the during calibration curve and sample processing. The nominal concentrations of 1/10, 1/100, and 1/400 dilutions of the working solution were used as high, medium and low QC standards, respectively.
2.5. Plasma preparation
To 50 μL of clarified human plasma, 50 μL of 30 ng/ mL MTX was added. Ice-cold precipitation solution (400 μL) composed of 20% 0.2 M ZnSO4 in methanol was added, vortexed for 30 s and stored at −20 °C for 30 min. The sample was then centrifuged at 9000 g for 15 min at 4 °C, after which 400 μL of the supernatant was transferred to a clean 1.5 mL micro centrifuge tube and evaporated to dryness using a steady stream of dried and high efficiency particulate air (HEPA) filtered nitrogen gas. The dried residue was reconstituted with 30 μL of 1% ascorbic acid, where the samples were centrifuged at 9000 g for a minute at 4 °C to remove insoluble residue. An aliquot of 25 μL of the clarified supernatant transferred into HPLC vials and 20 μL injected into LCMS for quantification.
2.6. Instrumentation and LCMS conditions
The analytes were separated and quantified using an LCMS system comprising of Shimadzu Prominence system linked to an API 4000 LC/MS/MS spectrometer (AB Sciex, Foster City, CA). The data were acquired and processed using Analyst 1.6.1 (AB Sciex, Foster City, CA). Each of the analytes was quantified using their signature multiple reaction monitoring (MRM) that was identified after manual tuning of the specific compound.
Analytes were separated using a Kinetex Pentafluorophenyl (2.1 × 30 mm, 2.6 μm) column (Phenomenex Technologies Inc., Torrance, CA). The analytes were eluted using a gradient mobile phase system consisting of two components; component A consisted of 0.1% formic acid in water, while component B is 100% acetonitrile. The gradient conditions started at 100% A and continued as follows: 0–0.4 min, there was a linear increase to 10% B with an initial flow rate of 0.20 mL/min, which was increased to 0.30 mL/min after 0.4 min. Between 0.4–5.47 min, there was a linear increase to 20% B, and then it was further increased to 95% B between 5.47–6.4 min. The gradient was maintained at this condition for 2.4 min, then was declined to 100% A within 0.4 min. The column was finally recovered with a 4 min run of 100% A to complete the run.
A flow injection analysis was performed using the transition ions of each analyte to maximize sensitivity. The analytes were optimized at a source temperature of 500 °C, under unit resolution for quadrupoles 1 and 3. The optimal gas pressures were as follows: collision gas, 10 psi; curtain gas, 40 psi; ion source gas (1), 10 psi; ion source gas (2), 30 psi; and Ion Spray Voltage, 5000 V. The mass spectrometer operated in the positive MRM mode with a dwell time set at 20 ms. Analyte-specific settings were determined using Analyst software in the quantitative optimization mode, as depicted in Table 2.
Table 2.
Analytes, selected MRM transitions, retention time (RT) and parameter settings- collision energy (CE), declustering potential (DP), entrance potential (EP) and collision cell exit potential (CXP).
| Analyte | Q1 Mass, u | Q3 Mass, u | RT, min | DP (V) | EP (V) | CE (eV) | CXP (V) | Linearity range (nM) |
|---|---|---|---|---|---|---|---|---|
| 4-pyridoxic acid | 184.1 | 148 | 2.1 | 57 | 8 | 28.9 | 12.8 | 3.3–1638 |
| 5-methyltetrahydrofolate | 460.1 | 313.2 | 3.1 | 79 | 5 | 28.4 | 25.1 | 0.2–118 |
| Dihydrofolate | 444.3 | 297.1 | 3.4 | 57 | 7 | 22.7 | 8.6 | 1.0–514 |
| Flavin mononucleotide | 457.1 | 439.1 | 3.6 | 73 | 9 | 23.7 | 13.5 | 1.0–504 |
| Folic acid | 442.1 | 295 | 3.4 | 91 | 7 | 18.1 | 8.6 | 0.2–104 |
| Methotrexate | 455.3 | 308 | 3.7 | 95 | 5 | 25.1 | 4.1 | NA |
| Pyridoxal | 168 | 149.7 | 1.0 | 57 | 6 | 15.3 | 11.2 | 3.5–1794 |
| Pyridoxamine | 169.1 | 134.1 | 0.7 | 57 | 5 | 28.9 | 11.2 | 3.2–1623 |
| Pyridoxine | 170.1 | 151.9 | 1.1 | 57 | 5 | 17.5 | 12.2 | 3.9–1933 |
| Riboflavin | 376.9 | 198 | 3.5 | 240 | 5 | 49.2 | 16.6 | 1.2–611 |
| Tetrahydrofolate | 446.1 | 299.1 | 3.0 | 91 | 4 | 24.4 | 8.2 | 1.0–234 |
2.7. Method validation
The method was validated using the guidelines for the Food and Drug Administration bioanalytical method validation [24]. The validation procedures conducted for this assay include the following parameters: selectivity and carry-over, cross-analyte interference, limit of quantification, standard curves, accuracy and precision, recovery and stability.
2.7.1. Selectivity and carry-over
Chromatograms for three QC concentrations were compared to those for six batches of blank plasma before and after spiking. Ion traces of each specific analyte were checked for potential interferences at the respective retention times. The acceptance criterion was set at 20% of the lower limit of quantification (LLOQ) peak area for the analytes and 5% of the peak area for the internal standard. The carry-over effect was evaluated by injecting blank samples after the high QC sample, and the blank sample should not be greater than 20% of the LLOQ.
2.7.2. Cross-analyte interference
Each analyte was injected at the upper limit of quantification and assessed for interference with other analytes. An interfering peak area of up to 20% of the mean analyte peak area was deemed not significant.
2.7.3. Limit of quantification
The concentration that gave intensity at least five-fold higher than the background in blank plasma was selected as the LLOQ. The precision and accuracy of the selected LLOQ were within 20% of the expected mean values or deviations. Due to the intended application of the assay in human plasma, the determination of the limits of quantification was also influenced by the plasma reference ranges and was set about 3–16 times beyond the respective reference limits. Analytes with undefined reference ranges had that of their primary precursors being used to guide their limits of quantitation.
2.7.4. Standard curves
Calibration curves consisting of eight points were calculated by linear regression, with single-point calibration measurements instead of multi-point calibration measurements to increase feasibility [25,26]. The calibration graphs were derived by plotting the ratio of the analyte peak area to IS peak area versus the standard concentration. The best fit model was selected after exploration of different regression models and weighting factors.
2.7.5. Accuracy and precision
Inter-day accuracy and precision were calculated for the three QC samples, with measurements on seven experiments done on different days. Intra-day accuracy was not determined due to the duration for freshly preparing standards, sample preparation and the run time for the samples. It rather made practical sense to determine the inter-day accuracy instead. Inter-day accuracy and precision were evaluated at three concentrations (low, medium and high QCs) by analyzing replicates at each level, on different batch runs. The inter-day accuracies were accepted if the calculated values were within 15% of the nominal concentration or 20% at the lower limit of quantification. The precision of samples was acceptable if the coefficient of variation (CV) was not exceeding 15% or 20%, in the case of the LLOQ. Accuracy was defined as the actual back calculated concentration expressed as a percentage of the expected nominal concentration of the QC samples. Precision was defined as the coefficient of variation (CV) = ([standard deviation/mean of six measurements] × 100%).
2.7.6. Recovery rates
Plasma components in the ionization chamber may cause batch-specific ion suppression or enhancement. The respective retention time was visually assessed for each analyte over the six batches of blank plasma. Three sets of samples were prepared at low, medium and high concentrations. Chromatograms were recorded for plasma spiked pre-extraction, plasma spiked post-extraction, and analyte standards. Subsequently, the spiked plasma samples were extracted, as previously described, and the dry residues were reconstituted and injected into the LCMS for analysis. Recovery (RE) of an analyte was defined as the relative analyte signal area of standards spiked pre-extraction to that of standards spiked post-extraction.
2.7.7. Sample stability
Storage conditions and periods were chosen to mimic long-term storage of stock solutions, plasma during freeze-thaw cycles, and plasma extract in the autosampler awaiting analysis. QC samples were tested for stability when spiked in plasma and taken through three freeze-thaw cycles as well as keeping the processed sample for 6, 12, 18 and 24 h in an autosampler at 4 °C. Charcoal- stripped pooled plasma samples were spiked with a known standard and stored in −80°C freezer for at least 30 days. Replicates were analyzed on 3, 7,15 and 30 days.
2.8. Method application
To apply the assay to quantify the FOCM vitamin B metabolites, plasma samples obtained from ten healthy volunteers and ten CRC patients. The median ages of the two groups were not significantly different (p = .063). The median age (interquartile range) for the healthy volunteers and CRC patients were 42 years (26–54 years) and 54 years (44–58 years) respectively. Exactly 50% of subjects in each group were males. The metabolites’ levels were subsequently compared between the groups and also, with published reference range [21,27-30].
3. Results and discussion
3.1. Method optimization
We report the development and validation of LCMS-based metabolomics assay that is capable of simultaneously identifying and quantifying the various vitamin B metabolites found in the FOCM cycle. This assay offers a significant advantage over other microbiological approach which was the standard for determining vitamin B metabolites. The use of bacteria mutants that are deficient in the specific enzymes to biosynthesize these co-factors have a limitation because metabolites need to be pooled. This method is unable to distinguish the specific metabolite co-factors that may be responsible for various physiological or biological changes. This LC–MS-based assay requires 50 μL of plasma and is capable of quantifying ten vitamin B analytes related to the FOCM cycle.
Most observational studies assessing the association between folates and risk of CRC either used folate intake, or quantified plasma pooled folates as determined by unspecific assays like microbiological assay and chemiluminescent immunoassay [31-33]. As stated earlier, unspecific assays are unable to distinguish the various folate metabolites like DHF, THF, and 5MTHF. The inability to differentiate between the concentrations of these FOCM metabolites may confound metabolite-specific and its related reaction(s) that is responsible for the phenotypic alteration as seen in normal versus CRC patients.
Analyte extraction is a critical factor in sample processing that ought to maintain a consistent analyte recovery from the matrix while preserving their stability as well. Solid-phase extraction (SPE) and protein precipitation were both evaluated on how they recover the FOCM analytes at low, medium and high QCs. Protein precipitation was selected due to the consistency in extracting the increasing levels of spiked analytes from plasma (Fig. 2) and also, it required less processing time.
Fig. 2.

Comparison of analyte extraction using protein precipitation (PP) and SPE for low, medium and high QCs.
To stabilize the metabolites during the extraction process, we had evaluated some stabilizing reagents including ascorbic acid, tris(2-chloroethyl) phosphate (TCEP), and the combination (1% ascorbic acid +1% TCEP). Amongst these, 1% ascorbic acid was found to provide the most consistent measure for the analytes over the assessed duration of 96 h. Fig. 3 shows representative analytes that influenced the selection of a stabilizing agent. B6 was most stable in 1% ascorbic acid (with a relative concentration between 100 and 115%); the other stabilizing agents resulted in B6 relative levels below 50%.
Fig. 3.
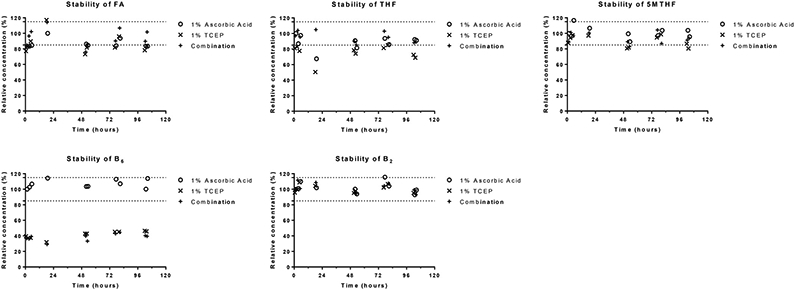
Stability of FOCM analytes in various stabilizing agents. 5MTHF, 5- methyltetrahydrofolate; B2, riboflavin; B6, pyridoxine; FA, folic acid; TCEP, (tris(2-carboxyethyl)phosphine); THF, tetrahydrofolate.
The run time for the method was optimized to eliminate any possible carryover that may interfere with subsequent plasma samples. The gradient was designed to thoroughly clean and equilibrates the column, making it suitable for high throughput runs.
3.2. Method validation
3.2.1. Selectivity and carry-over
An LC–MS/MS assay was developed for selective detection as well as for accurate and precise quantification of vitamin B metabolites. This assay will establish a metabolomics platform to explore possible targets that are associated with the FOCM during different disease conditions. The precise quantification of the various metabolites found in the cycle can reflect the enzymatic defects associated with a disease condition which one can subsequently investigate at the genomic level. The analytes being endogenous compounds made it very challenging to define selectivity. However, the LLOQ was determined to coincide with the standard which was 1/1000 dilution of the working solution. This challenge was minimized by using filtered and charcoal-stripped human plasma as blank though was not eliminated. Among the analytes which still had peaks for endogenous levels in the blank plasma were B6, 4PA, and 5MTHF. However, the areas of these peaks were less than 20% of the peak for LLOQ were not considered significant and were subtracted as background. No significant carry-over was observed in blank plasma.
3.2.2. Linearity
Plasma calibration standards (n = 8) were used to generate standard curves and fitted using linear regression with a weighting factor of 1/x2 for B2, FMN, and DHF but no weighting for the other analytes. The fit was considered acceptable if the mean calculated values of the calibration standards over the batches for each value were 15% of the nominal values or 20% at the lower limit of quantification.
At least six points were used to generate each standard curve. Each batch of validation and patient samples were processed with calibration curves prepared freshly using the same concentrations (single measurements per level). For routine analysis, the standard curve and six QC samples (duplicates of low, medium and high QCs) were assayed. The standard curve was accepted if at least 4 of the six calculated concentrations of QC samples were within 20% of the nominal values, with at least 1 QC sample passing at each concentration. Fig. 4 shows a representative chromatogram of the analytes. The calibration curve for each analyte showed a high linearity with the squared correlation coefficient (r2) > 0.99 (Table 3) over the dynamic range (defined in Table 1).
Fig. 4.

Representative chromatograms of the vitamin B analytes at concentration of 1/5 dilution of working solution. 5MTHF, 5- methyltetrahydrofolate; B2, riboflavin; B6, pyridoxine; DHF, dihydrofolate; FA, folic acid; FMN, Flavin mononucleotide; MTX, methotrexate; PA, 4-pyridoxic acid; PL, pyridoxal; PM, pyridoxamine; THF, tetrahydrofolate.
Table 3.
Inter-run accuracy and precision (n = 6 for each concentration level).
| Analyte | Average slopeb | Average R2 | Accuracy (%) |
Precision (CV) |
||||
|---|---|---|---|---|---|---|---|---|
| Low | Medium | High | Low | Medium | High | |||
| 4-Pyridoxic acid | 0.0748 | 0.9980 | 91.0 | 109.9 | 107.4 | 11 | 6 | 6 |
| 5-Methyltetrahydrofolate | 0.0306 | 0.9997 | 101.0 | 104.3 | 103.9 | 10 | 11 | 7 |
| Dihydrofolatea | 0.0002 | 0.9990 | 98.4 | 102.1 | 95.7 | 12 | 10 | 10 |
| Flavin Mononucleotide | 0.0029 | 0.9966 | 96.0 | 98.4 | 102.3 | 6 | 7 | 6 |
| Folic acida | 0.0069 | 0.9980 | 105.3 | 112.2 | 103.7 | 1 | 4 | 8 |
| Pyridoxal | 0.0027 | 0.9969 | 97.3 | 98.6 | 106.7 | 7 | 6 | 8 |
| Pyridoxamine | 0.0043 | 0.9980 | 99.5 | 103.3 | 108.0 | 13 | 7 | 3 |
| Pyridoxine | 0.0704 | 0.9997 | 95.7 | 105.7 | 100.6 | 14 | 6 | 9 |
| Riboflavin | 0.0017 | 0.9991 | 101.2 | 101.9 | 101.4 | 10 | 8 | 8 |
| Tetrahydrofolatea | 0.0006 | 0.9994 | 104.0 | 107.3 | 105.8 | 12 | 7 | 3 |
The accuracy and precision for these analytes are reported for n = 5 for each concentration level.
The gradient of the calibration curve obtained after plotting IS-normalized peak area versus the concentration of analyte (in uM).
3.2.3. Precision and accuracy
Table 3 summarizes the inter-day precision (CV) and accuracy (% calculated concentration of the nominal concentrations) for six replicates of QCs. All the replicates had a CV and accuracy of within 14% and between 91 and 112.2%, respectively.
3.2.4. Matrix effect and recovery
Recovery rates for the B6 metabolites and the riboflavin were approximately 80%, however folate analytes were low (ranging from 49% to 80%), with the high QC groups being the lowest (Table 4). The low and medium QCs for PL, PM, pyridoxine, and riboflavin, had recoveries generally above 100% which may represent some possible analytical challenges. The poor recovery of the folates (especially DHF and THF) may be due to the drying step in the sample processing during which the very unstable analytes may undergo chemical conversions. DHF and THF are unstable folate intermediates that may react readily with any oxygen that might have blown alongside the nitrogen stream during sample drying step. This observation is similar to the finding reported by Fazili, Pfeiffer, Zhang, Jain and Koontz [29]. This challenge may be attenuated by vacuum drying the processed samples.
Table 4.
Recovery rates of analytes at various concentration ranges.
| Analyte | Low | Medium | High |
|---|---|---|---|
| 4-Pyridoxic acid | 95% | 95% | 90% |
| 5-Methyltetrahydrofolate | 66% | 58% | 54% |
| Dihydrofolate | 80% | 57% | 54% |
| Flavin mononucleotide | 56% | 57% | 60% |
| Folic acid | 54% | 50% | 55% |
| Methotrexate | 56% | 49% | 53% |
| Pyridoxal | 113% | 98% | 82% |
| Pyridoxamine | 120% | 115% | 85% |
| Pyridoxine | 106% | 110% | 92% |
| Riboflavin | 120% | 101% | 88% |
| Tetrahydrofolate | 57% | 51% | 49% |
3.2.5. Sample stability
Processed analytes were stable over 18 h when stored in the refrigerated autosampler. The accuracy of analytes at the low and high QCs was within 20% of the expected concentration (Fig. 5). Analytes were stable for at least one month when spiked into blank plasma and stored at −80 °C; this observation was consistent with the folates stability data that has been published by Zheng [20]. The linear regression for their respective degradation curves showed slopes which were not significantly different from zero. Analytes were thus assumed to be stable at least after one month of storage at −80 °C. After three freeze-thaw cycles (for both low and high QC concentrations), average remaining levels in extracts ranging between 85 and 120%.
Fig. 5.
Stability of analytes after 18 h of storage in refrigerated autosampler.
3.3. Proof of applicability
The applicability of the assay was tested on the plasma samples of ten healthy volunteers and ten CRC patients. There was minimal information on vitamin supplementation for the subjects. The plasma concentrations of analytes, the median plasma analyte concentrations and interquartile range (IQR) are presented in Table 5. To facilitate statistical calculations, analyte concentration that were below the LLOQ were imputed the value of the LLOQ. Most of the plasma analyte concentrations (greater than 80%) were within the defined reference ranges. The plasma median levels of PA, 5MTHF, THF and total folates were significantly higher in the CRC group but B2, and FA plasma median levels were significantly higher in the health volunteers. However, the reference limits for B2 and FMN have been determined with an LCMS assay that used data from 94 patients so the range may not reflect the population appropriately [21]. On the other hand, PA is the final metabolite of vitamin B6 with a known high renal clearance because it is not bound to plasma proteins [34]. The elevated renal clearance of PA may explain the undetectable plasma PA levels in these healthy volunteers. However, PA has been reported to be elevated in cancers [35], and this was confirmed in the colorectal cancer samples, which had PA was detected in levels between 3.30–40.56 nM. The application of the assay to human plasma samples shows its utility for routine analysis and biomarker discovery for cancers, especially CRC.
Table 5.
Comparison of plasma concentrations (nM) of analytes in healthy volunteers and CRC patients
| Analyte | Median (Interquartile range), nM Controls |
Cases | p-value* | Reference range, nM |
|---|---|---|---|---|
| PA | <3.30 | 7.60 (3.30–40.56) | 0.005 | 8.7–385 |
| PL | 92.98 (48.45–107.47) | 105.63 (77.23–214.83) | 0.199 | 2.5–300 |
| PM | <3.20 | <3.20 | <202 | |
| B6 | <3.90 | <3.90 | <60 | |
| B2 | 3.91 (2.83–4.02) | 1.20 (1.2–2.29) | 0.019 | 4.9–38.4 |
| FMN | 1.97 (1.02–3.16) | 1.00 (1.00–6.74) | 0.267 | 3.3–13.4 |
| FA | 12.74 (10.07–15.14) | 9.43 (8.02–11.50) | 0.028 | <561 |
| DHF | <1.00 | <1.00 | <6 | |
| THF | 1.44 (0.89–1.77) | 5.13 (3.22–9.05) | 0.001 | <28.9 |
| 5MTHF | 7.43 (5.09–9.71) | 17.90 (8.92–40.47) | 0.013 | 5.9–266 |
| Total Folates | 23.07 (21.06–25.22) | 35.73 (27.87–53.34) | 0.013 | 8.2–642 |
p-value was calculated using Mann-Whitney test with significance at p < 0.05.
4. Conclusion
A sensitive multi-analyte LCMS method was developed employing protein precipitation extraction to quantify the vitamin B metabolites in the FOCM accurately, thereby providing an alternative to quantifying them by the microbiological assay. The analytical procedure was validated and successfully applied on plasma samples from healthy volunteers and CRC patients. The assay has shown enough robustness for use in clinical samples for investigations that relate to these analytes.
Acknowledgements
We would like to thank the National Institutes of Health and Dr. David Conti for the support. This work was supported by grant NIH NCI R01CA140561.
References
- [1].Bailey LB, Rampersaud GC, Kauwell GPA, Folic acid supplements and fortification affect the risk for neural tube defects, vascular disease and cancer: evolving science, J. Nutr 133 (2003) 1968. [DOI] [PubMed] [Google Scholar]
- [2].Boushey CJ, Beresford SA, Omenn GS, Motulsky AG, A quantitative assessment of plasma homocysteine as a risk factor for vascular disease: probable benefits of increasing folic acid intakes, JAMA 274 (1995) 1049–1057, 10.1001/jama.274.13.1049. [DOI] [PubMed] [Google Scholar]
- [3].Collaboration HS, Homocysteine and risk of ischemic heart disease and stroke: a meta-analysis,JAMA 288 (2002) 2015–2022, 10.1001/jama.288.16.2015. [DOI] [PubMed] [Google Scholar]
- [4].Ray JG, Meta-analysis of hyperhomocysteinemia as a risk factor for venous thromboembolic disease, Arch. Intern. Med 158 (1998) 2101–2106, 10.1001/archinte.158.19.2101. [DOI] [PubMed] [Google Scholar]
- [5].M.V.S.R. Group, Prevention of neural tube defects: results of the Medical Research Council Vitamin Study, Lancet 338 (8760) (1991) 131–137, 10.1016/0140-6736(91)90133-A. [DOI] [PubMed] [Google Scholar]
- [6].Berry RJ, Li Z, Erickson JD, Li S, Moore CA, Wang H,Mulinare J, Zhao P, Wong L-YC,Gindler J, Prevention of neural-tube defects with folic acid in China, N. Engl. J. Med 341 (1999) 1485–1490, 10.1056/NEJM199911113412001. [DOI] [PubMed] [Google Scholar]
- [7].Vollset SE, Refsum H, Irgens LM, Emblem BM, Tverdal A, Gjessing HK, Monsen AL, Ueland PM, Plasmatotal homocysteine, pregnancy complications, and adverse pregnancy outcomes: the Hordaland Homocysteine study, Am. J. Clin. Nutr 71 (2000) 962–968, 10.1097/00006254-200010000-00002. [DOI] [PubMed] [Google Scholar]
- [8].George L,Mills JL, Johansson AL, Nordmark A, Olander B, Granath F, Cnattingius S, Plasma folate levels and risk of spontaneous abortion, JAMA 288 (2002) 1867–1873, 10.1001/jama.288.15.1867. [DOI] [PubMed] [Google Scholar]
- [9].Seshadri S, Beiser A,Selhub J, Jacques PF, Rosenberg IH, D’Agostino RB, Wilson PWF, Wolf PA, Plasma homocysteine as a risk factor for dementia and Alzheimer’s disease, N. Engl. J. Med 346 (2002) 476–483, 10.1056/NEJMoa011613. [DOI] [PubMed] [Google Scholar]
- [10].Giovannucci E, Stampfer MJ, Colditz GA, Hunter DJ,Fuchs C, Rosner BA, Speizer FE, Willett WC, Multivitamin use, folate, and colon cancer in women in the Nurses’ Health Study, Ann. Intern. Med 129 (1998) 517–524, 10.7326/0003-4819-129-7-199810010-00002. [DOI] [PubMed] [Google Scholar]
- [11].Terry P, Jain M, Miller AB, Howe GR, Rohan TE, Dietary intake of folic acid and colorectal cancer risk in a cohort of women, Int. J. Cancer 97 (2002) 864–867, 10.1002/ijc.10138. [DOI] [PubMed] [Google Scholar]
- [12].Keku T, Millikan R, Worley K, Winkel S, Eaton A, Biscocho L, Martin C, Sandler R, 5,10-Methylenetetrahydrofolate reductase codon 677 and 1298 polymorphisms and colon cancer in African Americans and whites, Cancer Epidemiol. Biomark. Prev 11 (2002) 1611–1621. [PubMed] [Google Scholar]
- [13].Boyapati SM, Bostick RM, McGlynn KA, Fina MF, Roufail WM, Geisinger KR, Hebert JR, Coker A, Wargovich M, Folate intake, MTHFR C677T polymorphism, alcohol consumption, and risk for sporadic colorectal adenoma (United States), Cancer Causes Control 15 (2004) 493–501, http://10.1023/B:CACO.0000036447.45446.2c. [DOI] [PubMed] [Google Scholar]
- [14].Benito E, Stiggelbout A, Bosch F, Obrador A, Kaldor J, Mulet M, Munoz N, Nutritional factors in colorectal cancer risk: a case-control study in Majorca, Int. J. Cancer 49 (1991) 161–167, 10.1002/ijc.2910490202. [DOI] [PubMed] [Google Scholar]
- [15].Larsson SC, Giovannucci E, Wolk A, Folate intake MTHFR polymorphisms, and risk of esophageal, gastric, and pancreatic cancer: a meta-analysis, Gastroenterology 131 (2006) 1271–1283, 10.1053/j.gastro.2006.08.010. [DOI] [PubMed] [Google Scholar]
- [16].de Vogel S, Schneede J, Ueland PM, Vollset SE, Meyer K, Fredriksen Å, Midttun Ø, Bjørge T, Kampman E, Bretthauer M, Biomarkers related to one-carbon metabolism as potential risk factors for distal colorectal adenomas, Cancer Epidemiol. Biomark. Prev 20 (2011) 1726–1735, 10.1158/1055-9965.EPI-11-0359. [DOI] [PubMed] [Google Scholar]
- [17].Ringling C, Rychlik M, Analysis of seven folates in food by LC–MS/MS to improve accuracy of total folate data, Eur. Food Res. Technol 236 (2013) 17–28, 10.1007/s00217-012-1849-x. [DOI] [Google Scholar]
- [18].Leung K-Y, De Castro SC, Cabreiro F, Gustavsson P, Copp AJ, Greene ND, Folate metabolite profiling of different cell types and embryos suggests variation in folate one-carbon metabolism, including developmental changes in human embryonic brain, Mol. Cell. Biochem 378 (2013) 229–236, http://dx.doi.org.10.1007/s11010-013-1613-y. [DOI] [PMC free article] [PubMed] [Google Scholar]
- [19].Odin E, Wettergren Y, Carlsson G, Gustavsson B, Determination of reduced folates in tumor and adjacent mucosa of colorectal cancer patients using LC–MS/MS, Biomed. Chromatogr 27 (2013) 487–495, 10.1002/bmc.2816. [DOI] [PubMed] [Google Scholar]
- [20].Zheng X-H, Jiang L-Y, Zhao L-T, Zhang Q-Y, Ding L, Simultaneous quantitation of folic acid and 5-methyltetrahydrofolic acid in human plasma by HPLC–MS/MS and its application to a pharmacokinetic study, J. Pharm. Anal 5 (2015) 269–275, 10.1016/j.jpha.2015.05.004. [DOI] [PMC free article] [PubMed] [Google Scholar]
- [21].Midttun Ø, Hustad S, Solheim E, Schneede J, Ueland PM, Multianalyte quantification of vitamin B6 and B2 species in the nanomolar range in human plasma by liquid chromatography–tandem mass spectrometry, Clin. Chem 51 (2005) 1206–1216, 10.1373/clinchem.2005.051169. [DOI] [PubMed] [Google Scholar]
- [22].Footitt EJ, Clayton PT, Mills K, Heales SJ, Neergheen V, Oppenheim M, Mills PB, Measurement of plasma B6 vitamer profiles in children with inborn errors of vitamin B6 metabolism using an LC-MS/MS method, J. inherited Metab. Dis 36 (2013) 139–145, 10.1007/s10545-012-9493-y. [DOI] [PubMed] [Google Scholar]
- [23].Hampel D, York ER, Allen LH, Ultra-performance liquid chromatography tandem mass-spectrometry (UPLC?MS/MS) for the rapid, simultaneous analysis of thiamin, riboflavin, flavin adenine dinucleotide, nicotinamide and pyridoxal in human milk,J. Chromatogr B 903 (2012) 7–13, 10.1016/j.jchromb.2012.06.024. [DOI] [PubMed] [Google Scholar]
- [24].US Food and Drug Administration, FDA Guidance for Industry: Bioanalytical Method Validation, US Department of Health and Human Services, Food and Drug Administration, Center for Drug Evaluation and Research, Rockville, MD, 2001. [Google Scholar]
- [25].Peters FT, Maurer HH, Systematic comparison of bias and precision data obtained with multiple-point and one-point calibration in six validated multianalyte assays for quantification of drugs in human plasma, Anal. Chem. 79 (2007) 4967–4976, 10.1021/ac070054s. [DOI] [PubMed] [Google Scholar]
- [26].Bjørk MK, Nielsen MK, Markussen LØ, Klinke HB, Linnet K, Determination of 19 drugs of abuse and metabolites in whole blood by high-performance liquid chromatography–tandem mass spectrometry, Anal. Bioana. Chem 396 (2010) 2393–2401, 10.1007/s00216-009-3268-9. [DOI] [PubMed] [Google Scholar]
- [27].Lentner C, Geigy scientific tables Units of Measurement, Body Fluids, Composition of the Body, Nutrition, Vol. 1, Ciba-Geigy, Basle, 1981. [Google Scholar]
- [28].Gori AM, Sofi F, Corsi AM, Gazzini A, Sestini I, Lauretani F, Bandinelli S, Gensini GF, Ferrucci L, Abbate R, Predictors of vitamin B6 and folate concentrations in older persons: the InCHIANTI study, Clin. Chem 52 (2006) 1318–1324, 10.1373/clinchem.2005.066217. [DOI] [PMC free article] [PubMed] [Google Scholar]
- [29].Fazili Z, Pfeiffer CM, Zhang M, Jain RB, Koontz D, Influence of 5, 10-methylenetetrahydrofolate reductase polymorphism on whole-blood folate concentrations measured by LC-MS/MS, microbiologic assay, and bio-rad radioassay, Clin. Chem 54 (2008) 197–201, 10.1373/clinchem.2007.096545. [DOI] [PubMed] [Google Scholar]
- [30].Hustad S, Ueland PM, Schneede J, Quantification of riboflavin, flavin mononucleotide and flavin adenine dinucleotide in human plasma by capillary electrophoresis and laser-induced fluorescence detection, Clin. Chem 45 (1999) 862–868. [PubMed] [Google Scholar]
- [31].Pufulete M, Al-Ghnaniem R, Leather AJ, Appleby P, Gout S, Terry C, Emery PW, Sanders TA, Folate status, genomic DNA hypomethylation, and risk of colorectal adenoma and cancer: a case control study, Gastroenterology 124 (2003) 1240–1248, 10.1016/S0016-5085(03)00279-8. [DOI] [PubMed] [Google Scholar]
- [32].Pufulete M, Al-Ghnaniem R, Rennie J, Appleby P, Harris N, Gout S, Emery P, Sanders T, Influence of folate status on genomic DNA methylation in colonic mucosa of subjects without colorectal adenoma or cancer, Br. J. Cancer 92 (2005) 838–842, 10.1038/sj.bjc.6602439. [DOI] [PMC free article] [PubMed] [Google Scholar]
- [33].Kim J, Park H, Choi Y, Chong S, Oh D, Kim N, Polymorphisms in genes involved in folate metabolism and plasma DNA methylation in colorectal cancer patients, Oncol. Rep. 25 (2011) 167–172. [PubMed] [Google Scholar]
- [34].Zempleni J, Kübler W, Metabolism of vitamin B 6 by human kidney, Nutr. Res 15 (1995) 187–192, 10.1016/0271-5317(95)92584-7. [DOI] [Google Scholar]
- [35].Galluzzi L, Vacchelli E, Michels J, Garcia P, Kepp O, Senovilla L, Vitale I, Kroemer G, Effects of vitamin B6 metabolism on oncogenesis, tumor progression and therapeutic responses, Oncogene 32 (2013) 4995–5004, 10.1038/onc.2012.623. [DOI] [PubMed] [Google Scholar]