Abstract
This paper describes the process involved in conducting an online spirometry practical through Zoom. The teacher demonstrated the practical from the medical school, and the students observed the procedure from the comfort of their own homes. Students were able to analyze the graphs captured in the teacher's laptop by remotely controlling the teacher’s laptop. This method may be useful for places where face-to-face classes are suspended due to the COVID-19 pandemic.
Keywords: corona, COVID-19, remote, spirometry, Zoom
INTRODUCTION
The COVID-19 pandemic, leading to lockdown and social distancing, resulted in discontinuation of face-to-face classes in educational institutions, including medical schools across the world. The faculty of the medical school at Macau University of Science and Technology in Macau was also affected by this pandemic. We had to switch over to the online medium of teaching for medical students using the Zoom application (Zoom). This transition happened while we were in the middle of our respiratory system block for first-year Bachelor of Medicine, Bachelor of Surgery (MBBS) students in February 2020. Along with online delivery of PowerPoint lectures through Zoom, teachers also began delivering the practical online. The spirometry practical was conducted face to face for one-half of the students (24 students) before the lockdown. The remaining one-half of the students (24 students) experienced the spirometry practical online, with the teacher demonstrating the procedure through Zoom, and students conducting the analysis using the software by remotely controlling the teacher’s laptop. The teacher demonstrated the practical from the medical school, and the students observed the procedure from the comfort of their own homes. Our experience with, and the process of undertaking, this initiative was challenging but also rewarding. The process involved is described below for the benefit of others who may be facing a similar situation.
Online spirometry practical procedure.
The online practical session started with the teacher giving a PowerPoint presentation on static lung volumes, forced expiratory volume in 1 s (FEV1), forced vital capacity (FVC), FEV1-to-FVC ratio (FEV1/FVC), and flow-volume loop. The practical manual was uploaded in the institutional Moodle site as a PDF document well ahead of the practical. The softcopy (electronic copy in PDF format) of the manual was also sent to all of the students through the chat window of the Zoom application during the online session. The chat facility of Zoom allows the sending of files like documents and image to the participants. The Zoom session was also recorded for uploading in the Moodle site for the benefit of the students to watch it later at their own pace.
Equipment and software used.
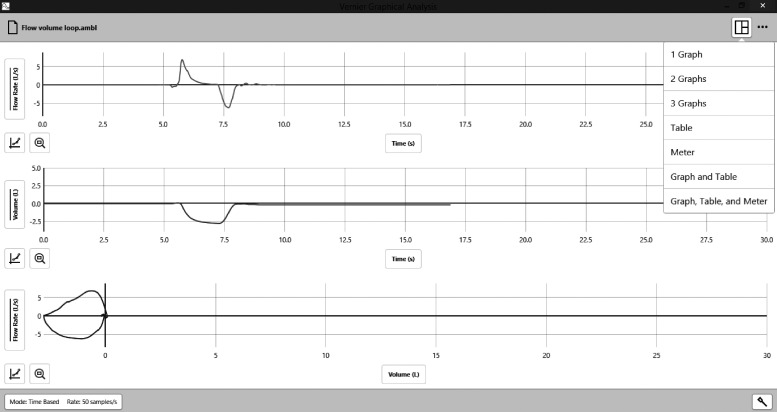
After the PowerPoint presentation, the teacher demonstrated the recording of the lung volumes using the Vernier Go Direct wireless spirometer (Vernier) connected to a Windows 10-based laptop. The spirometer can be connected wirelessly using Bluetooth or can be connected to the USB port of the laptop using a USB cable. The data were recorded using Graphical Analysis 4 software (Vernier) that is provided free of cost at the Vernier website (Fig. 1). The transducer in the spirometer flow head senses airflow, and the software calculates the volume by integrating the flow.
Fig. 1.
Screenshot of the Graphical Analysis 4 software interface showing airflow in the top panel, volume in the middle panel, and flow-volume loop in the bottom panel.
Remote analysis.
The laboratory technician helped by starting the recording in the software as the teacher was demonstrating. The students could see the trace being recorded live, as the software window was shared in the Zoom application. The students could also see the procedure video through the video feed from the laptop camera. At the end of the recording, the recorded trace was made available for students to analyze remotely. Students were asked to volunteer to perform the analysis remotely by controlling the teacher’s laptop online. Zoom application has a feature called remote desktop control that allows the remote control of the computer by the participants. The participants had to request remote control access from the teacher who was hosting the meeting. A few of the students volunteered for this, and access to control the computer remotely was given to them one at a time.
Recording of normal lung volumes.
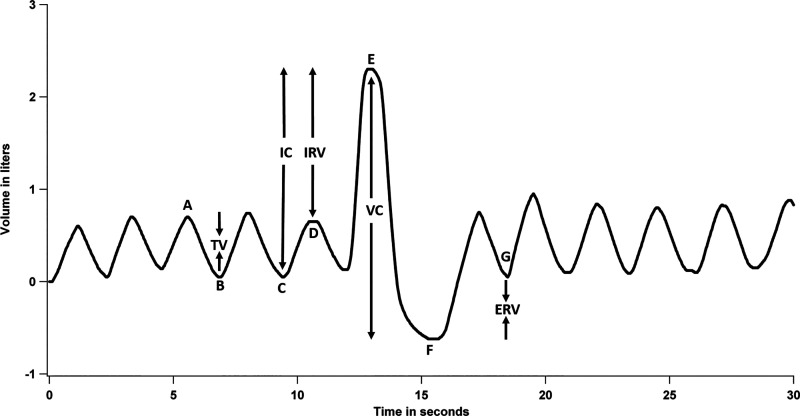
The teacher initially breathed normally through the spirometer and recorded four normal breaths. This was followed by maximal inspiration at the end of a normal expiration. The maximal inspiration was immediately followed by maximal expiration to residual volume to record the vital capacity (point E in Fig. 2). This was followed by normal breathing until the end of the recording. The whole recording was 30 s. Different students were asked to calculate the various lung volumes by clicking on the graph. They had already attended a theory lecture on lung volumes before the lockdown and were able to calculate the volumes very easily. The various lung volumes have to be calculated manually by the students by clicking on different regions of the trace and performing the calculation based on their prior knowledge of lung volumes. The value between points A and B in the graph (Fig. 2) gives the tidal volume. The value between D and E is the inspiratory reserve volume. The value between F and G is the expiratory reserve volume. The value between C and E is the inspiratory capacity, and the value between E and F is the vital capacity. All of the students attending the session recorded the obtained values in the practical manual that was sent to them.
Fig. 2.
Graph showing the recorded lung volumes. The value between points A and B gives tidal volume (TV); between D and E, inspiratory reserve volume (IRV); between F and G, expiratory reserve volume (ERV); between C and E, inspiratory capacity (IC); and between E and F, vital capacity (VC).
Calculation of FEV1/FVC.
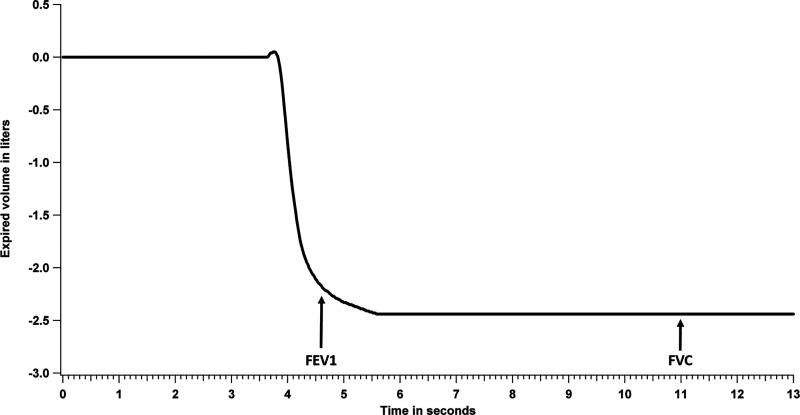
The teacher took a maximal inspiration and made a maximal expiration into the spirometer. The initial inspiration was not through the spirometer and was not recorded, so the recording of the expiratory volume started at zero (Fig. 3). The teacher made the expiration for a minimum of 6 s. Again, students were asked to volunteer to control the teacher’s computer remotely to perform the analysis. A different student than the one chosen for the previous experiment was granted permission to control the computer remotely. The student was asked to click on the plateau of the expired volume after 6 s of maximal expiration and note the value. This value was recorded as the FVC (Fig. 3). Another student was then asked to click on the expiratory volume 1 s after the start of the maximal expiration and note the value. This value was recorded as the FEV1 (Fig. 3). The values obtained were then used to calculate the FEV1/FVC and were recorded in their manual by all of the students. This was followed by a discussion with the students on the changes in FEV1, FVC, and FEV1/FVC in obstructive and restrictive lung diseases (1).
Fig. 3.
Graph showing forced expiratory volume in 1 s (FEV1) and forced vital capacity (FVC).
Recording of flow-volume loop.
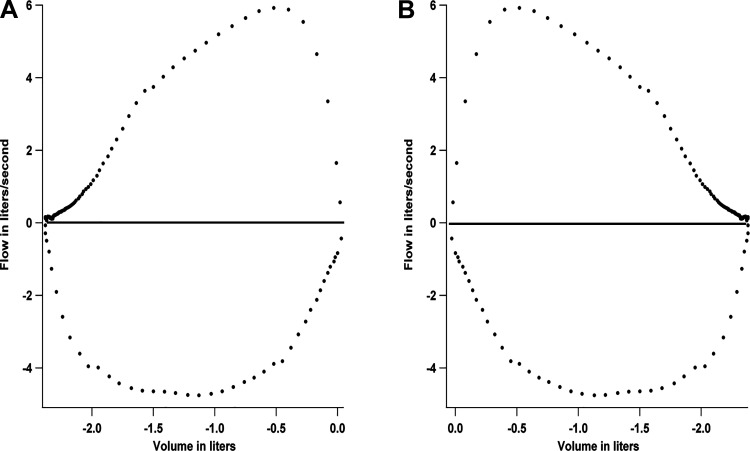
The Graphical Analysis 4 software shows two graphs by default when a spirometer is detected by the software. The top graph is the flow versus time data and the bottom graph is the volume versus time data. Flow-volume loops are plotted with the flow on the y-axis and the volume on the x-axis. This option is not there in the software by default. However, the software allows the user to add a third graph, with the option to choose the x- and y-axis parameter. Before the recording of the flow-volume loop, the third graph was added, with flow on the y-axis and volume on the x-axis (Fig. 1). Following this, the teacher took a maximal inspiration and made a maximal expiration into the spirometer. This was followed by a maximal inspiration through the spirometer. The initial inspiration was not through the spirometer and was not recorded. The recording obtained in the software was a mirror image of the usual flow-volume loop and was laterally inverted. However, the shape of the loop was characteristic with the triangle-shaped expiratory part of the loop above and the semicircular inspiratory part of the loop at the bottom (Figs. 1 and 4A). Again, students were asked to volunteer to remotely control the laptop of the teacher. Remote control access was granted, and a different student was asked to click on the peak of the expiratory flow. The value was noted and recorded as the peak expiratory flow rate (PEFR). The other students also recorded the value in their manuals. Changes in the shape of the flow-volume loop were then discussed with the students. It is possible to export the flow-volume loop data obtained with the software as an Excel CSV file (Microsoft) and replot in other software to laterally invert the graph and make it look like the usual flow-volume loop (Fig. 4B).
Fig. 4.
Flow-volume loop obtained with the Graphical Analysis 4 software (A) and the laterally inverted graph obtained by replotting the data in Igor Pro (B).
The recording of flow-volume loop was followed by the demonstration of the measurement of PEFR with Wright’s peak flowmeter. The teacher took a maximal inspiration and made a maximal expiration into the peak flowmeter. The value obtained on the meter was shown to the students through the webcam of the laptop, and a different student volunteer was asked to read out the value from the scale of the meter. This value was also recorded by all of the students in their manuals.
DISCUSSION
The online laboratory practical session ended with the teacher discussing the questions in the manual with the students. Overall, the session went smoothly, and it was possible to have student participation in the online practical demonstration rather than them being passive observers. Other online meeting applications like Microsoft Teams (Microsoft) also offer the capability for controlling the computer remotely and may be used in places where this application is used for online teaching. The Lt online platform (ADInstruments) is another option for students to perform remote physiology experiments and analysis with the help of the teacher hosting the online software and the connected hardware away from the students (2). Use of such technologies can make the teaching and learning of a physiology practical more meaningful during the coronavirus lockdown, where social distancing prevents face-to-face interaction with students.
DISCLOSURES
No conflicts of interest, financial or otherwise, are declared by the authors.
AUTHOR CONTRIBUTIONS
A.B. conceived and designed research; A.B. and A.K.M.N. performed experiments; A.B. analyzed data; A.B. interpreted results of experiments; A.B. prepared figures; A.B. drafted manuscript; A.B. and N.G.P. edited and revised manuscript; A.B., A.K.M.N., N.G.P., and M.F. approved final version of manuscript.
ACKNOWLEDGMENTS
We thank Dr. Billy Chan, Director of Center for Education in Medical Simulation, Macau University of Science and Technology, for support.
REFERENCES
- 1.Blonshine S, Hynes K, Kaminsky D. Ruppel’s Manual of Pulmonary Function Testing. St. Loius, MO: Elsevier, 2017, p. 137–141. [Google Scholar]
- 2.Petzold AM. Letter to the Editor: Resources and recommendations for a quick transition to online instruction in physiology. Adv Physiol Educ 44: 217–219, 2020. doi: 10.1152/advan.00049.2020. [DOI] [PMC free article] [PubMed] [Google Scholar]


