

Abstract
Bromine (Br2) is an organohalide found in nature and is integral to many manufacturing processes. Br2 is toxic to living organisms, and high concentrations can prove fatal. To meet industrial demand, large amounts of purified Br2 are produced, transported, and stored worldwide, providing a multitude of interfaces for potential human exposure through either accidents or terrorism. To identify the key mechanisms associated with acute Br2 exposure, we have surveyed the lung proteomes of C57BL/6 male mice and human lung-derived microvascular endothelial cells (HMECs) at 24 h following exposure to Br2 in concentrations likely to be encountered in the vicinity of industrial accidents. Global discovery proteomics applications combined with systems biology analysis identified robust and highly significant changes in proteins associated with three biological processes: 1) exosome secretion, 2) inflammation, and 3) vascular permeability. We focused on the latter, conducting physiological studies on isolated perfused lungs harvested from mice 24 h after Br2 exposure. These experiments revealed significant increases in the filtration coefficient (Kf) indicating increased permeability of the pulmonary vasculature. Similarly, confluent monolayers of Br2 and Br-lipid-treated HMECs exhibited differential levels of zona occludens-1 that were found to be dissociated from cell wall localization, an increase in phosphorylation and internalization of E-cadherin, as well as increased actin stress fiber formation, all of which are consistent with increased permeability. Taken as a whole, our discovery proteomics and systems analysis workflow, combined with physiological measurements of permeability, revealed both profound and novel biological changes that contribute to our current understanding of Br2 toxicity.
Keywords: actin, bromine, discovery, ESI-MS2, halogen, proteomics, systems biology, vascular permeability
INTRODUCTION
Bromine (Br2) is the most common organohalide found in nature (25). Addition of Br2 to water forms hydrobromic (HBr) and hypobromous (HOBr) acids (Fig. 1; Refs. 25, 48). In biological systems, peroxidases catalyze the oxidation of bromide and hydrogen peroxide, generated by eosinophils to produce HOBr, a bactericidal agent (Fig. 1; Refs. 5, 42, 53). Similar to other halogens, bromine is extracted from subterranean deposits, sea brines, and salt lakes to produce its pure form, Br2 (brown acrid liquid and gas; Ref. 52). The Dead Sea alone is estimated to contain nearly a billion tons of bromine and is a major site of harvesting for purification into Br2 (52). This form of Br2 is commonly used throughout the chemical industry with world production currently believed to reach upward of nearly half a billion pounds annually (56a). Primary countries involved in the production and use of Br2 include the United States, Israel, Jordan, and China (52).
Fig. 1.

Lipid-bromine reactions. Although Br2 is slightly soluble in aqueous (aq.) solutions (~300 µg/mL) at neutral pH, it will also react with H2O to form bromide ions (Br−) and hypobromous acid (HOBr). Hypobromous acid is also formed through the peroxidase-driven catalytic reaction between the bromide ions and H2O2. The most specific peroxidase driving this reaction is eosinophil peroxidase, but other peroxidases (such as myeloperoxidase) will form HOBr when Br− exist at high concentrations. Plasmalogens are a subclass of ethanolamine glycerophospholipids (PE) and choline glycerophospholipids (PC) that are reactive toward HOBr and have been shown to form 2-bromopalmitaldehyde (2-BrPALD), which may be either reduced (Red) to 2-bromopalmitoyl alcohol or oxidized (OX) to form 2-bromopalmitic acid. 2-BrPALD may also react with glutathione (GSH), which exists in abundance in lung tissues and bronchoalveolar lavage to form 2-GS-PALD. Lysophospholipids (LPLs) such as lysophosphatidic acid (LPA) are also formed, which activate lysophospholipid receptors (LPLRs) within the G protein-coupled receptor (GPCR) family. Eth, ethyl; SG, conjugated glutathione; SNx, position on the glycerophospholipid (GPL) backbone.
Br2 is used in the production of many products, including brominated fire retardants, drilling fluids, agriculture materials, and biocides for the treatment of water (44). To meet broad industrial demands, large amounts of purified Br2 are produced, transported, and stored worldwide, providing a multitude of interfaces for potential human exposure through either accident or terrorism (22). Exposure of humans and mouse models to liquid Br2 can cause severe burns, whereas inhalation of Br2 damages the respiratory track, potentially leading to pneumonia and death from respiratory failure (26, 44). Similar to humans, surviving mice often develop chronic lung diseases such as pulmonary fibrosis (3). Thus there is a need to develop animal models of Br2 toxicity to identify which proteins and biological processes are significantly affected and, with this knowledge, to develop countermeasures.
Previously, we (4) have shown that C57BL/6 mice exposed to Br2 in environmental chambers and returned to room air develop severe acute lung injury resembling human acute respiratory distress syndrome (ARDS). The observed phenotype is characterized by hypoxemia, hypercapnia, inflammation, lung cell apoptosis and necrosis, and the appearance of protein-rich edema in the alveolar spaces due to increased permeability of the pulmonary endothelial and alveolar epithelial cells to plasma and plasma proteins (4). Approximately 50% of the mice exposed to 600 ppm Br2 for 30 min died within 5 days of exposure. Surviving mice developed increased lung compliance and enlarged alveolar spaces, a phenotype resembling that of human emphysema (3, 4).
Common biological substrates of Br2 include unsaturated fatty acids and various conjugated metabolites, including free aromatic amino acids and amino acids found within the backbone of peptides and proteins (i.e., tryptophan, phenylalanine, histidine, and tyrosine; Refs. 18, 39, 42, 53, 57). Br2 and its hydrolysis product, HOBr, are likely to react with targets on airway epithelia and, therefore, unlikely to reach distal lung spaces. Consequently, injury to alveolar epithelial and systemic organs such as the heart are thought to be mediated by reaction products. One such class of the products includes long-chain brominated fatty acids and aldehydes. These products form primarily by the reaction of Br2 and HOBr with plasmalogens to create what we will refer to hereon as brominated lipids (Br-lips; Fig. 1; Refs. 3, 5, 23). However, there is limited information on which proteins and biological processes are affected by Br2, HOBr, and Br-lips. Identification of underlying pathological mechanisms may lead to the development of novel targeted countermeasures, and investigation of global proteomic changes offers significant insight.
In our first series of experiments, we exposed C57BL/6 mice to bromine regimens (600 ppm for 30 min) in environmental chambers and then returned the animals to ambient air for 24 h. Through the application of a common proteomics workflow combined with systems biology analysis (Fig. 2), we identified robust and highly significant changes in three key processes: 1) exosome secretion, 2) inflammation, and 3) vascular permeability. To gain additional insight into the latter process, we exposed human lung microvascular endothelial cells (HMECs) to Br-lips (the most likely mediator of these changes; Refs. 3, 5, 23) and performed similar global discovery proteomics studies. We then validated our findings by performing a number of ex vivo and in vitro measurements to assess functional changes in vascular permeability of isolated perfused mouse lungs [Br2-treated (Tx)] while also identifying and assessing key protein changes responsible for vascular permeability disruption across HMEC monolayers (Br2 Tx and Br-lips). To the best of our knowledge, this is the first report in which global proteomics and systems analysis approaches have been combined with physiological measurements to investigate halogen-induced acute lung injury.
Fig. 2.
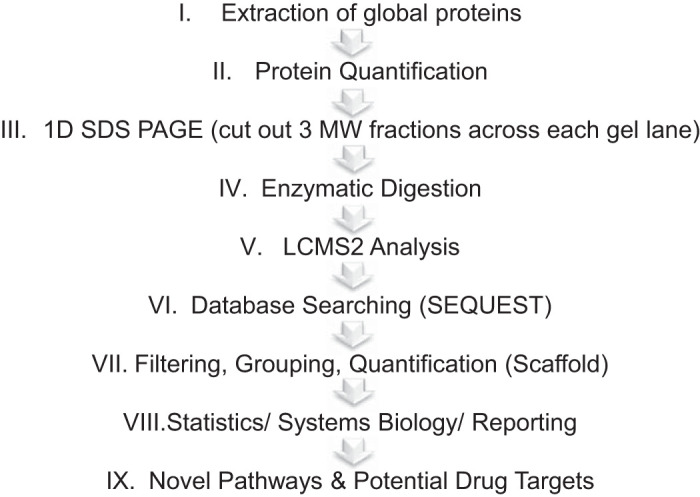
Schematic of workflow applied to the global discovery proteomics experiments. Proteins were extracted from the lungs of C57BL/6 mice 24 h after exposure to Br2 (600 ppm for 30 min) or human lung endothelial microvascular (HLME) cells (100 ppm for 10 min) after a 4-h incubation with 2-bromopalmitic acid and 2-bromopalmitaldehyde and analyzed separately through the given workflow for the purpose of identifying novel biological processes and potential drug targets. The more detailed steps for this workflow are described in materials and methods. 1D, 1-dimensional; LCMS2, liquid chromatography-tandem mass spectrometry; MW, molecular weight.
MATERIALS AND METHODS
Materials
The chemical reagents dithiothreitol (cat. no. D9779) and iodoacetamide (cat. no. I1149) were purchased from Sigma-Aldrich (St. Louis, MO). Acetonitrile (ACN) was purchased from Thermo Fisher Scientific (cat. no. A996SK; St. Louis, MO). The generation of 2-bromopalmitaldehyde (2-BrPALD) and 2-bromopalmitic acid (2-BrPA) along with their stable heavy-labeled standards for absolute quantification by mass spectrometry were carried out using strategies previously employed for the synthesis of chlorinated aldehydes (54, 60). All other disposables are referenced within the manuscript.
Animals
C57BL/6 8- to 12-wk-old male (20–25 g body wt) mice were purchased from Charles River (Wilmington, MA). All experimental procedures involving animals were approved by the University of Alabama at Birmingham (UAB) Institutional Animal Care and Use Committee (IACUC; APN20950).
Mice were exposed to Br2 gas (600 ppm/30 min) in a cylindrical glass chamber, two at a time, located in an environmental hood inside a negative pressure room, as previously described (4). Br2 tanks (mixed with air at the desired concentrations) and compressed air (used for control experiments) were purchased from Airgas (Birmingham, AL), which certified the Br2 concentration to within 2% of its nominal value. The concentration of Br2 into the chamber was measured randomly, at least once per week, using an Interscan detector (model RM34-1000m; Simi Valley, CA). The gas flow rate (5 L/min) was chosen to allow the chamber Br2 concentration to reach its nominal value within a few minutes and maintain the chamber CO2 concentration <0.05%, as measured with a CO2 meter (https://www.co2meter.com/). Chamber humidity was at 40–50% throughout the exposure.
Following exposure, Br2 flow was discontinued, and mice were returned to their cages and observed during the day at least every 2 h and once during the night. They were allowed access to food and water ad libitum. For the survival studies, 24 males and 15 females were observed closely for 3 wk (21 days) to determine the level of mortality between each group.
Discovery Proteomics (Animals and HMECs)
Sample preparation of mouse lung tissues (n = 4) and HMECs (n = 3).
Culture conditions are described below (section Immunotargeted and Global Proteomic Measurements in HMECs Tx Br2 and Br-Lips). For the animal experiments described above (section Animals), at 24 h after exposure, mice were euthanized according to UAB IACUC protocols, and mouse lungs were harvested, flash-frozen in liquid nitrogen, and stored at −80°C until used for proteomics analysis. The global proteomics analysis was carried out as previously referenced with minor changes (Fig. 2; Ref. 41). The protein fractions were quantified using the Pierce BCA Protein Assay Kit (cat. no. PI23225; Thermo Fisher Scientific), and ~20 µg of protein per sample was then diluted to 35 µL using NuPAGE LDS Sample Buffer (1× final concentration; cat. no. NP0007; Invitrogen). Proteins were then reduced with dichlorodiphenyltrichloroethane and denatured at 70°C for 10 min before loading onto Novex NuPAGE 10% Bis-Tris Protein Gels (cat. no. NP0315BOX; Invitrogen) and separated approximately halfway (15 min at 200-V constant). The gels were stained overnight with Novex Colloidal Blue Staining Kit (cat. no. LC6025; Invitrogen). Following destaining, each lane was partitioned into three separate molecular weight (MW) fractions and equilibrated in 100 mM ammonium bicarbonate. Each gel plug was then digested overnight with Trypsin Gold, Mass Spectrometry Grade (cat. no. V5280; Promega) following manufacturer’s instructions. Peptide extracts were reconstituted in 0.1% formic acid/double-distilled water (ddH2O) at 0.1 µg/µL.
Mass spectrometry: nano-HPLC electrospray ionization multistage tandem mass spectrometry analysis and database searches.
Peptide digests (8 µL each) were injected onto a 1260 Infinity nano-HPLC stack (Agilent Technologies, Santa Clara, CA) and separated using a 100-µm inside diameter-by-13.5-cm pulled tip C18 column (Jupiter 5 µm C18 300 Å; Phenomenex, Torrance, CA). This system runs in line with a Thermo Scientific Orbitrap Velos Pro hybrid mass spectrometer equipped with a nanoelectrospray source (Thermo Fisher Scientific, Waltham, MA), and all data were collected in collision-induced dissociation mode. The nano-HPLC was configured with binary mobile phases that included solvent A (0.1% formic acid in ddH2O) and solvent B (0.1% formic acid in 15% ddH2O-85% ACN), programmed as follows: 10 min at 5% solvent B (2 µL/min, load), 90 min at 5–40% solvent B (linear: 0.5 nL/min, analyze), 5 min at 70% solvent B (2 µL/min, wash), 10 min at 0% solvent B (2 µL/min, equilibrate). Following each parent ion scan (300–1,200 mass-to-charge ratio at 60,000 resolution), fragmentation data (tandem mass spectrometry, MS2) were collected on the top-most-intense 15 ions. For data-dependent scans, charge state screening and dynamic exclusion were enabled with a repeat count of 2, a repeat duration of 30 s, and an exclusion duration of 90 s.
The Xcalibur *.RAW files were collected in profile mode, centroided, and converted to mzXML using ReAdW version 3.5.1 software (Seattle Proteome Center, Institute for Systems Biology; http://tools.proteomecenter.org/wiki/index.php?title=Formats:mzXML). The data were searched using SEQUEST (20), which was set for two maximum missed cleavages, a precursor mass window of 20 ppm, trypsin digestion, and variable modifications C at 57.0293 and M at 15.9949. Searches were carried out using species-specific subsets [Mus musculus (mouse) and Homo sapiens (human)] of the UniProtKB database (https://www.uniprot.org/).
Peptide filtering, grouping, and quantification.
The list of peptide identifications generated based on SEQUEST (Thermo Fisher Scientific) search results were filtered using Scaffold (Protein Sciences, Portland, OR). Scaffold filters and groups all peptides to generate and retain only high-confidence identifiers while also generating normalized spectral counts (NSCs) across all samples for the purpose of relative quantification. The filter cutoff values were set with minimum peptide length of more than five amino acids, with no single charged peptides (MH+1 charge states), with peptide probabilities of >80% confidence interval, and with the number of peptides per protein at least two. The protein probabilities were then set to a >99.0% confidence interval and a false discovery rate (FDR) <1.0. Scaffold incorporates the two most common methods for statistical validation of large proteome data sets, the FDR and protein probability (33, 46, 59). Relative quantification across experiments was then performed via spectral counting (40, 50), and when relevant, spectral count abundances were then normalized between samples (9).
Statistical and systems biology analysis.
Two separate nonparametric statistical analyses were performed for each pairwise comparison of all proteomic data, including 1) the calculation of weight values by significance analysis of microarray (SAM; cutoff >|0.6|) combined with 2) t test (single tail, unequal variance, cutoff of P < 0.05). Data were then sorted according to the highest statistical relevance in each comparison. SAM (24, 61) is a statistically derived function that approaches significance as the distance between the means (μ1 − μ2) for each group increases and the standard deviation (δ1 − δ2) decreases using the formula W = (μ1 − μ2)/(δ1 − δ2). For protein abundance ratios determined with NSCs, we set a 1.5- to 2.0-fold change as the threshold for significance. This significance threshold was determined empirically by analyzing the interquartile data from the control experiment indicated above using ln − ln plots, where the Pearson correlation coefficient (R) was 0.98, and >99% of the normalized intensities fell between ±1.5-fold. In each case, any two of the three tests (SAM, t test, or fold change) had to pass. The most significant proteomic changes associated with permeability were graphed with GraphPad (Prism 8.0; San Diego, CA), whereas the volcano plot, heat map, and principal component analysis were all generated using Qlucore Omics Explorer (Lund, Sweden). Gene ontology assignments and pathway analysis were carried out using MetaCore (GeneGo, St. Joseph, MI), UniProtKB database, and Database for Annotation, Visualization and Integrated Discovery (DAVID; https://david.ncifcrf.gov/). Interactions identified within MetaCore are manually correlated using full text articles. Detailed algorithms have been described previously (11, 19).
Biological Measurements of Brominated Lipids
LC-MS and GC-MS quantitative methods for the detection of 2-BrPA and 2-BrPALD in mouse lungs have been developed by D. A. Ford (n = 6–12 per group; Refs. 5, 58). Tandem mass spectrometric analysis of 2-BrPA revealed that these molecules fragment, losing HBr, which is similar to the fragmentation of 2-chloropalmitic acid, which loses HCl (6, 14, 60). This fragmentation was used for selected reaction monitoring (SRM) detection of 2-BrPA resolved by LC; 2-BrPA was quantified by comparison with the SRM detection of its stable labeled isotope, used as internal standard. The ratio of the ion intensity response of the natural 2-BrPA to that of the internal standard was linear over three orders of magnitude. Similarly, using GC-MS with negative-ion chemical ionization (NICI) detection, the ratio of the ion intensity response for 2-Br-[d4]-PALD to 2-BrPALD following derivatization to their pentafluorobenzyl (PFB) oximes is linear over three orders of magnitude. This method has previously been used to quantify 2-BrPALD (5). C57BL/6 mice (n ≥ 6) were exposed to Br2 and euthanized, and their lungs were removed and flash-frozen as indicated for the proteomics experiments. For these experiments, the specimens were packed in dry ice and sent overnight to D. A. Ford’s laboratory for analysis. Lipids were extracted by the method of Bligh and Dyer (12). Esterified and nonesterified 2-BrPA were prepared in samples that were either subjected or not subjected to base hydrolysis. 2-BrPA was then quantified by LC-MS using SRM detection under column and mobile phase conditions similar to that employed for assessing 2-chlorofatty acid levels (23). Additionally, lung lipid extracts were used to derive the PFB oxime of 2-BrPALD and other molecular species of 2-BrFALD, which were then quantified by NICI-GC-MS using 2-Br-[d4]-PALD internal standard (5).
Functional Studies in Br2 Tx Mouse Lungs and Br-Lips Tx HMECs
Measurements of lung filtration coefficient in isolated perfused lungs (n = 6).
Measurements of the Kf were performed as described previously in detail (8). In brief, mice were anesthetized with an intraperitoneal injection of pentobarbital (50 mg/kg) to achieve an adequate plane of anesthesia. Their tracheas were cannulated and connected to a mouse mechanical ventilator (Harvard Apparatus, South Natick, MA) and ventilated with 95% O2-5% CO2. Ventilation was maintained with a tidal volume of 0.2 mL (10 mL/kg), a respiratory rate of 40–60 breaths/min (ventilation of 8–12 mL/min), and 2 cmH2O of positive end-expiratory pressure throughout the experiment. Heparinization was achieved with intraperitoneal injection of 50 units of heparin immediately before tracheal cannulation to allow adequate time for systemic absorption. Next, the peritoneum was entered, the diaphragm was carefully dissected, and the thoracic cavity was exposed via a high median sternotomy. The pulmonary artery and the left atrium were cannulated sequentially via incisions in the right and left ventricles, respectively. The heart and lungs were then removed en bloc and perfused with Earle’s balanced salt solution with NaHCO3 (CAS no. 90604-29-8; Sigma Life Science) and 4% fat-free (<0.2% fat) bovine serum albumin (Albumin Fraction V; Sigma Life Science) with a measured pH between 7.35 and 7.40 ensured before lung perfusion. The perfusate was maintained at 37°C. At time of isolation, the lungs were flushed with a sufficient volume of perfusate until clear of blood. The total recirculating perfusate volume was 30 mL.
Lungs were perfused initially with a pulmonary venous pressure of 15 cmH2O maintained for 15 min and then decreased to 5 cmH2O for 15 min with flow adjusted to maintain no net change in weight for ≥10 min before measurements. Pulmonary artery and left atrial pressures were transduced with continuous monitoring using ADInstruments PowerLab 8/30 and analyzed using LabChart 8 (ADInstruments, Colorado Springs, CO). Capillary pressures were measured every 15 min using the double occlusion technique (31, 56). The Kf was calculated as the linear rate of weight gain over 15 min after a 15-cmH2O increase in pulmonary venous pressure. Values were normalized per gram of lung dry weight, measured at the end of the experiment by placing the lungs in an oven at 80°C for 48 h.
Measurements of transendothelial resistance across HMECs.
Human lung microvascular endothelial cell (HMEC) transendothelial electrical resistance (TER), a measure of endothelial permeability to lipid-insoluble molecules, was measured using an Electric Cell-substrate Impedance Sensing (ECIS) system (Applied Biophysics, Troy, NY) as described previously in detail (31). Briefly, HMECs (1 × 10⁵ cells/mL; passages 5–15; n = 6) were plated onto 8W10E arrays in normal culture medium [500 mL of DMEM, 50 mL of FBS, 5 mL of Antibiotic Antimycotic Solution (100×), Stabilized, Sigma cat. no. A5955, containing penicillin: 50,000 U/500 mL DMEM, streptomycin: 50 mg/500 mL DMEM, amphotericin B: 12 µg/500 mL DMEM] until they reached resistances of ~900 Ω, usually 2–3 days after seeding, at which time they were considered confluent. Resistance values were recorded every 15 min for the duration of the experiments. At that time, stock solutions of 16C brominated lipids (2-BrPA and 2-BrPALD; 3 mM each) were diluted to final concentrations of 100 µM in normal culture medium, and 50 µL was added into the well arrays for a final concentration of 10 µM each. Similar amounts of palmitic acid (1-hexadecanoic acid; CAS no. 57-10-3; MilliporeSigma cat. no. P0500) and palmitaldehyde (1-hexadecanalaldehyde; CAS no. 629-80-1; Sigma-Aldrich product identifier SY3H6E41694C, Synthonix cat. no. P67608) were added to control wells. Resistance values were measured continuously for the next 3 days.
Immunofluorescence, Western Blots, and Global Proteomic Measurements in HMECs
Immunofluorescence staining.
HMECs (n = 5) were cultured with DMEM, 10% FBS, and 1% antibiotics on 12-mm round coverslips in a 24-well plate until they became confluent as determined by light microscopy examination. For the Br2-treated cells, cells were exposed to Br2 at 100 ppm for 10 min and returned in an incubator vented with 95% air-5% CO2 for 6 h, as previously described for Cl2 (36). For the Br-lips treatments, cells were incubated with vehicle, 2-BrPA (10 µM), and 2-BrPALD (10 µM) or their corresponding nonbrominated compounds for 4 h. Stock solutions were diluted in normal culture medium as indicated above (under the TER measurements), which was added directly to the cells for 24 h, and cells were then immediately washed with PBS, fixed in 4% paraformaldehyde (10 min), and permeabilized in 0.3% Triton X-100 in PBS for 10 min. Cells were incubated for 30 min with antibodies against F-actin labeled with Alexa Fluor 488 (1:1,000; cat. no. A12379; Molecular Probes, Thermo Fisher Scientific, Rockford, IL) and phosphorylated VE-cadherin against the Tyr658 residue labeled with Alexa Fluor 555 (1:1,000; cat. no. ABT1760-AF555; Thermo Fisher Scientific). After washing thrice with PBS, nuclei were counterstained with DAPI (Thermo Fisher Scientific). Cells were then mounted with ProLong Gold and imaged by using a Zeiss fluorescent microscope (Carl Zeiss USA, San Diego, CA).
Measurement of RhoA and ROCK2 activities.
The Rho activity was measured and quantified by using the RhoA Activation Assay Biochem Kit (cat. no. BK036; Cytoskeleton) based on the Rhotekin pull-down assay as per the manufacturer’s instructions. In brief, HMECs (n = 6) were cultured and treated with 10 µM each palmitic acid and palmitaldehyde or 10 µM each 2-BrPA and 2-BrPALD for 15–30 min. The cell lysate was prepared in radioimmunoprecipitation assay (RIPA) buffer containing protease inhibitors (cat. no. 78425; Thermo Fisher Scientific) immediately after treatment and protein estimation was done, and equal amounts of protein were incubated with Rhotekin-RBD beads (cat. no. RT02) for 1 h at 4°C. After the beads were washed with wash buffer, proteins were removed from the beads with Laemmli buffer and then subjected to Western blotting.
Measurement of ROCK2 phosphorylation.
In brief, HMECs (n = 6) were cultured in DMEM and treated with 10 µM each palmitic acid and palmitaldehyde or 10 µM each 2-BrPA and 2-BrPALD for 15–30 min. The cell lysates were prepared in RIPA buffer containing protease inhibitors (Thermo Fisher Scientific, Rockford, IL) immediately after treatment. Protein estimation was carried out using the BCA assay. Equal amounts of protein in Laemmli buffer were loaded in 10% Tris·HCl Criterion precast gels, and proteins were transferred to PVDF membranes. Membranes were probed with ROCK2 (1:1,000 dilution; cat. no. 8236; Cell Signaling Technology, Beverly, MA) or pTyr722-ROCK2 antibody (cat. no. SAB4301564; MilliporeSigma). Bands were detected by the chemiluminescent horseradish peroxidase substrate. Protein loading was normalized by reprobing the membranes with an antibody specific to β-actin.
Proteomics analysis of HMEC.
In the last series of experiments, we treated HMECs (n = 3) with 2-BrPA and 2-BrPALD (10 µM each) for 4 h and performed the same discovery global proteomic analysis from sample preparation to systems analysis as described above [section Discovery Proteomics (Animals and HMECs)].
Statistical analysis.
The details for the statistical validation of proteomics data are shown in the pertinent sections above [Discovery Proteomics (Animals and HMECs)]. For all other studies, data are presented as means ± standard error of the mean. Statistical analysis among means was performed with analysis of variance (ANOVA; 1- or 2-way) followed by Bonferroni post hoc comparisons. Data were considered significant if P < 0.05. Data were graphed using GraphPad Prism 7 for Windows.
RESULTS
Survival (Br2-Exposed Mice)
None of the animals exposed to Br2 (600 ppm in 30 min) died during the exposure period. However, mice exhibited signs of respiratory distress, including labored breathing and flaring of the nostrils during inspiration. Respiratory rates also decreased acutely during exposure (data not shown). Approximately 50% of the mice died by 8 days after exposure, in agreement with our previous reports (Fig. 3; Refs. 32, 35). No statistically significant differences in survival were observed among male and female mice. Thus we opted to use male mice for all experiments reported in this paper to avoid variabilities associated with the estrous cycle.
Fig. 3.
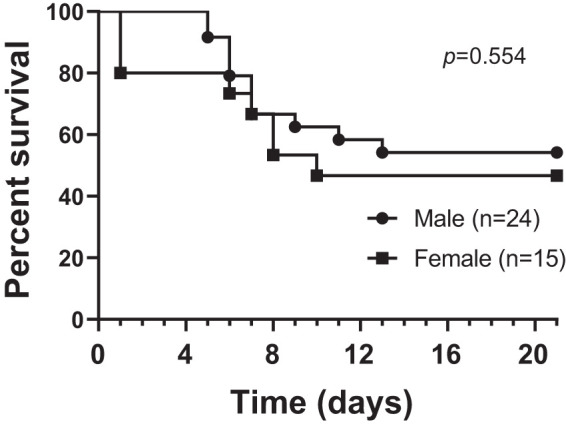
Kaplan–Meier survival curves after Br2 exposure. Adult male and female C57BL/6 mice, 8–10 wk old, were exposed to Br2 gas (600 ppm for 30 min) in environmental chambers and returned to room air as detailed in materials and methods. Mice were considered dead when they lost >30% of their initial body weight (University of Alabama at Birmingham Institutional Animal Care and Use Committee guidelines) or stopped breathing for >5 min. In the case that they were found dead, survival was calculated as the mean time between the last observation and the time of discovery. The cross-correlate P value (P = 0.554) was calculated at ~0.6 across all time points, indicating that there was no significant difference in terms of pathology between the 2 groups.
Global Proteomics and Systems Biology Analysis (After Br2-Exposed Mice)
For the global proteomics workflow carried out on lung tissues, we applied a standard 1D-PAGE-LC-MS2 approach, whereby the proteins extracted from an entire lung specimen for each animal were loaded onto a 1-dimensional (1D) denaturing gel and separated by MW halfway. The entire lane for each sample was cut into 3 equally sized MW fractions and digested with trypsin, and the resultant peptides for each fraction were then separated using nano-HPLC and analyzed in line with a high-resolution MS2 mass spectrometer (Fig. 2). This approach yielded 1,623 proteins with >99% confidence and <1% FDR that were present in the lungs of both the experimental (24 h after Br2 Tx) and control (24 h after air) groups (Supplemental Table S1; all supplemental material is available at https://doi.org/10.6084/m9.figshare.12229463). Quantification was carried out using normalized spectral counting (NSCs), and the applied pairwise statistical analysis (as described in materials and methods) yielded 95 differentially abundant proteins (Supplemental Table S2), with 34 increased (Table 1) and 61 (Table 2) decreased in Br2-exposed versus air controls. These data were plotted to better visualize the entire data set while highlighting the most significantly changed proteins (Fig. 4, A and B; Supplemental Tables S1 and S2). The volcano plot (Fig. 4B) illustrates the distribution of all data points derived from the entire data set, with upper limits (above the line) indicating statistically significant changes and outer limits (to the right and left of each vertical line) indicating significant fold changes as outlined in materials and methods under statistics. Please note that although fold change is visualized as log fold (log2), with a cutoff value of ±1.5 applied to fold changes before logging the data, this value equates to the indicated ±0.6 log2 limits illustrated in the figure. Various proteins that play a role in vascular permeability are highlighted within the plot by arrows and network names.
Table 1.
Proteomic changes in mouse lung: Br2-treated vs. air controls (34 proteins increased)
| Statistics |
UniProtKB, DAVID, and GeneGo MetaCore Definitions | ||||||
|---|---|---|---|---|---|---|---|
| UniProtKB Name | UniProt ID | Entrez ID | Network ID | SAM | t-Test P Value | Fold∆ (Br2/Air) | GO Biological Processes |
| CD177 antigen | Q8R2S8 | 68891 | NB1*ठ| 2.96 | 0.017 | 8.0 | Cell-to-cell junction/adhesion; innate immune response; regulated endocytosis |
| Cathelin-related antimicrobial peptide | P51437 | 12796 | CAMPठ| 2.11 | 0.001 | 4.5 | Cytokine response and regulation; regulated exocytosis |
| Serum paraoxonase/arylesterase 1 | P52430 | 18979 | PON1 | 1.40 | 0.047 | 3.3 | Aromatic compound catabolic process; positive regulation of binding |
| Heterogeneous nuclear ribonucleoprotein L | Q8R081 | 15388 | hnRNP L† | 2.99 | 0.002 | 3.0 | Regulation of adhesion molecules; RNA binding and processing |
| Myeloperoxidase | P11247 | 17523 | PERMठ| 1.06 | 0.019 | 2.9 | Peroxidase activity; defense response; regulated exocytosis |
| Tubulin-specific chaperone D | Q8BYA0 | 108903 | TBCD* | 4.69 | 0.006 | 2.8 | Adherens and tight junction assembly; β-tubulin binding |
| Neutrophil gelatinase-associated lipocalin | P11672 | 16819 | NGALठ| 1.07 | 0.044 | 2.8 | Innate immune response; iron homeostasis; regulated exocytosis |
| KN motif and ankyrin repeat domain-containing protein 2 | Q8BX02 | 235041 | ANKRD25* | 0.96 | 0.030 | 2.6 | Regulation of Rho signal transduction; apoptotic process; stress fiber assembly |
| Squamous cell carcinoma antigen recognized by T cells 3 | Q9JLI8 | 53890 | Tip110 | 0.94 | 0.048 | 2.6 | Histone and RNA binding; cellular morphogenesis |
| Lmo7 protein | B7ZN52 | 380928 | LMO7† | 0.90 | 0.022 | 2.6 | Regulation of cell adhesion; adherens junction; actinin binding |
| 60S ribosomal protein L34 | Q9D1R9 | 68436 | RPL34 | 0.89 | 0.035 | 2.5 | Translation |
| 40S ribosomal protein SA | P14206 | 16785 | LAMR1* | 0.89 | 0.041 | 2.4 | Cell-to-cell adhesion; differentiation |
| 1,4-alpha-glucan-branching enzyme | Q9D6Y9 | 74185 | GLGB | 2.15 | 0.011 | 2.4 | Carbohydrate metabolic process |
| 60S ribosomal protein L26 | B1ARA5 | 19941 | RPL26 | 1.34 | 0.005 | 2.3 | Translation |
| Protein S100A9 | P31725 | 20202 | Calgranulin B†/S100‡§ | 1.46 | 0.014 | 2.3 | Actin cytoskeleton reorganization; innate immune response; regulated exocytosis |
| Endoplasmic reticulum resident protein 29 | P57759 | 67397 | ERp29 | 0.95 | 0.034 | 2.2 | Regulation of gene and protein expression; protein secretion and phosphorylation |
| Estradiol 17-β-dehydrogenase 8 | P50171 | 14979 | HSD17B8 | 1.72 | 0.007 | 2.2 | Estrogen and androgen metabolic process |
| Myo1b | Q7TQD7 | 17912 | MYO1B*‡ | 1.63 | 0.012 | 2.2 | Actin binding and filament bundle assembly; vesicle-mediated transport |
| Guanine nucleotide-binding protein subunit alpha-13 | P27601 | 14674 | G-protein alpha-12 family† | 1.33 | 0.028 | 2.2 | Regulation of cell shape and migration; Rho signal transduction; G protein receptor signaling |
| 60S ribosomal protein L36 | P47964 | 54217 | RPL36 | 1.02 | 0.026 | 2.1 | Ribosome; synapse |
| Actin-related protein 2/3 complex subunit 2 | Q9CVB6 | 76709 | ARPC2*§ | 0.89 | 0.034 | 2.1 | Actin cytoskeleton reorganization; immune response-associated |
| 60S ribosomal protein L22 | P67984 | 19934 | RPL22* | 0.90 | 0.037 | 2.1 | Focal adhesion component; heparin binding; glutamatergic synapse |
| Sorbin and SH3 domain-containing protein 1 | Q62417 | 20411 | SORBS1* | 0.78 | 0.036 | 2.0 | Focal adhesion assembly; insulin receptor signaling |
| Coronin-1C | Q9WUM4 | 23790 | CORO1C* | 1.07 | 0.038 | 1.9 | Actin cytoskeleton organization; endosomal transport |
| Alpha-2-HS-glycoprotein | P29699 | 11625 | Fetuin-Aठ| 0.79 | 0.048 | 1.9 | Acute phase and inflammatory response; regulated exocytosis |
| Succinate dehydrogenase [ubiquinone] flavoprotein subunit, mitochondrial | Q8K2B3 | 66945 | SDHA | 0.92 | 0.033 | 1.8 | Nervous system development; succinate metabolic process |
| Collagen alpha-1(XIV) chain | Q80X19 | 12818 | Collagen XIV* | 0.71 | 0.048 | 1.8 | Cell adhesion; collagen fibril organization |
| A-kinase anchor protein 2 | O54931 | 11641 | AKAP2 | 1.00 | 0.050 | 1.8 | Mediate multiprotein complex protein kinase A |
| Electron transfer flavoprotein subunit β | Q9DCW4 | 110826 | ETFB | 0.78 | 0.039 | 1.7 | Fatty acid β-oxidation |
| Adiponectin | Q60994 | 11450 | Adiponectin | 0.98 | 0.040 | 1.6 | Response to ox-stress, cAMP, epinephrine, and insulin; glucose homeostasis, etc. |
| Hsp90 co-chaperone Cdc37 | Q61081 | 12539 | CDC37§ | 0.98 | 0.040 | 1.6 | Regulation interferon-γ signaling; protein folding and stabilization |
| Alpha-crystallin B chain | P23927 | 12955 | Alpha crystallin B | 0.91 | 0.045 | 1.6 | Response and regulation of apoptosis and ox-stress |
| Haloacid dehalogenase-like hydrolase domain-containing protein 2 | Q3UGR5 | 76987 | HDHD2 | 5.20 | 0.000 | 1.5 | Phosphatase activity; metal ion binding |
| Isoaspartyl peptidase/L-asparaginase | Q8C0M9 | 66514 | Asrgl1 | 5.20 | 0.000 | 1.5 | Asparagine catabolic process |
All proteins listed were identified as significantly changed in Br2-treated vs. air control-treated animal lungs. This is from the top-95 protein list (Supplemental Table S2) with fold changes (∆) of at least +1.5. All proteins have been gene ontology (GO)-annotated using a combination of UniProtKB, Database for Annotation, Visualization and Integrated Discovery (DAVID), and GeneGo MetaCore definitions. ID, identifier; ox, oxidative; SAM, significance analysis of microarray.
Permeability-associated (Fig. 7),
permeability-associated and highlighted in volcano plot (Fig. 4B),
regulated exocytosis-associated,
immune response-associated.
Table 2.
Proteomic changes in mouse lung: Br2-treated vs. air controls (61 proteins decreased)
| Statistics |
UniProtKB, DAVID, and GeneGo MetaCore Definitions | ||||||
|---|---|---|---|---|---|---|---|
| UniProtKB Name | UniProt ID | Entrez ID | Network ID | SAM | t-Test P Value | Fold∆ (Br2/Air) | GO Biological Processes |
| RAB14 protein variant | Q50HX3 | 68365 | Rab-14‡§ | 1.35 | 0.006 | −1.5 | Regulated exocytosis; immune response-associated |
| CDGSH iron-sulfur domain-containing protein 1 | Q91WS0 | 52637 | CISD1 | 1.07 | 0.019 | −1.5 | Regulation of cellular respiration; iron ion binding |
| E3 ubiquitin-protein ligase HUWE1 | Q7TMY8 | 59026 | HUWE1‡§ | 1.05 | 0.020 | −1.5 | Base excision repair; exocytosis; immune response-associated |
| Cullin-associated NEDD8-dissociated protein 1 | Q6ZQ38 | 71902 | TIP120A‡§ | 0.85 | 0.042 | −1.6 | Protein ubiquitination; exocytosis; innate immune response |
| Peptidyl-prolyl cis-trans isomerase FKBP2 | P45878 | 14227 | FKBP2 | 0.70 | 0.048 | −1.6 | Peptidyl-prolyl cis-trans isomerase activity |
| Heterogeneous nuclear ribonucleoprotein A1 | P49312 | 15382 | hnRNP A1 | 0.82 | 0.031 | −1.6 | RNA binding and splicing |
| Ras-related protein Rab-1A | Q5SW87 | 19324 | Rab-1A | 1.04 | 0.038 | −1.6 | GTPase binding and activity |
| Bleomycin hydrolase | Q8R016 | 104184 | Bleomycin hydrolase | 1.93 | 0.001 | −1.7 | Response to drug and toxic substance; peptidase activity |
| Alcohol dehydrogenase [NADP(+)] | Q9JII6 | 58810 | ALDX | 1.01 | 0.019 | −1.7 | Ascorbic acid biosynthetic process; detoxification of aldehyde |
| Niban-like protein 1 | Q8R1F1 | 227737 | FAM129B* | 0.74 | 0.046 | −1.7 | Negative regulation of apoptosis; regulation of cell-to-cell adhesion; adherens junction |
| Ras suppressor protein 1 | Q01730 | 20163 | RSU-1* | 1.66 | 0.002 | −1.7 | Positive regulation of cell-substrate adhesion; Ras signal transduction |
| JNK-interacting leucine zipper protein long form | B8X349 | 70834 | SPAG9 | 1.15 | 0.016 | −1.7 | Mitogen-activated protein kinase scaffold activity |
| Stathmin | P54227 | 16765 | Stathmin* | 0.94 | 0.036 | −1.7 | Tubulin binding; regulation of cytoskeleton organization; Rho signal transduction |
| Coatomer subunit delta | Q5XJY5 | 213827 | COPD‡ | 0.89 | 0.024 | −1.7 | Golgi localization and vesicle transport; Golgi apparatus |
| Heat shock protein HSP 90-beta | P11499 | 15516 | HSP90‡§ | 0.79 | 0.047 | −1.8 | Regulation of apoptosis, protein kinase B signaling, exocytosis and immune response, etc. |
| Tetratricopeptide repeat protein 38 | A3KMP2 | 239570 | TTC38 | 0.83 | 0.042 | −1.8 | Structural motif; protein-protein interaction |
| Selenium-binding protein 1 | P17563 | 20341 | SELENBP1 | 0.95 | 0.038 | −1.8 | Selenium binding; methane thiol oxidase; protein transport |
| ATP-citrate synthase | Q91V92 | 104112 | ACLY‡§ | 0.83 | 0.036 | −1.8 | Citrate and oxaloacetate metabolic process; immune response-associated; exocytosis |
| ATP-dependent RNA helicase A | O70133 | 13211 | DDX9§ | 0.79 | 0.035 | −1.9 | Response to stress; innate immune response; regulation of cytokines |
| Dimethylaniline monooxygenase [N-oxide-forming] 2 | Q8K2I3 | 55990 | FMO2 | 1.15 | 0.016 | −1.9 | Xenobiotic, toxin, drug, and oxygen metabolic process |
| Cap-specific mRNA (nucleoside-2'-O-)-methyltransferase 1 | Q9DBC3 | 74157 | CMTR1 | 1.29 | 0.023 | −1.9 | mRNA methylation |
| STE20-like serine/threonine-protein kinase | O54988 | 20874 | SLK* | 1.07 | 0.021 | −1.9 | Apoptotic process; regulation of focal adhesion assembly; protein kinase signaling |
| Protein Sec24c | G3X972 | 218811 | Sec24‡ | 1.00 | 0.022 | −1.9 | Golgi vesicle-mediated transport; enables zinc ion and SNARE binding |
| Hypoxia upregulated protein 1 | Q9JKR6 | 12282 | HYOU1*‡ | 1.09 | 0.014 | −1.9 | Regulate vascular cell adhesion molecule-1; response to hypoxia and stress; exocytosis |
| Proteasome-associated protein ECM29 homolog | Q6PDI5 | 230249 | ECM29 | 0.96 | 0.022 | −1.9 | Proteasome assembly; ubiquitin ERAD pathway |
| Junction plakoglobin | Q02257 | 16480 | Plakoglobin*‡§ | 0.79 | 0.034 | −2.0 | Cell-to-cell adhesion and migration; exocytosis; immune response; angiogenesis |
| Protein Sec24d | Q6NXL1 | 69608 | Sec24‡ | 1.37 | 0.031 | −2.0 | SNARE and zinc ion binding; Golgi vesicle-mediated transport |
| Cytoplasmic dynein 1 heavy chain 1 | Q9JHU4 | 13424 | Dynein 1, heavy chain‡§ | 1.24 | 0.020 | −2.0 | Golgi vesicle-mediated transport; immune response-associated; stress granule assembly |
| AP-2 complex subunit beta | Q9DBG3 | 71770 | Beta-adaptin 2 | 1.34 | 0.005 | −2.0 | Clathrin binding and coat assembly; regulation of neuronal death; regulation of endocytosis |
| Coatomer subunit beta' | O55029 | 50797 | COPB2 | 0.89 | 0.023 | −2.0 | Intracellular Golgi vesicle-mediated transport; intracellular protein and toxin transport |
| Glutathione S-transferase Mu 1 | P10649 | 14862 | GSTM1 | 0.88 | 0.028 | −2.0 | Response to drug; glutathione metabolic process; glutathione transferase activity |
| Transforming growth factor beta-1-induced transcript 1 | Q62219 | 21804 | HIC5† | 1.57 | 0.006 | −2.1 | Endothelial cell migration; Wnt and Tgfb signaling; response to stress |
| Eukaryotic translation initiation factor 5 | P59325 | 217869 | eIF5 | 1.15 | 0.034 | −2.1 | Activation of GTPase activity; translation activity |
| Phosphofurin acidic cluster sorting protein 1 | Q8K212 | 107975 | PACS-1 | 1.04 | 0.043 | −2.1 | Ion channel binding; COPI-coated vesicle |
| Deoxynucleoside triphosphate triphosphohydrolase | Q60710 | 56045 | SAMHD1§ | 0.73 | 0.044 | −2.1 | Innate immune response; response to DNA damage |
| Long-chain specific acyl-CoA dehydrogenase, mitochondrial | P51174 | 11363 | ACADL | 0.84 | 0.033 | −2.1 | Regulation of fatty acid biosynthesis; temperature homeostasis; lipid catabolic process |
| Regulator of nonsense transcripts 1 | Q9EPU0 | 19704 | RENT1 | 1.07 | 0.023 | −2.1 | DNA replication and repair; regulation of telomere maintenance |
| Nuclear pore complex protein Nup214 | Q80U93 | 227720 | NUP214* | 0.92 | 0.050 | −2.1 | Regulation of nuclear envelope permeability; regulation of cell cycle |
| Alpha-glucosidase 2 alpha neutral subunit | A1A4T2 | 14376 | GANAB | 1.26 | 0.014 | −2.2 | Carbohydrate metabolic process; N-glycan processing |
| Eukaryotic translation initiation factor 4B | Q8BGD9 | 75705 | eIF4B | 1.50 | 0.017 | −2.2 | Neuronal postsynapse; translation initiation |
| d-dopachrome decarboxylase | O35215 | 13202 | DDT§ | 1.00 | 0.036 | −2.2 | Regulation of ERK1 and ERK2 cascade; regulation of inflammatory process |
| SEC14-like protein 4 | Q8R0F9 | 103655 | SEC14L4 (TAP3) | 1.11 | 0.020 | −2.3 | Lipid binding |
| 182 kDa tankyrase-1-binding protein | P58871 | 228140 | TAB182* | 1.05 | 0.012 | −2.4 | Double-strand break repair; adherens junction; regulation of protein phosphorylation |
| Programmed cell death 6-interacting protein | Q9WU78 | 18571 | Alix*‡ | 1.13 | 0.010 | −2.6 | Regulation of membrane permeability; apoptotic process; exosome assembly and secretion |
| 1-Phosphatidylinositol 4,5-bisphosphate phosphodiesterase gamma-1 | Q62077 | 18803 | PLC-gamma†§ | 1.55 | 0.007 | −2.6 | Regulation of endothelial cell migration and apoptosis; T cell receptor signaling |
| Proteasome activator complex subunit 1 | P97371 | 19186 | PSME1§ | 1.40 | 0.034 | −2.6 | Regulation of proteasomal protein catabolic process; antigen processing and presenting |
| E3 ubiquitin-protein ligase UBR4 | A2AN08 | 69116 | UBR4‡ | 1.41 | 0.006 | −2.7 | Ubiquitin-dependent protein catabolic process; calmodulin binding; regulated exocytosis |
| GDH/6PGL endoplasmic bifunctional protein | Q8CFX1 | 100198 | G6PE | 1.14 | 0.011 | −2.7 | Carbohydrate metabolic process; pentose phosphate shunt |
| Epidermal growth factor receptor substrate 15-like 1 | Q60902 | 13859 | EPS15R | 0.99 | 0.042 | −2.7 | Endocytosis; calcium ion binding |
| AP-3 complex subunit beta-1 | Q9Z1T1 | 11774 | AP-3 beta subunits‡§ | 2.26 | 0.001 | −2.7 | Antigen processing and presentation; vesicle-mediated transport |
| Signal transducer and activator of transcription 1 | P42225 | 20846 | STAT1§ | 1.01 | 0.034 | −2.7 | Cellular response to cytokines; receptor signaling pathway via JAK-STAT, etc. |
| Dynein light chain 2, cytoplasmic | D6RIN4 | 68097 | DLC2/DYNLL‡§ | 1.96 | 0.001 | −2.9 | Microtubule-based process; regulated exocytosis; immune response-associated |
| 40S ribosomal protein S10 | P63325 | 67097 | RPS10† | 1.66 | 0.005 | −3.0 | Ribosomal small subunit assembly; focal adhesion component |
| Ribosomal protein S23 | Q497E1 | 66475 | RPS23 | 1.43 | 0.018 | −3.0 | Translation |
| Coagulation factor XIII A chain | Q8BH61 | 74145 | Coagulation factor XIII‡ | 4.34 | 0.004 | −3.1 | Blood coagulation; protein cross-linking; regulated exocytosis |
| Uteroglobin | Q06318 | 22287 | Uteroglobin§ | 0.91 | 0.047 | −3.1 | Regulation and response to cytokine; regulation of inflammation; phospholipase A2 inhibition |
| 60S acidic ribosomal protein P2 | P99027 | 67186 | RPLP2* | 0.93 | 0.035 | −3.2 | Translational elongation; focal adhesion component |
| Importin-7 | Q9EPL8 | 233726 | RANBP7§ | 3.37 | 0.001 | −3.2 | Innate immune response; histone, SMAD, and Ran GTPase binding |
| Ras-related protein Rab-11B | P46638 | 19326 | Rab-11B*‡ | 0.86 | 0.047 | −3.4 | Cell-to-cell adhesion and migration; regulated exocytosis; myosin V binding |
| Serine/threonine-protein kinase WNK1 | P83741 | 232341 | WNK1*§ | 2.92 | 0.005 | −4.1 | Cellular response to Ca ion; negative regulation of cell-to-cell adhesion; regulation of T cell |
| Four and a half LIM domains 1, isoform CRA_b | A2AEX8 | 14199 | FHL1 (SLIM1)† | 1.00 | 0.033 | −4.1 | Colocalize with integrins at cell adhesion sites; muscle organ development |
All proteins listed were identified as significantly changed in Br2-treated vs. air control-treated animal lungs. This is from the top-95 protein list (Supplemental Table S2) with fold changes (∆) of at least −1.5. All proteins have been gene ontology (GO)-annotated using a combination of UniProtKB, Database for Annotation, Visualization and Integrated Discovery (DAVID), and GeneGo MetaCore definitions. COPI, coat protein complex I; ERAD, endoplasmic reticulum-associated degradation; ID, identifier; SAM, significance analysis of microarray; SNARE, soluble N-ethylmaleimide-sensitive factor attachment protein receptor; Tgfb, transforming growth factor-β.
Permeability-associated (Fig. 7),
permeability-associated and highlighted in volcano plot (Fig. 4B),
regulated exocytosis-associated,
immune response-associated.
Fig. 4.

Global protein changes in air vs. Br2. Adult male C57BL/6 mice, 8–10 wk old, were exposed to Br2 gas (600 ppm for 30 min) or air in environmental chambers and returned to room air as detailed in materials and methods. Twenty-four hours later, their lungs were removed and proteins were processed for global proteomics analysis as discussed in materials and methods. A: Venn diagram demonstrating the total number of proteins identified across both groups in addition to those proteins found to be significantly changed following exposure to Br2 (increased vs. the other group). B: volcano plot of the log10 P value vs. log2 fold change (Br2/air) demonstrating the distribution of the entire data set of proteins with upper limits (above the line) indicating statistically significant changes and outer limits (to the right and left of each line) indicating significant fold changes as outlined in materials and methods under statistics. Note that although fold change is visualized as log2, the cutoff value of ±1.5 was applied to the fold change before logging, thereby yielding the indicated ±0.6 limits. Various proteins that play a role in vascular permeability are identified by the arrows.
For the purposes of qualitatively visualizing the most significant proteome changes, we pulled out those proteins from Tables 1 and 2 presenting with at least a twofold change while also passing both statistical tests (SAM > 0.8, P < 0.05). Two visually confirming qualitative analyses were carried out on the resultant and highly significant 53 proteins as indicated by network name within Fig. 5A using a 2-dimensional hierarchical clustering analysis heat map and a principal component analysis (Fig. 5B). These figures visually verify the statistical significance of the marked differences identified in proteins not only between the 2 groups, but also for each protein across all animals. In each case, a close clustering of proteins of the 2 different groups (24 h after exposure to Br2 vs. air) is appreciable.
Fig. 5.

Heat map and principal component analysis (PCA) plots for proteins exposed to Br2 vs. air. Adult male C57BL/6 mice, 8–10 wk old, were exposed to Br2 gas (600 ppm for 30 min) in environmental chambers and returned to room air as detailed in materials and methods. Twenty-four hours later, their lungs were removed, and proteins were processed for global proteomics analysis as discussed in materials and methods. The top 53 proteins (pulled from Tables 1 and 2) that passed a 2-tiered statistics test with −2.0≤|≥2.0 fold change were used for these analyses. A: the 2-dimensional hierarchical analysis heat map demonstrates which proteins are increased (red) or decreased (blue) in Br2- vs. air-treated mice. Notice similar behavior for each animal in each group and each protein across groups. No outliers were indicated. B: PCA complements the heat map by using a similar cluster approach that determines which animal (based on protein quantification for all proteins in the top list) is similar across all animals analyzed. Notice tight clustering for air (blue)- and Br2-exposed mice (yellow) with a clear separation between the 2 groups. The number in parenthesis denotes the animal number for each group analyzed.
Systems biology analysis.
The top 96 significantly differential protein list (Tables 1 and 2) was then utilized for systems biology analysis. This allowed us to identify key gene ontology (GO) annotations listed in the tables in addition to focusing on GO localizations and biological functions associated with Br2 exposure. Following this analysis, pie charts were generated to better visualize the more common cellular locations that the differential proteins tended to exist for overlapping animal and HMEC studies (Fig. 6A; Supplemental Table S3) in addition to the animal and HMEC overlapping biological processes following Br2 exposure (Fig. 6B; Supplemental Table S4). The primary overlapping cellular and biological relationships are highlighted within discussion. The cellular localization analysis revealed that the majority of significantly changed proteins are known to associate within seven different compartments [1) focal adhesion/adherens/anchoring/cell junction, 2) extracellular vesicle and extracellular space, 3) ribosomal, 4) endoplasmic reticulum, 5) cytosol, 6) synapse, and 7) ribosome]. Similarly, the biological processes associated with these proteins indicate that nine primary cellular changes are taking place; whereby we are especially interested in 1) vesicle-mediated exocytosis, 2) immune response and neutrophil activation processes, and 3) general transport and secretion-based mechanisms. Because of our specific interest in both “overall” and vascular changes in tissue permeability, we have identified those proteins associated with similar corresponding cellular localized and biological processes. For that purpose, we have identified 30 proteins associated with cell junction, cell-to-cell interactions, and cell adhesion, which are all visualized in a bar graph (Fig. 7).
Fig. 6.

Gene ontology (GO)-annotated cellular localization and biological processes were identified for proteins affected by exposure to Br2. Adult male C57BL/6 mice, 8–10 wk old, were exposed to Br2 gas (600 ppm for 30 min) in environmental chambers and returned to room air as detailed in materials and methods. System analysis using the top 95 statistically significant proteins with a Br2/air fold change of at least ±1.5 (Tables 1 and 2; Supplemental Table S2) allowed us to categorize them according to cellular locations (A) and biological processes (B). The GO annotations can be found in Supplemental Tables S3 and S4. The number of proteins associated with each location or process were summed and normalized to 100 (of note, each protein can be associated with >1 location or process). The resultant pie charts are indicative of the normalized percentage of proteins associated with each category within cellular localizations and biological functions. We have added an asterisk next to all segments that we are particularly interested in for each pie chart; these cellular locations and biological functions are of interest.
Fig. 7.

Relative changes in abundance of proteins associated with vascular permeability. Relative abundance of the 30 proteins [by gene ontology (GO) annotation; Supplemental Tables S3 and S4] within the top-95 list that are known to associate with cell junction and adhesion as described for each protein in Tables 1 and 2 and Supplemental Table S2 is depicted. The protein names were converted to GO identifiers, which are listed along with their UniProtKB names in Tables 1 and 2. Values as generated in GraphPad Prism are presented as means ± standard deviation (n = 4 for each value). Each value in the 24 h after Br2 (600 ppm/30 min) is statistically different from its corresponding air value (P < 0.05, t test).
Biological Measurements of Brominated Lipids in Mice
Based on previous studies (23), the levels of Br-lips, 2-BrPA, and 2-BrPALD are believed to be major biologically reactive intermediates in Br2-exposed mice. These intermediates we, therefore, quantified in the lungs of Br2-treated mice. The 16C adducts were found to exist at significantly high concentrations in lung tissues following Br2 treatments from 30 min up to 24 h (Fig. 8, A and B). 2-BrPALD also reacts readily with glutathione, which exists in abundant quantities in lung tissue (18); as a result, significant levels of the glutathionylated 2-GS-PALD adducts (Fig. 1) were also observed in lung tissue 4 h after exposure (data not shown).
Fig. 8.

Exposure of mice to Br2 leads to formation of brominated lipids (Br-lips). Br2 and Br-lips increase microvascular permeability both in vivo and ex vivo. A and B: mice were exposed to Br2 (600 ppm for 30 min) and returned to room air for the indicated periods of time. At those times mice were euthanized, their lungs were removed, and both 2-bromopalmitic acid (2-BrPA; A) and 2-bromopalmitaldehyde (2-BrPALD; B) were quantified by mass spectrometry. C and D: each point represents 1 mouse. C: C57BL/6 mice were exposed to Br2 (600 ppm for 30 min) and returned to room air. At 24 h after exposure, all mice were euthanized, and their lungs were removed. The filtration coefficient (Kf) was measured as described in materials and methods. Data shown are all values (each point corresponds to a different mouse) as well as means ± 1 SE; n = 6 for each group. D: human lung microvascular cells were cultured on Electric Cell-substrate Impedance Sensing (ECIS) plates in DMEM with 10% FBS and 1% antibiotics until they reached confluence (resistance > 800 Ω); they were then incubated with either vehicle alone or a mixture of either 10 µM each PA and PALD or 10 µM 2-BrPA and 2-BrPALD. Transendothelial resistance (TER) was measured every hour for ≤25 h and expressed as the ratio at each time point divided by the control value (values are means ± 1 SE; n = 6 for each group).
Functional Studies in Br2 Tx Mouse Lung and Br-Lips Tx HMECs
Data illustrated in the mouse global proteomics Br2 study (above) indicate that 30 of the 95 significantly affected proteins (~32%) are involved in the cell junction, cell-to-cell interactions, and cell adhesion category, many of which are known to contribute to the control of vascular permeability (Fig. 7; Tables 1 and 2; Supplemental Table S2). Thus our next series of experiments aimed to identify whether exposure of mice to Br2 or HMEC to brominated lipids, respectively, caused increased permeability. We exposed mice to Br2 (600 ppm for 30 min) and then returned them to ambient air. Twenty-four hours later, we removed their lungs and measured the filtration coefficient (Kf), as described in materials and methods. Our data (Fig. 8C) indicate that there was a threefold increase in Kf at 24 h after Br2 exposure compared with control (air). Kf values revealed two clusters at 24 h after Br2 exposure with 50% of the mice demonstrating a twofold increase and the remaining 50% increasing fourfold. Kf values for control mice exposed to air showed little variance.
Vascular permeability changes in human lung microvascular endothelial cells.
To gain additional insight as to Br2-induced changes in vascular permeability while also identifying the proteins involved, we incubated human microvascular cells with Br-lips, 2-BrPA, and 2-BrPALD at 10 µM each compared with the same concentrations of nonbrominated palmitate and palmitaldehyde. We then measured changes in TER, as illustrated (Fig. 8D). Br-lips, but not the nonbrominated lips, caused a significant decrease of TER, consistently from just a few hours until the final 24-h time point at approximately twofold.
Immunotargeted and Global Proteomic Measurements in HMECs Tx Br2 and Br-Lips
Proteins associated with vascular permeability are altered following exposure of HMECs to Br-lips.
Pathological changes in F-actin stress fiber formation, internalization of VE-cadherin phosphorylation (Tyr658), and dysregulated/disrupted zona occludens-1 (ZO-1) in paracellular junctions were all observed in Br-lips Tx HMECs, and all are indicators of increased permeability. We illustrated the appearance of F-actin stress fibers (Fig. 9A) and internalization of phosphorylated VE-cadherin (Fig. 9B) along with marked disruption of ZO-1 staining in paracellular junctions of HMECs (Fig. 9C) following incubation with 2-BrPA and 2-BrPALD (10 µM each) compared with vehicle alone or nonbrominated PA and PALD lips for 24 h. Similarly, exposure of these cells to Br2 (100 ppm) for 10 min also caused significant internalization of phosphorylated VE-cadherin and appearance of F-actin fibers (Fig. 10).
Fig. 9.

Exposure of human lung-derived microvascular endothelial cells with brominated lipids disrupts/activates markers of cell permeability. Human lung microvascular cells were cultured with DMEM, 10% FBS, and 1% antibiotics until confluent as determined by light microscopy examination. They were then incubated with vehicle, 2-bromopalmitic acid (2-BrPA; 10 µM), 2-bromopalmitaldehyde (2-BrPALD; 10 µM), or their corresponding nonbrominated compounds for 24 h. At that time, cells were immunostained with antibodies against F-actin (A; green), phosphorylated (phospho-) VE-cadherin against the Tyr658 residue (B; red) and F-actin (B; green), and zona occludens-1 (ZO-1; C; green). Nuclei were counterstained with DAPI (blue color). Notice the appearance of F-actin stress fibers (top right), the appearance of red color (middle right) indicating the internalization of VE-cadherin, in addition to the disruption of ZO-1 in cells treated with brominated lipids. Characteristic figures are illustrated, which were reproduced ≥5 times with different cells and on 2 different days.
Fig. 10.

Exposure of human lung-derived microvascular endothelial cells with Br2 disrupts/activates markers of cell permeability. Human lung microvascular cells were cultured with DMEM, 10% FBS, and 1% antibiotics until confluent as determined by light microscopy examination. They were then exposed to Br2 (media infused up to 100 ppm for 10 min) and returned in an incubator vented with 95% air-5% CO2. Six hours later, cells were immunostained with antibodies against phosphorylated (phospho-) VE-cadherin (P-Tyr658; red) and F-actin (green). Nuclei were counterstained with DAPI (blue color). Notice the appearance of F-actin stress fibers, in addition to the appearance of red color, indicating internalization of phospho-VE-cadherin in cells treated with Br2. These are characteristic figures, which were reproduced ≥5 times with different cells over 2 different days.
Incubation of HMECs to Br-lips upregulates and activates RhoA/phosphorylated RhoA and ROCK2/phosphorylated ROCK2.
To gain additional understanding on the mechanisms responsible for the increase in vascular permeability, we incubated HMECs with Br-lipids as discussed above and then measured activation of RhoA and ROCK2. As illustrated in Fig. 11, Br-lips induced phosphorylation (activation) of both RhoA (Fig. 11, A and B) and ROCK2 (Fig. 11, C and D), but not ROCK1 (data not shown), within 30 min after incubation.
Fig. 11.

Incubation of human lung-derived microvascular endothelial cells with brominated lipids activates RhoA and ROCK2. Human lung microvascular cells were cultured with DMEM, 10% FBS, and 1% antibiotics until confluent as determined by light microscopy examination. They were then incubated with vehicle, 2-bromopalmitic acid (2-BrPA; 10 µM), and 2-bromopalmitaldehyde (2-BrPALD; 10 µM) or their corresponding nonbrominated compounds for 30 min. At that time, cell lysates were prepared as indicated in materials and methods; for RhoA, equal amounts of protein were immunoenriched, washed, and subjected to Western blotting following 1-dimensional PAGE immediately on return to room air. RhoA activity and protein levels were measured as mentioned in materials and methods. Then, the ratio of active RhoA to total RhoA for after treatment was divided by the corresponding air control ratio for the same experiment (fold increase). A: characteristic gel showing phosphorylated (p-) RhoA and total RhoA. B: graph of ratios, active p-RhoA to total RhoA. Individual values as well as means ± 1 SE are shown. C: characteristic Western blot illustrating p-ROCK2 and total ROCK2. D: graph of ratios, active p-ROCK2 to total ROCK2; values were expressed as fold increase compared with untreated controls. Individual points and means ± 1 SE are shown; analysis of variance was followed by Tukey test.
HMEC (Br-lips) proteomics, Western blot, and immunofluorescence combined results for pathway analysis.
Human lung microvascular cells were cultured with DMEM, 10% FBS, and 1% antibiotics until confluent as determined by light microscopy examination. They were then incubated with vehicle, 2-BrPA (10 µM), and 2-BrPALD (10 µM) or their corresponding nonbrominated compounds for 30 min. At that time, cell lysates were prepared as indicated in materials and methods for discovery proteomics analysis; 1,127 proteins were identified with high confidence (Supplemental Table S5). The most significant signaling pathways were then identified using GeneGo MetaCore where 106 proteins were found to be significantly changed in abundance (Table 4; Supplemental Table S6). As indicated previously, the discovery proteomics data were complemented with Western blot analysis carried out on key permeability-associated proteins along with phosphorylation status in addition to cytoimmunofluorescence studies to visualize cellular disruption, which were combined for the following pathway analysis. The top pathway (Fig. 12; Supplemental Fig. S1) included cytoskeleton remodeling, regulation of actin cytoskeleton organization by the kinase effectors of Rho GTPases, in agreement with the physiological changes we observed in our experiments. The primary proteins identified in the pathway shown include α-actinin, ezrin, radixin, and moesin proteins, talin, myosin heavy chain, RhoA, ROCK, actin cytoskeletal, vinculin, RhoA-related, F-actin cytoskeleton, and moesin. There were a number of additional cytoskeleton remodeling/permeability-associated proteins and pathways identified similarly that are indicated in Tables 3 and 4, respectively. There were 30 out of 106 significantly changed proteins that were found to be permeability-associated by way of GeneGo MetaCore, UniProtKB, and DAVID GO (Table 3; Supplemental Tables S3 and S4). The localization and processes mapped using MetaCore were cross-correlated to similar mouse lung-derived proteins. The majority of proteins, across species, mapped by cellular location and function but not by protein/gene (Supplemental Tables S3 and S4). The top pathways generally mapped to associations with cytoskeletal remodeling/permeability-associated (Table 4).
Table 4.
HMECs enrichment by pathway maps (permeability-associated)
| Network Maps | Total | P Value | FDR | In Data | Network Objects from Active Data |
|---|---|---|---|---|---|
| Cytoskeleton remodeling_Regulation of actin cytoskeleton organization by the kinase effectors of Rho GTPases | 58 | 4.0e−13 | 2.6e−10 | 11 | α-Actinin, ERM proteins, talin, MyHC, RhoA, ROCK, actin cytoskeletal, vinculin, RhoA-related, F-actin cytoskeleton, moesin (MSN) |
| Cell adhesion_Histamine H1 receptor signaling in the interruption of cell barrier integrity | 45 | 1.3e−09 | 4.3e−07 | 8 | α-Actinin, talin, RhoA, ROCK, actin cytoskeletal, vinculin, VE-cadherin, β-catenin |
| Cell adhesion_Role of tetraspanins in the integrin-mediated cell adhesion | 37 | 9.3e−09 | 1.5e−06 | 7 | Talin, RhoA, ROCK, actin cytoskeletal, vinculin, ezrin (VIL2), actin |
| Cell adhesion_Endothelial cell contacts by junctional mechanisms | 26 | 3.1e−08 | 4.1e−06 | 6 | α-Actinin, AF-6, actin cytoskeletal, ZO-2, VE-cadherin, β-catenin |
| Cell adhesion_Integrin-mediated cell adhesion and migration | 48 | 6.2e−08 | 6.8e−06 | 7 | α-Actinin, talin, MyHC, RhoA, ROCK, actin cytoskeletal, vinculin |
| Cytoskeleton remodeling_Fibronectin-binding integrins in cell motility | 32 | 1.2e−07 | 9.8e−06 | 6 | α-Actinin, talin, RhoA, ROCK, actin cytoskeletal, vinculin |
| Cytoskeleton remodeling_ESR1 action on cytoskeleton remodeling and cell migration | 23 | 6.5e−07 | 3.8e−05 | 5 | ROCK2, ERM proteins, RhoA, F-actin cytoskeleton, moesin (MSN) |
| Cytoskeleton remodeling_Hyaluronic acid/CD44 signaling pathways | 43 | 7.5e−07 | 3.8e−05 | 6 | RhoA, ROCK, actin cytoskeletal, ezrin (VIL2), actin, moesin (MSN) |
| Cell adhesion_Cadherin-mediated cell adhesion | 26 | 1.3e−06 | 5.9e−05 | 5 | AF-6, actin cytoskeletal, VE-cadherin, actin, β-catenin |
| Chemotaxis_Lysophosphatidic acid signaling via GPCRs | 129 | 5.5e−06 | 1.9e−04 | 8 | RhoA, ROCK, Rho GTPase, G protein-γ12, actin cytoskeletal, vinculin, F-actin cytoskeleton, β-catenin |
| Cytoskeleton remodeling_Integrin outside-in signaling | 49 | 3.2e−05 | 8.4e−04 | 5 | α-Actinin, talin, actin cytoskeletal, vinculin, β-catenin |
| E-cadherin signaling and its regulation in gastric cancer | 36 | 1.5e−04 | 3.1e−03 | 4 | α-Actinin, RhoA, actin, β-catenin |
| Cytoskeleton remodeling_Role of PKA in cytoskeleton reorganization | 41 | 2.5e−04 | 4.4e−03 | 4 | RhoA, ROCK, actin cytoskeletal, F-actin cytoskeleton |
| Cytoskeleton remodeling_Regulation of actin cytoskeleton nucleation and polymerization by Rho GTPases | 46 | 3.8e−04 | 5.9e−03 | 4 | RhoA, actin cytoskeletal, RhoA-related, F-actin cytoskeleton |
Pathway analysis output stemming from the 106 significantly changed proteins in human lung-derived microvascular endothelial cells (HMECs) treated with a combination of equal amounts of 2-bromopalmitic acid and 2-bromopalmitaldehyde vs. vehicle (Supplemental Table S6), including the antibody-targeted verification experiments. Most of the pathways mapped through GeneGo MetaCore were identified as permeability-associated; the top pathway is also illustrated (Fig. 12). ERM proteins, ezrin, radixin, and moesin; ESR1, estrogen receptor 1; FDR, false discovery rate; GPCRs, G protein-coupled receptors; MyHC, myosin heavy chain; ZO-2, zona occludens-2.
Fig. 12.

Human lung-derived microvascular endothelial cells. Top pathway map following brominated lipids treatment is shown. Human lung microvascular endothelial cells were incubated with vehicle, 2-bromopalmitic acid (10 µM), and 2-bromopalmitaldehyde (10 µM) or their corresponding nonbrominated compounds for 30 min, and cell lysates were prepared as indicated in materials and methods for discovery proteomics analysis. The most significant signaling pathways were then identified using GeneGo MetaCore; these were from the 106 proteins found to be significantly changed in abundance by liquid chromatography-tandem mass spectrometry (Table 3; Supplemental Table S6) in addition to immunotargeted proteins for which phosphorylation status or location/disruption were confirmed (immunocytoflourescence and Western blot analysis). The top pathway included cytoskeleton remodeling, regulation of actin cytoskeleton organization by the kinase effectors of Rho GTPases. The primary proteins identified in the pathway shown include α-actinin, ezrin, radixin, and moesin (ERM) proteins, talin, myosin heavy chain (MyHC), RhoA, ROCK, actin cytoskeletal, vinculin, RhoA-related, F-actin cytoskeleton, and moesin (MSN). The figure key can be found in Supplemental Fig. S1.
Table 3.
HMECs: cell adhesion/junction-associated proteins
| Statistics | UniProtKB, DAVID, and GeneGo MetaCore Definitions | ||||||
|---|---|---|---|---|---|---|---|
| UniProtKB Name | UniProt ID | Entrez ID | Network ID | SAM | t-Test P Value | Fold∆ (16CBr/Veh) | GO Localizations/Biological Processes |
| 40S ribosomal protein S9 | P46781 | 6203 | RPS9 | 1.35 | 0.016 | 3.0 | Anchoring and adherens junction/focal adhesion |
| Tight junction protein ZO-2 | Q9UDY2 | 9414 | ZO-2 | 1.11 | 0.029 | 2.6 | Adherens and tight junction/cadherin binding |
| Myosin-9 | P35579 | 4627 | MYH9 | 1.93 | 0.009 | 2.6 | Actin, cadherin, and calmodulin binding |
| 60S ribosomal protein L7a | P62424 | 6130 | RPL7A | 1.11 | 0.010 | 2.0 | Focal adhesion/cadherin binding |
| Tight junction protein 1 (zona occludens-1) | G5E9E7 | 7082 | ZO-1 | 1.00 | 0.015 | 1.9 | Cell and tight junction-associated |
| 60S acidic ribosomal protein P0 | P05388 | 6175 | RPLP0 | 0.90 | 0.023 | 1.9 | Anchoring and adherens junction/focal adhesion |
| Laminin subunit gamma-1 | P11047 | 3915 | LAMG1 | 1.47 | 0.006 | 1.8 | Cell adhesion and migration |
| Desmin | P17661 | 1674 | Desmin | 1.19 | 0.009 | 1.7 | Cytoskeletal and intermediate filament organization |
| Polyadenylate-binding protein 1 | P11940 | 26986 | PABPC1 | 1.53 | 0.006 | 1.7 | Cell substrate junction |
| Catenin beta-1 | P35222 | 1499 | Beta-catenin | 0.86 | 0.027 | 1.6 | α-Catenin and cadherin binding/adherens junction assembly |
| Plectin | Q15149 | 5339 | Plectin 1 | 1.76 | 0.013 | 1.6 | Cell junction/actin and cadherin binding |
| Catalase | P04040 | 847 | Catalase | 1.04 | 0.025 | 1.5 | Cell and adherens junction |
| Actin, alpha cardiac muscle 1 | P68032 | 70 | ACTC | 0.93 | 0.021 | −1.5 | Myosin binding/actin and myosin filament movement |
| Filamin-C | Q14315 | 2318 | Filamin C | 1.68 | 0.005 | −1.6 | Actin and ankyrin binding/cell junction assembly |
| IQ motif containing GTPase activating protein 1 | A4QPB0 | 8826 | IQGAP1 | 1.28 | 0.025 | −1.6 | Anchoring and adherens junction |
| Moesin | P26038 | 4478 | MSN (moesin) | 1.45 | 0.005 | −1.6 | Actin and cell adhesion molecule binding/cell-to-cell adhesion |
| Talin-1 | Q9Y490 | 7094 | Talin-1 | 1.42 | 0.012 | −1.6 | Actin filament and cadherin binding/cell-to-cell junction |
| Ubiquitin-like modifier-activating enzyme 1 | P22314 | 7317 | UBE1 | 1.08 | 0.018 | −1.8 | Anchoring and cell junction |
| Laminin subunit alpha-5 | O15230 | 3911 | LAMA5 | 1.19 | 0.020 | −1.8 | Integrin binding/regulation of cell-to-cell adhesion |
| Filamin-B | O75369 | 2317 | Filamin B (TABP) | 1.57 | 0.002 | −1.9 | Actin and cadherin binding/actin cytoskeleton organization |
| Spectrin alpha chain, nonerythrocytic 1 | Q13813 | 6709 | Alpha-fodrin | 1.48 | 0.015 | −1.9 | Actin, cadherin, and calmodulin binding/actin filament capping |
| 14-3-3 protein epsilon | P62258 | 7531 | 14-3-3 | 1.00 | 0.025 | −1.9 | Cadherin binding/membrane reorganization |
| Ezrin | P15311 | 7430 | VIL2 (ezrin) | 1.63 | 0.005 | −2.0 | Actin filament, cadherin and cell adhesion binding |
| 60S ribosomal protein L5 | P46777 | 6125 | RPL5 | 0.98 | 0.025 | −2.0 | Anchoring and adherens junction/focal adhesion |
| Nucleoside diphosphate kinase B | P22392 | 4831 | NDPK B | 0.87 | 0.046 | −2.0 | Intermediate filament binding/cell adhesion |
| Afadin | P55196 | 4301 | AF-6 | 1.40 | 0.009 | −2.1 | Actin filament, cadherin and cell adhesion binding/cell adhesion |
| Alpha-actinin-4 | O43707 | 81 | Alpha-actinin 4 | 2.71 | 0.000 | −2.6 | Actin filament and integrin binding/tight junction assembly |
| Vinculin | P18206 | 7414 | Vinculin | 1.57 | 0.005 | −2.9 | Actin, catenin, and cadherin binding/adherens and apical junctions |
| Alpha-actinin-1 | P12814 | 87 | Alpha-actinin 1 | 2.90 | 0.000 | −2.9 | Actin filament, vinculin and integrin binding/focal adhesion assembly |
| Serine/threonine-protein phosphatase 2A | P30153 | 5518 | PP2A structural | 1.06 | 0.032 | −3.0 | Phosphorylation and degradation β-catenin/regulation cell adhesion |
Systems analysis annotation output stemming from the 106 significantly changed proteins in human lung-derived microvascular endothelial cells (HMECs) treated with a combination of equal amounts of 2-bromopalmitic acid and 2-bromopalmitaldehyde vs. vehicle (16CBr/Veh; Supplemental Table S6). The proteins illustrated were all associated with cellular permeability-related functions. These 30 resultant proteins have been gene ontology (GO)-annotated using a combination of the UniProtKB, Database for Annotation, Visualization and Integrated Discovery (DAVID), and GeneGo MetaCore databases. ∆, Change; ID, identifier; SAM, significance analysis of microarray.
DISCUSSION
Br2 is toxic to living organisms. This is reflected in the safety data sheet for reagent-grade Br2 (CAS no. 7726-95-6, Revision Date 18-Jan-2018; Thermo Fisher Scientific) where Br2 is listed as a category 1 toxin for skin, eye, and inhalation exposures. Br2 is considered potentially fatal if inhaled with a permissible exposure limit of <0.1 ppm (45a). The National Institute for Occupational Safety and Health Immediately Dangerous to Life or Health limit for Br2 gas exposure was recently reduced to 3 ppm based on additional review of previous human exposures (45a).
The broad application of Br2 in diverse industrial settings increases the risk of accidental or malicious Br2 release and consequent human exposure. Despite widespread use of Br2, the specific mechanisms of toxicity remain unclear, hindering development of effective countermeasures and therapeutics. To our knowledge, there is no prior literature exploring the impact of Br2 on organ-specific proteomes derived from translational animal models in vivo or in human cell lines ex vivo. To further characterize the mechanisms underlying Br2 toxicity, we have employed the latest proteomics and bioinformatics tools combined with established functional and immunotargeted assays to cross-correlate both a translational mouse model of Br2 exposure with human lung microvascular endothelial cells exposed to both Br2 and Br-lips (Fig. 13).
Fig. 13.

Experimental summary. Our preliminary experiment involved the use of Br2 exposure in mice to survey the global lung proteome at 24 h after exposure. This led to the identification of 95 proteins that changed significantly, with 30 that are known to be associated with permeability-related mechanisms. This was followed by the measurement of a functional experiment Kf to confirm lung permeability as a confounding endpoint pathology linked to Br2 exposure. Brominated lipids (Br-lips) were then quantified in lung tissues with focus on 2-bromopalmitic acid (2-BrPA) and 2-bromopalmitaldehyde (2-BrPALD) derived from plasmalogens. This was a focus as a result of previously published data derived from similar experimental designs using halogens such as chlorine. High levels of Br-lips in lung tissues were identified, which led to the 2nd tier of experiments focused on the treatment of human lung-derived microvascular endothelial cells (HMECs) with both Br2 and Br-lips separately. For this, we carried out a classic functional permeability experiment using transendothelial electrical resistance (TER), followed by immunofluorescence-established vascular permeability-associated proteins to confirm that disruptions were occurring within a single human vascular cell line, compared with the complex makeup of the lung. In addition, we carried out similar discovery proteomics analysis as we had in animals. This led to the identification of 106 proteins, whereby ~30 additional key permeability-associated proteins were confirmed, leading to a more complete set of systems analysis results with vascular permeability as a lead mechanism following Br2 and Br-lips toxicity. FA’s, F-actins; IHC, immunohistochemical; p, phosphorylated; PE, ethanolamine glycerophospholipids; Veh., vehicle; WB, Western blot; ZO-1, zona occludens-1.
Advantages and Limitations
There are key advantages and limitations to global discovery-based proteomic studies. Proteomic applications can help investigators to gain a bird’s-eye viewpoint while at the same time potentially identifying previously unknown small-scale details. This is especially true when combined with systems analysis applications. In this way, proteomics can provide both a broader contextual overview while also identifying specific small-scale changes that may warrant additional investigation.
We chose a common discovery proteomic workflow with the expectation that this would provide us with clarity, context, and a better sense of direction to pursue for future investigations into novel mechanisms and potential therapeutic interventions following Br2-induced lung injury. This approach, however, presents with key limitations that warrant emphasis: 1) unlike transcriptomic experiments, there is the inability to amplify proteins, thereby imposing a limit of detection for low-abundance proteins, and 2) as applied in this study, there is an inability to distinguish between causation and association. Causal inferences are more challenging to determine in discovery omics applications due primarily to the large number of quantified transcripts or proteins identified by modern techniques. As the number of proteins identified increases, the number of associations arising by random chance will increase correspondingly. To address this risk, we employed statistical techniques in concert with complementing proteomics data, Western blots, and cytoimmunofluorescence. It remains important for the reader when reviewing our tables to recall that the presence of a single protein or group of proteins should not be interpreted in isolation as causative for a phenotype or pathway.
In addition to these points, the individual proteins identified and their relative levels present in tissue fluctuate over time. Discovery proteomics applications are limited to capturing a snapshot of proteins frozen at a predetermined time point. Although this provides a still-frame of protein abundance at that moment, our analysis is incapable of describing temporal changes in abundance. Similarly, although phosphorylation status was explored for key permeability-associated proteins identified in our analysis, the measurement of specific posttranslational modifications of proteins that may otherwise be required for gain/loss of function present with an additional set of challenges and, therefore, was not explored at the global level here.
We utilized a proteomics workflow to serve as a guide for devising new molecular and translational experiments to confirm and further probe particular pathways of interest identified by this analysis. Our findings of the observed biological changes are consistent with permeability disruption following Br2 exposure. This outcome directly prompted novel investigations into the capability of Br2 to damage the pulmonary microvasculature using a measurement of filtration coefficient while also demonstrating previously unknown changes in endothelial cell actin stress filaments and VE-cadherin internalization specifically in halogen injury.
In all, our findings highlight three significant biological processes: 1) exosome secretion, 2) inflammation, and 3) vascular permeability. Although exosome secretion is of great interest in terms of understanding cellular cross talk-associated mechanisms, in addition to serum and urinary biomarkers for future interests, we have chosen to discuss recent work in relation to inflammatory pathways while primarily focusing our current experiments on changes in vascular permeability.
Inflammation
An acute inflammatory response has been well-described following toxic gas exposures, and our previous work has demonstrated that Br2-induced lung injury is no exception. Br2 exposure can induce increases in plasma levels of inflammatory cytokines (including IL-6, TNF-α, and keratinocyte chemoattractant/growth-related oncogene; Ref. 35) and increased inflammatory cells (macrophages and neutrophils; Refs. 2, 4) in bronchoalveolar lavage fluid. Our proteomic analysis identified a number of changes in proteins involved in regulation of the immune response, including neutrophil/granulocyte activation and myeloid cell activation.
We noted a 4.5-fold increase in cathelin-related antimicrobial peptide (CRAMP) in mice after Br2 exposure compared with control animals. CRAMP is an ortholog of human cathelicidin/LL-37, functions as a leukocyte chemoattractant, and enhances the adaptive immune response in mice (34).
Serum paraoxonase 1 (PON1) was increased 3.3-fold in mice exposed to Br2. PON1 is protective against organophosphate toxicity, but recent work has demonstrated its role in the organisms’ response to oxidative stress and inflammation along with the preservation of vascular endothelial function. Notably, the antioxidant function of PON1 centers around the hydrolyzation of oxidized lipids (15). The role that PON1 may play in response to halogens or halogenated lipids remains to be determined.
The heme-containing enzyme myeloperoxidase (MPO) was increased 2.9-fold in mice exposed to Br2. MPO serves a variety of functions in host immune response regulation and influences both innate and adaptive immunity (7). MPO plays an important role in termination of an inflammatory response as well as promotion of inflammation via granulocyte recruitment after release from necrotic cells (49). Increases in MPO may reflect a quantitative increase in granulocytes following Br2-induced lung injury. Of note, a significant increase of MPO staining was found in the lungs of mice 24 h after exposure; S100 calcium-binding protein A9 (S100A9) was increased 2.3-fold in Br2-exposed mice (4). Also known as myeloid-related protein-14, this protein works through Toll-like receptor 4 activation to regulate vascular inflammation and leukocyte recruitment (17). Elevations in plasma S100A9 are predictive of adverse cardiovascular events, and S100A9 is a ligand of receptor for advanced glycation endproducts, which is overexpressed in pulmonary artery smooth muscle cells in patients with pulmonary arterial hypertension. Future work is warranted to further explore this pathway. It is possible that chronic alterations in S100A9 could lead to adverse pulmonary vascular remodeling (45).
Additional proteins that are involved in inflammation and the immune response and found in the lungs of mice following Br2 exposure in addition to HMECs following Br-lips treatment are highlighted in Tables 1 and 2 (mouse lung), Supplemental Tables S3 and S4 (mouse lung cross-correlated with HMEC), and Supplemental Table S6 (HMEC), respectively. This vast array of new evidence supports the important role of the host inflammatory response after acute Br2-induced pulmonary injury. The degree to which the host immune response may be contributing to or exacerbating acute lung damage in this setting remains to be determined. It is possible that an overzealous host inflammatory response may lead to additional pulmonary injury in susceptible patients in a manner analogous to ARDS.
Vascular Permeability
Br2 and other halogen gases cause lung injury, in part, through disrupting pulmonary barrier function. We (29) have previously demonstrated systemic endothelial dysfunction in rats following Cl2 exposure with decreased endothelial nitric oxide synthase expression and activity. Prior work looking at Br2 exposure in pregnant mice has found evidence of an increased risk for endothelial dysfunction in these animals that appears to manifest in the lungs as severe pulmonary edema and systemically by triggering a pre-eclamptic-like syndrome (1, 2, 35). Interestingly, as indicted in the referenced materials, this phenotype is partially rescued with administration of the type 5 phosphodiesterase inhibitor tadalafil or by administration of exogenous VEGF-121, suggesting that cGMP and VEGF pathways are, respectively, involved in the pathogenesis of injury in pregnant animals.
Our current proteomic analysis has identified several targets for investigation related to vascular permeability and endothelial function. In mice exposed to Br2, these include an increase in tubulin-specific chaperone D [2.8-fold increase (↑)], involved in adherens and tight junction disassembly, and an increase of guanine nucleotide-binding protein subunit α-13 (2.2-fold↑), which functions to regulate the actin cytoskeleton along with actin-related protein 2/3 complex subunit 2 (2.1-fold↑; Table 1; Refs. 10, 36, 55). In HMECs, Br-lips exposure led to increased abundance of a host of proteins associated with cellular adhesion and junctional integrity (Table 3). These include tight junction protein zona occludens-2 (ZO-2; 2.6-fold↑) and ZO-1 (1.9-fold↑) along with catenin β-1 (1.6-fold↑), which are all involved in cadherin binding (Table 3). Vinculin, α-actinin-1, and serine/threonine-protein phosphatase 2A were all found to be decreased by 2.9-, 2.9-, and 3.0-fold, respectively (Table 3). All three are important in junctional integrity and cadherin binding (13, 30, 43).
In concert with our proteomic and systems biology approach, we designed and pursued experiments that further characterized pulmonary vascular permeability changes in vivo. We then reported changes in HMEC transendothelial resistance (a measure of vascular permeability) and measured changes in specific permeability-associated proteins and pathways within HMECs following Br2, and Br-lips exposure, including F-actin stress fiber formation, VE-cadherin phosphorylation and internalization, and disruption of ZO-1, along with noting that Br-lips induced phosphorylation (activation) of both RhoA and ROCK2. These combined approaches illustrated in Fig. 13 allowed us to directly explore an important permeability-associated cytoskeletal pathway implicated by our discovery proteomic analysis (Fig. 12; Supplemental Fig. S1).
Our combined workflow presents with several strengths. This is the first time an isolated lung perfusion assay was employed to assess the global changes in pulmonary vascular permeability following halogen gas exposure. The marked increase in Kf at 24 h is consistent with increased pulmonary vascular permeability and provides the strongest evidence to date accounting for the role of permeability in the pulmonary edema observed in these animals. HMEC transendothelial resistance provides cellular evidence of these changes and helps further confirm that the proteomic signal we observed may be biologically meaningful.
Future Studies
As a whole, this work has provided a base for future studies. Although we have focused herein on pulmonary endothelial injury, it will be important in the future to explore halogen-associated injury to the alveolar epithelium, particularly as our finding of an increased filtration coefficient in mice exposed to Br2 may also occur in the context of injury to lung epithelium. Similarly, disruptions in ion transport are likely involved; more specifically, we believe that alterations in calcium signaling and transport across the pulmonary epithelium following halogen exposure warrants additional research, similar to previous reports following exposure of human airway smooth cells to chlorine and bromine (37, 38). Calcium may also play an important role in the regulation of the systemic vascular endothelium, particularly in the pathogenesis of the systemic hypertension and endothelial dysfunction observed in pregnant mice following exposure to Br2 (1, 2, 35). Additionally, although we have focused our efforts on the acute effects of Br2 injury, it will be important in the future to explore the subacute and chronic changes related to pulmonary endothelial dysfunction and inflammation as well as expanding our investigations to other halogenated agents, including chlorine and phosgene. Several therapeutic options for treatment of acute halogen injury deserve attention based on our findings, including modulators of the inflammatory response and agents that affect endothelial function, including phosphodiesterase inhibitors and exogenous nitric oxide. Indeed, previous studies have shown that nitrite administered intramuscularly to mice after Cl2 prolongs survival and decreases mortality (28, 62). Similarly, administration of the phosphodiesterase inhibitor rolipram decreased chlorine-induced lung injury in mice (16). Furthermore, our data are congruent with prior work demonstrating an increase in filtration coefficient after hydrochloric acid tracheal instillation (63). Acute lung injury was mitigated by administration of high-molecular-weight hyaluronan, which also served to decrease ROCK2 phosphorylation (63). This observation points to a common pathway (RhoA-ROCK2) between the two separate mechanisms of injury, and consequently treatment with high-molecular-weight hyaluronan may also be beneficial in halogen gas-induced injury.
Therefore, further studies into the reported biological functions and pathways are in order; this type of data helps to guide future directions, as these cross-correlates lend a higher level of confidence to the global acute effects of Br2 exposure in vivo (51).
In this report, we have identified potentially significant biological functions to help guide us toward specific molecular pathologies following acute Br2 exposure. We have generated proof of principal that this type of robust proteomics workflow coupled to a series of systems biology analysis can be applied to a number of understudied models of toxic exposures to better understand what biological systems may be influenced downstream and over time. We expect that our data contained within this manuscript and those available through the ProteomeXchange Consortium will aid others in their efforts to better characterize and understand acute toxic lung injury.
Data Sharing
The mass spectrometry proteomics data have been deposited to the ProteomeXchange Consortium via the PRIDE partner repository with the data set identifier PXD015462 (see endnote).
GRANTS
Funding was provided by the CounterACT Program, National Institutes of Health Office of the Director, the National Institute of Neurological Disorders and Stroke, and the National Institute of Environmental Health Sciences, Grants 5UO1 ES026458 03, 3UO1 ES026458 03S1, and 5UO1 ES027697 02 to S. Matalon; National Heart, Lung, and Blood Institute, National Institutes of Health, Grant T32HL129948 to D. R. Addis; and UAB Comprehensive Cancer Center, agency: National Institutes of Health, institute: National Cancer Institute, Project no. P30CA013148 to J. A. Mobley. This study was supported by research funding from the National Institute of General Medical Sciences R01 GM-115553 to D. A. Ford.
DISCLOSURES
No conflicts of interest, financial or otherwise, are declared by the authors.
AUTHOR CONTRIBUTIONS
S.A., S.M., and J.A.M. conceived and designed research; D.R.A., S.F.D., M.-Y.J., I.A., K.K., D.A.F., and J.A.M. performed experiments; D.R.A., S.A., S.F.D., M.-Y.J., I.A., K.K., D.A.F., and J.A.M. analyzed data; D.R.A., S.A., S.M., and J.A.M. interpreted results of experiments; D.R.A., S.A., S.F.D., M.-Y.J., K.K., D.A.F., S.M., and J.A.M. prepared figures; D.R.A., S.M., and J.A.M. drafted manuscript; D.R.A., S.A., K.K., D.A.F., S.M., and J.A.M. edited and revised manuscript; D.R.A., S.A., S.F.D., M.-Y.J., I.A., K.K., D.A.F., S.M., and J.A.M. approved final version of manuscript.
ENDNOTE
At the request of the authors, readers are herein alerted to the fact that additional materials related to this manuscript may be found at a website that at the time of publication the authors indicate is: https://doi.org/10.6019/PXD015462. These materials are not a part of this manuscript and have not undergone peer review by the American Physiological Society (APS). APS and the journal editors take no responsibility for these materials, for the website address, or for any links to or from it.
REFERENCES
- 1.Addis DR, Lambert JA, Ford DA, Jilling T, Matalon S. Halogen gas exposure: toxic effects on the parturient. Toxicol Mech Methods. First published March 30, 2020. doi: 10.1080/15376516.2020.1736702. [DOI] [PMC free article] [PubMed] [Google Scholar]
- 2.Addis DR, Lambert JA, Ren C, Doran S, Aggarwal S, Jilling T, Matalon S. Vascular endothelial growth factor-121 administration mitigates halogen inhalation-induced pulmonary injury and fetal growth restriction in pregnant mice. J Am Heart Assoc 9: e013238, 2020. doi: 10.1161/JAHA.119.013238. [DOI] [PMC free article] [PubMed] [Google Scholar]
- 3.Aggarwal S, Ahmad I, Lam A, Carlisle MA, Li C, Wells JM, Raju SV, Athar M, Rowe SM, Dransfield MT, Matalon S. Heme scavenging reduces pulmonary endoplasmic reticulum stress, fibrosis, and emphysema. JCI Insight 3: e120694, 2018. doi: 10.1172/jci.insight.120694. [DOI] [PMC free article] [PubMed] [Google Scholar]
- 4.Aggarwal S, Lam A, Bolisetty S, Carlisle MA, Traylor A, Agarwal A, Matalon S. Heme attenuation ameliorates irritant gas inhalation-induced acute lung injury. Antioxid Redox Signal 24: 99–112, 2016. doi: 10.1089/ars.2015.6347. [DOI] [PMC free article] [PubMed] [Google Scholar]
- 5.Albert CJ, Thukkani AK, Heuertz RM, Slungaard A, Hazen SL, Ford DA. Eosinophil peroxidase-derived reactive brominating species target the vinyl ether bond of plasmalogens generating a novel chemoattractant, α-bromo fatty aldehyde. J Biol Chem 278: 8942–8950, 2003. doi: 10.1074/jbc.M211634200. [DOI] [PubMed] [Google Scholar]
- 6.Anbukumar DS, Shornick LP, Albert CJ, Steward MM, Zoeller RA, Neumann WL, Ford DA. Chlorinated lipid species in activated human neutrophils: lipid metabolites of 2-chlorohexadecanal. J Lipid Res 51: 1085–1092, 2010. doi: 10.1194/jlr.M003673. [DOI] [PMC free article] [PubMed] [Google Scholar]
- 7.Arnhold J, Flemmig J. Human myeloperoxidase in innate and acquired immunity. Arch Biochem Biophys 500: 92–106, 2010. doi: 10.1016/j.abb.2010.04.008. [DOI] [PubMed] [Google Scholar]
- 8.Barnard ML, Matalon S. Mechanisms of extracellular reactive oxygen species injury to the pulmonary microvasculature. J Appl Physiol (1985) 72: 1724–1729, 1992. doi: 10.1152/jappl.1992.72.5.1724. [DOI] [PubMed] [Google Scholar]
- 9.Beissbarth T, Hyde L, Smyth GK, Job C, Boon WM, Tan SS, Scott HS, Speed TP. Statistical modeling of sequencing errors in SAGE libraries. Bioinformatics 20, Suppl 1: i31–i39, 2004. doi: 10.1093/bioinformatics/bth924. [DOI] [PubMed] [Google Scholar]
- 10.Bhamidipati A, Lewis SA, Cowan NJ. ADP ribosylation factor-like protein 2 (Arl2) regulates the interaction of tubulin-folding cofactor D with native tubulin. J Cell Biol 149: 1087–1096, 2000. doi: 10.1083/jcb.149.5.1087. [DOI] [PMC free article] [PubMed] [Google Scholar]
- 11.Bhatia VN, Perlman DH, Costello CE, McComb ME. Software tool for researching annotations of proteins: open-source protein annotation software with data visualization. Anal Chem 81: 9819–9823, 2009. doi: 10.1021/ac901335x. [DOI] [PMC free article] [PubMed] [Google Scholar]
- 12.Bligh EG, Dyer WJ. A rapid method of total lipid extraction and purification. Can J Biochem Physiol 37: 911–917, 1959. doi: 10.1139/o59-099. [DOI] [PubMed] [Google Scholar]
- 13.Bois PR, O’Hara BP, Nietlispach D, Kirkpatrick J, Izard T. The vinculin binding sites of talin and α-actinin are sufficient to activate vinculin. J Biol Chem 281: 7228–7236, 2006. doi: 10.1074/jbc.M510397200. [DOI] [PubMed] [Google Scholar]
- 14.Brahmbhatt VV, Albert CJ, Anbukumar DS, Cunningham BA, Neumann WL, Ford DA. ω-Oxidation of α-chlorinated fatty acids: identification of α-chlorinated dicarboxylic acids. J Biol Chem 285: 41255–41269, 2010. doi: 10.1074/jbc.M110.147157. [DOI] [PMC free article] [PubMed] [Google Scholar]
- 15.Camps J, Marsillach J, Joven J. The paraoxonases: role in human diseases and methodological difficulties in measurement. Crit Rev Clin Lab Sci 46: 83–106, 2009. doi: 10.1080/10408360802610878. [DOI] [PubMed] [Google Scholar]
- 16.Chang W, Chen J, Schlueter CF, Rando RJ, Pathak YV, Hoyle GW. Inhibition of chlorine-induced lung injury by the type 4 phosphodiesterase inhibitor rolipram. Toxicol Appl Pharmacol 263: 251–258, 2012. doi: 10.1016/j.taap.2012.06.017. [DOI] [PMC free article] [PubMed] [Google Scholar]
- 17.Croce K, Gao H, Wang Y, Mooroka T, Sakuma M, Shi C, Sukhova GK, Packard RR, Hogg N, Libby P, Simon DI. Myeloid-related protein-8/14 is critical for the biological response to vascular injury. Circulation 120: 427–436, 2009. doi: 10.1161/CIRCULATIONAHA.108.814582. [DOI] [PMC free article] [PubMed] [Google Scholar]
- 18.Duerr MA, Palladino END, Hartman CL, Lambert JA, Franke JD, Albert CJ, Matalon S, Patel RP, Slungaard A, Ford DA. Bromofatty aldehyde derived from bromine exposure and myeloperoxidase and eosinophil peroxidase modify GSH and protein. J Lipid Res 59: 696–705, 2018. doi: 10.1194/jlr.M083279. [DOI] [PMC free article] [PubMed] [Google Scholar]
- 19.Ekins S, Bugrim A, Brovold L, Kirillov E, Nikolsky Y, Rakhmatulin E, Sorokina S, Ryabov A, Serebryiskaya T, Melnikov A, Metz J, Nikolskaya T. Algorithms for network analysis in systems-ADME/Tox using the MetaCore and MetaDrug platforms. Xenobiotica 36: 877–901, 2006. doi: 10.1080/00498250600861660. [DOI] [PubMed] [Google Scholar]
- 20.Eng JK, McCormack AL, Yates JR. An approach to correlate tandem mass spectral data of peptides with amino acid sequences in a protein database. J Am Soc Mass Spectrom 5: 976–989, 1994. doi: 10.1016/1044-0305(94)80016-2. [DOI] [PubMed] [Google Scholar]
- 22.FACTS Failure and Accidents Technical Information System.
- 23.Ford DA, Honavar J, Albert CJ, Duerr MA, Oh JY, Doran S, Matalon S, Patel RP. Formation of chlorinated lipids post-chlorine gas exposure. J Lipid Res 57: 1529–1540, 2016. doi: 10.1194/jlr.M069005. [DOI] [PMC free article] [PubMed] [Google Scholar]
- 24.Golub TR, Slonim DK, Tamayo P, Huard C, Gaasenbeek M, Mesirov JP, Coller H, Loh ML, Downing JR, Caligiuri MA, Bloomfield CD, Lander ES. Molecular classification of cancer: class discovery and class prediction by gene expression monitoring. Science 286: 531–537, 1999. doi: 10.1126/science.286.5439.531. [DOI] [PubMed] [Google Scholar]
- 25.Gribble GW. The diversity of naturally occurring organobromine compounds. Chem Soc Rev 28: 335–346, 1999. doi: 10.1039/a900201d. [DOI] [Google Scholar]
- 26.Grinbaum BF, Freiberg M. Bromine. In: Kirk–Othmer Encyclopedia of Chemical Technology. New York: John Wiley & Sons, 2002. doi: 10.1002/0471238961.0218151310010311.a01.pub2. [DOI] [Google Scholar]
- 28.Honavar J, Doran S, Oh JY, Steele C, Matalon S, Patel RP. Nitrite therapy improves survival postexposure to chlorine gas. Am J Physiol Lung Cell Mol Physiol 307: L888–L894, 2014. doi: 10.1152/ajplung.00079.2014. [DOI] [PMC free article] [PubMed] [Google Scholar]
- 29.Honavar J, Samal AA, Bradley KM, Brandon A, Balanay J, Squadrito GL, MohanKumar K, Maheshwari A, Postlethwait EM, Matalon S, Patel RP. Chlorine gas exposure causes systemic endothelial dysfunction by inhibiting endothelial nitric oxide synthase-dependent signaling. Am J Respir Cell Mol Biol 45: 419–425, 2011. doi: 10.1165/rcmb.2010-0151OC. [DOI] [PMC free article] [PubMed] [Google Scholar]
- 30.Janssens V, Goris J. Protein phosphatase 2A: a highly regulated family of serine/threonine phosphatases implicated in cell growth and signalling. Biochem J 353: 417–439, 2001. doi: 10.1042/bj3530417. [DOI] [PMC free article] [PubMed] [Google Scholar]
- 31.Jian MY, Alexeyev MF, Wolkowicz PE, Zmijewski JW, Creighton JR. Metformin-stimulated AMPK-α1 promotes microvascular repair in acute lung injury. Am J Physiol Lung Cell Mol Physiol 305: L844–L855, 2013. doi: 10.1152/ajplung.00173.2013. [DOI] [PMC free article] [PubMed] [Google Scholar]
- 32.Jilling T, Ren C, Yee A, Aggarwal S, Halloran B, Ambalavanan N, Matalon S. Exposure of neonatal mice to bromine impairs their alveolar development and lung function. Am J Physiol Lung Cell Mol Physiol 314: L137–L143, 2018. doi: 10.1152/ajplung.00315.2017. [DOI] [PMC free article] [PubMed] [Google Scholar]
- 33.Keller A, Nesvizhskii AI, Kolker E, Aebersold R. Empirical statistical model to estimate the accuracy of peptide identifications made by MS/MS and database search. Anal Chem 74: 5383–5392, 2002. doi: 10.1021/ac025747h. [DOI] [PubMed] [Google Scholar]
- 34.Kurosaka K, Chen Q, Yarovinsky F, Oppenheim JJ, Yang D. Mouse cathelin-related antimicrobial peptide chemoattracts leukocytes using formyl peptide receptor-like 1/mouse formyl peptide receptor-like 2 as the receptor and acts as an immune adjuvant. J Immunol 174: 6257–6265, 2005. doi: 10.4049/jimmunol.174.10.6257. [DOI] [PubMed] [Google Scholar]
- 35.Lambert JA, Carlisle MA, Lam A, Aggarwal S, Doran S, Ren C, Bradley WE, Dell’Italia L, Ambalavanan N, Ford DA, Patel RP, Jilling T, Matalon S. Mechanisms and treatment of halogen inhalation-induced pulmonary and systemic injuries in pregnant mice. Hypertension 70: 390–400, 2017. doi: 10.1161/HYPERTENSIONAHA.117.09466. [DOI] [PMC free article] [PubMed] [Google Scholar]
- 36.Lazrak A, Chen L, Jurkuvenaite A, Doran SF, Liu G, Li Q, Lancaster JR Jr, Matalon S. Regulation of alveolar epithelial Na+ channels by ERK1/2 in chlorine-breathing mice. Am J Respir Cell Mol Biol 46: 342–354, 2012. doi: 10.1165/rcmb.2011-0309OC. [DOI] [PMC free article] [PubMed] [Google Scholar]
- 37.Lazrak A, Creighton J, Yu Z, Komarova S, Doran SF, Aggarwal S, Emala CW Sr, Stober VP, Trempus CS, Garantziotis S, Matalon S. Hyaluronan mediates airway hyperresponsiveness in oxidative lung injury. Am J Physiol Lung Cell Mol Physiol 308: L891–L903, 2015. doi: 10.1152/ajplung.00377.2014. [DOI] [PMC free article] [PubMed] [Google Scholar]
- 38.Lazrak A, Yu Z, Doran S, Jian MY, Creighton J, Laube M, Garantziotis S, Prakash YS, Matalon S. Upregulation of airway smooth muscle calcium-sensing receptor by low-molecular-weight hyaluronan. Am J Physiol Lung Cell Mol Physiol 318: L459–L471, 2020. doi: 10.1152/ajplung.00429.2019. [DOI] [PMC free article] [PubMed] [Google Scholar]
- 39.Liu H, Lichti CF, Mirfattah B, Frahm J, Nilsson CL. A modified database search strategy leads to improved identification of in vitro brominated peptides spiked into a complex proteomic sample. J Proteome Res 12: 4248–4254, 2013. doi: 10.1021/pr400472c. [DOI] [PubMed] [Google Scholar]
- 40.Liu H, Sadygov RG, Yates JR 3rd. A model for random sampling and estimation of relative protein abundance in shotgun proteomics. Anal Chem 76: 4193–4201, 2004. doi: 10.1021/ac0498563. [DOI] [PubMed] [Google Scholar]
- 41.Ludwig MR, Kojima K, Bowersock GJ, Chen D, Jhala NC, Buchsbaum DJ, Grizzle WE, Klug CA, Mobley JA. Surveying the serologic proteome in a tissue-specific kras(G12D) knockin mouse model of pancreatic cancer. Proteomics 16: 516–531, 2016. doi: 10.1002/pmic.201500133. [DOI] [PubMed] [Google Scholar]
- 42.Mayeno AN, Curran AJ, Roberts RL, Foote CS. Eosinophils preferentially use bromide to generate halogenating agents. J Biol Chem 264: 5660–5668, 1989. [PubMed] [Google Scholar]
- 43.Mège RM, Ishiyama N. Integration of cadherin adhesion and cytoskeleton at adherens junctions. Cold Spring Harb Perspect Biol 9: a028738, 2017. doi: 10.1101/cshperspect.a028738. [DOI] [PMC free article] [PubMed] [Google Scholar]
- 44.Mills JF, Frim R, Ukeles SD, Yoffe D. Bromine. In: Ullmann’s Encyclopedia of Industrial Chemistry. New York: John Wiley & Sons, 2015. doi: 10.1002/14356007.a04_391.pub2. [DOI] [Google Scholar]
- 45.Nakamura K, Sakaguchi M, Matsubara H, Akagi S, Sarashina T, Ejiri K, Akazawa K, Kondo M, Nakagawa K, Yoshida M, Miyoshi T, Ogo T, Oto T, Toyooka S, Higashimoto Y, Fukami K, Ito H. Crucial role of RAGE in inappropriate increase of smooth muscle cells from patients with pulmonary arterial hypertension. PLoS One 13: e0203046, 2018. doi: 10.1371/journal.pone.0203046. [DOI] [PMC free article] [PubMed] [Google Scholar]
- 45a.National Institute for Occupational Safety and Health Bromine: Immediately Dangerous to Life or Health Concentrations (IDLH). https://www.cdc.gov/niosh/idlh/7726956.html.
- 46.Nesvizhskii AI, Keller A, Kolker E, Aebersold R. A statistical model for identifying proteins by tandem mass spectrometry. Anal Chem 75: 4646–4658, 2003. doi: 10.1021/ac0341261. [DOI] [PubMed] [Google Scholar]
- 48.O’Neil MJ. The Merck Index: An Encyclopedia of Chemicals, Drugs, and Biologicals (15th ed.). Cambridge, UK: Royal Society of Chemistry, 2013, p. 246. [Google Scholar]
- 49.Odobasic D, Kitching AR, Holdsworth SR. Neutrophil-mediated regulation of innate and adaptive immunity: the role of myeloperoxidase. J Immunol Res 2016: 2349817, 2016. doi: 10.1155/2016/2349817. [DOI] [PMC free article] [PubMed] [Google Scholar]
- 50.Old WM, Meyer-Arendt K, Aveline-Wolf L, Pierce KG, Mendoza A, Sevinsky JR, Resing KA, Ahn NG. Comparison of label-free methods for quantifying human proteins by shotgun proteomics. Mol Cell Proteomics 4: 1487–1502, 2005. doi: 10.1074/mcp.M500084-MCP200. [DOI] [PubMed] [Google Scholar]
- 51.Oxelius VA. From genotypes of immunoglobulin constant heavy G chains (Fcγ) (GM) genes (IGHG) to phenotypes in childhood asthma. Int Arch Allergy Immunol 159: 94–102, 2012. doi: 10.1159/000335592. [DOI] [PubMed] [Google Scholar]
- 52.Schnebele EK. Mineral Commodity Summaries 2017. 2018.
- 53.Thomas EL, Bozeman PM, Jefferson MM, King CC. Oxidation of bromide by the human leukocyte enzymes myeloperoxidase and eosinophil peroxidase. Formation of bromamines. J Biol Chem 270: 2906–2913, 1995. doi: 10.1074/jbc.270.7.2906. [DOI] [PubMed] [Google Scholar]
- 54.Thukkani AK, Hsu FF, Crowley JR, Wysolmerski RB, Albert CJ, Ford DA. Reactive chlorinating species produced during neutrophil activation target tissue plasmalogens: production of the chemoattractant, 2-chlorohexadecanal. J Biol Chem 277: 3842–3849, 2002. doi: 10.1074/jbc.M109489200. [DOI] [PubMed] [Google Scholar]
- 55.Tian G, Thomas S, Cowan NJ. Effect of TBCD and its regulatory interactor Arl2 on tubulin and microtubule integrity. Cytoskeleton (Hoboken) 67: 706–714, 2010. doi: 10.1002/cm.20480. [DOI] [PMC free article] [PubMed] [Google Scholar]
- 56.Townsley MI, Korthuis RJ, Rippe B, Parker JC, Taylor AE. Validation of double vascular occlusion method for Pc,i in lung and skeletal muscle. J Appl Physiol (1985) 61: 127–132, 1986. doi: 10.1152/jappl.1986.61.1.127. [DOI] [PubMed] [Google Scholar]
- 56a.US EPA Non-Confidential 2006 Inventory Update Reporting. National Chemical Information. Bromine (7726-95-6). 2014.
- 57.Vardanyan RH, Hruby V. Synthesis of Essential Drugs. Amsterdam: Elsevier, 2006. [Google Scholar]
- 58.Wacker BK, Albert CJ, Ford BA, Ford DA. Strategies for the analysis of chlorinated lipids in biological systems. Free Radic Biol Med 59: 92–99, 2013. doi: 10.1016/j.freeradbiomed.2012.06.013. [DOI] [PMC free article] [PubMed] [Google Scholar]
- 59.Weatherly DB, Atwood JA 3rd, Minning TA, Cavola C, Tarleton RL, Orlando R. A heuristic method for assigning a false-discovery rate for protein identifications from Mascot database search results. Mol Cell Proteomics 4: 762–772, 2005. doi: 10.1074/mcp.M400215-MCP200. [DOI] [PubMed] [Google Scholar]
- 60.Wildsmith KR, Albert CJ, Anbukumar DS, Ford DA. Metabolism of myeloperoxidase-derived 2-chlorohexadecanal. J Biol Chem 281: 16849–16860, 2006. doi: 10.1074/jbc.M602505200. [DOI] [PubMed] [Google Scholar]
- 61.Xu BJ, Shyr Y, Liang X, Ma LJ, Donnert EM, Roberts JD, Zhang X, Kon V, Brown NJ, Caprioli RM, Fogo AB. Proteomic patterns and prediction of glomerulosclerosis and its mechanisms. J Am Soc Nephrol 16: 2967–2975, 2005. doi: 10.1681/ASN.2005030262. [DOI] [PubMed] [Google Scholar]
- 62.Yadav AK, Doran SF, Samal AA, Sharma R, Vedagiri K, Postlethwait EM, Squadrito GL, Fanucchi MV, Roberts LJ 2nd, Patel RP, Matalon S. Mitigation of chlorine gas lung injury in rats by postexposure administration of sodium nitrite. Am J Physiol Lung Cell Mol Physiol 300: L362–L369, 2011. doi: 10.1152/ajplung.00278.2010. [DOI] [PMC free article] [PubMed] [Google Scholar]
- 63.Zhou T, Yu Z, Jian MY, Ahmad I, Trempus C, Wagener BM, Pittet JF, Aggarwal S, Garantziotis S, Song W, Matalon S. Instillation of hyaluronan reverses acid instillation injury to the mammalian blood gas barrier. Am J Physiol Lung Cell Mol Physiol 314: L808–L821, 2018. doi: 10.1152/ajplung.00510.2017. [DOI] [PMC free article] [PubMed] [Google Scholar]