Abstract
Introduction: Thorium-227 is an alpha-emitting radioisotope with potential therapeutic applications in targeted alpha therapy. Thorium-227 decays to Radium-223, which may have an independent biodistribution to that of the parent Thorium-227 radiopharmaceutical. Quantitative in vivo imaging with sodium iodide (NaI) detectors is challenging due to cross-talk between neighboring γ-photopeaks as well as scattered γ-photons. The aim of this work was to validate the use of a spectral analysis technique to estimate the activity of each isotope within a region of interest applied to a pair of conjugate view planar acquisitions, acquired at multiple energy windows.
Methods: Energy spectra per unit activity arising from unscattered Thorium-227 photons and Radium-223 photons as well as from scattered photons were modeled. These spectra were scaled until the combination of these component spectra resulted in the closest match to the measured data in four energy windows.
Results: Measured estimates of activity followed the known decay curves in phantoms representative of a human torso. The mean errors in estimating Thorium-227 and Radium-223 were 5.1% (range −8.0% to 40.0%) and 3.4% (range −50.0% to 48.7%), respectively. The differences between the integrals of the theoretical and estimated time activity curve were <10% for both Thorium-227 and Radium-223.
Conclusion: γ-camera quantification of Thorium-227 and Radium-223 can be achieved by using multiple energy window acquisitions.
Keywords: Thorium-227, Radium-223, quantitative imaging, alpha emitter imaging, theragnostic
Introduction
Thorium-227 (227Th) is an α-emitting radionuclide with a half-life of 18.7 days. 227Th decays to Radium-223 (223Ra), which decays by a series of further α- and β−-emissions to the stable isotope Lead-207, with a half-life of 11.4 days (Table 1).1 223Ra is a calcium analogue that demonstrates increased uptake in regions of high osteoblastic activity. This has led to routine clinical application in the treatment of metastatic castrate-resistant prostate cancer patients with bone metastases and no visceral metastases.2 223Ra also emits a number of γ-photons and several studies have demonstrated that γ-camera imaging may be used to quantitatively assess the biodistribution of 223Ra in vivo, both to normal organs and to target lesions.3–6
Table 1.
227Th Decay Scheme: Photon Energies with an Abundance >1% Are Shown
| Decay | Decay mode | Half-life | Principal photon energies (keV) (% abundance) |
|---|---|---|---|
| 227Th→223Ra | α | 18.7 days | 12.3 (21.0), 50.1 (8.0), 79.7 (1.7), 85.4 (1.2), 88.5 (2.0), 94.0 (1.4), 210.7 (1.1), 236.0 (12.3), 256.3 (7.0), 286.1 (1.5), 300.0 (2.3), 304.5 (1.2) 329.9 (2.7), 334 (1.1) |
| 223Ra→219Rn | α | 11.4 days | 11.7 (25.0), 81.1 (15.0), 83.8 (24.9), 94.9 (11.3), 122.3 (1.2), 144.2 (3.2), 154.2 (5.6), 269.5 (13.7), 323.9 (3.9), 338.3 (2.8), 445.0 (1.3) |
| 219Rn→215Po | α | 4.0 s | 11.1 (1.1), 271.2 (10.8), 401.8 (6.4) |
| 215Po→211Pb | α | 1.8 ms | |
| 211Pb→211Bi | β− | 36.1 min | 404.9 (3.8), 427.1 (1.8), 832.0 (3.5) |
| 211Bi→207Tl | α | 2.1 min | 10.3 (1.1), 72.9 (1.3), 351.1 (12.9) |
| 207Tl→207Pb | β− | 4.8 min |
Although 223Ra can be used to treat bone metastases, 223Ra ions do not specifically target cancer cells and therefore cannot be used to treat soft tissue metastases. For radionuclides to be taken up by specific cells, the radionuclide must be labeled to a targeting agent such as an antibody or antibody fragment that has a specific affinity to a biological target presented by the cell.
227Th has been successfully labeled to a number of such antibodies.7–14 However, 223Ra does not easily form stable complexes.15 Therefore, it is possible that after the decay of 227Th to 223Ra, 223Ra may dissociate from the antibody complex, resulting in free 223Ra ions with a biodistribution independent of the 227Th-labeled antibody. As these 227Th compounds enter clinical trials, there is a need to assess these potentially independent biodistributions.
Dual-isotope imaging can be performed with γ-cameras by using separate energy windows associated with the photopeaks of the different isotopes. In the case of these trials, a multicenter imaging protocol using the energy windows detailed in Table 2 has been implemented. The rationale for these windows is discussed by Larsson et al.16 However, downscatter and cross-talk between neighboring photopeaks, due to the finite energy resolution of sodium iodide (NaI) detectors, mean that quantitation of 227Th and 223Ra requires careful analysis of the photons collected in these windows.
Table 2.
Emissions Anticipated Within Energy Windows
| 75–100 keV | 135–165 keV | 215–260 keV | 260–285 keV | |
|---|---|---|---|---|
| 227Th primary photons | ✓ | ✓ | ||
| 223Ra primary photons | ✓ | ✓ | ✓ | |
| 227Th scattered photons | ✓ | ✓ | ✓ | |
| 223Ra scattered photons | ✓ | ✓ | ✓ | ✓ |
The energy spectrum of measured counts in response to multiple radionuclides can be considered to be the weighted sum of a number of basis functions.17 Each function is representative of the energy spectrum associated with a subclass of photons, for example, primary photons from an isotope of particular interest.
The aim of this article is to describe and validate a spectral analysis methodology to process the data from multiple energy windows detecting 223Ra and 227Th emissions to determine the activity of each isotope within a defined region of interest (ROI).
Methods
Spectral analysis methodology
Gamma photons are emitted at discrete energies with probabilities of emission per unit decay, n(E), characteristic of a particular radioisotope. The measured count-rate in the presence of unknown activities of 227Th and 223Ra (ATh227 and ARa223) can be represented as a continuous function of energy, C(E) obtained from a weighted summation of component energy spectra. The component energy spectra represent count-rates per unit activity arising from unattenuated primary photons emitted by either 223Ra and its daughter isotopes, PRa223(E), or by 227Th, PTh227(E), as well as photons originally arising from either isotope that are scattered within the patient or the γ-camera collimator before detection, SRa223(E) and STh227(E) respectively.
Equation 1

It is expected that the number of scattered photons is proportional to the activity of the isotopes. In Equation 1, the term B is a constant of proportionality describing this relationship. Bkg (E) represents a contribution to the count-rate per unit activity from background radiation. For the purposes of this investigation, it was assumed that this could be determined experimentally. If the functions PTh227, PRa223, STh227, and SRa223 are known, then it can be seen that the relative weight of these component functions can be adjusted until a best fit to the background-corrected measured total counts is obtained. This section describes the derivation of these functions accounting for patient-specific attenuation, modeling of the thallium doped sodium iodide (NaI(Tl)) energy resolution, and the absolute sensitivity of the γ-camera.
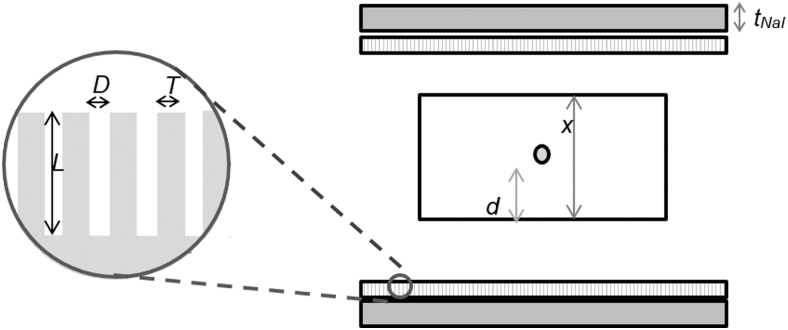
A source of radiation within an attenuating medium (assumed to be water) of thickness x and attenuation coefficient μ was considered within the field of view of a double-headed γ-camera. The γ-camera heads comprised NaI(Tl) crystals with a thickness t, as well as collimators characterized by parallel holes of diameter D, length L, separated by lead septa of thickness T (Fig. 1).
FIG. 1.
Schematic of source in γ-camera field of view.
The conjugate view technique is commonly used to quantify activity from planar images. Background-corrected count-rates are measured both anterior (Cant(E)) and posterior (Cpost(E)) to the patient. The background corrected geometric mean count-rate, , is defined as the square root of the product of these measurements.
Equation 2

where μ(E) is the energy-specific attenuation coefficient of water and is the theoretical count-rate in the absence of attenuation.
The relationship between C0(E) and the source activity, A, is determined by the probability of photon emission, n(E) and the sensitivity, SGC, of the γ-camera.
Equation 3

Sensitivity is determined by the proportion of photons entering the detector undergoing photoelectric absorption as well as by the geometric efficiency of the collimator, :
Equation 4

Equation 5

Equation 6

where k is a parameter dependent on the shape of the collimator holes, tNaI is the thickness of the γ-camera crystal, and is the energy-dependent photoelectric absorption coefficient of NaI(Tl).18
A model for the geometric mean count-rate per unit activity arising from a radionuclide emitting gamma photons, characterized by the spectrum, n(E), was generated by substituting Equations 3–6 into Equation 2 and dividing by A.
Equation 7
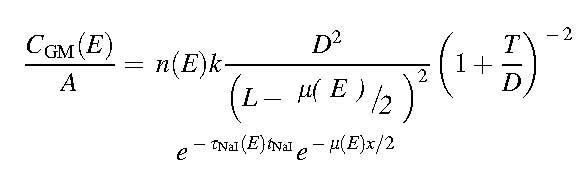
The energy resolution of the detector ER(E) was then modeled by convolving the result of Equation 7 with a Gaussian kernel to represent the measured geometric mean count-rate per unit activity CGM_measured(E). The width of the kernel was energy dependent, according to
Equation 8

where
Equation 9

and w was determined empirically by analyzing measurements of energy resolution over multiple energies up to 511 keV. These measurements were made during acceptance testing and were performed according to the NEMA-1 2012 standard.19 For the Siemens Intevo γ-camera, w was found to be 0.09. Therefore,
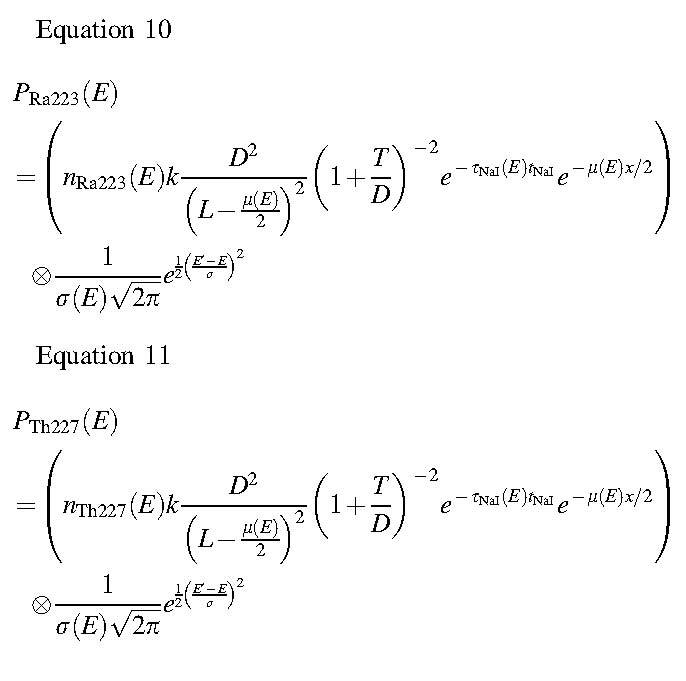
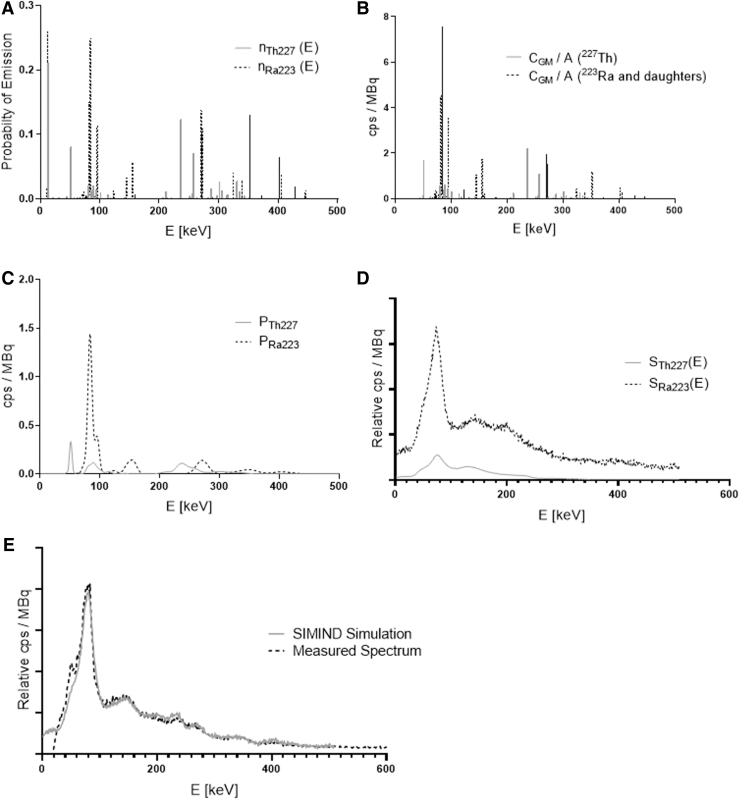
The analytical modeling of unattenuated photons is summarized in Figure 2A–C.
FIG. 2.
Modeling of primary photon and scattered photon energy spectrum components. (A) Energy spectra of emitted photons from 227Th as well as from 223Ra and daughter isotopes. (B) Modeled geometric count-rate CGM(E) per unit activity without consideration of energy resolution. (C) Modeled geometric count-rates PTh227(E) and PRa223(E) after convolution of CGM/A with energy-dependent kernel modeling energy resolution. (D) Functions showing shape of scatter modeled within γ-camera field of view. (E) A comparison of the γ-camera spectrum observed on day 9 of imaging the Jaszczak phantom with the SIMIND simulation of a cylindrical phantom.
To derive the energy spectra components associated with scattered photons, initial estimates of the basic functions STh227(E), and SRa223(E) were generated from energy spectra derived from Monte Carlo simulations (Fig. 2D). Simulations were performed by using the SIMIND Monte Carlo software20 of a water-filled cylindrical phantom (20 cm diameter and 20 cm height) homogenously filled with either 227Th or 223Ra and placed 12 cm from a Siemens Symbia γ-camera. Simulation details and input data for the simulated collimator, crystal, backscatter layer, intrinsic energy, and intrinsic spatial resolution were based on validated criteria from an earlier study21 and are summarized in Table 3.
Table 3.
SIMIND Input Parameters for Simulation of a Siemens Symbia γ-Camera Detector
| SIMIND input | Value |
|---|---|
| Crystal thickness (NaI(Tl)) | 9.5 (mm) |
| Backscatter thickness (PMT) | 11.0 (cm) |
| Cover thickness (Al) | 0.1 (mm) |
| Gap between collimator and detector | 1.0 (mm) |
| Energy resolution (@140 keV) | 9.0 (%) |
| Intrinsic spatial resolution (@140 keV) | 3.6 (mm) |
| Max. scatter order | 10 |
| Cut off energy | 1.0 keV |
NaI(Tl), thallium doped sodium iodide; PMT, photomultiplier tubes.
Events from primary, scattered, and septal penetrating photons incident on the detector were binned according to the interaction type. An energy spectrum of all detected events less any event due to an attenuated primary photon was recorded and used to define STh227(E) and SRa223(E).
Thus, the background-corrected geometric mean count-rate in an acquired energy window , was modeled by weighting the photopeak and scatter energy spectra as follows.
Equation 12
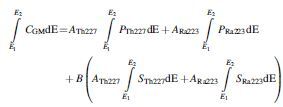
The counts due to primary photons are assumed to be directly proportional to the activity of the respective isotopes. In the case of the scattered photons, an explicit relationship between the activity of an isotope and the number of counts is not modeled. Instead, the parameter, B, is an arbitrary coefficient used to scale a function describing the presumed shape of the scatter spectra.
Emission spectra for all isotopes in the 227Th decay chain were obtained from the Brookhaven database.1 The NIST XCOM database was used to generate the attenuation coefficient of water as well as the attenuation due to photoelectric absorption in NaI(Tl) over the relevant energy ranges.22 Geometric sensitivity was defined for a high-energy collimator parameterized by hexagonal holes of 4 mm diameter and 59.7 mm length with lead septa 2 mm thick. The thickness of the NaI(Tl) detector was 9.5 mm. Values of ATh227, ARa223, and B were obtained by using a generalized reduced gradient algorithm23 (as implemented within the solver function of MS Excel) to minimize the sum of the squared differences between the background corrected counts, and the modeled counts predicted by Equation 12 in each of the acquired energy windows.
To facilitate empirical adaption of the scatter spectrum, a modified scatter model was defined as follows:
Equation 13
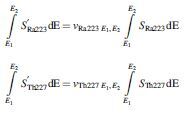
Further, it was anticipated that a “one size fits all” scatter model may not be appropriate for all scenarios. Experiments were performed to test this assumption and to determine any limits on the model used for activity estimation.
Phantom experiments
Two phantoms containing 227Th and 223Ra were used for experiments. The first was a cylindrical Jaszczak type containing two spheres of volume 14.6 and 83 mL, respectively (Fig. 3). This was selected to be representative of a patient. The smaller sphere was filled with 0.15 MBq 223Ra. A vial of 227Th was received within 12 h of purification. This solution was used to fill the 83 mL sphere with 0.54 MBq of 227Th, in addition to 0.014 MBq 223Ra. The same solution was also added to the water-filled background compartment of the phantom such that it contained 0.98 MBq 227Th, in addition to 0.025 MBq 223Ra build-up. Therefore, the sphere to background ratio was ∼40. Initial measurements of activity were made on a Capintec CRC-15R calibrator before dispensing by weight. The calibrator had previously been set up with factors traceable to the National Physics Laboratory (NPL) for both 223Ra and 227Th.24
FIG. 3.
Fused planar image of Jaszczak phantom containing 227Th/223Ra anterior γ-camera image and CT scout image.
The second phantom was a flat sensitivity phantom (100 × 100 × 5 mm) filled 9 days after purification with 1.33 MBq 227Th as well as the build-up associated with 0.92 MBq of 223Ra. These activities were also confirmed with an NPL traceable calibrator before filling the phantom. This phantom was used to explore the effectiveness of the activity quantification.
The Bateman equations25 describing the relationship between the activity of a parent and daughter radionuclide were used to calculate the activity in each phantom compartment as a function of time. Phantoms were imaged on a double-headed Siemens Intevo SPECT-CT system. The phantom was positioned in the center of the imaging couch. Anterior and posterior images were acquired for 20 min. Counts were acquired at energy windows 75–100, 135–165, 215–260, and 260–285 keV. The image matrix was 64 × 64 (pixel size of 9.59 × 9.59 mm). After planar imaging, a CT scout image of the phantom was also acquired to estimate the amount of attenuating tissue between the detector heads. The equivalent thickness of water, x, within an ROI was derived from the mean pixel value, p, of the scout image across that ROI according to Equation 14. This equation provides an estimate of the thickness in cm and was derived empirically by analyzing CT scout images of increasing thicknesses of solid water and included the effect of the patient couch.
Equation 14

Background subtraction of the γ-camera images was performed by using counts acquired over 9 h and scaled to the phantom acquisition duration.
The Jaszczak phantom was initially imaged on the day of filling (day 0). Further images were acquired at 1, 2, 3, 4, 7, 9, 11, 14, 16, 22, 24, and 29 days after filling.
The ROIs larger than the spheres themselves were placed over the spheres within the body of the phantom to account for spill out due to the partial volume effect. Identically sized background ROIs were placed inferiorly to the spheres to subtract counts arising due to underlying and overlying activity within the background compartment. The same process was used for all energy windows, views, and imaging time points.
Values for the set of scaling coefficients ν were determined empirically by minimizing the difference between the modeled counts (using the known activities as a priori information) and the measured counts arising from the larger sphere. Data from day 0 were used to define the 227Th coefficients νTh227 75–100keV, νTh227 135–165keV, νTh227 215–260keV, and νTh227 260–285keV at the point of minimal 223Ra build-up. Data from day 14 were used to subsequently define the 223Ra coefficients νRa223 75–100keV, νRa223 135–165keV, νRa223 215–260keV, and νRa223 260–285keV. These coefficients were subsequently applied during the analysis of data from all other imaging time points.
Quantification accuracy was assessed at each time point with respect to the known activities inside the spheres as well as with respect to the integral of the known time activity curve. The trapezoid integration method was used to measure the cumulated activity.
Additional acquisitions were also obtained on day 2 and 29 with 4 cm solid water placed between the camera and the Jaszczak phantom to test the activity estimation technique on a phantom geometry not used for calibration purposes.
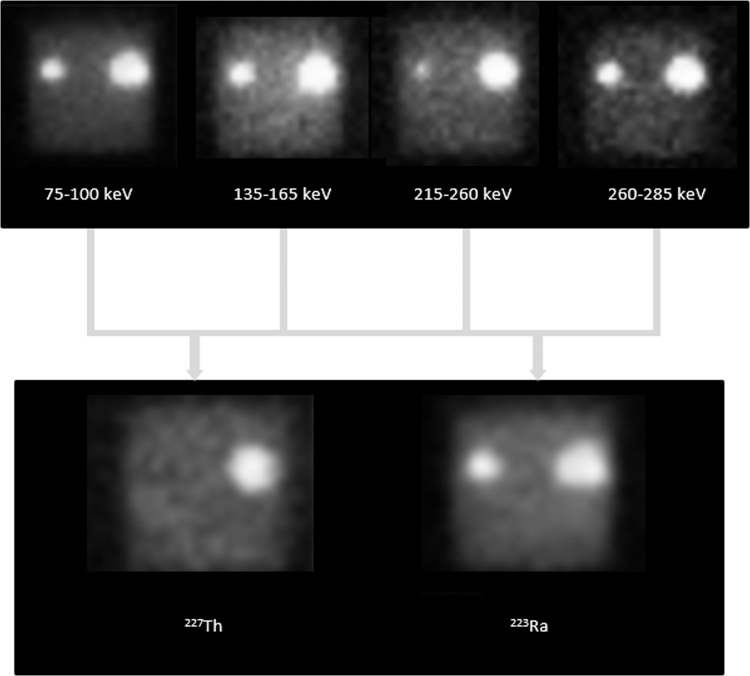
Pixel-by-pixel analysis of the anterior phantom images acquired on day 22 was performed to demonstrate the potential of the technique to produce distinct images of the 227Th and 223Ra distributions.
To investigate the effect of differing geometries, the sensitivity phantom was imaged on day 9, 11, 16, 18, 22, 30, 34, and 42. The accuracy of the spectral analysis was tested by comparing the activity estimates of at each time point with the known activities in the phantom. On day 16, additional images were acquired with slabs of solid water ranging from 20 to 120 mm placed between the sensitivity phantom and the γ-camera. The known activity of the phantom was used to define scatter scaling coefficients νRa223 75–100keV, νRa223 135–165keV, νRa223 215–260keV, and νRa223 260–285keV as a function of the solid water thickness.
A further experiment was carried out to establish the effect of the distance between the sensitivity phantom and the detector. Acquisitions were performed by using a sensitivity phantom (containing 2.4 MBq 227Th and 1.4 MBq 223Ra) at distances of 2, 5, 10, 15, and 20 cm between the phantom and the detector above the couch. The posterior detector remained in a fixed position. The counts in each window were recorded. In addition, the variation in the activity estimated was analyzed as a function of source to detector distance.
Results
Application of the spectral analysis methodology resulted in estimates of activity for both 227Th and 223Ra with an average difference between the known activity and the estimated activity of 5.1% (range −8.0% to 40.0%) and 3.4% (range −50.0% to 48.7%), respectively (Fig. 4 and Table 4). In the case of the smaller sphere that was filled only with 223Ra, estimates of 0 MBq 227Th were obtained in 11 out of 13 measurements. Assessments of the integral of the time activity curves were accurate to within 10% of the ground truth values.
FIG. 4.
Measurements of 227Th and 223Ra within Jaszczak phantom spheres compared with ground truth activities. (A) 14 mL sphere containing only 223Ra. (B) 83 mL sphere containing both 227Th and 223Ra.
Table 4.
Percentage Errors in Activity and Cumulated Activity Estimation
| 14 mL sphere | 83 mL sphere | |||
|---|---|---|---|---|
| Error | 227Th | 223Ra | 227Th | 223Ra |
| Accuracy of activity estimate | n/a | −6.8% (range −50.0% to 10.9%) | 5.1% (range −8.0% to 40.0%) | 13.6% (range −15.0% to 48.7%) |
| Accuracy of cumulated activity estimate | n/a | −8.3% | 5.3% | 7.3% |
The same methodology was also able to predict the activity of the phantom inserts placed in a different geometry to that used for calibration (Table 5). Despite the increased attenuation and scatter, the average difference between the known activity and the estimated activity was 8.3% (range 0.0% to 16.7%) and −11.0% (range −43.0% to 16.7%) for 227Th and 223Ra, respectively.
Table 5.
Comparison of Measured Versus Known Activities for Case of Additional Attenuation
| Time post purification (hours) | 14 mL sphere |
83 mL sphere |
||||||
|---|---|---|---|---|---|---|---|---|
|
227Th activity (MBq) |
223Ra activity (MBq) |
227Th activity (MBq) |
223Ra activity (MBq) |
|||||
| Expected | Measured | Expected | Measured | Expected | Measured | Expected | Measured | |
| Day 2 | 0.0 | 0.0 | 0.13 | 0.11 | 0.50 | 0.50 | 0.07 | 0.10 |
| Day 29 | 0.0 | 0.0 | 0.03 | 0.04 | 0.18 | 0.15 | 0.24 | 0.20 |
Pixel-by-pixel analysis of the acquired images could be used to produce images of the distribution of each respective isotope. This is demonstrated in Figure 5. The smaller sphere containing 223Ra only is seen in all energy windows. However, the sphere is not seen in the 227Th image.
FIG. 5.
Demonstration of pixel-by-pixel analysis resulting in successful separation of 227Th and 223Ra distributions.
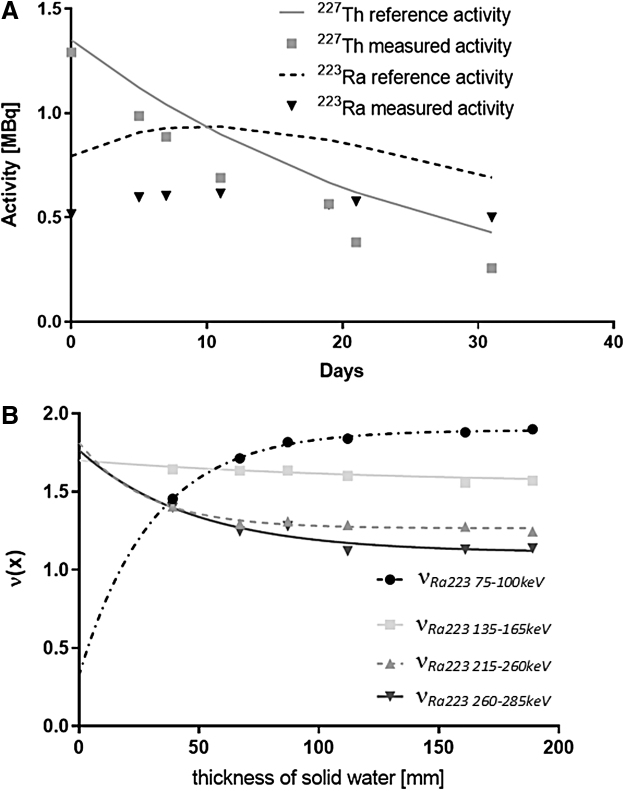
Analysis of the flat sensitivity phantom data acquired over multiple timepoints demonstrated a systematic underestimation of both 227Th and 223Ra (21% and 33% respectively) with respect to the known activities in the phantom (Figure 6A).
FIG. 6.
(A) Accuracy of activity estimation for sensitivity phantom using proposed scatter model. (B) Scaling coefficients νRa223 75–100keV, νRa223 135–165keV, νRa223 215–260keV, and νRa223 260–285keV as a function of the amount of attenuating water between γ-camera heads.
The scaling coefficients required to correct this underestimate are demonstrated in Figure 6B as a function of the amount of scatter material between the camera heads. As the amount of scatter material increases, the coefficients become consistent and appear to stabilize.
The effect of changing the distance between the sensitivity phantom and the detector head is demonstrated in Figure 7. At close distances there was an increase in the counts detected within all energy windows. For estimation of 223Ra activity, this did not result in a change in the estimated activity. For 227Th, a relative increase in the estimated activity of up to 18% was observed as the distance between the source and detector decreased.
FIG. 7.
(A) Variation of acquired counts as a function of source to detector distance. (B) Estimated 227Th and 223Ra activity as a function of source to detector distance.
Discussion
In this work, we have attempted to develop a methodology to simultaneously quantify 227Th and 223Ra using planar γ-camera imaging. This is challenging, primarily due to the low activities administered to patients currently participating in clinical trials of 227Th-labeled antibodies. Planned activities typically range between 1.5 MBq – 6.0 MBq. We observed count-rates of ∼10.0 cps/MBq within the 215–260 keV window due to 227Th photons and ∼70 cps/MBq within the 75–100 keV window arising from 223Ra. Consequently, long acquisition times are required. Current 227Th-targeted α-therapy study design allows for up to 1 h of imaging time. Therefore, quantitation may be limited to organs within the thorax, abdomen, and pelvis, which can typically be covered by two fields of view. Low count-rates also lead to the use of larger pixel sizes, resulting in poorer spatial resolution and the increased potential for partial volume effects.
To quantify planar γ-camera images, the effect of attenuation and scatter must be accounted for. In this work, attenuation was modeled by an analytical model of photon transport within the patient and the γ-camera. Conventional scatter techniques such as the triple energy window correction are inappropriate due to the proximity of the respective photopeaks of 227Th and 223Ra.
Instead, an empirical model of the shape of the scatter spectra was scaled along with the modeled spectra of attenuated 227Th and 223Ra photons to fit the measured data to quantify planar conjugate images of 227Th and 223Ra distributions. Therefore, the accuracy with which the shape of the scatter spectra is known will affect the accuracy of the technique. The basis for our scatter spectra was a Monte Carlo simulation of a cylindrical phantom. When applying this model to a flat sensitivity phantom, systematic biases in estimated activity were observed for both 227Th and 223Ra. That is, the appropriateness of the scatter model to the patient anatomy must be considered. However, as increased amounts of scatter material were placed around the sensitivity phantom, the ad hoc changes to the scatter model required for accurate quantification stabilized at thicknesses above 100 mm. Indeed, when additional scatter material was placed around the Jaszczak phantom, no such biases were observed when estimating activity within the spheres. For the adult population participating in these clinical trials, patient thickness is expected to be greater than 100 mm.
There are a number of factors that lead to uncertainties in the activity estimates produced by this method. The analytical model for primary photon detection relies in the first instance on accurate knowledge of the gamma and x-ray photon emissions associated with each isotope. We used the Brookhaven database as a source of this information. More recently, Collins et al. published revised figures detailing the intensities of γ-photons emitted by 227Th.26 Comparison of these measurements against the Brookhaven database shows a discrepancy between 75–100 keV due to the absence of x-ray emissions from the Collins publication but minimal differences (<0.5%) when the convolved spectra is integrated over the remaining energy windows.
Greater uncertainty is likely to result from the fitting of the modeled data to the measured data. As described earlier, these image acquisitions are characterized by low counts, particularly within the higher energy windows. Therefore, the uncertainty in the measured counts will translate to an uncertainty in the isotope activities arising from the model fit. A limitation of this work is that the model fit was not weighted by the varying count uncertainty across the different energy windows. For the purposes of dosimetry, uncertainty in individual data measurements may be mitigated by carrying out multiple measurements over several time points. We observed differences of up to 50% between the estimated activity and the known activity but differences of <10% between the estimated and the known time integrated activities.
We also observed that changes in septal penetration as the distance between the source and the detector was varied led to variations of up to 18% in estimates of 227Th activity, although estimation of 223Ra activity remained consistent. For this reason, we would recommend the use of an HE collimator over an ME collimator to minimize septal penetration.
There remain limitations when quantifying planar γ-camera data. Our phantom setup simulated a relatively high organ to background ratio. Organs with activity concentrations closer to background activity concentration may not result in a clear signal that can be quantified. Further, organs of interest often overlap, making separation of counts challenging.27 Therefore, further investigations should be made into the potential of the technique when applied to SPECT imaging. Despite the low activity administered to patients receiving 223Ra, a number of investigations have reported that SPECT imaging of α-emitters is feasible.28–30
Conclusions
Quantification of 227Th and 223Ra activity in vivo is possible by using multiple energy windows on a standard double-headed γ-camera.
Author Confirmation Statement
I.M. conceived and implemented the analytical methodology presented, analyzed the data. B.R. implemented the analytical methodology and undertook experimental work. R.C. undertook experimental work. J.G. performed Monte Carlo simulations and provided advice on the analytical methodology. A.C. contributed to the article. G.D.F. contributed to the article. All co-authors reviewed and approved the article before submission.
Disclosure Statement
Thorium-227 and Radium-223 were provided by Bayer AG. A.C. is an employee of Bayer AG.
Funding Information
NHS funding was provided to the NIHR Biomedical Research Centre at the Royal Marsden and the ICR. We acknowledge infrastructure support from the NIHR Royal Marsden Clinical Research Facility Funding.
References
- 1. Stabin MG, da Luz LC. Decay data for internal and external dose assessment. Health Phys 2002;83:471. [DOI] [PubMed] [Google Scholar]
- 2. Parker C, Nilsson S, Heinrich D, et al. Alpha emitter Radium-223 and survival in metastatic prostate cancer. N Engl J Med 2013;369:213. [DOI] [PubMed] [Google Scholar]
- 3. Chittenden SJ, Hindorf C, Parker CC, et al. A phase 1, open-label study of the biodistribution, pharmacokinetics, and dosimetry of Ra-223-dichloride in patients with hormone-refractory prostate cancer and skeletal metastases. J Nucl Med 2015;56:1304. [DOI] [PubMed] [Google Scholar]
- 4. Murray I, Chittenden SJ, Denis-Bacelar AM, et al. The potential of Ra-223 and F-18-fluoride imaging to predict bone lesion response to treatment with Ra-223-dichloride in castration-resistant prostate cancer. Eur J Nucl Med Mol Imaging 2017;44:1832. [DOI] [PMC free article] [PubMed] [Google Scholar]
- 5. Pacilio M, Ventroni G, De Vincentis G, et al. Dosimetry of bone metastases in targeted radionuclide therapy with alpha-emitting Ra-223-dichloride. Eur J Nucl Med Mol Imaging 2016;43:21. [DOI] [PubMed] [Google Scholar]
- 6. Hindorf C, Chittenden S, Aksnes AK, et al. Quantitative imaging of Ra-223-chloride (Alpharadin) for targeted alpha-emitting radionuclide therapy of bone metastases. Nucl Med Commun 2012;33:726. [DOI] [PubMed] [Google Scholar]
- 7. Dahle J, Borrebaek J, Melhus KB, et al. Initial evaluation of Th-227-p-benzyl-DOTA-rituximab for low-dose rate alpha-particle radioimmunotherapy. Nucl Med Biol 2006;33:271. [DOI] [PubMed] [Google Scholar]
- 8. Dahle J, Borrebaek J, Jonasdottir TJ, et al. Targeted cancer therapy with a novel low-dose rate alpha-emitting radioimmunoconjugate. Blood 2007;110:2049. [DOI] [PubMed] [Google Scholar]
- 9. Ramdahl T, Bonge-Hansen HT, Ryan OB, et al. An efficient chelator for complexation of thorium-227. Bioorg Med Chem Lett 2016;26:4318. [DOI] [PubMed] [Google Scholar]
- 10. Hagemann UB, Sommer A, Kristian A, et al. Preclinical activity of the FGFR2-targeted thorium-227 conjugate in preclinical models of colorectal, gastric and triple-negative breast cancer. AACR Meeting Abstracts 2017;Abstract 5199
- 11. Hammer S, Larssen A, Ellingsen C, et al. Preclinical pharmacology of the PSMA-targeted thorium-227 conjugate PSMA-TTC: A novel targeted alpha therapeutic for the treatment of prostate cancer. AACR Meeting Abstracts 2017;Abstract 5200
- 12. Karlsson J, Hagemann UB, Schatz C, et al. HER2-targeted thorium-227 conjugate (HER2-TTC): Efficacy in preclinical models of trastuzumab and T-DM1 resistance. AACR Meeting Abstracts 2017;Abstract 5859
- 13. Karlsson J, Cruciani V, Grant D, et al. In vitro and in vivo activity of a HER2-targeted thorium-227 conjugate (HER2-TTC) in HER2 low expressing and T-DM1/trastuzumab resistant preclinical mouse models. Eur J Cancer 2018;103:E122 [Google Scholar]
- 14. Wickstroem K, Hagemann UB, Wengner AM, et al. Increased in vitro potency and in vivo efficacy of FGFR2-targeted thorium-227 conjugate (FGFR2-TTC) in combination with the ATR inhibitor BAY 1895344. AACR Meeting Abstracts 2018;Abstract 855
- 15. Gott M, Steinbach J, Mamat C. The radiochemical and radiopharmaceutical applications of radium. Open Chem 2016;14:118–129 [Google Scholar]
- 16. Larsson E, Brolin G, Cleton A, Ohlsson T, Lindén O, Hindorf C. Optimization of imaging of thorium-227/radium-223 during radionuclide therapy. Cancer Biother Radiopharm 2020; In press. [DOI] [PubMed]
- 17. Hapdey S, Soret M, Buvat I. Quantification in simultaneous (99m)Tc/(123)I brain SPECT using generalized spectral factor analysis: A Monte Carlo study. Phys Med Biol 2006;51:6157. [DOI] [PubMed] [Google Scholar]
- 18. Lawson R. The Gamma Camera: A Comprehensive Guide. York, United: Kingdom: Institute of Physics and Engineering in Medicine, 2013 [Google Scholar]
- 19. Association NEM. Performance Measurements Of Gamma Cameras. NEMA Standards Publication NU 1-2012. Rosslyn, USA: National Electical Manufacturers Association, 2012 [Google Scholar]
- 20. Ljungberg M, Strand SE. A Monte-Carlo Program for the simulation of scintillation camera characteristics. Comput Methods Programs Biomed 1989;29:257. [DOI] [PubMed] [Google Scholar]
- 21. Gear JI, Taprogge J, White O, et al. Characterisation of the attenuation properties of 3D-printed tungsten for use in gamma camera collimation. EJNMMI Phys 2019;6:1. [DOI] [PMC free article] [PubMed] [Google Scholar]
- 22. Berger MJ, Hubbell JH, Seltzer SM, et al. XCOM: Photon Cross Section Database (version 1.5). Online document at http://physics.nist.gov/xcom National Institute of Standards and Technology. Accessed on March15, 2020
- 23. Lasdon LS, Waren AD, Jain A, et al. Design and testing of a generalized reduced gradient code for nonlinear programming. ACM Trans Math Softw 1978;4:34 [Google Scholar]
- 24. Collins SM, Keightley JD, Ivanov P, et al. The potential radio-immunotherapeutic alpha-emitter Th-227—part I: Standardisation via primary liquid scintillation techniques and decay progeny ingrowth measurements. Appl Radiat Isot 2019;145:240. [DOI] [PubMed] [Google Scholar]
- 25. Bateman H. Solution of a system of differential equations occurring in the theory of radioactive transformations. Proceedings of the Cambridge Philosophical Society, Mathematical and Physical Sciences. 1910;15:423 [Google Scholar]
- 26. Collins SM, Keightley JD, Ivanov P, et al. The potential radio-immunotherapeutic alpha-emitter Th-227—part II: Absolute gamma-ray emission intensities from the excited levels of Ra-223. Appl Radiat Isot 2019;145:251. [DOI] [PubMed] [Google Scholar]
- 27. Siegel JA, Thomas SR, Stubbs JB, et al. MIRD pamphlet no. 16: Techniques for quantitative radiopharmaceutical biodistribution data acquisition and analysis for use in human radiation dose estimates. J Nucl Med 1999;40:37S. [PubMed] [Google Scholar]
- 28. Nakayama M, Okizaki A, Uno T, et al. Radium-223 dichloride for castration resistant metastatic prostate cancer—Usefulness of the response evaluation using Ra-223 Czt Spect/ct for quantitative analysis. Eur J Nucl Med Mol Imaging 2018;45:S567 [Google Scholar]
- 29. Sakaguchi K, Yoshida S, Watanabe S, et al. Evaluation of iterative reconstruction compensated by Monte Carlo simulation for quantitative radium-223 SPECT. Eur J Nucl Med Mol Imaging 2018;45:S122 [Google Scholar]
- 30. Benabdallah N, Bernardini M, Bianciardi M, et al. Ra-223-dichloride therapy of bone metastasis: Optimization of SPECT images for quantification. EJNMMI Res 2019;9:20. [DOI] [PMC free article] [PubMed] [Google Scholar]


