Abstract
Background
Carnitine palmitoyltransferase 1C (CPT1C) is a critical enzyme that catalyzes carnitinylation of fatty acids for transport into mitochondria for β-oxidation. No previous studies have been conducted to explore the prognostic and oncogenic role of CPT1C in gastric cancer (GC).
Methods
Public RNA-sequencing data and micro-array data were extracted from The Cancer Genome Atlas (TCGA) and Gene Expression Omnibus (GEO) databases respectively. Survival analysis was performed in TCGA and GSE62254 cohorts. RT-qPCR and Western blot analyses were used to determine genes expression in GC cells. Fatty acid oxidation (FAO) assay kit was used to examine cell FAO rate. The cell proliferation ability and cell cycle were tested by using CCK-8 and cell cycle assay kits.
Results
In the both TCGA and GSE62254 cohorts, high expression of CPT1C was significantly associated with poor overall (OS) (P<0.001) and disease free survival (DFS) of GC patients (P<0.001). Silence of CPT1C significantly inhibited cell FAO rate, suppressed cell proliferation and induced cell cycle arrest, while enforced CPT1C expression had the opposite effects. However, etomoxir treatment completely restricted the increase of FAO rate, cell viability and the phase of DNA synthesis caused by enhanced CPT1C expression. Of note, CPT1C expression was transcriptionally activated by hypoxia inducible factor-1α.
Conclusions
High expression of CPT1C induced by hypoxia was closely associated with poor prognosis and can promote proliferation of GC cells.
Keywords: Gastric cancer (GC), carnitine palmitoyltransferase 1C (CPT1C), fatty acid oxidation (FAO), cell proliferation, prognosis
Introduction
Gastric cancer (GC) is currently one of most frequently diagnosed causes of death worldwide (1). Though surgical operation and adjuvant chemotherapy have been confirmed to be effective in improving prognosis of GC, patients with GC often developed post-operative relapse and the 5-year overall survival (OS) of GC remains very poor (2,3). Therefore, Thus, it is urgently need to identify the underlying mechanisms and biomarkers for the progression of GC.
Recent reports showed that alteration of lipid metabolism is a critical metabolic feature for cancer cells and has been reported to be able to contribute to tumor progression (4-8). Cancer cells always showed high rate of fatty acid oxidation (FAO) to produce energy and thus maintaining the rapid growth of cancer cells (9-13). Several enzymes catalyzing FAO have been identified in solid tumors. Carnitine palmitoyltransferase 1 (CPT1), a key enzyme in FAO, is a rate-limiting FAO enzyme that is responsible for transporting fatty acid into mitochondria and has been implicated in regulating cancer development and progression, which makes CPT1 as a potential therapeutic target for the treatment of cancer (10). However, limited studies have been conducted to reveal the prognostic and oncogenic role of CPT1 in GC and no previous studies have investigated carnitine palmitoyltransferase 1C (CPT1C), one of the CPT1 isoforms, in GC.
CPT1A, CPT1B and CPT1C are three isoforms of CPT1 (14). In this present study, we demonstrated that high expression of CPT1C instead of CPT1A and CPT1B was negatively associated with OS and disease free survival (DFS) of GC patients in The Cancer Genome Atlas (TCGA) and Gene Expression Omnibus (GEO) cohorts. Further functional study showed that attenuated CPT1C expression inhibited proliferation in GC cells, while enhanced CPT1C expression exhibited opposite effects. We present the following article in accordance with the STROBE reporting checklist. Available at http://dx.doi.org/10.21037/jgo-20-157.
Methods
TCGA database
Four CPT1 isoforms mRNA expression of patients from TCGA are available at GDC database (https://portal.gdc.cancer.gov/). Only patients with RNAseq data and intact OS information were identified form TCGA dataset. Clinicopathological characteristics, including age, gender, histology, tumor stage, grade, OS and DFS were collected.
GEO datasets preparation and data processing
Microarray data from GSE62254 dataset were downloaded from GEO (http://www.ncbi.nlm.nih.gov/geo/). The raw CEL files were downloaded and Robust Multichip Average (RMA) method was used to conduct background adjust and data normalization (15). And then, Affymetrix HG-U133 Plus 2.0 probe set IDs were mapped to the NetAffx Annotation Files.
Cell culture
The human GC cell lines used in this study were originally obtained from the American.
Type Culture Collection (Manassas, VA, USA). All cells were cultured in 1640 supplemented with 10% fetal bovine serum at 37 °C under a humidified atmosphere containing 5% CO2. Four kinds of GC cell lines with distinct aggressive features including AGS, MGC803, MNK45 and SGC7901 were used in this study.
Stable transfection
The coding sequence of human CPT1C was amplified and cloned into pCDH-CMV-MCS-EF1-Puro, a lentiviral expression vector, to generate pCDH-CPT1C. The two shRNAs (SH802438) of CPT1C were purchased from Vigene Bioscienses and were inserted into a pLKO.1 vector to generate pLKO.1-shCPT1C#1 and pLKO.1-shCPT1C#2. AGS and MGC803 cells were transfected with pLKO.1-shCPT1C#1 and pLKO.1-shCPT1C#2. The MNK45 and SGC7901 were transfected with pCDH-CPT1C or the control vector. After being transfected for 48 h, positive cells were selected with puromycin (2 µg/mL, Sigma-Aldrich).
RNA isolation, reverse transcription, and qRT-PCR
TRIzol reagent (Thermo Fisher Scientific) was used to isolate the total RNA form GC cells and the concentration and purity of RNA were examined by using Nanodrop 2000 (Thermo Fisher Scientific). PrimeScript™ RT Master Mix (Takara) was further used to conduct reverse transcription. qRT-PCR was performed under the 7900 real-time PCR procedure (ABI, Life Technology). The primers used for β-actin were 5'-CATGTACGTTGCTATCCAGGC-3' (Forward) and 5'-CTCCTTAATGTCACGCAC GAT-3' (Forward) and 5'-CTCCTTAATGTCACGCACGAT-3' (Reverse) CPT1C were 5'-TTTGCCTCGTGTTTGTGGG-3' (Forward) and 5'-CAGCCGTGGTAGGAC AGAA-3' (Reverse).
Cell viability and cell apoptosis measurement
FITC Annexin V Apoptosis Detection Kit (BD, La Jolla, CA, USA) was used to determine the apoptotic rate of GC cells and CCK-8 assay kit was used to test cell viability in according to the manufacturer’s instructions.
FAO assay
Assessment of FAO in GC cells was performed using FAO assay kit (Abcam) according to the manufacturer’s instructions.
Western blotting
Total protein was extracted from gastric cell samples using RIPA lysis buffer containing protease inhibitor cocktail. Equal quantities (1 µg) of cellular proteins were resolved by sodium dodecyl sulfate-polyacrylamide gel electrophoresis, transferred onto polyvinylidene difluoride membranes, and immunoblotted with primary antibody for detection of β-actin (1/1,000 dilution; Abcam 8226), CPT1C (1/1,000 dilution; Proteintech 66072-1-Ig), and HIF1α (1/1,000 dilution; Proteintech, 20960-1-AP) overnight at 4 °C. After incubation with secondary antibody (anti Rabbit Ab150077 or anti Mouse Ab150113), blots were visualized using ECL (Pierce, Thermo Scientific, USA) and detected using a BioImaging System.
CPT1C promoter reporter assay
CPT1C promoter region was cloned into pGL3-basic luciferase reporter vector. SGC7901 and MNK45 cells were co-transfected with pGL3-basic-CPT1C, pRL-TK vectors and HIF1α overexpressing plasmids using Lipofectamine 3000. After 48 h transfection, cells were harvested and analyzed by using Dual-Luciferase Reporter Assay System (Promega) according to manufacturer’s instruction.
Statistical analyses
All statistical analyses were performed using R software (R version 3.5.0, https://www.r-project.org/). Data was presented as mean ± standard deviation. Significant differences between two groups were computed using Wilcoxon rank-sum test for data with skewed distribution or Student’s test for data with normal distribution. Univariate Cox regression analysis was used to detect the prognostic factor for OS and DFS. The median value of CPT1s was used to divided patients into low and high level groups and Kaplan-Meier method was further used to calculate the cumulative survival rate and log-rank test was used to compare survival difference. The Spearman rank correlation test was used to examine the association between HIF1A and CPT1C expression. P value <0.05 was considered significant.
The study was conducted in accordance with the Declaration of Helsinki (as revised in 2013). The study has been examined and approved by the Pujiang People’s Hospital (No. 04073-3-1711A). Informed consent was not available in this study for all the data of patients were derived from public TCGA and GEO databases.
Results
CPT1C was a prognostic biomarker in TCGA dataset
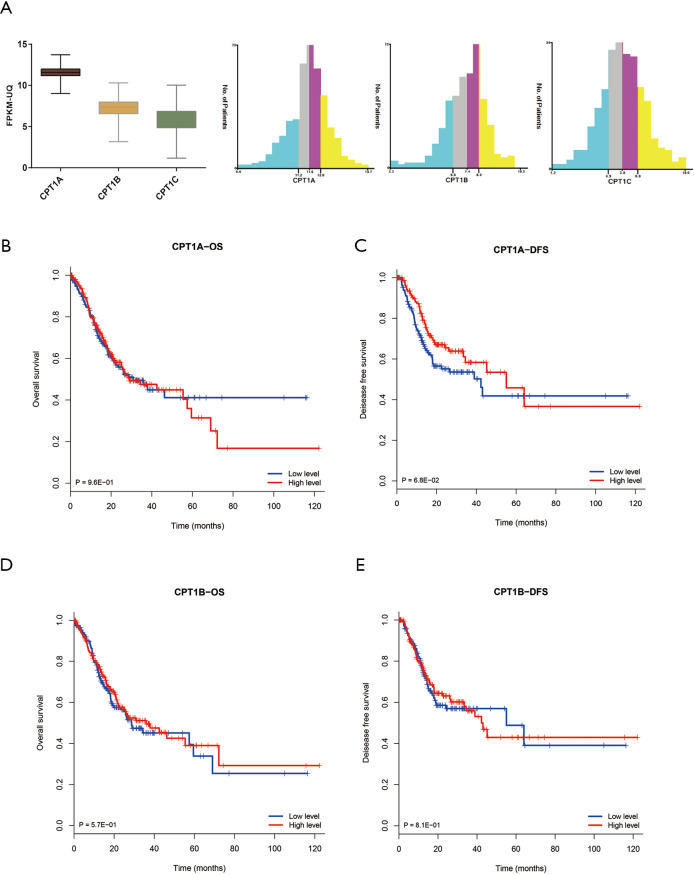
A total of 407 GC patients with RNA-seq expression data and follow-up information were identified from TCGA database. The basic clinical feature was described in Table 1. The distribution of CPT1A, CPT1B and CPT1C expression were demonstrated in Figure S1A and CPT1A showed the highest average expression level.
Table 1. Basic clinical features of patients from TCGA dataset.
| Features | N | % |
|---|---|---|
| Age | ||
| <60 | 120 | 29.5 |
| ≥60 | 284 | 69.8 |
| Unknown | 3 | 0.7 |
| Sex | ||
| Female | 146 | 35.9 |
| Male | 261 | 64.1 |
| Stage | ||
| I | 53 | 13 |
| II | 122 | 30 |
| III | 166 | 40.8 |
| IV | 41 | 10.1 |
| Unknown | 25 | 6.1 |
| Histology | ||
| Adenocarcinoma | 305 | 74.9 |
| Mucinous | 20 | 4.9 |
| Signet ring cell carcinoma | 13 | 3.2 |
| Diffuse type | 69 | 17 |
| Grade | ||
| G1/G2 | 155 | 38.1 |
| G3 | 243 | 59.7 |
| Unknown | 9 | 2.2 |
TCGA, The Cancer Genome Atlas.
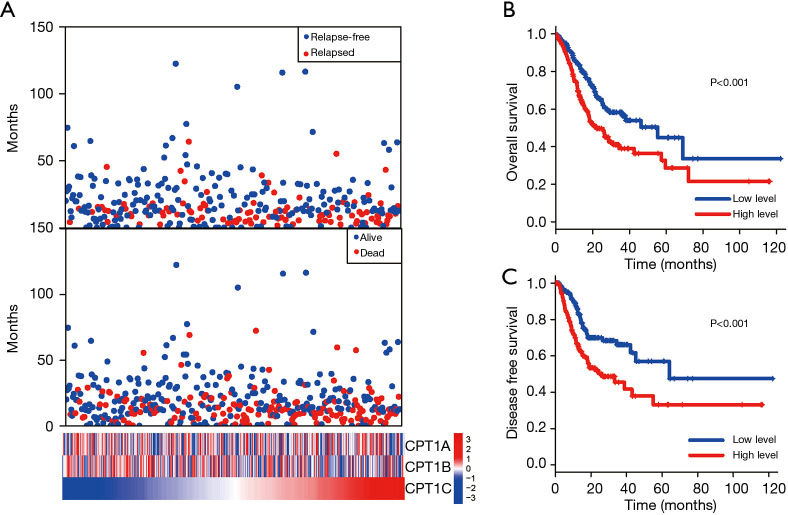
Cox regression analysis was conducted to analyze the prognostic value of the three isoforms and found that only CPT1C was independently associated with OS (Tables 2,3, Figure 1A) and DFS (Tables 2,3, Figure 1A). Instead, CPT1A and CPT1C was not a prognostic factor (Tables 2,3, Figure 1A). We further divided TCGA cohort into low or high expression groups based on median expression of CPT1C and Kaplan Meier survival analysis demonstrated that patients with high expression of CPT1C showed strikingly shorter OS (P<0.001, Figure 1B) and DFS (P<0.001, Figure 1C). However, no significant difference was observed between survival curves of patients with high or low expression of CPT1A (Figure S1B,C) and CPT1B (Figure S1D,E).
Table 2. Univariate analysis of OS and DFS in TCGA dataset.
| Factor | OS | DFS | |||||
|---|---|---|---|---|---|---|---|
| HR | 95% CI | P | HR | 95% CI | P | ||
| Age | 0.019 | 0.701 | |||||
| <60 | 1 | 1 | |||||
| ≥60 | 1.545 | 1.074–2.222 | 1.082 | 0.724–1.617 | |||
| Sex | 0.264 | 0.005 | |||||
| Female | 1 | 1 | |||||
| Male | 1.211 | 0.866–1.694 | 1.92 | 1.218–3.028 | |||
| Stage | <0.001 | 0.017 | |||||
| I | 1 | 1 | |||||
| II | 1.494 | 0.776–2.879 | 1.998 | 0.953–4.187 | |||
| III | 2.413 | 1.311–4.443 | 2.366 | 1.157–4.840 | |||
| IV | 3.978 | 1.988–7.962 | 3.79 | 1.637–8.775 | |||
| Histology | 0.005 | 0.198 | |||||
| Adenocarcinoma | 1 | 1 | |||||
| Mucinous | 0.246 | 0.078–0.776 | 0.377 | 0.119–1.195 | |||
| Signet ring cell carcinoma | 2.333 | 1.184–4.598 | 1.825 | 0.738–4.516 | |||
| Diffuse type | 0.85 | 0.55–1.032 | 0.994 | 0.613–1.613 | |||
| Grade | 0.027 | 0.139 | |||||
| G1/G2 | 1 | 1 | |||||
| G3 | 1.461 | 1.045–2.043 | 1.353 | 0.907–2.018 | |||
| CPT1A | 0.995 | 0.801–1.235 | 0.961 | 0.845 | 0.650–1.099 | 0.21 | |
| CPT1B | 0.941 | 0.820–1.081 | 0.391 | 1.022 | 0.855–1.223 | 0.808 | |
| CPT1C | 1.184 | 1.071–1.390 | <0.001 | 1.217 | 1.083–1.367 | <0.001 | |
TCGA, The Cancer Genome Atlas; DFS, disease free survival; OS, overall survival.
Table 3. Multivariate analysis of OS and DFS in TCGA dataset.
| Factor | OS | DFS | |||||
|---|---|---|---|---|---|---|---|
| HR | 95% CI | P* | HR | 95% CI | P* | ||
| CPT1A | 0.962 | 0.768–1.205 | 0.735 | 0.845 | 0.650–1.099 | 0.209 | |
| CPT1B | 0.915 | 0.787–1.064 | 0.247 | 1.032 | 0.856–1.245 | 0.739 | |
| CPT1C | 1.218 | 1.094–1.358 | <0.001 | 1.267 | 1.112–1.444 | <0.001 | |
*, adjusting age, sex, stage, histology and grade. TCGA, The Cancer Genome Atlas; DFS, disease free survival; OS, overall survival.
Figure 1.
Survival analysis of CPT1C in TCGA GC patients. (A) Survival analysis and distribution of CPT1 in gastric patients form TCGA cohort. Patients were sorted according to the mRNA expression levels of CPT1C. (B,C) The Kaplan Meier survival curve demonstrated that there were significantly longer OS (P<0.001) and DFS (P<0.001) for patients with low CPT1C expression than those with high CPT1C expression. TCGA, The Cancer Genome Atlas; GC, gastric cancer; DFS, disease free survival; OS, overall survival.
Validation of the prognostic value of CPT1C in GEO micro-array database
Three hundred GC patients with micro-array data were identified from GSE62254 dataset in GEO database. The baseline clinicopathological features of these patients were showed in Table 4. All the patients in this dataset have complete follow-up information.
Table 4. Basic clinical features of patients from GSE62254 dataset.
| Features | N | % |
|---|---|---|
| Age | ||
| <60 | 106 | 35.3 |
| ≥60 | 194 | 64.7 |
| Sex | ||
| Female | 101 | 33.7 |
| Male | 199 | 66.3 |
| Stage | ||
| I | 30 | 10.0 |
| II | 97 | 32.3 |
| III | 96 | 32.0 |
| IV | 77 | 25.7 |
| Lauren type | ||
| Intestinal | 146 | 48.7 |
| Diffuse | 135 | 45.0 |
| Mixed | 19 | 6.3 |
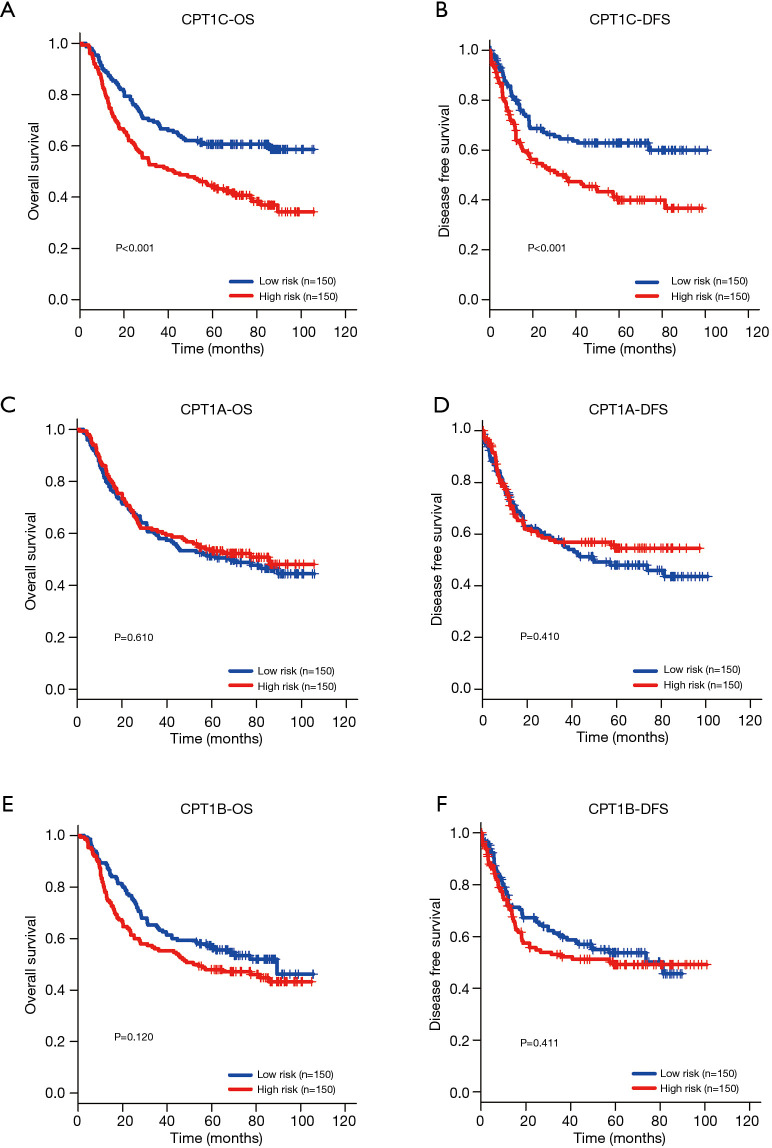
Consistent with results in TCGA cohort, Cox regression analysis showed that CPT1C was the only prognostic gene for OS and DFS among the three isoforms (Tables 5,6). Based on the median value of CPT1C expression, patients were divided into two groups with significantly different death and recurrence risk and high expression of CPT1C was statistically associated with poor OS (Figure 2A) and DFS (Figure 2B). Instead, same as the results in TCGA cohort, no significant difference was observed between survival curves of patients with high or low expression of CPT1A (Figure 2C,D) and CPT1B (Figure 2E,F).
Table 5. Univariate analysis of OS and DFS in GSE62254 dataset.
| Factor | OS | DFS | |||||
|---|---|---|---|---|---|---|---|
| HR | 95% CI | P | HR | 95% CI | P | ||
| Age | 0.217 | 0.620 | |||||
| <60 | 1 | 1 | |||||
| ≥60 | 1.239 | 0.882–1.741 | 1.096 | 0.763–1.575 | |||
| Sex | 0.559 | 0.824 | |||||
| Female | 1 | 1 | |||||
| Male | 0.905 | 0.547–1.265 | 0.959 | 0.663–1.388 | |||
| Stage | <0.001 | <0.001 | |||||
| I | 1 | 1 | |||||
| II | 1.931 | 0.750–4.974 | 2.222 | 0.665–7.430 | |||
| III | 4.004 | 1.599–10.01 | 5.522 | 1.715–17.78 | |||
| IV | 9.725 | 3.902–24.24 | 13.639 | 4.252–43.74 | |||
| Lauren | 0.003 | 0.034 | |||||
| Intestinal | 1 | 1 | |||||
| Diffuse | 1.677 | 1.198–2.346 | 1.558 | 1.078–2.253 | |||
| Mixed | 2.128 | 1.167–3.878 | 1.899 | 0.932–3.872 | |||
| CPT1A | 0.493 | 0.366–1.622 | 0.493 | 0.874 | 0.376–2.034 | 0.755 | |
| CPT1B | 1.474 | 0.576–3.769 | 0.418 | 0.928 | 0.326–2.637 | 0.888 | |
| CPT1C | 4.508 | 1.424–14.26 | 0.010 | 4.408 | 1.261–15.41 | 0.020 | |
DFS, disease free survival; OS, overall survival.
Table 6. Multivariate analysis of OS and DFS in GSE62254 dataset.
| Factor | OS | DFS | |||||
|---|---|---|---|---|---|---|---|
| HR | 95% CI | P* | HR | 95% CI | P* | ||
| CPT1A | 0.493 | 0.366–1.622 | 0.493 | 1.159 | 0.419–3.207 | 0.777 | |
| CPT1B | 1.474 | 0.576–3.769 | 0.418 | 1.195 | 0.551–2.590 | 0.652 | |
| CPT1C | 4.508 | 1.424–14.26 | 0.010 | 6.476 | 1.553–27.00 | 0.010 | |
*, adjusting age, sex, stage and Lauren type. DFS, disease free survival; OS, overall survival.
Figure 2.
Prognostic value of CPT1A, CPT1B and CPT1C in GC patients from GSE62254 dataset. (A,B) The Kaplan Meier survival curve demonstrated that there were significantly longer OS (P<0.001) and DFS (P<0.001) for patients with low CPT1C expression than those with high CPT1C expression. (C,D) Kaplan Meier survival analysis showed that relationship between CPT1A expression and OS and DFS of GC patients (P>0.05). (E,F) Survival curves of CPT1B in predicting OS and DFS for GC patients (P>0.05). GC, gastric cancer; DFS, disease free survival; OS, overall survival.
FAO mediated by CPT1C is important for GC cells growth
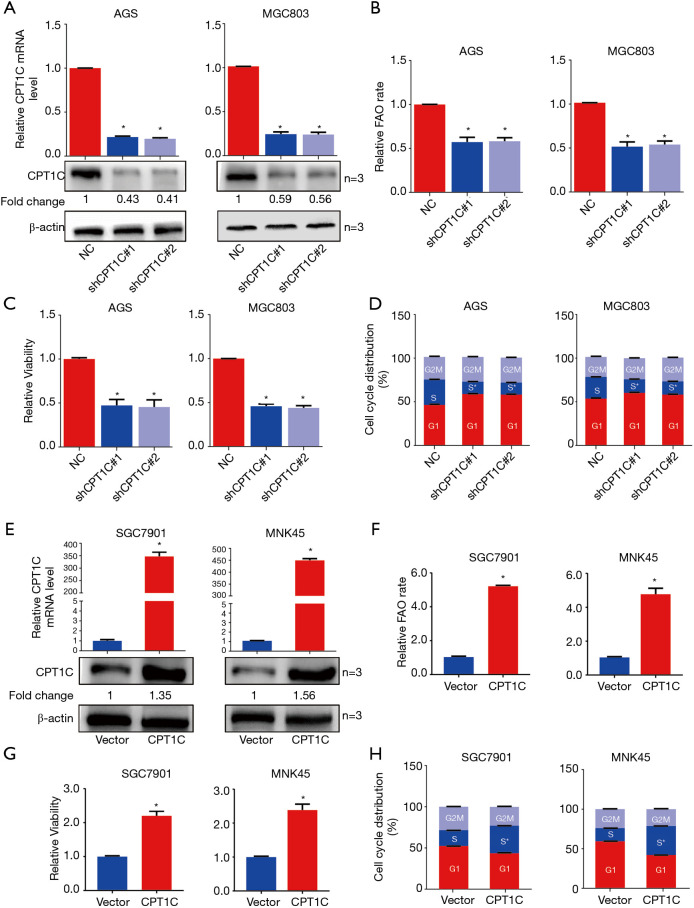
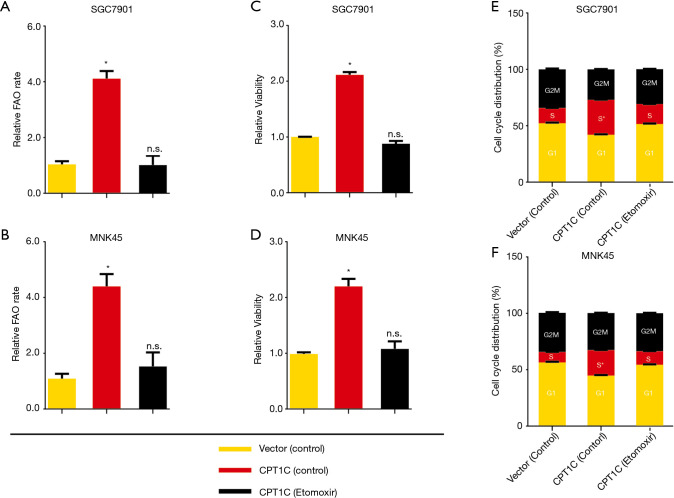
To determine whether CPT1C-mediated FAO is requisite for the rapid growth of GC cells in vitro, we silenced CPT1C by using small short hairpin RNA technology in two cell lines, AGS and MGC803 (Figure 3A). CPT1C knockdown significantly suppressed FAO (Figure 3B), inhibited cell proliferation (Figure 3C) and induced cell cycle arrest (Figure 3D). We further enforced CPT1C expression in SGC7901 and MNK45 cells to verify whether accelerated FAO mediated by CPT1C will promote cell growth (Figure 3E). Compared with the control cells, GC cells with ectopic CPT1C expression exhibited increased rates of FAO (Figure 3F) and expedited cell proliferation (Figure 3G) and accumulated cells in S phase of cell cycle (Figure 3H). To further confirm the effect of FAO mediated by CPT1C in GC cells, we used FAO inhibitor Etomoxir to treat cells with ectopic CPT1C expression. It showed that Etomoxir treatment completely restricted the increase of FAO rate (Figure 4A,B), cell viability (Figure 4C,D) and the phase of DNA synthesis (Figure 4E,F) caused by enhanced CPT1C expression.
Figure 3.
CPT1C mediated FAO is requisite for GC cell growth. (A) qRT-PCR and Western blot showing short hairpin RNA-mediated deletion of CPT1C. (B,C) Silence of CPT1C significantly inhibited cell rate of FAO and cell viability. (D) CPT1C silence induced cell cycle arrest. (E) qRT-PCR and Western blot showing enforced expression of CPT1C in GC cells. (F,G) Over-expression of CPT1C significantly enhanced cell rate of FAO and cell viability. (H) CPT1C increased the phase of S stage of GC cells. *, P<0.05. FAO, fatty acid oxidation; GC, gastric cancer.
Figure 4.
FAO inhibition prohibits GC cell growth. (A,B) Etomoxir treatment strikingly inhibited FAO in GC cells with ectopic CPT1C expression. (C,D) Etomoxir treatment strikingly inhibited cell viability in GC cells with ectopic CPT1C expression. (E,F) Etomoxir treatment strikingly induced cell cycle arrest in GC cells with ectopic CPT1C expression. *, P<0.05. FAO, fatty acid oxidation; GC, gastric cancer.
HIF1α activated CPT1C expression in GC cells
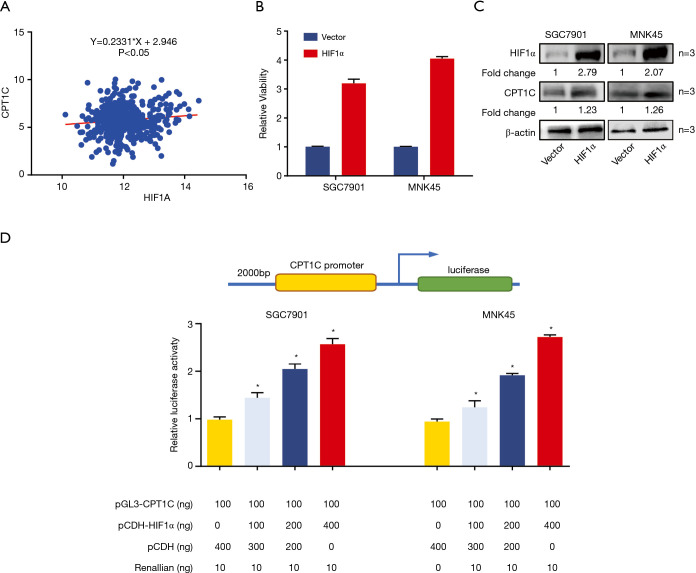
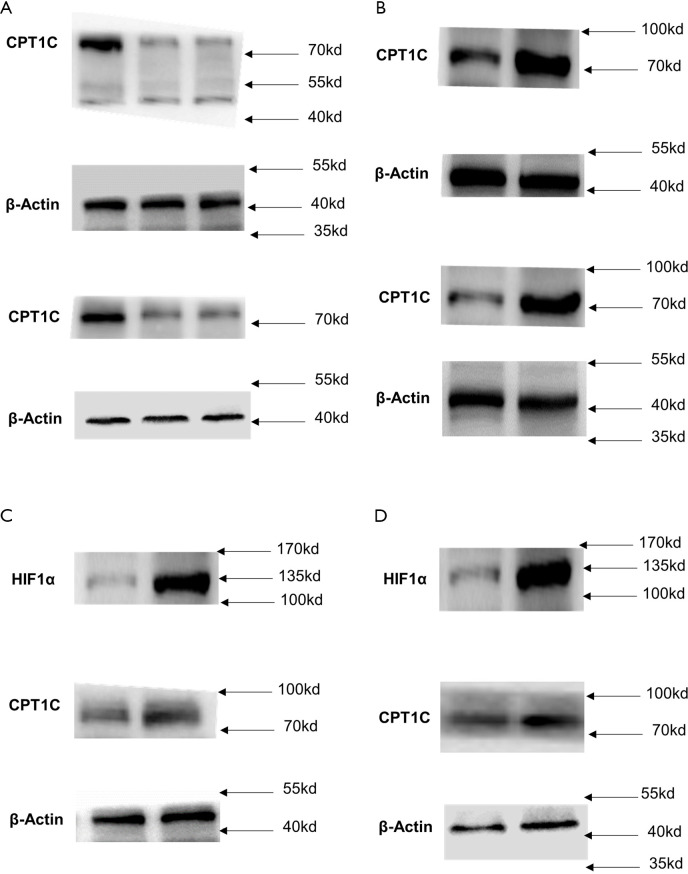
The hypoxia-inducible factor family of transcription factors plays a key role in regulating metabolic gene expression and HIF1α was the most extensively studied factor. Therefore, we hypothesized that HIF1α may transcriptionally regulate CPT1C in GC. To verify this hypothesis, we firstly analyzed the association of gene expression between CPT1C and the HIF1A (encoding HIF1α) and found that HIF1A expression was significantly positively associated with CPT1C (Figure 5A). We then enforced HIF1α expression in GC cells and found that CPT1C expression was notably elevated correspondingly (Figure 5B,C). Additionally, luciferase assay showed that enforced HIF1α expression in GC cells augmented CPT1C promoter transcription in a dose-dependent manner (Figure 5D). In this study, all the original uncropped Western blots of each band were showed in Figure S2.
Figure 5.
HIF1α transcriptionally activated CPT1C expression. (A) HIF1A expression was positively correlated with CPT1C expression (P<0.05). (B,C) qRT-PCR and Western blot showing CPT1C was up-regulated in cells with ectopic HIF1α expression. (D) Luciferase assay showing HIF1α transcriptionally activated CPT1C expression. *, P<0.05.
Figure S2.
The original uncropped Western blots of each band. (A,B) Correlated to Figure 3. (C,D) Correlated to Figure 5.
Discussion
The past decades have witnessed a great progress in field of diagnosis and therapy of GC, the prognosis of GC patients was still very poor. Consequently, the underlying molecular feature contributing GC progression and the determination of potential treatment target are needed to improve the survival of GC patients. Recently, great efforts have been made to study the metabolic reprogramming of malignant cells, which has been verified to be associated with tumor progression (4-8). Enhanced process of FAO is one of the important metabolic feature of tumor cells, which links the Kreb’s cycle and produces ATP, NADPH, NADH, and FADH2. As metabolic stress caused by energy source scarcity is common in solid tumors, the energy production of FAO is extremely important for cancer cells. Thus, the role of FAO in promoting tumor progression is increasingly recognized. More and more studies have found that the dysregulation of FAO rate mediated by several critical enzymes will significantly influenced cell proliferation and metastasis (9-13).
CPT1A, CPT1B and CPT1C are three rare-limiting enzymes in FAO. To date, RNA sequencing has been widely used to identify effective target genes and TCGA database is currently the biggest public database. In this present study, we, for the first time investigated the prognostic role of CPT1A, CPT1B and CPT1C in GC based on TCGA and GEO databases and found that only CPT1C is a prognostic biomarker. Instead, CPT1A and CPT1B were not associated with survival. Limited previous studies have studied CPT1C in cancer and no previous studies investigated the prognostic role of CPT1C in GC. To date, though several previous studies have uncovered that CPT1C expression correlates inversely with mammalian target of rapamycin (mTOR) pathway activation, contributes to rapamycin resistance in murine primary tumors, and is frequently up-regulated in human lung tumors, limited studies focused on the prognostic value of CPT1C. A previous study analyzing >9,000 primary or metastatic tumor samples in TCGA dataset established a gene signature containing CPT1C that is strongly associated with epithelial-mesenchymal transition process (16). Thus, the CPT1C may have a prominent role in contributing tumor progression. Further, we silenced and enforced CPT1C expression to detect its oncogenic role in GC cells and verified that CPT1C will affect cell cycle and promote cell proliferation. In addition, hypoxia environment may exert up-regulating effect on CPT1C expression. Previous studies conducted in other cancer cells have found that high expression of CPT1C can strikingly accelerate tumor growth and even enhance cell viability under metabolic stress (17,18). Like previous report, we confirmed that CPT1C expression was positively associated with hypoxia (19) and we firstly verified that HIF1α will transcriptionally upregulate CPT1C expression.
In this present study, though we firstly revealed the prognostic and oncogenic role of CPT1C in GC, the prognostic effect of CPT1C was not validated in another independent cohort and future studies are needed to conducted to confirm the prognostic value of CPT1C in mRNA and protein level. We next focused our study on CPT1C, but we did not deny that CPT1A and CPT1B may also be able to impact cell function. Previous studies have found that these two enzymes can promote cell invasion and proliferation in different solid tumors including GC (8,20-22). We showed in our study that HIF1α can upregulate CPT1C expression in GC cells, however, the mechanism underlying this effect was not explored and whether HIF1α activate CPT1C expression by directly binding to its promoter region is not clear.
In conclusion, this is the first study to report that CPT1C mediated FAO plays an important role in GC. The present study provides new evidence supporting the prognostic and oncogenic role of CPT1C in the progression of GC and highlights that CPT1C may serve as a potential treatment target for GC patients.
Figure S1.
Distribution and survival analysis of CPT1 in TCGA database. (A) Distribution of CPT1A, CPT1B and CPT1C in GC patients. (B,C) Kaplan Meier survival analysis showed that relationship between CPT1A expression and OS and DFS of GC patients (P>0.05). (D,E) Survival curves of CPT1B in predicting OS and DFS for GC patients (P>0.05). TCGA, The Cancer Genome Atlas; GC, gastric cancer; DFS, disease free survival; OS, overall survival.
Acknowledgments
We would like to acknowledge the editors and reviewers for the helpful comments on this paper.
Ethical Statement: The authors are accountable for all aspects of the work in ensuring that questions related to the accuracy or integrity of any part of the work are appropriately investigated and resolved. The study was conducted in accordance with the Declaration of Helsinki (as revised in 2013). The study has been examined and approved by the Ethics Committee of the Pujiang People’s hospital (No. 04073-3-1711A). Informed consent was not available in this study for all the data of patients were derived from public TCGA and GEO databases.
Open Access Statement: This is an Open Access article distributed in accordance with the Creative Commons Attribution-NonCommercial-NoDerivs 4.0 International License (CC BY-NC-ND 4.0), which permits the non-commercial replication and distribution of the article with the strict proviso that no changes or edits are made and the original work is properly cited (including links to both the formal publication through the relevant DOI and the license). See: https://creativecommons.org/licenses/by-nc-nd/4.0/.
Footnotes
Reporting Checklist: The authors have completed the STROBE reporting checklist. Available at http://dx.doi.org/10.21037/jgo-20-157
Peer Review File: Available at http://dx.doi.org/10.21037/jgo-20-157
Conflicts of Interest: All authors have completed the ICMJE uniform disclosure form (available at: http://dx.doi.org/10.21037/jgo-20-157). The authors have no conflicts of interest to declare.
References
- 1.Siegel RL, Miller KD, Jemal A. Cancer Statistics, 2017. CA Cancer J Clin 2017;67:7-30. 10.3322/caac.21387 [DOI] [PubMed] [Google Scholar]
- 2.Galdy S, Cella CA, Spada F, et al. Systemic therapy beyond first-line in advanced gastric cancer: An overview of the main randomized clinical trials. Crit Rev Oncol Hematol 2016;99:1-12. 10.1016/j.critrevonc.2015.09.004 [DOI] [PubMed] [Google Scholar]
- 3.Morabito A, Carillio G, Longo R. Systemic treatment of gastric cancer. Crit Rev Oncol Hematol 2009;70:216-34. 10.1016/j.critrevonc.2008.08.005 [DOI] [PubMed] [Google Scholar]
- 4.Li XX, Wang ZJ, Zheng Y, et al. Nuclear Receptor Nur77 Facilitates Melanoma Cell Survival under Metabolic Stress by Protecting Fatty Acid Oxidation. Mol Cell 2018;69:480-92.e7. 10.1016/j.molcel.2018.01.001 [DOI] [PubMed] [Google Scholar]
- 5.Wang T, Fahrmann JF, Lee H, et al. JAK/STAT3-Regulated Fatty Acid beta-Oxidation Is Critical for Breast Cancer Stem Cell Self-Renewal and Chemoresistance. Cell Metab 2018;27:136-50.e5. 10.1016/j.cmet.2017.11.001 [DOI] [PMC free article] [PubMed] [Google Scholar]
- 6.Furuta E, Pai SK, Zhan R, et al. Fatty acid synthase gene is up-regulated by hypoxia via activation of Akt and sterol regulatory element binding protein-1. Cancer Res 2008;68:1003-11. 10.1158/0008-5472.CAN-07-2489 [DOI] [PubMed] [Google Scholar]
- 7.Carracedo A, Cantley LC, Pandolfi PP. Cancer metabolism: fatty acid oxidation in the limelight. Nat Rev Cancer 2013;13:227-32. 10.1038/nrc3483 [DOI] [PMC free article] [PubMed] [Google Scholar]
- 8.Wang YN, Zeng ZL, Lu J, et al. CPT1A-mediated fatty acid oxidation promotes colorectal cancer cell metastasis by inhibiting anoikis. Oncogene 2018;37:6025-40. 10.1038/s41388-018-0384-z [DOI] [PubMed] [Google Scholar]
- 9.Martinez-Outschoorn UE, Peiris-Pages M, Pestell RG, et al. Cancer metabolism: a therapeutic perspective. Nat Rev Clin Oncol 2017;14:11-31. 10.1038/nrclinonc.2016.60 [DOI] [PubMed] [Google Scholar]
- 10.Qu Q, Zeng F, Liu X, et al. Fatty acid oxidation and carnitine palmitoyltransferase I: emerging therapeutic targets in cancer. Cell Death Dis 2016;7:e2226. 10.1038/cddis.2016.132 [DOI] [PMC free article] [PubMed] [Google Scholar]
- 11.Aiderus A, Black MA, Dunbier AK. Fatty acid oxidation is associated with proliferation and prognosis in breast and other cancers. BMC Cancer 2018;18:805. 10.1186/s12885-018-4626-9 [DOI] [PMC free article] [PubMed] [Google Scholar]
- 12.Ma Y, Temkin SM, Hawkridge AM, et al. Fatty acid oxidation: An emerging facet of metabolic transformation in cancer. Cancer Lett 2018;435:92-100. 10.1016/j.canlet.2018.08.006 [DOI] [PMC free article] [PubMed] [Google Scholar]
- 13.van Weverwijk A, Koundouros N, Iravani M, et al. Metabolic adaptability in metastatic breast cancer by AKR1B10-dependent balancing of glycolysis and fatty acid oxidation. Nat Commun 2019;10:2698. 10.1038/s41467-019-10592-4 [DOI] [PMC free article] [PubMed] [Google Scholar]
- 14.Casals N, Zammit V, Herrero L, et al. Carnitine palmitoyltransferase 1C: From cognition to cancer. Prog Lipid Res 2016;61:134-48. 10.1016/j.plipres.2015.11.004 [DOI] [PubMed] [Google Scholar]
- 15.Irizarry RA, Hobbs B, Collin F, et al. Exploration, normalization, and summaries of high density oligonucleotide array probe level data. Biostatistics 2003;4:249-64. 10.1093/biostatistics/4.2.249 [DOI] [PubMed] [Google Scholar]
- 16.Nath A, Chan C. Genetic alterations in fatty acid transport and metabolism genes are associated with metastatic progression and poor prognosis of human cancers. Sci Rep 2016;6:18669. 10.1038/srep18669 [DOI] [PMC free article] [PubMed] [Google Scholar]
- 17.Wang R, Cheng Y, Su D, et al. Cpt1c regulated by AMPK promotes papillary thyroid carcinomas cells survival under metabolic stress conditions. J Cancer 2017;8:3675-81. 10.7150/jca.21148 [DOI] [PMC free article] [PubMed] [Google Scholar]
- 18.Cirillo A, Di Salle A, Petillo O, et al. High grade glioblastoma is associated with aberrant expression of ZFP57, a protein involved in gene imprinting, and of CPT1A and CPT1C that regulate fatty acid metabolism. Cancer Biol Ther 2014;15:735-41. 10.4161/cbt.28408 [DOI] [PMC free article] [PubMed] [Google Scholar]
- 19.Zaugg K, Yao Y, Reilly PT, et al. Carnitine palmitoyltransferase 1C promotes cell survival and tumor growth under conditions of metabolic stress. Genes Dev 2011;25:1041-51. 10.1101/gad.1987211 [DOI] [PMC free article] [PubMed] [Google Scholar]
- 20.Xiong Y, Liu Z, Zhao X, et al. CPT1A regulates breast cancer-associated lymphangiogenesis via VEGF signaling. Biomed Pharmacother 2018;106:1-7. 10.1016/j.biopha.2018.05.112 [DOI] [PubMed] [Google Scholar]
- 21.Wang C, Zhang C, Li X, et al. CPT1A-mediated succinylation of S100A10 increases human gastric cancer invasion. J Cell Mol Med 2019;23:293-305. 10.1111/jcmm.13920 [DOI] [PMC free article] [PubMed] [Google Scholar]
- 22.Vantaku V, Dong J, Ambati CR, et al. Multi-omics Integration Analysis Robustly Predicts High-Grade Patient Survival and Identifies CPT1B Effect on Fatty Acid Metabolism in Bladder Cancer. Clin Cancer Res 2019;25:3689-701. 10.1158/1078-0432.CCR-18-1515 [DOI] [PMC free article] [PubMed] [Google Scholar]


