

Abstract

Molecular liquids have long been known to undergo various distinct intermolecular motions, from fast librations and cage-rattling oscillations to slow orientational and translational diffusion. However, their resultant gigahertz to terahertz spectra are far from simple, appearing as broad shapeless bands that span many orders of magnitude of frequency, making meaningful interpretation troublesome. Ad hoc spectral line shape fitting has become a notoriously fine art in the field; a unified approach to handling such spectra is long overdue. Here we apply ultrafast optical Kerr-effect (OKE) spectroscopy to study the intermolecular dynamics of room-temperature n-alkanes, cycloalkanes, and six-carbon rings, as well as liquid methane and propane. This work provides stress tests and converges upon an experimentally robust model across simple molecular series and range of temperatures, providing a blueprint for the interpretation of the dynamics of van der Waals liquids. This will enable the interpretation of low-frequency spectra of more complex liquids.
1. Introduction
Intermolecular interactions facilitate energy transfer and are crucial in driving chemical reactions in the condensed phase, making the investigation of the nature of these interactions key to our understanding of chemical reactivity.1,2 Intermolecular dynamics consist of a broad range of interactions on many different time scales, typically anything ∼1 ps or slower (≤1 THz). The corresponding low-frequency spectra are also broad, appearing as “blobs” lacking discernible features. The featureless character of gigahertz to terahertz spectra complicates the assignment of line shape contributions and therefore any subsequent interpretation.
Through instantaneous normal-mode analyses of molecular-dynamics simulations3−6 and comparisons with Stokes–Einstein–Debye theory for diffusion, it is well understood that the highest frequencies are dominated by molecular librations (and possibly low-frequency intramolecular modes, torsions in particular), while the lowest frequency response is due to molecular orientation relaxation. At intermediate frequencies, dynamics are predominantly translational in origin. In the 1970s, Bucaro and Litovitz suggested that motions at these frequencies could be approximated as pairwise collisions causing molecular frame distortions.7,8 Similar to the librational modes, collision-induced contributions at high frequencies are more localized “cage-rattling” motions, becoming progressively more diffusive at lower frequencies. This line shape division is applied in dielectric relaxation spectroscopy (DRS), where orientational and translational diffusions are known as α- and β-relaxation respectively, and cage-rattling is referred to as a “fast-β” process (see Figure 1).9−11
Figure 1.

General form of the low-frequency vibrational spectrum of a weakly interacting liquid. The contributions are generally identified as α-relaxation (orientational relaxation), β-relaxation (translational diffusion), the fast-β process (cage rattling), and librations. The inset shows the same general spectrum on a logarithmic frequency axis, which is advantageous for highlighting the very low frequency (gigahertz and lower) part of the spectrum.
In reality, however, all such dynamics are highly interdependent and this method of spectral compartmentalization produces a highly simplified interpretation. A potential alternative is the application of mode-coupling theory, which has been successfully used to describe depolarized light-scattering spectra of liquids.12−17 However, mode-coupling theory describes the low-frequency spectrum through an abstract Langevin equation with a memory kernel related to the static structure factor, whose physical meaning is more difficult to extract.18−20 Thus, spectral compartmentalization may well give better physical insights. But is it too simplistic? In this work, we test the applicability of this approach by applying it to some of the simplest possible molecular liquids, especially n-alkanes and cycloalkanes, using ultrafast optical Kerr-effect (OKE) spectroscopy21−26 to measure the low-frequency depolarized Raman spectrum. We show that this “simplistic” division in fact provides a realistic and consistent picture over a wide range of molecular sizes and temperatures. This picture can be extrapolated to interpret the dynamics of weakly anisotropic molecular liquids such as cyclohexane and the (notoriously difficult to fit) spectra of liquids such as benzene. We also show, by studying liquid methane, that both the α-relaxation and librations can be “switched-off” through molecular symmetry27,28 to enable the study of the β-processes in isolation, thereby emphasizing the validity of the model.
2. Methods
In this work ultrafast optical Kerr-effect spectroscopy is used, a time-domain technique that measures the derivative of the time-correlation function of the anisotropic part of the polarizability tensor,25,29
| 1 |
A frequency-domain spectrum is obtained through a numerical Fourier transform deconvolution and is equivalent to the Bose–Einstein corrected depolarized Raman spectrum.30−32 Our OKE setup employs a standard time-domain step-scan pump–probe geometry as described in detail elsewhere.23 Briefly, a laser oscillator (Coherent Micra) produced ∼10 nJ pulses at a repetition rate of 82 MHz and with 800 nm nominal wavelength providing 20 fs temporal pulse width in the sample, broadening to 25 fs when using a cryostat.
Liquids were purchased from Sigma-Aldrich and have a rated purity ≥ 98% with the exceptions of hexane, cyclopentene, and 1,4-cyclohexadiene, which have a purity ≥ 95%, and were used without further purification. Liquid samples were filtered with a PTFE filter (Millex) with 20 μm pore size and degassed for 1 min in an ultrasound bath before measurements. Room-temperature samples were contained in a 1 mm thick rectangular quartz cuvette (Starna) and held in a temperature-controlled (±0.5 K) aluminum block. Low-temperature measurements were performed using a liquid-N2 cryostat (Oxford Instruments, ±0.1 K) in a nitrogen environment to avoid water condensation. Gaseous species were condensed into a similar cuvette within the cryostat attached to a sample-purged bladder valve.
In order to fit the OKE spectra, a number of analytical functions have been used. The simplest case of orientational relaxation gives rise to an exponential decay of the OKE signal in the time domain that upon Fourier transformation produces the well-known Debye function
| 2 |
where ω is the angular frequency, τ is the relaxation time, and A is an amplitude.
In some cases, it is also useful to consider the Cole–Cole function, the frequency-domain expression of a stretched exponential decay,
| 3 |
where β is a stretching parameter. This function is often used to fit translational diffusive dynamics. The Cole–Cole function reverts to the Debye function when β = 1.
However, the diffusive processes cannot start instantaneously in the time domain but instead must have a delayed onset due to the molecular moment of inertia.33−36 Such time scales are governed by the oscillation frequency of the fast-β or librational modes as discussed by us previously. As shown previously, we have modeled this effect with an inertial rise.37,38 The inertial rise time for orientation relaxation has been linked to librational time scales, and by analogy β-relaxation should be limited by the fast-β mode time scales. In the frequency domain, this ensures the high-frequency slope of these functions drop off at the librational or fast-β frequency. The inertial Cole–Cole (or, if β = 1, inertial Debye) function has the form37,38
| 4 |
where ΩI is the high-frequency limit due to inertial rise times set as the librational or fast-β mode frequency. For consistency, this inertial function was applied to all diffusive modes, even when the modification produced a negligible effect, as is the case for the broader spectra in, e.g., intermediate- to long-chain n-alkanes.
The high-frequency oscillations can be well-modeled using the Brownian oscillator function,29,39
| 5 |
or the antisymmetrized Gaussian (ASG) function,40,41
| 6 |
where ωo and ωG are the undamped oscillator frequencies, γ is
the damping rate, and σG is related
to the full width at half-maximum (fwhm) of the Gaussian line shape
by  . It was found that the
fast-β mode
was following a Brownian oscillator throughout, whereas librations
fit a Brownian for n-alkanes except propane and an
antisymmetrized Gaussian otherwise.
. It was found that the
fast-β mode
was following a Brownian oscillator throughout, whereas librations
fit a Brownian for n-alkanes except propane and an
antisymmetrized Gaussian otherwise.
Lastly, the Bucaro–Litovitz (BL) function was derived to account for collision-induced anisotropy in terms of the molecular frame distortions during pairwise collisions7 and has become a ubiquitous line shape function in Raman scattering analyses. The Bucaro–Litovitz function is given by
| 7 |
where ωBL is a characteristic frequency and δ is a parameter that accounts for the relationship between the change in molecular polarizability with interparticle distance for the particular system; for δ = 1 the relation becomes the Ohmic function. This is typically paired with an antisymmetrized Gaussian function to differentiate translational and rotational line shape contributions.24,42−45
3. Results and Discussion
3.1. Calculation of Molecular Polarizabilities
In order to interpret the data presented below, insight is required into the molecular polarizabilities of the alkanes and alkenes under study. OKE spectroscopy measures the depolarized Raman spectrum using a time-domain method and as such is directly proportional to the anisotropic part of the molecular polarizability tensor.25 Molecular polarizabilities were calculated using Gaussian09 with the 6-311++G(2df,p) level of theory. The polarizability tensor, α̂, is given as
 |
8 |
while the isotropic and anisotropic polarizabilities, α(α̂^) and β(α̂^), respectively, can be calculated using46
| 9 |
| 10 |
The calculated polarizability tensor elements are given in Table 1. In the hydrocarbons considered here, the major contribution to polarizability comes from the carbon–carbon bonding electrons, which are more polarizable along the bond than perpendicular to it. Of course, π-bond electrons are more polarizable than σ-bond electrons perpendicular to the bond. The principal axes used here are shown in Figure 2.
Table 1. Calculated Polarizability Tensor Elements of n-Alkanes, Cycloalkanes, And Various Six-Membered Ring Molecules.
| n | αXX /Å3 | αYY /Å3 | αZZ /Å3 | α(α̂)/Å3 | β(α̂) /Å3 |
|---|---|---|---|---|---|
| linear alkanes | |||||
| 1 | 2.40 | 2.40 | 2.40 | 2.40 | 0.00 |
| 2 | 4.65 | 4.21 | 4.21 | 4.36 | 0.45 |
| 3 | 6.93 | 6.28 | 5.96 | 6.39 | 0.85 |
| 4 | 9.46 | 8.08 | 7.65 | 8.40 | 1.64 |
| 5 | 11.9 | 9.96 | 9.28 | 10.4 | 2.38 |
| 6 | 14.5 | 11.8 | 10.9 | 12.4 | 3.24 |
| 7 | 17.1 | 13.5 | 12.5 | 14.4 | 4.18 |
| 8 | 19.8 | 15.4 | 14.2 | 16.5 | 5.11 |
| 9 | 22.4 | 17.1 | 15.8 | 18.4 | 6.06 |
| 10 | 24.7 | 18.8 | 17.3 | 20.3 | 6.78 |
| 11 | 27.3 | 20.5 | 18.9 | 22.3 | 7.77 |
| 12 | 30.5 | 22.3 | 20.6 | 24.5 | 9.17 |
| cycloalkanes | |||||
| 3 | 6.04 | 6.04 | 5.30 | 5.79 | 0.74 |
| 4 | 8.00 | 8.00 | 6.91 | 7.64 | 1.09 |
| 5 | 10.0 | 10.0 | 8.73 | 9.58 | 1.27 |
| 6 | 12.0 | 12.0 | 10.6 | 11.5 | 1.40 |
| 7 | 14.3 | 14.0 | 12.2 | 13.5 | 1.97 |
| 8 | 16.4 | 16.0 | 13.8 | 15.4 | 2.43 |
| 9 | 18.4 | 18.2 | 15.5 | 17.4 | 2.81 |
| 10 | 21.0 | 19.7 | 16.9 | 19.2 | 3.63 |
| 11 | 23.1 | 22.2 | 18.6 | 21.3 | 4.12 |
| 12 | 25.0 | 24.7 | 20.2 | 23.3 | 4.66 |
| cC6H10 | 12.7 | 10.6 | 8.91 | 10.7 | 3.29 |
| 1,4-cC6H8 | 14.8 | 10.9 | 8.15 | 11.3 | 5.79 |
| cC6H6 | 13.5 | 13.5 | 7.14 | 11.4 | 6.36 |
Figure 2.

Definition of the molecular principal axes. The x- and y-axes have been chosen to correspond to the n-alkanes’ major and minor axes and the cycloalkanes’ two major axes. The x-axis is aligned with the double bond(s) of the unsaturated rings. The z-axes are the out-of-plane axes for all molecules.
As CH2 units are added to these molecules, we would expect each polarizability tensor element to increase linearly and so too the anisotropic polarizability. This trend is clear in the n-alkanes but only from propane onward, as seen in Figure 3. Ethane differs only because of a change in the calculated principal molecular axes, where the x-axis is defined along the C–C bond instead of in the manner shown in Figure 2. While these n-alkanes can exist as linear chains, cycloalkanes are not perfect rings and buckle under varying degrees of ring strain into various conformations, which may be responsible for the lack of linearity in β(α) vsn (but do seem to follow an approximate quadratic curve).
Figure 3.
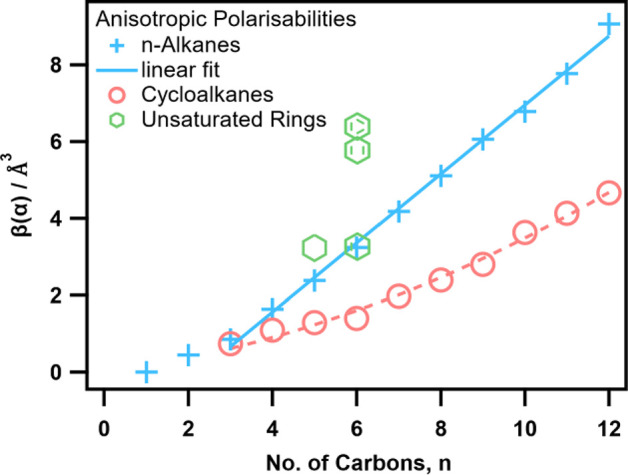
Anisotropic molecular polarizabilities of various hydrocarbons. Alkanes and cycloalkanes as a function of chain length are shown as well as cyclohexene, 1,4-cyclohexadiene, and benzene. The blue line shows the linear dependence of the anisotropic polarizabilities of n-alkanes longer than propane with n, while the red dashed curve is a quadratic line to guide the eye.
3.2. OKE Spectra of Linear Alkanes
First, one of the simplest series of molecular liquids will be considered: linear alkanes. Although some of these liquids have been studied previously,43,47−49 the far superior signal-to-noise ratio in the experiments presented here allow new insights to be gained.
Figure 4 presents the OKE time-domain data collected for various n-alkanes at room temperature. The initial fast decay up to ∼30 fs is due to the instantaneous electronic response which follows the laser pulse intensity profile; all slower dynamics are the nuclear motions of interest. These dynamics will be studied in more depth in the frequency domain throughout. The frequency-domain OKE spectra are shown in Figure 5. Immediately clear from these data are the growing and red-shifting orientation–relaxation band as chain lengths grow. Beyond that, however, these data must be fit to line shapes to attain a deeper understanding of the dynamics at work. Figure 6 shows the OKE spectra of the n-alkanes fit to four functions: an inertial Debye function for α-relaxation, an inertial Debye or inertial Cole–Cole function for β-relaxation, a Brownian function for the fast-β process, and a Brownian function for librations. These spectra become so broad that we must compensate by either introducing more modes or empirically broaden existing modes. The former is potentially justifiable as one could resolve the α- and β-relaxations into separate orthogonal components; however, the latter essentially accomplishes the same outcome while maintaining continuity in the fit functions. Given that the β-relaxation is often typified by a Cole–Cole function in the frequency domain, it is sensible that it should be the preferentially broadened mode.
Figure 4.

Time-domain OKE signal of various n-alkanes at 25 °C from pentane to hexadecane.
Figure 5.

OKE spectra of various n-alkanes at 25 °C from pentane to hexadecane.
Figure 6.

Experimental OKE spectra of liquidn-alkanes at 25 °C and fits. The fits (blue line) of the data (black line) are comprised of the α-relaxation (red), β-relaxation (yellow), fast-β mode (green), and librational mode (blue).
The librational band has approximately constant amplitude, while the α-relaxation amplitude increases with chain length. This is perhaps surprising given that both are caused by (essentially) single molecule reorientational motions and should therefore scale with the molecular anisotropic polarizability squared.
The fit parameters as a function of alkane chain length are listed in Supporting Information Table S2 and shown in Figure 7. Viscosities for all hydrocarbons in this work were obtained from literature and fit for varying carbon number, n, or temperature in the case of propane (see the Supporting Information). It is important to note that the amplitude of the inertial Debye function used to fit the β-relaxation is reduced to different extents dependent on the degree of overlap of the two β-modes. Because of this interdependence, the amplitude of the inertial Debye (or Cole–Cole) is not useful or representative of the actual strength of the mode. For this reason, we will make no consideration of the β-relaxation amplitude throughout.
Figure 7.

Fit parameters of alkane spectra. Shown are the fitting parameter values of the α-relaxation (red ●), β-relaxation (yellow ■), fast-β (green □), and libration (blue ○) line shapes as a function of n-alkane chain length, n. The parameters displayed are the amplitudes (top), diffusive lifetimes (middle), and vibrational frequencies (bottom). See also Table S2.
3.3. Linear Alkanes: Discussion
In this work the α-relaxation amplitude is expected to scale with M·β(α̂^)2, where M is the molarity of the liquid, which corrects for the changing number of molecules within the laser focus. Given that M varies as n–0.79 (see the Supporting Information) and (as shown in Figure 3) β(α̂^) scales linearly with n, the amplitude of the α-relaxation is proportional to n1.21. This relationship is used to fit the data with some success for pentane to decane but ultimately breaks down for longer chains. This comes as little surprise as chain-bending (gauche conformers) becomes more significant. Average end-to-end distances of the n-alkanes deviate from the straight chain by 5% for pentane up to 13% for dodecane,50 ultimately leading to a preferred hairpin conformation in hexadecane.51 Of course this bending effectively lends polarizability from the αXX tensor element to the orthogonal elements, reducing β(α̂^)2.
The orientational–relaxation (α-relaxation) lifetimes abide well those predicted by the Stokes–Einstein–Debye equation for rods after correcting for “slip” conditions (see Supporting Information) but deviate again at n ≥ 12, where the prevalence of gauche conformations becomes significant. More “bent” n-alkanes should have shorter α-relaxation times as they become slightly less rod-like and more spherical.
Since the β-relaxation is translational and diffusive, its lifetime was fit to the Stokes–Einstein equation for rod diffusion (see Supporting Information). Molecular displacements follow a normal distribution which, after some time, t, will have a standard deviation given by
| 11 |
where Dt is the translational diffusion constant. Setting the time as the experimental lifetime, t = τ, we find a best fit value of σ close to a van der Waals radius (1.07 Å).
As shown in the Supporting Information, using simplistic assumptions such as rigid rods occupying a cylindrical cage of constant radius, the libration angle is expected to scale inversely with chain length. This effect counterbalances the increasing anisotropic polarizability, producing a libration amplitude independent of n. This is consistent with the data as shown in Figure 7. Furthermore, these simple assumptions result in a librational frequency that is independent of n, which indeed fits the data across the whole pentane to hexadecane range. It is important to note that the n-alkanes from octane onward exhibit intramolecular normal modes (string vibrations) at frequencies ≤ ωlib, at which point we should not expect more coupled dynamics as opposed to pure librational motions; this band has been shown to persist in longer n-alkanes up to C26H5452 and even polymers.53
The fast-β mode is a collision-induced signal which, in OKE spectroscopy, is related to the interparticle distance, r, through the following relationship (see the Supporting Information):
| 12 |
where SCI is the collision-induced signal, n is the number of carbons in the n-alkane, C is a constant accounting for terminal hydrogen atoms with values of 1 for n-alkanes and 0 for cycloalkanes, and V0 is a repulsive potential constant with typical values ∼ 10–17 J.54 By fitting the fast-β amplitude to this model, we find that V0 = 1 × 10–18 J. Frequencies of the fast-β mode remain constant up to n ∼ 8 as expected from the same simple assumptions made previously (see the Supporting Information). Calculated intramolecular normal modes have frequencies ≤ ωfβ at nonane onward, marking the end of the rigid rod regime.
3.4. Simplification through Symmetry: Methane
Although α-relaxation and librations are strictly speaking delocalized collective motions, their amplitude depends directly on the molecular anisotropic polarizability tensor, which is zero (or very near zero) in molecules with a high degree of symmetry such as tetrahedral and octahedral.27,28,55−58 For this reason, it is useful to consider the OKE spectrum of liquid methane, which will be purely collision-induced due to its tetrahedral symmetry. Traditional fitting procedures of such isotropic liquids dictate that a single Bucaro–Litovitz function should account for the dynamics. Figure 8 shows the best fit of the spectrum using a Bucaro–Litovitz function.
Figure 8.

OKE spectrum of liquid methane at 95 K (black line) fit with the Bucaro–Litovitz function (purple dashed line).
The Bucaro–-Litovitz function was derived almost 50 years ago and is used abundantly to date. Its contribution has been substantial, but in highly simplified spectra such as in this work, the Bucaro–Litovitz function performs no better than a single antisymmetrized Gaussian or Brownian oscillator in fitting the spectra and is clearly inappropriate. If we instead apply the same interpretation as that for the other n-alkanes, liquid methane should have a vastly simplified spectrum that only exhibits β processes that can be well-modeled using two modes as shown in Figure 9 (the fit parameters are listed in Table S3).
Figure 9.

OKE spectrum of liquid methane at 95 K (black line) with the fit (blue line) comprised of two modes: β-relaxation (yellow) and fast-β (green). Also shown are the best fit for Brillouin-zone edge TA and LA phonon modes (dashed lines). See the Supporting Information for fit parameters.
3.5. Methane Discussion
As the name suggests, the strength of a collision-induced signal exhibits an inverse relationship with intermolecular separation; in terms of a crystal, Brillouin-zone edge phonons would produce the greatest collision-induced signal. The Brillouin-zone edge transverse and longitudinal acoustic (TA and LA) phonon frequencies of the plastic phase of solid methane were used to fit the OKE spectrum of liquid methane.59 This is of course unreasonable in the liquid phase and unsurprisingly produces a poor fit, but it nonetheless illustrates the potential origin of the rattling dynamics described by the fast-β mode in the disordered liquid. The data are well-modeled by this fast-β mode represented as a single Brownian oscillator. The low-frequency β-relaxation accounts for more diffusive motions and is thus modeled by the inertial Debye function introduced previously, which suppresses the high-frequency slope to prevent any unphysical encroachment beyond the fast-β oscillation. The β-relaxation lifetime corresponds to a diffusion length of 1.08 Å, similar to that seen in the n-alkanes.
3.6. Temperature Dependence: Propane
It is also important that consistent fits can be obtained as a function of temperature with this procedure. Propane was chosen first because of its broad liquid phase range (85–231 K). Measurements were taken between 210 and 78 K (supercooled), corresponding to a 100-fold increase in viscosity that produces a significant evolution of the spectral line shape. At the same time, propane has an anisotropic polarizability even smaller than cyclohexane and cyclopentane, making it relevant to other more popularly studied weakly anisotropic molecules.
Figure 10 shows the OKE data at five temperatures. At 210 K the spectrum exhibits a monomodal appearance but broadens significantly on cooling. These spectra suggest two distinct types of dynamics: those whose frequencies are either highly dependent or (mostly) independent of temperature.
Figure 10.

OKE spectra of liquid propane at various temperatures.
These spectra were fitted, as shown in Figure 11, in the same manner as the longer alkanes with the exceptions of the libration, which fit to an antisymmetrized Gaussian function and the β-relaxation at 78 K, which required an inertial Cole–Cole function. The fit parameters are listed in Table S4. Discrete contributions to the spectrum are impossible to spot in the 210 K data alone, but the individual modes can be tracked from the supercooled liquid. The diffusive modes exhibit the most significant change with temperature, accounting for an increasing proportion of the spectrum at lower temperatures until the β-relaxation becomes an inertial Cole–Cole function to fit the broad, flat line shape below ca. 300 GHz.
Figure 11.

OKE spectra of propane at a range of temperatures and fits. The fits (blue line) of the data (black line) are comprised of the α-relaxation (red), β-relaxation (yellow), fast-β mode (green), and librational mode (blue).
The fit parameters are shown in Figure 12. Propane densities were fit to a linear relationship with temperature (see the Supporting Information), which was in turn used to model the librational and fast-β frequency temperature dependence.
Figure 12.

Fit parameters of propane spectra. Shown are the fitting parameter values of the α-relaxation (red ●), β-relaxation (yellow ■), fast-β (green □), and libration (blue ○) line shapes as a function of temperature, T. The parameters displayed are the amplitudes (top), diffusive lifetimes (middle), and vibrational frequencies (bottom).
3.7. Discussion of T Dependence
The α-relaxation band (Figure 11 and Figure 12) is very weak at high temperatures but consistent with the trend seen in the liquid n-alkanes as seen in Figure 6. However, it becomes gradually more prominent on cooling, an effect seen previously60,61 and proposed to arise from polarizability enhancement due to cooperative molecular ordering but is yet to be fully understood.38 The experimental α-relaxation lifetimes are comparable with Stokes–Einstein–Debye using slip conditions at higher temperatures but deviating by an order of magnitude at 78 K, possibly due to the same molecular ordering. For the β-relaxation the characteristic diffusion length, σ, was set at 1 Å for comparison with the other alkanes, revealing a poor conformity to the Stokes–Einstein relation by up to 2 orders of magnitude at 78 K. Given that the broader lower temperature spectra best expose the diffusive dynamics and thus offer the greatest confidence in diffusive line shape fitting, these deviations from theory are real phenomena that require explanation as opposed to a limitation of the fitting procedure. It is well-known that Stokes–Einstein and Stokes–Einstein–Debye relations excel in predicting the diffusive behaviors of macromolecules in solution, for example, but commonly break down for small molecules62−64 which are said to “hop” through the surrounding solvent, especially at low or supercooled temperatures.64−68 This is the reason that the τ ∝ ηV/T relationship violation in propane is observed, where the macroscopic viscosity is of little relevance to the microscopic motions.69
The librational amplitudes decrease slightly with decreasing temperature, which could be explained by liquid densification producing a reduction in the average angle of libration. Librational frequencies increase on cooling, an effect observed previously in experimental and simulated OKE studies on benzene.70 This is again attributed to the increasing liquid density, where less free space means less free motion of a molecule in a cage, and intermolecular potential landscapes become more quadratic in nature. This also applies to the fast-β mode, where the ω∝ ρ(T) proportionality also holds. The fast-β process increases in amplitude with increasing temperature, which is expected from higher energy collisions. Fitting to eq 12, we find that V0 ∼ 10–16 J, again within an order of magnitude of typical values.
3.8. OKE Spectra of Cycloalkanes
At room temperature, the cycloalkanes may have one or multiple discrete conformations (C8 has 10 known conformations71) that could contribute distinct intermolecular interactions—such an effect may or may not be negligible.
Their dynamics are also more complex than their linear counterparts; for example cyclopentane at room temperature is known to undergo nearly free pseudorotation in the gas and liquid phases via an intramolecular ring-puckering mode;72−74 its intermolecular dynamics are coupled not only to each other but to an intramolecular mode and its overtones. It should be noted that other cycloalkanes also undergo pseudorotation but with some energy barrier; e.g., cycloheptane ΔE = 2.2kBT at 298 K.75
The low-frequency spectra of room-temperature cycloalkanes are shown in Figure 13. Cyclopentane and cyclohexane exhibit a monomodal appearance similar to liquid propane at higher temperatures and typical of near-isotropically polarizable molecules. Upon increasing the ring size, the spectral evolution resembles that of propane upon cooling, where the lowest frequency (diffusive) modes grow in amplitude and red shift, uncovering the high-frequency oscillatory dynamics.
Figure 13.

OKE spectra of various cycloalkanes at 25 °C.
Cycloalkane spectra are trapezoidal in shape (Figure 14). The line shape fitting for the smallest rings is particularly difficult; these spectra could be modeled with relative ease using a higher frequency antisymmetrized Gaussian oscillator (attributed to librational contributions) and a Bucaro–Litovitz function to mop up the remaining dynamics. This procedure ultimately fails when the diffusive and oscillatory components diverge for larger rings whose broader spectra require additional line shape contributions and thus a higher resolution interpretation of the dynamics at play. By extrapolating from the larger rings and using the line shape evolution of the n-alkanes series as a blueprint, we can construct a consistent picture across all the cycloalkanes.
Figure 14.

Fitted OKE spectra of cycloalkanes at 25 °C. The fits (red line) of the data (black line) are comprised of the α-relaxation (red), β-relaxation (yellow), fast-β mode (green), and librational mode (blue).
3.9. Cycloalkanes Discussion
As discussed previously, the amplitude of the α-relaxation band scales with M·β(α̂^)2, and since these polarizabilities were modeled as ∝n–2 (and M ∝ n–0.78), amplitudes were fit to the n3.22 proportionality shown in Figure 15. There is a clear deviation from monotonicity from the cyclooctane α-relaxation amplitude, however, which we suggest is related to the conformational complexity of the molecule. Lifetimes compare well with Stokes–Einstein–Debye theory with the slip friction factor for oblate spheroids.
Figure 15.

Fitting parameters of cycloalkane spectra. Shown are the fitting parameter values of the α-relaxation (red ●), β-relaxation (yellow ■), fast-β (green □), and libration (blue ○) line shapes as a function of the number of carbons, n. The parameters displayed are the amplitudes (top), diffusive lifetimes (middle), and vibrational frequencies (bottom). See also Table S5 for parameter values.
β-relaxation lifetimes fit to a translational diffusion distance just under 1 Å, in keeping with the alkanes’ values. It is interesting to note that the β-relaxation is predicted to have a shorter lifetime than the α-relaxation for cyclopentane. Fits can be made to reflect theory as is the case in this work; however, this is generally avoided in OKE spectroscopy, as the α-relaxation is expected to terminate the material’s response in the time domain. Observation of dynamics slower than the α-relaxation are therefore anomalous. We would argue that the strong overlap and coupling of these diffusive modes make their dynamics largely indistinguishable in such instances, which should allow for some leeway.
Librational and fast-β modes can be modeled in an identical fashion to the n-alkanes, with the former maintaining a constant amplitude throughout while the latter again varies with the strength of intermolecular collisions, with a V0 value of 5 × 10–17 J. The librational and fast-β frequencies conform to the same n dependence seen in short alkanes and drop off at cyclooctane. This cannot be attributed to the occurrence of normal modes since the lowest calculated normal mode of the most populous cyclooctane conformation, boat chair, is 3.7 THz and is visible in Figure 14 as a small shoulder on the librational band. We suggest this is again due to conformational complexity and/or deviations from ideal ring geometry.
For the rigid n-alkanes and small cycloalkanes, the number of CH2 units that participate directly in intermolecular collisions scales with n; i.e., all mass resides on the molecule’s surface. More spherical molecules have atoms which are more shielded from direct bulk interaction, which is likely the effect witnessed in the more “crumpled” hydrocarbons such as boat-chair cyclooctane. Shielded CHn units contribute less or less occasionally (or not at all) to the intermolecular forces that produce librations and fast-β and act purely as an inertial load that will reduce the librational and fast-β frequencies.
3.10. OKE Spectra of Saturated to Unsaturated Rings
Due to their complicated spectra, some of the most commonly studied liquids are benzene34,76,85,77−84 and cyclohexane.35,47,80,85 Just as with the alkanes and cycloalkanes, it is necessary to observe line shape trends across a series in order to make reasonable assignments of the intermolecular dynamics at play. The OKE spectra of cyclohexane, cyclohexene, 1,4-cyclohexadiene, and benzene are shown in Figure 16.
Figure 16.

OKE data of six-membered rings at 25 °C. C6H8 is 1,4-cyclohexadiene.
Previous work has seen cyclohexane modeled using one,35 two,47 and three85 line shapes; benzene has been fit with two,70,81−84 three,79,85 and five81 line shapes. Most recent work has fit the series from cC6H12 to 1,4-cC6H8 to cC6H6 using combinations of BL/BL/ASG to BL/BL/ASG/ASG to BL/ASG/ASG functions, respectively.85 This work shows how a far more consistent picture can be achieved using the four line shape model as shown in Figure 17.
Figure 17.

Fitted OKE spectra of saturated to unsaturated six-membered rings at 25 °C. The fits (green line) of the data (black line) are comprised of the α-relaxation (red), β-relaxation (yellow), fast-β mode (green), and librational mode (blue).
3.11. Unsaturated Rings Discussion
The anisotropic polarizabilities, along with the amplitudes of all modes, increase in a near-linear trend across these rings from 3 to 0 π-electrons as shown in Figure 18. We would expect the α-relaxation to scale with β(α̂)2, and this appears to be the case certainly for the three heaviest rings at least; the α-relaxation amplitude for benzene is slightly less than expected. Similar results were found by Kakinuma et al., who suggest that the time integral of the nuclear part of the entire response function, SOKE(t) scales with β(α̂^) for all rings.85 One might have expected the β modes to depend on the isotropic polarizability, α(α̂^), but as shown in Table 1, isotropic polarizabilities remain approximately constant across the six-membered rings. These observations suggest that all intermolecular dynamics in this series remain strongly coupled; the β-modes retain some orientational dependence.
Figure 18.
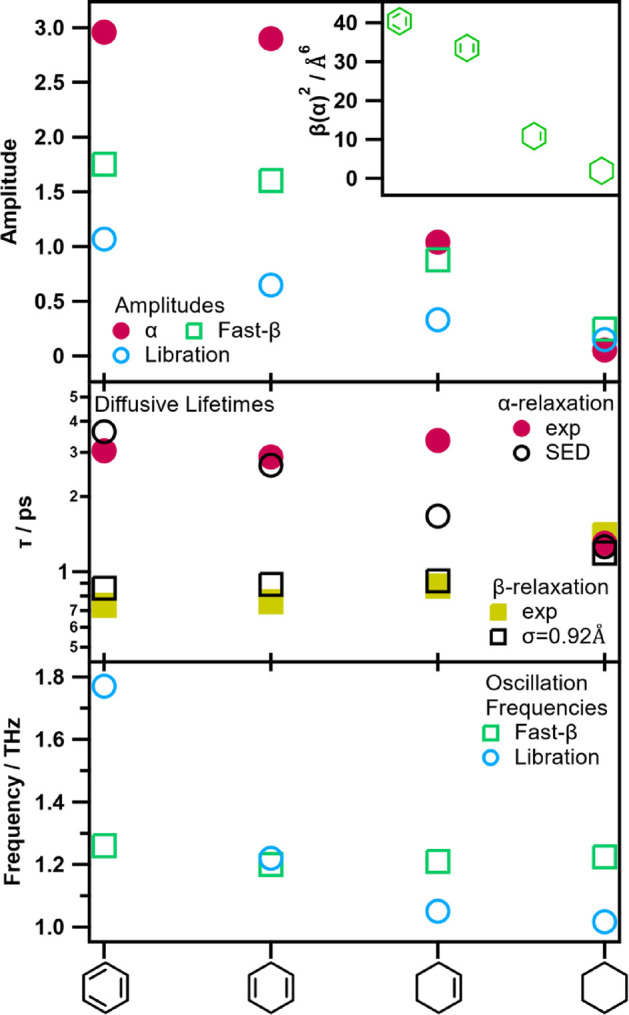
Fitting parameters of the six-membered rings spectra, and the square of the anisotropic polarizabilities (inset). Shown are the fitting parameter values of the α-relaxation (●), β-relaxation (■), fast-β (□), and libration (○) line shapes for each molecule as indicated on the x-axis. The parameters displayed are the amplitudes (top), diffusive lifetimes (middle), and vibrational frequencies (bottom). See also Table S6 for parameter values.
Orientational relaxation lifetimes in benzene match Stokes–Einstein–Debye theory with the oblate spheroid slip condition and other experimental and simulated benzene studies.70,86 Notably the cyclohexene τα is approximately double that predicted by Stokes–Einstein–Debye. Cyclohexane and benzene are roughly oblate spheroids, but interpolating for the intermediate rings may contribute to the experimental deviation from theory given the more irregular geometry of cC6H10. It is also notable that the center of mass is slightly off center in cyclohexene only, so, in principle, rotations would require more free volume and should therefore occur on slower time scales; however, it would be surprising if this effect alone would double τα. In more realistic terms, the presence of π-electrons has a significant effect on the intermolecular potential, evidenced by the ∼20% drop in dynamic viscosity between cC6H12 and cC6H10, which then remains approximately constant for the remaining rings. These two distinct viscosity regimes suggest that we need not expect a smooth trend in orientation relaxation from saturated cyclohexane to benzene; rather we may expect dynamics that are heavily dependent on the presence or absence of π-electrons.
The librational frequency of benzene matches previous work,84 while studies on the remaining rings are lacking or unreliable. For instance, the three- and four-fit model mentioned previously finds that the Gaussian (librational) frequency, ωG, halves from cC6H12 to cC6H10 and then doubles for 1,4-cC6H8, which is unrealistic. On the other hand, the fitting procedure described here arrives at realistic values and trends for the oscillatory frequencies.
4. Discussion and Conclusion
In this work, we set out to demonstrate a logical and useful interpretation of gigahertz to terahertz spectra that produces a disentangled picture of intermolecular dynamics. The α-relaxation ranges from the most obvious feature of the OKE spectra of anisotropic and/or viscous liquids to one of the most obscure in isotropic and/or low-viscosity liquids. In the former cases, these experiments show the orientation relaxation lifetime, τα, abiding Stokes–Einstein–Debye theory with the slip condition. In spectra with the weakest α-relaxation contribution, we have every reason to expect a continuation of the trend, which is effectively extrapolated in this work. Stokes–Einstein–Debye theory does however fail to account for the dynamics in liquid propane at lower temperatures, but this is certainly a real phenomenon and not a result of any inherent limitations of this model.
We find that the β-relaxation is the most difficult to fit due its concealed and relatively weak contribution to the dynamics. We cannot make meaningful conclusions on the basis of its amplitude, which is a limitation of this model. On the other hand, τβ values correspond to standard deviations in position (translational diffusion) of 0.85 Å ≤ σ ≤ 1.08 Å, which are remarkably consistent with the fact that OKE spectroscopy is sensitive only to collisions and translations on the order of a van der Waals radius.
It is worth noting that molecules of exaggerated dimensionality, with, e.g., needle or disc-like geometries may diffuse and vibrate on entirely different time scales for in-plane vs out-of-plane and parallel vs perpendicular motions. This is surely a contributing factor to the broadening of n-alkane spectra as chain lengths increase. An idealized (and intrepid) approach to the line shape fitting of such spectra would include the eventual splitting of single modes into their two spatial components. This is not attempted here for various reasons, not least of which is to avoid both overparametrization and the compounding difficulty of achieving consistent and meaningful fits. Furthermore, we may reasonably expect a signal dominance of one spatial contribution over another. For example, in-plane orientational motions will produce a small signal due to the relatively small difference between the associated polarizability tensor elements when compared with the out-of-plane case. In terms of the collision-induced β-modes, we argue that for these species “broadside” collisions involve a greater number of interparticle interactions across the molecule and should be the dominant β contribution to the OKE spectra. For these reasons, to account for the broad spectra of long-chain n-alkanes and supercooled propane, the β-relaxation mode was gradually broadened from an inertial Debye to an inertial Cole–Cole function. This is the simplest possible approach, introducing just one extra broadening parameter.
Fast-β mode characteristics are governed by the strength and frequency of approximately harmonic intermolecular cage rattling. Intermolecular potential, V0, values obtained through fitting parameter modeling are consistently within an order of magnitude of literature values, which is surprising given the central location of the fast-β mode within these shapeless spectra. The effect of temperature is a proxy for density, which is known to have clear influence on the librational frequencies;70 this work shows that, unsurprisingly, this holds true for the fast-β mode as well.
The antisymmetrized Gaussian function is commonly used to fit librational motions and indicates the presence of inhomogeneous environments. Librational modes in the n-alkanes from pentane to hexadecane, however, fit the Brownian oscillator line shape. This notably excludes propane whose librational mode has an antisymmetrized Gaussian profile. This appears to correlate with aspect ratio, where ratios > 0.55 (more spherical) follow an antisymmetrized Gaussian line shape, while ratios < 0.55 (more needle- or disc-like) have Brownian profiles. This binary outlook is of course simplistic, and indeed previous n-alkane work has modeled the librational mode using a Gaussian–Brownian convolution.62 In any event, we would require far more data on different molecules with a range of aspect ratios to determine if this correlation is real or simply coincidental. What is clear from these data is that conformationally simple molecules, which are rigid on picosecond time scales, librate and rattle in their intermolecular cage according to relatively straightforward mechanics, which gradually break down for progressively larger molecules. Diffusive modes on the other hand seem to closely follow Stokes–Einstein–Debye and Stokes–Einstein theories throughout, with the exception of cyclohexene, which behaves far more like benzene than cyclohexane.
In summary, this work tests the validity of a physical line shape fitting approach to gigahertz to terahertz dynamics for simple weakly interacting molecular liquids. Our study of liquid methane reveals how collision-induced (β) signals do not follow the Bucaro–Litovitz line shape, derived to account for precisely such dynamics. Instead these dynamics must be split into vibrational and diffusive parts, directly analogous to librations and orientation relaxation. We therefore expect to be able to reasonably compartmentalize the gigahertz to terahertz spectra of weakly interacting liquids into four simple dynamical categories: orientational α-relaxation, translational β-relaxation, fast-β oscillations, and librations. Here we have shown the model’s applicability across the room-temperature n-alkanes and cycloalkanes, across a 130 K temperature ramp of propane into the supercooled regime, and across the six-membered rings from cyclohexane to benzene. These spectra can indeed be meaningfully partitioned across dimensions of oscillatory/diffusive and rotational/translational dynamics in a single coherent picture for the first time. Though not without limitation, this interpretation provides a foundation on which our understanding of intermolecular dynamics can be built.
Acknowledgments
We thank the Engineering and Physical Sciences Research Council (EPSRC) for support through Grants EP/K034995/1, EP/N508792/1, and EP/N007417/1. This work was partially funded by Leverhulme Trust Research Project Grant RPG-2018-350 and received funding from the European Research Council (ERC) under the European Union’s Horizon 2020 research and innovation program (Grant Agreement No. 832703). We also thank Dr. Hans Senn for his computational chemistry expertise and advice.
Supporting Information Available
The Supporting Information is available free of charge at https://pubs.acs.org/doi/10.1021/acs.jpcb.0c03769.
Uncertainties in the OKE spectra; amplitude of the OKE signal; fit parameters (PDF)
The authors declare no competing financial interest.
Notes
The data that support the findings of this study are available in Enlighten: Research Data Repository (University of Glasgow) with the identifier http://dx.doi.org/10.5525/gla.researchdata.1045.
Graphics labels were misrendered in the version published on August 21, 2020 and were correctly restored on August 22, 2020.
Supplementary Material
References
- Voth G. A.; Hochstrasser R. M. Transition State Dynamics and Relaxation Processes in Solutions: A Frontier of Physical Chemistry. J. Phys. Chem. 1996, 100, 13034–13049. 10.1021/jp960317e. [DOI] [Google Scholar]
- Weinstein J. A.; Hunt N. T. Ultrafast Chemical Physics: In Search of Molecular Movies. Nat. Chem. 2012, 4, 157–158. 10.1038/nchem.1282. [DOI] [PubMed] [Google Scholar]
- Ryu S.; Stratt R. M. A Case Study in the Molecular Interpretation of Optical Kerr Effect Spectra: Instantaneous-Normal-Mode Analysis of the OKE Spectrum of Liquid Benzene. J. Phys. Chem. B 2004, 108, 6782–6795. 10.1021/jp0375665. [DOI] [Google Scholar]
- Stratt R. M. The Instantaneous Normal Modes of Liquids. Acc. Chem. Res. 1995, 28, 201–207. 10.1021/ar00053a001. [DOI] [Google Scholar]
- Cho M.; Fleming G. R.; Saito S.; Ohmine I.; Stratt R. M. Instantaneous Normal Mode Analysis of Liquid Water. J. Chem. Phys. 1994, 100, 6672–6683. 10.1063/1.467027. [DOI] [Google Scholar]
- Keyes T. Instantaneous Normal Mode Approach to Liquid State Dynamics. J. Phys. Chem. A 1997, 101, 2921–2930. 10.1021/jp963706h. [DOI] [Google Scholar]
- Bucaro J. A.; Litovitz T. A. Rayleigh Scattering: Collisional Motions in Liquids. J. Chem. Phys. 1971, 54, 3846–3853. 10.1063/1.1675436. [DOI] [Google Scholar]
- Volterra B. V.; Bucaro J. A.; Litovitz T. A. Molecular Motion and Light Scattering in Liquids. Ber. Bunsenges. Phys. Chem. 1971, 75, 309–315. [Google Scholar]
- Kudlik A.; Benkhof S.; Blochowicz T.; Tschirwitz C.; Rössler E. The Dielectric Response of Simple Organic Glass Formers. J. Mol. Struct. 1999, 479, 201–218. 10.1016/S0022-2860(98)00871-0. [DOI] [Google Scholar]
- Lunkenheimer P.; Schneider U.; Brand R.; Loid A. Glassy Dynamics. Contemp. Phys. 2000, 41, 15–36. 10.1080/001075100181259. [DOI] [Google Scholar]
- Geirhos K.; Lunkenheimer P.; Loidl A. Johari-Goldstein Relaxation Far Below Tg: Experimental Evidence for the Gardner Transition in Structural Glasses?. Phys. Rev. Lett. 2018, 120, 085705. 10.1103/PhysRevLett.120.085705. [DOI] [PubMed] [Google Scholar]
- Sokolowsky K. P.; Bailey H. E.; Hoffman D. J.; Andersen H. C.; Fayer M. D. Critical Slowing of Density Fluctuations Approaching the Isotropic-Nematic Transition in Liquid Crystals: 2D IR Measurements and Mode Coupling Theory. J. Phys. Chem. B 2016, 120, 7003–7015. 10.1021/acs.jpcb.6b04997. [DOI] [PubMed] [Google Scholar]
- Schmidtke B.; Rössler E. A. Depolarized Light Scattering Spectra of Molecular Liquids: Described in Terms of Mode Coupling Theory. J. Chem. Phys. 2014, 141, 044511. 10.1063/1.4890731. [DOI] [PubMed] [Google Scholar]
- Schmidtke B.; Petzold N.; Kahlau R.; Rössler E. A. Reorientational Dynamics in Molecular Liquids as Revealed by Dynamic Light Scattering: From Boiling Point to Glass Transition Temperature. J. Chem. Phys. 2013, 139, 084504. 10.1063/1.4817406. [DOI] [PubMed] [Google Scholar]
- Nicolau B. G.; Sturlaugson A.; Fruchey K.; Ribeiro M. C. C.; Fayer M. D. Room Temperature Ionic Liquid-Lithium Salt Mixtures: Optical Kerr Effect Dynamical Measurements. J. Phys. Chem. B 2010, 114, 8350–8356. 10.1021/jp103810r. [DOI] [PubMed] [Google Scholar]
- Li J.; Wang I.; Fruchey K.; Fayer M. D. Dynamics in Supercooled Ionic Organic Liquids and Mode Coupling Theory Analysis. J. Phys. Chem. A 2006, 110, 10384–10391. 10.1021/jp0637476. [DOI] [PubMed] [Google Scholar]
- Götze W.; Sperl M. Nearly Logarithmic Decay of Correlations in Glass-Forming Liquids. Phys. Rev. Lett. 2004, 92, 105701. 10.1103/PhysRevLett.92.105701. [DOI] [PubMed] [Google Scholar]
- Janssen L. M. C. Mode-Coupling Theory of the Glass Transition: A Primer. Front. Phys. 2018, 6, 97. 10.3389/fphy.2018.00097. [DOI] [Google Scholar]
- Lunkenheimer P.; Pardo L. C.; Köhler M.; Loidl A. Broadband Dielectric Spectroscopy on Benzophenone: α Relaxation, β Relaxation, and Mode Coupling Theory. Phys. Rev. E 2008, 77, 031506. 10.1103/PhysRevE.77.031506. [DOI] [PubMed] [Google Scholar]
- Pardo L. C.; Lunkenheimer P.; Loidl A. Dielectric Spectroscopy in Benzophenone: The β Relaxation and Its Relation to the Mode-Coupling Cole-Cole Peak. Phys. Rev. E 2007, 76, 030502. 10.1103/PhysRevE.76.030502. [DOI] [PubMed] [Google Scholar]
- González-Jiménez M.; Ramakrishnan G.; Harwood T.; Lapthorn A. J.; Kelly S. M.; Ellis E.; Wynne K. Observation of Coherent Delocalised Phonon-like Modes in DNA under Physiological Conditions. Nat. Commun. 2016, 7, 11799. 10.1038/ncomms11799. [DOI] [PMC free article] [PubMed] [Google Scholar]
- Ramakrishnan G.; González-Jiménez M.; Lapthorn A. J.; Wynne K. The Spectrum of Slow and Super-Slow (Picosecond to Nanosecond) Water Dynamics around Organic and Biological Solutes. J. Phys. Chem. Lett. 2017, 8, 2964–2970. 10.1021/acs.jpclett.7b01127. [DOI] [PubMed] [Google Scholar]
- Turton D. A.; Senn H. M.; Harwood T.; Lapthorn A. J.; Ellis E. M.; Wynne K. Terahertz Underdamped Vibrational Motion Governs Protein-Ligand Binding in Solution. Nat. Commun. 2014, 5, 3999. 10.1038/ncomms4999. [DOI] [PubMed] [Google Scholar]
- Smith N. A.; Meech S. R. Optically-Heterodyne-Detected Optical Kerr Effect (OHD-OKE): Applications in Condensed Phase Dynamics. Int. Rev. Phys. Chem. 2002, 21, 75–100. 10.1080/01442350110092701. [DOI] [Google Scholar]
- Fecko C. J.; Eaves J. D.; Tokmakoff A. Isotropic and Anisotropic Raman Scattering from Molecular Liquids Measured by Spatially Masked Optical Kerr Effect Spectroscopy. J. Chem. Phys. 2002, 117, 1139–1154. 10.1063/1.1485070. [DOI] [Google Scholar]
- Zhong Q.; Fourkas J. T. Optical Kerr Effect Spectroscopy of Simple Liquids. J. Phys. Chem. B 2008, 112, 15529–15539. 10.1021/jp807730u. [DOI] [PubMed] [Google Scholar]
- Reichenbach J.; Ruddell S. A.; González-Jiménez M.; Lemes J.; Turton D. A.; France D. J.; Wynne K. Phonon-like Hydrogen-Bond Modes in Protic Ionic Liquids. J. Am. Chem. Soc. 2017, 139, 7160–7163. 10.1021/jacs.7b03036. [DOI] [PubMed] [Google Scholar]
- Turton D. A.; Corsaro C.; Martin D. F.; Mallamace F.; Wynne K. The Dynamic Crossover in Water Does Not Require Bulk Water. Phys. Chem. Chem. Phys. 2012, 14, 8067. 10.1039/c2cp40703e. [DOI] [PubMed] [Google Scholar]
- Cho M.; Du M.; Scherer N. F.; Fleming G. R.; Mukamel S. Off-Resonant Transient Birefringence in Liquids. J. Chem. Phys. 1993, 99, 2410–2428. 10.1063/1.465256. [DOI] [Google Scholar]
- McMorrow D. Separation of Nuclear and Electronic Contributions to Femtosecond Four-Wave Mixing Data. Opt. Commun. 1991, 86, 236–244. 10.1016/0030-4018(91)90565-U. [DOI] [Google Scholar]
- McMorrow D.; Lotshaw W. T. The Frequency Response of Condensed-Phase Media to Femtosecond Optical Pulses: Spectral-Filter Effects. Chem. Phys. Lett. 1990, 174, 85–94. 10.1016/0009-2614(90)85331-6. [DOI] [Google Scholar]
- Chang Y. J.; Castner E. W. Fast Responses from “Slowly Relaxing” Liquids: A Comparative Study of the Femtosecond Dynamics of Triacetin, Ethylene Glycol, and Water. J. Chem. Phys. 1993, 99, 7289–7299. 10.1063/1.465710. [DOI] [Google Scholar]
- McMorrow D.; Lotshaw W. T. Intermolecular Dynamics in Acetonitrile Probed with Femtosecond Fourier-Transform Raman Spectroscopy. J. Phys. Chem. 1991, 95, 10395–10406. 10.1021/j100178a029. [DOI] [Google Scholar]
- McMorrow D.; Lotshaw W. T. Evidence for Low-Frequency (≍ 15 cm–1) Collective Modes in Benzene and Pyridine Liquids. Chem. Phys. Lett. 1993, 201, 369–376. 10.1016/0009-2614(93)85085-3. [DOI] [Google Scholar]
- Chang Y. J.; Castner E. W. Jr. Intermolecular Dynamics of Substituted Benzene and Cyclohexane Liquids, Studied by Femtosecond Non-Linear Optical Polarization Spectroscopy. J. Phys. Chem. 1996, 100, 3330. 10.1021/jp952073o. [DOI] [Google Scholar]
- Manfred K.; He X.; Fourkas J. T. Assessing the Role of Moment of Inertia in Optical Kerr Effect Spectroscopy. J. Phys. Chem. B 2010, 114, 12096–12103. 10.1021/jp106249t. [DOI] [PubMed] [Google Scholar]
- Turton D. A.; Wynne K. Structural Relaxation in the Hydrogen-Bonding Liquids N-Methylacetamide and Water Studied by Optical Kerr Effect Spectroscopy. J. Chem. Phys. 2008, 128, 154516. 10.1063/1.2897432. [DOI] [PubMed] [Google Scholar]
- Turton D. A.; Martin D. F.; Wynne K. Optical Kerr-Effect Study of Trans- and Cis-1,2-Dichloroethene: Liquid-Liquid Transition or Super-Arrhenius Relaxation. Phys. Chem. Chem. Phys. 2010, 12, 4191–4200. 10.1039/b918196b. [DOI] [PubMed] [Google Scholar]
- Giraud G.; Karolin J.; Wynne K. Low-Frequency Modes of Peptides and Globular Proteins in Solution Observed by Ultrafast OHD-RIKES Spectroscopy. Biophys. J. 2003, 85, 1903–1913. 10.1016/S0006-3495(03)74618-9. [DOI] [PMC free article] [PubMed] [Google Scholar]
- Mazur K.; Heisler I. A.; Meech S. R. THz Spectra and Dynamics of Aqueous Solutions Studied by the Ultrafast Optical Kerr Effect. J. Phys. Chem. B 2011, 115, 2563–2573. 10.1021/jp111764p. [DOI] [PubMed] [Google Scholar]
- Lane P. D.; Reichenbach J.; Farrell A. J.; Ramakers L. A. I.; Adamczyk K.; Hunt N. T.; Wynne K. Experimental observation of nanophase segregation in aqueous salt solutions around the predicted liquid-liquid transition in water. Phys. Chem. Chem. Phys. 2020, 22, 9438–9447. 10.1039/C9CP06082K. [DOI] [PubMed] [Google Scholar]
- Hunt N. T.; Jaye A. A.; Meech S. R. Ultrafast Dynamics in Complex Fluids Observed through the Ultrafast Optically-Heterodyne-Detected Optical-Kerr-Effect (OHD-OKE). Phys. Chem. Chem. Phys. 2007, 9, 2167–2180. 10.1039/b616078f. [DOI] [PubMed] [Google Scholar]
- Rajian J. R.; Hyun B.; Quitevis E. L. Intermolecular Spectrum of Liquid Biphenyl Studied by Optical Kerr Effect Spectroscopy. J. Phys. Chem. A 2004, 108, 10107–10115. 10.1021/jp047415h. [DOI] [Google Scholar]
- Bender J. S.; Fourkas J. T.; Coasne B. Empirical Analysis of Optical Kerr Effect Spectra: A Case for Constraint. J. Phys. Chem. B 2017, 121, 11376–11382. 10.1021/acs.jpcb.7b09751. [DOI] [PubMed] [Google Scholar]
- Xiao D.; Hines L. G.; Holtz M. W.; Song K.; Bartsch R. A.; Quitevis E. L. Effect of Cation Symmetry on the Low-Frequency Spectra of Imidazolium Ionic Liquids: OKE and Raman Spectroscopic Measurements and DFT Calculations. Chem. Phys. Lett. 2010, 497, 37–42. 10.1016/j.cplett.2010.07.085. [DOI] [Google Scholar]
- Barron L. D.Molecular Light Scattering and Optical Activity; Cambridge University Press: Cambridge, U.K., 2004; 10.1017/CBO9780511535468. [DOI] [Google Scholar]
- Zhong Q.; Fourkas J. T. Searching for Voids in Liquids with Optical Kerr Effect Spectroscopy. J. Phys. Chem. B 2008, 112, 8656–8663. 10.1021/jp803535r. [DOI] [PubMed] [Google Scholar]
- Steffen T.; Meinders N. A. C. M.; Duppen K. Microscopic Origin of the Optical Kerr Effect Response of CS2-Pentane Binary Mixtures. J. Phys. Chem. A 1998, 102, 4213–4221. 10.1021/jp973422c. [DOI] [Google Scholar]
- Scaife W. G.; Vij J. K.; Evans G.; Evans M. The Complex Permittivity of Six N-Alkanes; Measurements in the Far Infrared. J. Phys. D: Appl. Phys. 1982, 15, 1279–1283. 10.1088/0022-3727/15/7/022. [DOI] [Google Scholar]
- Thomas L. L.; Christakis T. J.; Jorgensen W. L. Conformation of Alkanes in the Gas Phase and Pure Liquids. J. Phys. Chem. B 2006, 110, 21198–21204. 10.1021/jp064811m. [DOI] [PubMed] [Google Scholar]
- Byrd J. N.; Bartlett R. J.; Montgomery J. A. At What Chain Length Do Unbranched Alkanes Prefer Folded Conformations?. J. Phys. Chem. A 2014, 118, 1706–1712. 10.1021/jp4121854. [DOI] [PubMed] [Google Scholar]
- Laib J. P.; Nickel D. V.; Mittleman D. M. Terahertz Vibrational Modes Induced by Heterogeneous Nucleation in n-Alkanes. Chem. Phys. Lett. 2010, 493, 279–282. 10.1016/j.cplett.2010.05.075. [DOI] [Google Scholar]
- Shirota H. Ultrafast Dynamics of Liquid Poly(Ethylene Glycol)s and Crown Ethers Studied by Femtosecond Raman-Induced Kerr Effect Spectroscopy. J. Phys. Chem. B 2005, 109, 7053–7062. 10.1021/jp044125s. [DOI] [PubMed] [Google Scholar]
- Buckingham R. A. The Classical Equation of State of Gaseous Helium, Neon and Argon. Proc. R. Soc. A 1938, 168, 264–283. [Google Scholar]
- Giraud G.; Wynne K. A Comparison of the Low-Frequency Vibrational Spectra of Liquids Obtained through Infrared and Raman Spectroscopies. J. Chem. Phys. 2003, 119, 11753–11764. 10.1063/1.1623747. [DOI] [Google Scholar]
- Turton D. A.; Hunger J.; Stoppa A.; Thoman A.; Candelaresi M.; Hefter G.; Walther M.; Buchner R.; Wynne K. Rattling the Cage: Micro- to Mesoscopic Structure in Liquids as Simple as Argon and as Complicated as Water. J. Mol. Liq. 2011, 159, 2–8. 10.1016/j.molliq.2010.04.005. [DOI] [Google Scholar]
- Giraud G.; Gordon C. M.; Dunkin I. R.; Wynne K. The Effects of Anion and Cation Substitution on the Ultrafast Solvent Dynamics of Ionic Liquids: A Time-Resolved Optical Kerr-Effect Spectroscopic Study. J. Chem. Phys. 2003, 119, 464–477. 10.1063/1.1578056. [DOI] [Google Scholar]
- Shirota H.; Moriyama K. Low-Frequency Vibrational Motions of Polystyrene in Carbon Tetrachloride: Comparison with Model Monomer and Dependence on Concentration and Molecular Weight. J. Phys. Chem. B 2020, 124, 2006–2016. 10.1021/acs.jpcb.9b10672. [DOI] [PubMed] [Google Scholar]
- Bounds D. G.; Klein M. L.; Patey G. N. Molecular Dynamics Simulation of the Plastic Phase of Solid Methane. J. Chem. Phys. 1980, 72, 5348–5356. 10.1063/1.439027. [DOI] [Google Scholar]
- Turton D. A.; Sonnleitner T.; Ortner A.; Walther M.; Hefter G.; Seddon K. R.; Stana S.; Plechkova N. V.; Buchner R.; Wynne K. Structure and Dynamics in Protic Ionic Liquids: A Combined Optical Kerr-Effect and Dielectric Relaxation Spectroscopy Study. Faraday Discuss. 2012, 154, 145. 10.1039/C1FD00054C. [DOI] [PubMed] [Google Scholar]
- Wiebel S.; Wuttke J. Structural Relaxation and Mode Coupling in a Non-Glassforming Liquid: Depolarized Light Scattering in Benzene. New J. Phys. 2002, 4, 56. 10.1088/1367-2630/4/1/356. [DOI] [Google Scholar]
- Turton D. A.; Wynne K. Stokes-Einstein-Debye Failure in Molecular Orientational Diffusion: Exception or Rule?. J. Phys. Chem. B 2014, 118, 4600–4604. 10.1021/jp5012457. [DOI] [PubMed] [Google Scholar]
- Corsaro C.; Fazio E.; Mallamace D. The Stokes-Einstein Relation in Water/Methanol Solutions. J. Chem. Phys. 2019, 150, 234506. 10.1063/1.5096760. [DOI] [PubMed] [Google Scholar]
- Kawasaki T.; Kim K. Spurious Violation of the Stokes–Einstein–Debye Relation in Supercooled Water. Sci. Rep. 2019, 9, 8118. 10.1038/s41598-019-44517-4. [DOI] [PMC free article] [PubMed] [Google Scholar]
- Becker S. R.; Poole P. H.; Starr F. W. Fractional Stokes-Einstein and Debye-Stokes-Einstein Relations in a Network-Forming Liquid. Phys. Rev. Lett. 2006, 97, 055901. 10.1103/PhysRevLett.97.055901. [DOI] [PubMed] [Google Scholar]
- Kumar S. K.; Szamel G.; Douglas J. F. Nature of the Breakdown in the Stokes-Einstein Relationship in a Hard Sphere Fluid. J. Chem. Phys. 2006, 124, 214501. 10.1063/1.2192769. [DOI] [PubMed] [Google Scholar]
- Rössler E. Indications for a Change of Diffusion Mechanism in Supercooled Liquids. Phys. Rev. Lett. 1990, 65, 1595–1598. 10.1103/PhysRevLett.65.1595. [DOI] [PubMed] [Google Scholar]
- Hodgdon J. A.; Stillinger F. H. Stokes-Einstein Violation in Glass-Forming Liquids. Phys. Rev. E: Stat. Phys., Plasmas, Fluids, Relat. Interdiscip. Top. 1993, 48, 207–213. 10.1103/PhysRevE.48.207. [DOI] [PubMed] [Google Scholar]
- Wynne K. The Mayonnaise Effect. J. Phys. Chem. Lett. 2017, 8, 6189–6192. 10.1021/acs.jpclett.7b03207. [DOI] [PubMed] [Google Scholar]
- Bender J. S.; Cohen S. R.; He X.; Fourkas J. T.; Coasne B. Toward in Situ Measurement of the Density of Liquid Benzene Using Optical Kerr Effect Spectroscopy. J. Phys. Chem. B 2016, 120, 9103–9114. 10.1021/acs.jpcb.6b06421. [DOI] [PubMed] [Google Scholar]
- Hendrickson J. B. Molecular Geometry. V. Evaluation of Functions and Conformations of Medium Rings. J. Am. Chem. Soc. 1967, 89, 7036–7043. 10.1021/ja01002a036. [DOI] [Google Scholar]
- Kilpatrick J. E.; Pitzer K. S.; Spitzer R. The Thermodynamics and Molecular Structure of Cyclopentane. J. Am. Chem. Soc. 1947, 69, 2483–2488. 10.1021/ja01202a069. [DOI] [PubMed] [Google Scholar]
- MacPhail R. A.; Variyar J. E. Pseudorotation Dynamics in Liquid Cyclopentane by Raman Spectroscopy. Chem. Phys. Lett. 1989, 161, 239–244. 10.1016/S0009-2614(89)87067-8. [DOI] [Google Scholar]
- Kowalewski P.; Frey H. M.; Infanger D.; Leutwyler S. Probing the Structure, Pseudorotation, and Radial Vibrations of Cyclopentane by Femtosecond Rotational Raman Coherence Spectroscopy. J. Phys. Chem. A 2015, 119, 11215–11225. 10.1021/acs.jpca.5b07930. [DOI] [PubMed] [Google Scholar]
- Bocian D. F.; Strauss H. L. Conformational Structure and Energy of Cycloheptane and Some Related Oxepanes. J. Am. Chem. Soc. 1977, 99, 2876–2882. 10.1021/ja00451a005. [DOI] [Google Scholar]
- Rønne C.; Jensby K.; Loughnane B. J.; Fourkas J.; Nielsen O. F.; Keiding S. R. Temperature Dependence of the Dielectric Function of C6H6(l) and C6H5CH3(l) Measured with THz Spectroscopy. J. Chem. Phys. 2000, 113, 3749–3756. 10.1063/1.1287737. [DOI] [Google Scholar]
- Cong P.; Deuel H. P.; Simon J. D. Structure and Dynamics of Molecular Liquids Investigated by Optical-Heterodyne Detected Raman-Induced Kerr Effect Spectroscopy (OHD-RIKES). Chem. Phys. Lett. 1995, 240, 72–78. 10.1016/0009-2614(95)00492-M. [DOI] [Google Scholar]
- Heisler I. A.; Meech S. R. Low-Frequency Isotropic and Anisotropic Raman Spectra of Aromatic Liquids. J. Chem. Phys. 2010, 132, 174503. 10.1063/1.3408288. [DOI] [PubMed] [Google Scholar]
- Beard M. C.; Lotshaw W. T.; Korter T. M.; Heilweil E. J.; McMorrow D. Comparative OHD-RIKES and THz-TDS Probes of Ultrafast Structural Dynamics in Molecular Liquids. J. Phys. Chem. A 2004, 108, 9348–9360. 10.1021/jp047547a. [DOI] [Google Scholar]
- Perrot M.; Brooker M. H.; Lascombe J. Raman Light Scattering Studies of the Depolarized Rayleigh Wing of Liquids and Solutions. J. Chem. Phys. 1981, 74, 2787. 10.1063/1.441449. [DOI] [Google Scholar]
- Ricci M.; Bartolini P.; Chelli R.; Cardini G.; Califano S.; Righini R. The Fast Dynamics of Benzene in the Liquid Phase Part I. Optical Kerr Effect Experimental Investigation. Phys. Chem. Chem. Phys. 2001, 3, 2795–2802. 10.1039/b101175h. [DOI] [Google Scholar]
- Dill J. F.; Litovitz T. A.; Bucaro J. A. Molecular Reorientation in Liquids by Rayleigh Scattering: Pressure Dependence of Rotational Correlation Functions. J. Chem. Phys. 1975, 62, 3839–3850. 10.1063/1.431008. [DOI] [Google Scholar]
- Neelakandan M.; Pant D.; Quitevis E. L. Structure and Intermolecular Dynamics of Liquids: Femtosecond Optical Kerr Effect Measurements in Nonpolar Fluorinated Benzenes. J. Phys. Chem. A 1997, 101, 2936–2945. 10.1021/jp964047b. [DOI] [Google Scholar]
- Loughnane B. J.; Scodinu A.; Fourkas J. T. Temperature-Dependent Optical Kerr Effect Spectroscopy of Aromatic Liquids. J. Phys. Chem. B 2006, 110, 5708–5720. 10.1021/jp055627o. [DOI] [PubMed] [Google Scholar]
- Kakinuma S.; Shirota H. Dynamic Kerr Effect Study on Six-Membered-Ring Molecular Liquids: Benzene, 1,3-Cyclohexadiene, 1,4-Cyclohexadiene, Cyclohexene, and Cyclohexane. J. Phys. Chem. B 2015, 119, 4713–4724. 10.1021/acs.jpcb.5b00460. [DOI] [PubMed] [Google Scholar]
- Bender J. S.; Coasne B.; Fourkas J. T. Assessing Polarizability Models for the Simulation of Low-Frequency Raman Spectra of Benzene. J. Phys. Chem. B 2015, 119, 9345–9358. 10.1021/jp509968v. [DOI] [PubMed] [Google Scholar]
Associated Data
This section collects any data citations, data availability statements, or supplementary materials included in this article.