Abstract
Background
According to the World Health Organization (WHO), non-communicable diseases are responsible for 71% of annual global mortality. National governments and international organizations are increasingly considering medical imaging and nuclear medicine access data in strategies to address epidemiologic priorities. Our objective here was to develop a statistical model to assist countries in estimating their needs for PET-CT systems for the management of specific cancer types.
Material/Methods
We introduce a patient-centered statistical model based on country-specific epidemiological data, PET-CT performance, and evidence-based clinical guidelines for PET-CT use for cancer. The output of the model was integrated into a Bayesian model to rank countries or world regions that would benefit the most from upscaling PET-CT scanners.
Results
We applied our model to the IMAGINE database, recently developed by the International Atomic Energy Agency (IAEA). Our model indicates that at least 96 countries should upscale their PET-CT services and more than 200 additional PET-CT scanners would be required to fulfill their needs. The model also provides quantitative evidence indicating that low-income countries would benefit the most from increasing PET-CT provision. Finally, we discuss several cases in which the standard unit [number of scanners]/[million inhabitants] to guide strategic planning or address inequities is misleading.
Conclusions
Our model may help in the accurate delineation and further reduction of global inequities in access to PET-CT scanners. As a template, the model also has the potential to estimate the costs and socioeconomic impact of implementing any medical imaging modality for any clinical application.
MeSH Keywords: Cancer Care Facilities, Nuclear Medicine, Positron-Emission Tomography, Socioeconomic Factors
Background
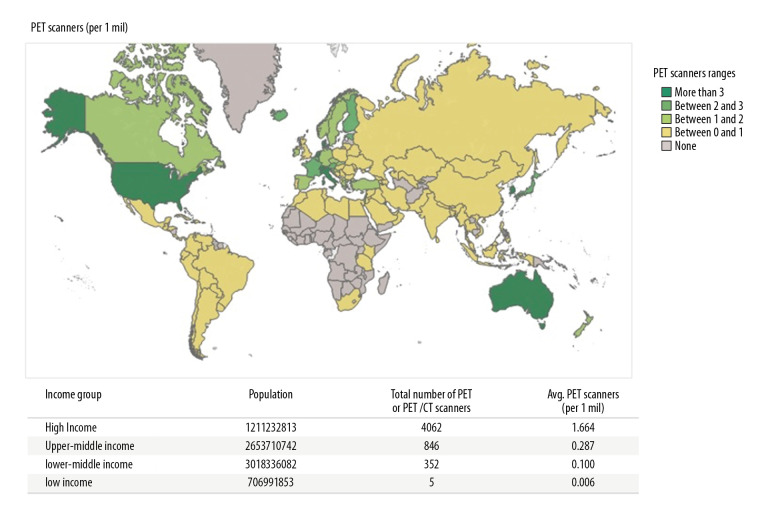
There are alarming global inequities in access to nuclear medicine and diagnostic imaging. These are now showcased in an unprecedented, comprehensive manner in IMAGINE [1], the IAEA Medical imAGIng and Nuclear mEdicine global resources database. Launched in 2019, the database is being updated regularly and presents interactive maps on the country-by-country availability of medical imaging equipment and human resources (nuclear medicine physicians and radiologists). Having collated available databases, we now have a snapshot of global inequities in nuclear medicine. As an illustrative example, in Figure 1 we integrate the IMAGINE database for PET-CT scanners with the World Bank stratification of countries by income and illustrate the inequities among income groups. Thus, the population served by 1 PET-CT scanner in high-income countries (HICs) is approximately 601 000; 3 484 000 in upper-middle-income countries (UMICs); 10 000 000 in lower-middle-income countries (LMICs); and 166 667 000 in low-income countries (LICs).
Figure 1.
PET-CT Scanners per million inhabitants. Data from IAEA IMAGINE [1].
While this database and the corresponding heat maps provide a valuable descriptive overview of the worldwide distribution of PET-CT scanners, they do not inform regarding the specific needs for PET-CT scanners per country. The question that many countries and public health organizations want to answer is how many PET-CT scanners are appropriate and needed to address the epidemiologic burden of a population.
In this article, we introduce a statistical model and its corresponding methodology, applied to the use of PET-CT scanners for the management of specific cancer types. It aims to assist countries in estimating their needs for PET-CT scanners. Firstly, we applied the proposed model to analyze the need for PET-CT scanners to evaluate patients with 6 cancer types (lung, colorectal, lymphoma, head and neck, melanoma, and esophagus) for which clinical guidelines recommend [18F]-FDG-PET-CT [2]. Secondly, a Bayesian model was used to rank the relative probability of an inhabitant lacking access to PET-CT services according to the country and world region where she or he resides. Our model serves as a springboard for strategic dialogue towards extending the population- and evidence-based benefits of medical imaging and nuclear medicine modalities in a stepwise, sustainable manner.
Material and Methods
The purpose of this study was to provide the public health community with a model that estimates: 1) the number of patients without access to PET-CT services per country, 2) the number of PET-CT scanners that a country would need, and 3) a ranking of which countries or world regions would benefit the most from upscaling PET-CT scanner numbers. We address the first 2 points and then introduce a Bayesian approach to rank countries or world regions according to the relative probability that a patient with 1 of the 6 cancers does not have access to PET-CT services.
Estimating the number of patients without access to PET-CT services per country and the number of PET-CT scanners that a country would need
Our patient-centered model starts by defining pc, the number of cancer patients without access to PET-CT services in country c. The country-based cancer statistics were compiled from IARC (the International Agency for Research on Cancer) in GLOBOCAN (the Global Cancer Observatory) [3]. For the model, we selected 6 cancer types – lung, colorectal, lymphoma (Hodgkin’s and Non-Hodgkin’s), head and neck (lip, oral cavity, oro-naso-hypo-pharynx), melanoma, and esophageal – as these are clinical indications for which [18F]-FDG-PET-CT imaging is recommended by evidence-based guidelines [2], and covered by Medicare [4]. These patients are defined henceforth as “cancer patients”.
We define
where:
nc=Ic×f, is the number of cancer patients who require PET-CT services in country c, and
qc=α×PETac is the number of patients who have access to PET-CT services in country c.
Table 1 summarizes the variables and parameters of our model, elaborated separately below.
Table 1.
List of variables and parameters used in the model.
| Variable/parameter | Description | Ref. |
|---|---|---|
| nc | # cancer patients who require PET-CT service in country c | |
| Ic | Cancer incidence in country c | [5] |
| qc | # cancer patients who have access to PET-CT services in country c | |
| f | Estimated fraction of Ic who require PET-CT services. For the six cancers, f=0.66 | [4] |
| PETac | # of available PET-CT scanners in country c | [1] |
| α | α=sc*ef*pcs=1,790 | |
| sc | Average number of PET-CT scans performed=2,340 times/PET-CT unit/year | [6] |
| ef | Scheduling efficiency of PET-CT unit=0.9 | [6] |
| psc | Proportion of PET-CT scans attributable to cancer=0.85 | [7] |
Ic: cancer incidence of the 6 cancers per country in 2018 obtained from the Global Cancer Observatory (GLOBOCAN) [5].
f: proportion of new cancer patients who require PET-CT services. The parameter f is based on Hillner et al. [4], who estimated the fraction of patients who require PET-CT services for each of these 6 cancers. We computed this fraction as the number of beneficiaries (80 900 patients; see Table 2 in Ref. [4]) divided by the number of admissions with a primary diagnosis of one of the cancer types listed (123 700 patients; see Table 2 in Ref. [4]). This gives us f=0.66, meaning that, on average, 66% of new patients with any of these 6 cancers (i.e., 66% of Ic) will require PET-CT services.
nc: estimated number of patients who require PET-CT services. The estimation is based on the parameters f and Ic. Multiplying the incidence of cancer patients by an estimated fraction of patients who require PET-CT services yields the number of new cancer patients who require PET-CT services.
qc: estimated number of PET-CT scans performed for cancer indications. Since patients often undergo only 1 PET-CT scan during the course of their disease, it is assumed here that the minimum number of cancer patients who use PET-CT services is roughly equivalent to the minimum number of PET-CT scans performed for cancer, or 1 [18F]-FDG-PET-CT scan per patient. The variable qc is a function of the number of PET-CT scanners in a country (information provided by the IAEA [1]), the average number of scans per PET-CT scanner (2340 scans/PET-CT scanner/year [6]), the average usage efficiency of PET-CT scanners (0.9 [6]), and the proportion of PET-CT scans attributable to cancer indications (0.85 [7]). We discuss these numbers below.
PETac: estimated number of PET-CT scanners in a country. Information provided by the IAEA [1].
sc: average number of scans ([18F]-FDG-PET-CT technique) per PET-CT scanner; sc=2340 scans/PET-CT scanner/year [6]. Note that this is the expected number of uses, which may be higher or lower than the actual number of effective PET-CT scans due to efficiency discrepancies and random errors.
ef: scheduling efficiency of PET-CT scanner. In this model we use ef=0.9 [6] to calculate the actual number of scans per PET-CT scanner (sc*ef=2340×0.9). Additional scans could be performed if hours of operation were extended [6].
psc: proportion of PET-CT scans performed in cancer patients, as PET-CT scanners are mostly but not exclusively used for cancer indications. We use psc=0.85; i.e., 85% of the actual number of scans are performed in cancer patients [7].
α: constant or multiplier used to estimate the number of PET-CT scans performed in cancer patients (qc). α=sc*ef*pcs=1790.
Ranking countries and world regions
An additional goal of this study was to develop a ranking system to identify countries that could benefit the most from upscaling PET-CT availability. To achieve this, we developed a naïve Bayesian approach that integrates epidemiological data into our estimation of PET-CT needs and can be used to rank countries or world regions according to the relative probability of a cancer patient lacking access to PET-CT services.
Our Bayesian model computes and defines the posterior probability of not having access to PET-CT services as:
Where P(C) is the probability of being from country C (computed as country population size/world population); P(I, n, p | C) is the conditional probability or the likelihood that a person is a 6-cancer patient, requires PET-CT service, and has no access to service given that is a citizen of country C, and P(I, n p) is the probability of having any of the 6 cancers, needing PET-CT service and not having access to it. I, n and p are the 6-cancer incidence, the number of patients who require PET-CT services, and the patients without access to PET-CT services in each country, respectively (Table 1). Population size is based upon World Bank data from 2018 [8].
All calculations, analyses, and figures were created in R (http://www.R-project.org/), Microsoft Excel (https://office.microsoft.com/excel), and Tableau software (http://www.tableau.com/).
Results
We integrated data from the IAEA IMAGINE database into the model and identified 96 countries requiring investment in PET-CT scanners in order to fully serve patients with the 6 common cancer types (Table 2). The model further estimates that the investment required to procure PET-CT scanners for the 96 countries is approximately USD$229.3M. We are only using the estimated cost of the 16-slice PET-CT scanner to compute the investment amount and not the associated cost necessary for its installation and operation, such as commissioning, maintenance, training, staffing, and other associated costs [9–16]. Nearly all modern PET-CT scanners are hybrid PET-CT units and, for the purpose of this analysis and based on PET-CT procurements by the IAEA in recent years, we estimated that the average cost of a 16-slice PET-CT scanner is USD$0.9M.
Table 2.
Countries that would require investment in PET-CT scanners to address selected six cancer.
| World Bank Country Income Group | # Countries with PET-CT scanner deficit | Procurement Investment needed | Posterior probability of no PET-CT service |
|---|---|---|---|
| HI | 10 | $26.44M | 9.87E-07 |
| UMI* | 25 | $61.03M | 6.79E-05 |
| LMI | 30 | $107.31M | 1.05E-03 |
| LI | 31 | $34.52M | 1.08E-03 |
Excluding China, as it differs significantly from other observations (e.g. China alone would require about 300 PET-CT scanners to cover the needs of cancer patients and the posterior probability of not having access to PET-CT service is 55%). These values skew the data for UMI countries.
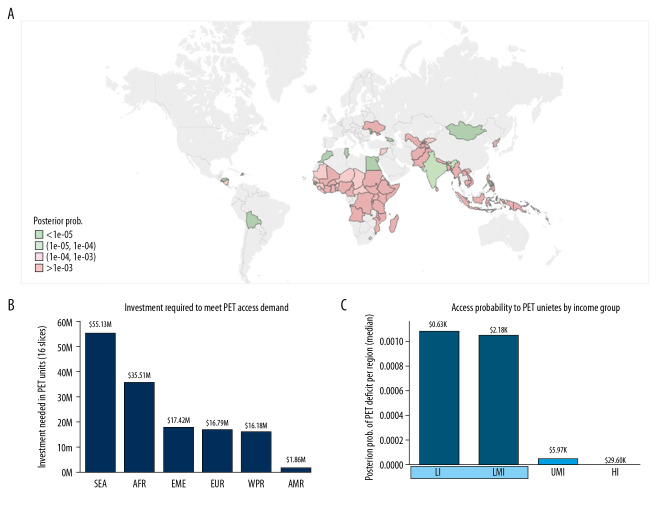
To illustrate the optimal utility of our Bayesian model, we first focused on lower-middle- and low-income countries (LMI and LI; Figure 2). According to our model, cancer patients from countries in these 2 income groups are more likely not to have access to PET-CT services (Table 2, Figure 2) compared to higher-resource settings. The model identifies 61 LMI and LI countries, out of the 72 from these income groups, that would require additional PET-CT scanners to ameliorate the PET-CT service deficits. These 61 countries include 34 countries from the WHO region Africa, 8 from Southeast Asia, 7 from the Western Pacific Region, 5 from the Eastern Mediterranean region, 4 from Europe, and 3 from the Americas. An investment of approximately $142M would meet the demand for procurement of 16 slice PET-CT scanners, to address the needs of patients with the 6 types of cancers. Dividing the number of countries per region by the investment needed per region, we can calculate the number of countries that would benefit from USD$1M invested (Figure 3).
Figure 2.
LMI and LI countries that could benefit the most from upscaling PET-CT scanners to address the burden of 6 cancer types. Using the WHO region classification and the World Bank income stratification. (A) World map showing the posterior probability of PET-CT scanner deficits. Greens: values below the median. Pinks: values above the median. Median: 1e-04. (B) Investment needed to overcome the deficit of PET-CT scanners. (C) Posterior probability of PET-CT service deficits per income group. Median gross national income per capita is also given for each group (data from the World Bank).
Figure 3.
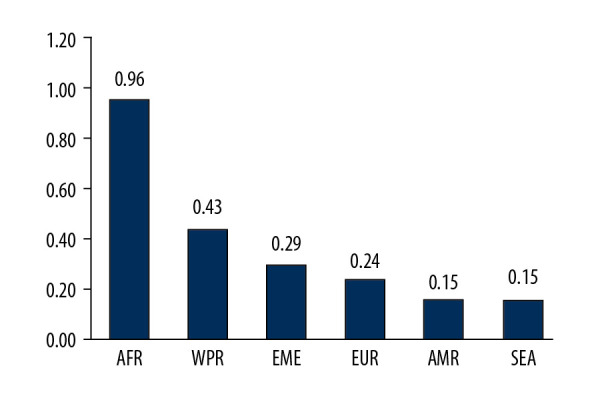
Number of LMI and LI countries that could benefit from an investment of $1M to procure PET-CT scanners.
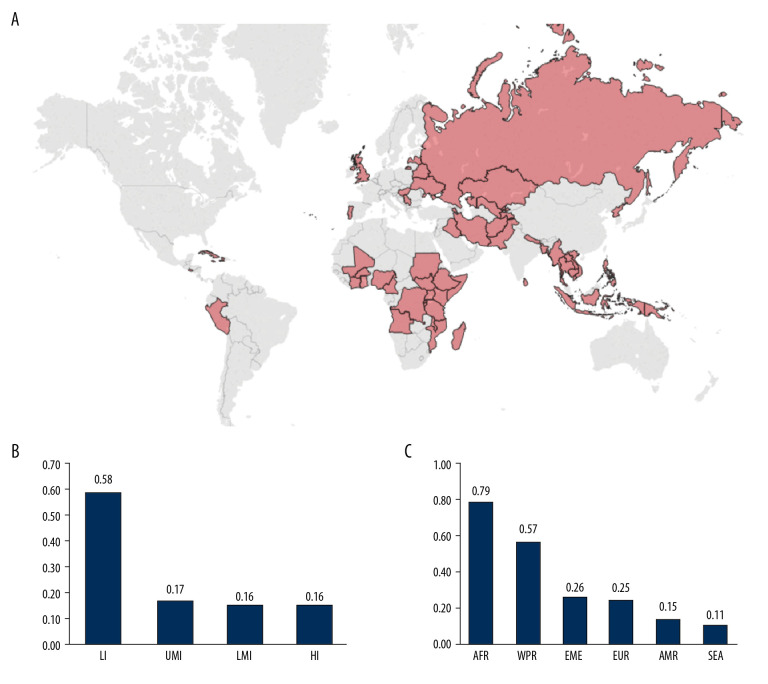
Next, we focused on countries where cancer patients most likely lack access to PET-CT services. In Figure 4A, the 53 countries most likely to have inadequate PET-CT access for a cancer patient (posterior prob. >1e-03) are highlighted (excluding China). According to our model, all these countries would require investment in PET-CT scanners. We also show that an investment of USD$1M would have a greater impact in LI countries (Figure 4B) and in the Americas and African (sub-Saharan) regions (Figure 4C).
Figure 4.
Countries where cancer patients have the highest probability of lacking access to PET-CT services (Posterior prob. >1e-03). (A) World map highlighting these countries (excluding China). (B) Number of countries that could benefit per USD$1M investment in PET-CT units per income group. (C) Number of countries that could benefit per USD$1M investment in PET-CT units per WHO region.
Finally, we focused on countries that have a similar number of PET-CT scanners per million inhabitants but face unequal service provision needs according to our model. In Figure 5 we show the frequency distribution of PET-CT scanner provision in units per million inhabitants for countries that would not require additional PET-CT scanners and those that would require additional units to meet their cancer patient needs according to our model. The overlapping region corresponds to those countries that have similar PET-CT scanner provision but for which our model identifies different requirements. For instance, the first overlapping bin includes 10 countries that have between 0.08 and 0.16 PET-CT scanners per million inhabitants. According to our model, 5 of the countries would not require additional PET-CT scanners, while the other 5, despite having similar provision, would require up to 16 additional PET-CT scanners to satisfy their specific cancer-patient demands.
Figure 5.
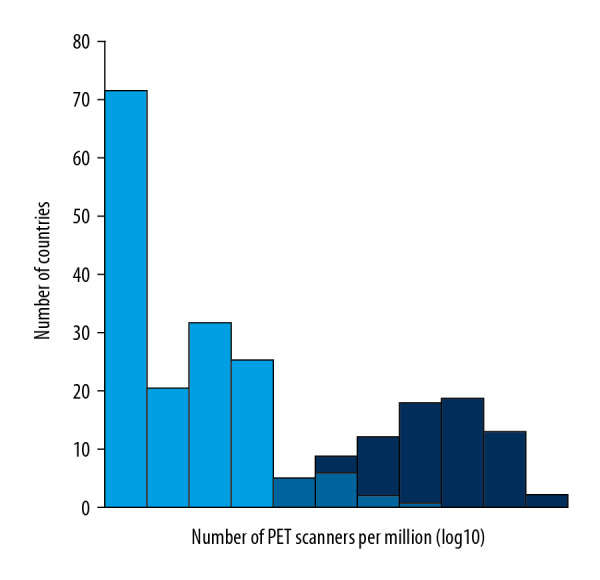
Frequency of PET-CT scanner provision. Dark blue: countries that would not require additional PET-CT scanners to fulfill their cancer patient needs according to our model. Mean and median: 1.44 and 0.96 PET-CT scanners per million inhabitants, respectively. Light blue: countries that would require more PET-CT scanners according to our model. Mean and median: 0.04 and 10−05 PET-CT scanners per million inhabitants, respectively. Note the overlapping region between both distributions, which expands from 0.04 to 0.8 PET-CT scanners per million inhabitants.0
Discussion
Reducing global inequities in access to nuclear medicine and diagnostic imaging remains a lofty goal. Stark inequities persist. To date, techniques to estimate broad population-based needs and benchmarks for upscaling PET-CT scanner numbers in low- and middle-income countries have proven elusive. We acknowledge that PET-CT scanners, the imaging modality used for this model, may not be the priority for some countries or regions. Countries first establish their use of medical imaging using modalities that are less costly, simpler to procure and use, and are more broadly applicable to an array of clinical indications, such as X-ray, ultrasound, and CT. However, the model that we present here can be adapted to analyze the specific needs for access to other medical imaging modalities, according to the socioeconomic, demographic, and epidemiological circumstances of each country. This would require more parameters and variables to be plugged into the model, as well as more assumptions. PET-CT was chosen first because most PET-CT exams are performed for cancer indications, and PET-CT thus is best-suited to development of the statistical template presented here.
A limitation of the study is that the investment estimation to satisfy the needs of cancer patients is incomplete, as we only considered the 16-slice PET-CT scanner costs. Without access to radionuclides, PET-CT scanning is impossible. A cyclotron must be within a few-hour radius of the PET-CT scanner, itself. Furthermore, radiotracers beyond [18F]-FDG would be needed for diseases not considered in this particular 6-cancer analysis. A discussion of the skilled human resources and availability of radionuclides for establishing or improving PET-CT provision are beyond the scope of this paper, as are the long-term maintenance, safety, and quality control requirements. To assist countries, the IAEA has published many relevant open-source documents, including ‘Cyclotron Produced Radionuclides: Guidelines for Setting Up a Facility’ [17] and ‘Planning a Clinical PET-CT Centre’ [18].
Other limitations of our model are the lack of mapping of existing PET-CT scanners within the individual countries’ private vs. public health systems, whether public health insurance covers PET-CT scans and where, and the relative distance of patients to the available PET-CT scanner(s), which are particularly important variables to consider for rural populations. The factors that marginalize patients from the provision of medical imaging services, even where the services exist, are variables to be included in future in-depth analyses, country-by-country, as the upscaling of PET-CT services is strategically planned.
Although these critical variables and their costs have yet to be included in the modelling, the analysis presented here does estimate the needs for sheer numbers of PET-CT scanners per country, for 6 common cancers, and is a step in the right direction towards bridging inequities in healthcare.
Conclusions
Here, we present a statistical model and its methodology, applied to the example of estimating the minimum requirements and costs to purchase PET-CT scanners to address the needs of patients with 6 selected types of cancer. Using clinical management guidelines and best practices, the same model could be applied to generate similar estimates for other medical imaging modalities and other triangulated indications based on specific demographics and epidemiological characteristics. The model described here could also be broadened to estimate the cost and socioeconomic impact of implementing any medical imaging modality for any clinical indication. The total cost of implementation, operation, and sustainability could also be included.
Implementation science promotes the use of interventions that have proven effective, supporting their integration into routine practice with the aim of improving population health. We hope that the statistical model presented in this article will serve as a stepping-stone, a synergistic companion to epidemiologic data and clinical management algorithms towards enabling countries to best meet the healthcare needs of their populations [19].
Footnotes
Conflicts of interest
None.
Source of support: Departmental sources
References
- 1.IAEA Medical imAGIng and Nuclear mEdicine (IMAGINE) https://humanhealth.iaea.org/HHW/DBStatistics/IMAGINE.html.
- 2.Boellaard R, Delgado-Bolton R, Oyen WJG, et al. FDG PET/CT: EANM procedure guidelines for tumour imaging: version 2.0. Eur J Nucl Med Mol Imaging. 2015;42:328–54. doi: 10.1007/s00259-014-2961-x. [DOI] [PMC free article] [PubMed] [Google Scholar]
- 3.International Association of Cancer Registries (GLOBOCAN) http://www.iacr.com.fr/index.php?option=com_content&view=article&id=101&Itemid=578.
- 4.Hillner BE, Tosteson AN, Song Y, et al. Growth in the use of PET for six cancer types after coverage by Medicare: Additive or replacement? J Am Coll Radiol. 2012;9:33–41. doi: 10.1016/j.jacr.2011.06.019. [DOI] [PMC free article] [PubMed] [Google Scholar]
- 5.Global cancer observatory. https://gco.iarc.fr/
- 6.Genesee/Finger Lakes Region PET Capacity and Utilization Report. Dec, 2015. https://www.commongroundhealth.org/Media/Default/Publications/2015%20PET%20report%20FINAL-20160204040543.pdf.
- 7.A framework for the development of positron emission tomography (PET) services in England. Department of health; Oct, 2005. http://www.inahta.org/wp-content/uploads/2014/09/PET_A_framework_for_development_of_PET_services_in_England.pdf. [Google Scholar]
- 8.World Bank Group. https://data.worldbank.org/
- 9.Lissak RJ. The economics of creating a positron emission tomography centre. Semin Nucl Med. 2000;30:299–305. doi: 10.1053/snuc.2000.9544. [DOI] [PubMed] [Google Scholar]
- 10.Keppler JS, Conti PS. A cost analysis of positron emission tomography. Am J Roentgenol. 2001;77:31–40. doi: 10.2214/ajr.177.1.1770031. [DOI] [PubMed] [Google Scholar]
- 11.Conti PS, Keppler JS, Halls JM. Positron emission tomography: A financial and operational analysis. Am J Roentgenol. 1994;162:1279–86. doi: 10.2214/ajr.162.6.8191981. [DOI] [PubMed] [Google Scholar]
- 12.Frick MP, Gupta NC, Sunderland JJ, et al. Consideration in setting up a positron emission tomography center. Semin Nucl Med. 1992;22:182–88. doi: 10.1016/s0001-2998(05)80145-x. [DOI] [PubMed] [Google Scholar]
- 13.Buck AK, Herrmann K, Stargardt T, et al. Economic evaluation of PET and PET/CT in oncology: Evidence and methodologic approaches. J Nucl Med Technol. 2010;38:6–17. doi: 10.2967/jnmt.108.059584. [DOI] [PubMed] [Google Scholar]
- 14.Perini EA, Skopchenko M, Hong TT, et al. Pre-feasibility study for establishing radioisotope and radiopharmaceutical production facilities in developing countries. Curr Radiopharm. 2019;12:187–200. doi: 10.2174/1874471012666190328164253. [DOI] [PubMed] [Google Scholar]
- 15.Gerke O, Hermansson R, Hess S, et al. Cost-effectiveness of PET and PET/Computed Tomography: A systematic review. PET Clin. 2015;10:105–24. doi: 10.1016/j.cpet.2014.09.008. [DOI] [PubMed] [Google Scholar]
- 16.Sloka JS, Hollett PD. Cost effectiveness of positron emission tomography in Canada. Med Sci Monit. 2005;11:PH1–6. [PubMed] [Google Scholar]
- 17.Čomor J, Haji Saied M, Pillai MRA, et al. Cyclotron produced radionuclides: guidelines for setting up a facility. International Atomic Energy Agency; 2009. https://www-pub.iaea.org/MTCD/Publications/PDF/trs471_web.pdf. [Google Scholar]
- 18.Abdul Khader MA, Amaral H, Belholavek O, et al. Planning a clinical PET-CT centre. International Atomic Energy Agency; 2010. https://www-pub.iaea.org/MTCD/Publications/PDF/Pub1457_web.pdf. [Google Scholar]
- 19.World Health Organization (WHO) https://www.who.int/governance/eb/who_constitution_en.pdf.


