. 2020 Sep 7;9:e55592. doi: 10.7554/eLife.55592

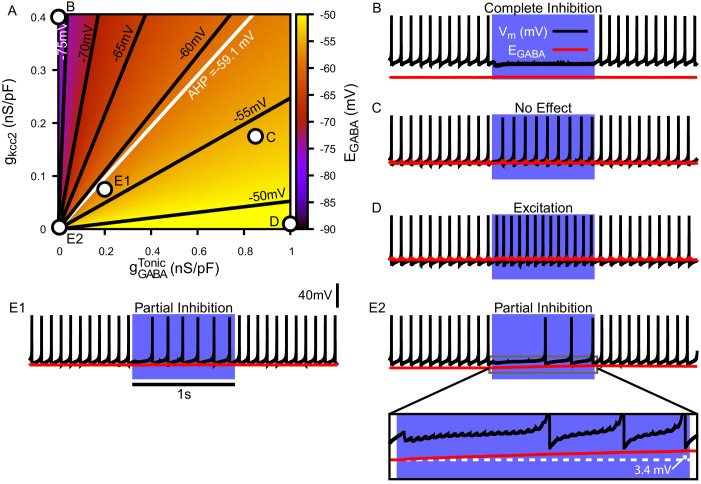
Figure 4. Tonic chloride conductance and extrusion capacity determine somatic EGABA and SNr responses to simulated 40 Hz GPe stimulation.

(A) Dependence of somatic EGABA on the tonic chloride conductance (gGABATonic) and the potassium-chloride co-transporter KCC2 extrusion capacity (gKCC2). (B–E) Examples of SNr responses to simulated indirect pathway stimulation at different positions in the 2D (gGABATonic,gKCC2) parameter space, as labeled in panel (A). (E1 and E2) Notice the two distinct types of partial inhibition. Inset highlights the drift in EGABA during stimulation.

Figure 4.

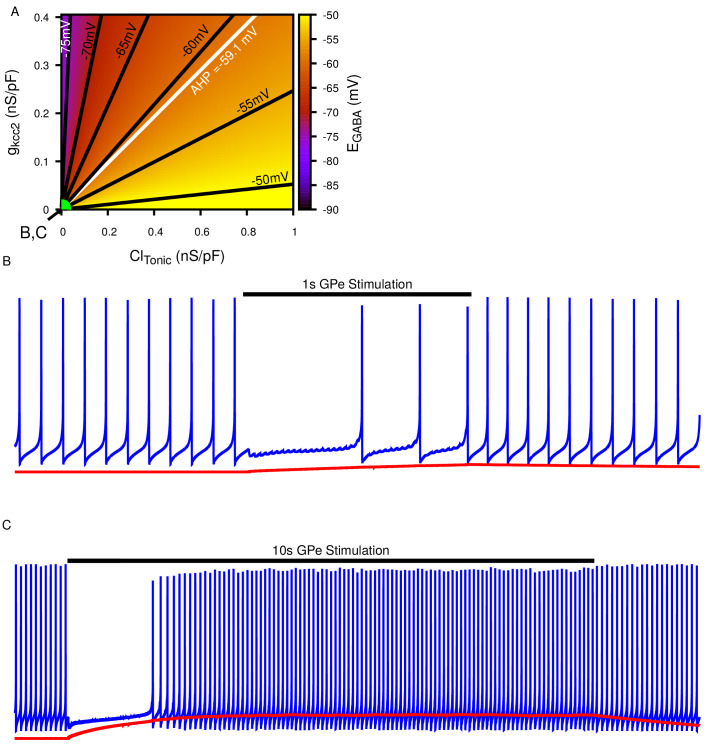
Figure 4—figure supplement 1. Biphasic SNr response to longer simulated GPe stimulation.

Figure 4—figure supplement 1.

(A) Dependence of somatic EGABA on the tonic chloride conductance (gGABATonic) and the potassium-chloride co-transporter KCC2 extrusion capacity (gKCC2) as previously shown in Figure 4A. (B) Example of ‘Partial Inhibition’ in response to 1 s of stimulation resulting due to a small accumulation of intracellular Cl-, as shown in Figure 4E2. (C) Example of longer 10 s stimulation resulting in larger Cl- accumulation resulting in a transition of EGABA from inhibitory to excitatory and thus causing a biphasic response in a simulated SNr neuron’s firing rate, as seen in 10 s stimulation experiments. gGABATonic and gKCC2 are the same in (B) and (C) and take the values indicated in (A). To generate the biphasic example the synaptic conductance gGABAS was increased from 0.2 to 0.4 nS/pF.