Abstract
Purpose
To analyze the utility of sonoelastography—a radiation-free procedure to characterize muscle properties—as an instrument to qualitatively and quantitatively assess the rectus femoris muscle.
Materials and Methods
Fifty-one consecutive patients who underwent a pelvic computed tomography (CT) exam were enrolled prospectively. The final analysis was conducted using data from 39 patients after 12 were removed due to exclusion criteria (muscle strength could not be measured due to poor cognition [n=11]; too young [n=1]). The potential correlation between average Hounsfield unit (HFU) at the rectus femoris muscle (measured by CT) and muscle quality grade (determined by sonoelastography) was assessed along with a retrospective analysis of the relationship between hand grip strength, knee extensor power, history of intensive care unit stay, length of hospital day and sonoelastographic grade.
Results
There was a significant correlation between sonoelastographic grade and the average HFU (P<0.001). Furthermore, hand grip strength (P<0.001) and knee extensor power (P<0.001) decreased significantly as the sonoelastographic grade increased. The likelihood of an intensive care unit stay and prevalence of low skeletal mass increased significantly with an increase in sonoelastography grade (P=0.037, P<0.001, respectively). The sensitivity, specificity, and accuracy of sonoelastographic images for predicting low skeletal mass were 77.3%, 100%, and 87.5%, respectively.
Conclusion
Sonoelastography advantages, including the lack of radiation and greater accessibility, may make it a valuable alternative to qualitatively and quantitatively identify sarcopenia and low skeletal mass.
Keywords: Femur, Sonoelastography, Muscle strength, Sarcopenia
INTRODUCTION
Sarcopenia has been of recent interest to various medical specialty departments. While originally defined (until as recently as 1989) as the progressive reduction of muscle mass in elderly people1), subsequent definitions also incorporate functional criteria2,3). Sarcopenia is increasingly recognized as an important independent risk factor for numerous adverse outcomes4,5,6); a particular focus has been paid to poorer surgical outcomes (e.g., higher mortality, longer hospital stays) for patients with sarcopenia compared with those without sarcopenia7,8,9).
Although most skeletal muscle disorders are managed by the orthopedic surgery department, orthopedic surgeons demonstrated a reduced interest in sarcopenia10). Furthermore, there is no consensus about the diagnostic methods for sarcopenia11). While dual energy x-ray absorptiometry (DEXA) is extensively used for diagnosing sarcopenia, it is associated with a radiation hazard12). Ultrasonography (US) may be an appropriate radiation-free substitute for assessing low skeletal mass and is generally more accessible and cheaper than magnetic resonance imaging (MRI).
Measuring muscle thickness or cross-sectional area using US can be useful to evaluate muscle quantity13,14), however, assessing muscle quality by echo intensity is not easy15). Sonoelastography is a recently developed US-based functional anatomical imaging technique which can be used to evaluate the elasticity and composition of soft tissues16,17).
The authors hypothesize that sonoelastographic findings will correlate to computed tomography (CT) findings in terms of muscle quantity and muscle quality; if this hypothesis is supported, sonoelastography may be a valuable radiation-free method to identify sarcopenia by assessing low skeletal mass.
MATERIALS AND METHODS
1. Patient Selection
Following approval by the Institutional Review Board (IRB) of the Dankook University College of Medicine (IRB No. 2017-09-016), 51 consecutive patients who underwent hip surgery for fracture or disease between May 2017 and December 2017 were prospectively enrolled. Twelve patients were removed from the analysis due to exclusion criteria (muscle strength could not be assessed due to poor cognition such as dementia [n=11] and too young [n=1]); the remaining 39 patients underwent pelvis CT exams and were analyzed. The mean age of the 39 included patients (23 females and 16 males) was 72.9 years (range: 60–95 years). Diagnoses included femoral intertrochanteric fractures (n=20), femoral neck fractures (n=12), and other (i.e., avascular necrosis of femoral head or hip dysplasia, post-traumatic arthritis; n=7).
2. Sonoelastography Techniques and Analysis
Sonoelastography studies were performed using a Siemens Acuson S2000 US system (Mochida Siemens Medical System, Tokyo, Japan) with a 12 MHz 5.6 cm linear transducer array. Sonoelastography was also evaluated before surgery as in CT studies. Patients were placed in a supine position on an examination table with both hips in the neutral position and relaxed. The rectus femoris muscle of the uninjured limb was used as the representative quadricep muscle to allow for the whole muscle to be captured on a single image. The cross-sectional area and average Hounsfield unit (HFU) calculations of the rectus femoris muscle were measured similarly to de Bruin et al.18). The transducer was placed on the superior aspect of the thigh three-fifths of the interval from the anterior superior iliac spine to the superior patellar border and placed perpendicularly to the long axis of the thigh. This was the highest point in the thigh that the entire rectus femoris muscle cross-section could be visualized in a single field in all subjects. Other muscles of the quadriceps femoris muscle group could not be encompassed in this manner. Excess contact gel was covered to minimize underlying soft tissue distortion. Minimal pressure was applied to provide an adequate view while minimizing muscle compression. Oblique images were minimized by placing the transducer perpendicular to the muscle and ensuring minimal cross-sectional area on the image. Scanning depth was set to where the femur could be discerned for orientation. Gentle contraction-relaxation maneuvers were applied to delineate muscle septa prior to the image acquisition. The cross-sectional area of the rectus femoris muscle was calculated using a planimetric technique after the inner echogenic line of the rectus femoris muscle was outlined by a movable cursor on a frozen image and the average was taken of three consecutive measurements19). To adjust for the size of the individual, the cross-sectional area of the rectus femoris muscle was standardized to height squared. Tissue elasticity distribution was calculated in real time (up to 30 frames/sec) and the results were represented with color images over the conventional B-mode image using the following standardized settings20). To minimize differences in applied pressure, a quality factor indicator on the ultrasonic apparatus monitor for degree of compression was used; 65 was considered standard21). Three sonoelastography images with a quality factor of 65 were acquired and used to generate a mean. Sonoelastography images were composed of a 256-degree color map which was configured such that the soft tissue was shown in red and hard tissue in blue. Sonoelastography was performed by two investigators who were unaware of the patients' clinical information and CT findings during their evaluation.
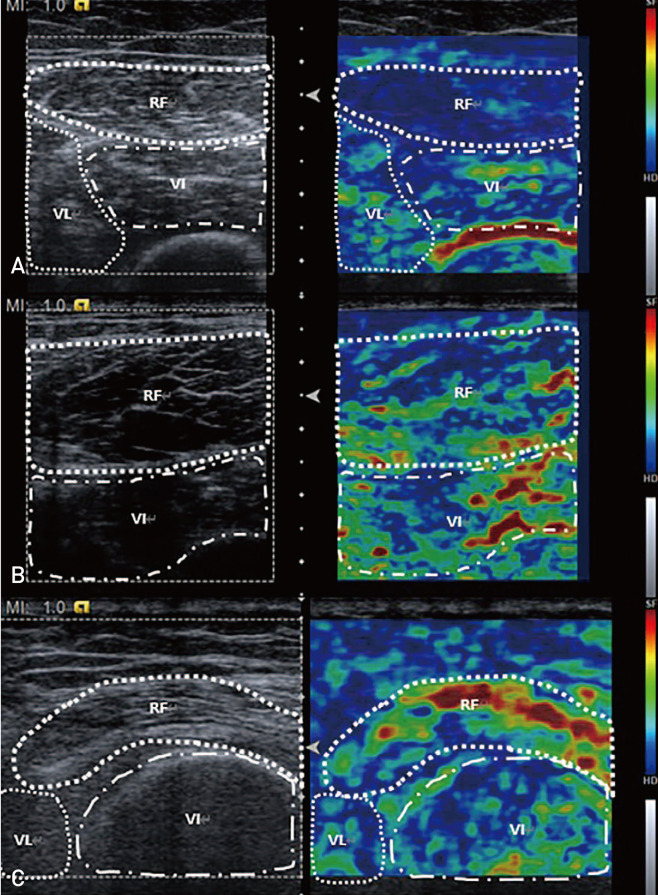
Sonoelastographic images were evaluated according to the following standards: grade 0 (absolute dominant blue region with only a few focal red regions), grade 1 (relative dominant blue region; >1/2 of desired region), and grade 2 (non-dominant blue region; ≤1/2 of desired region) (Fig. 1)21). Sonoelastographic images were also analyzed by two blinded observers using the picture archiving and communication system (PACS) (PACS-ViewRex3; Techheim, Seoul, Korea) measurement software; the mean value of these two observers was utilized as the final value.
Fig. 1. Conventional ultrasonographic (US) images of the rectus femoris muscle and sonoelastographic images using frozen US images. (A) The blue region is dominant and thus classified as grade 0. (B) When The blue region is relatively dominant (i.e., involved more than half of the muscle), it is classified as grade 1. (C) When the area occupied by the blue region is less than half, it is classified as grade 2.
RF: rectus femoris, VL: vastus lateralis, VI: vastus intermedius.
3. Computed Tomography Techniques and Analysis
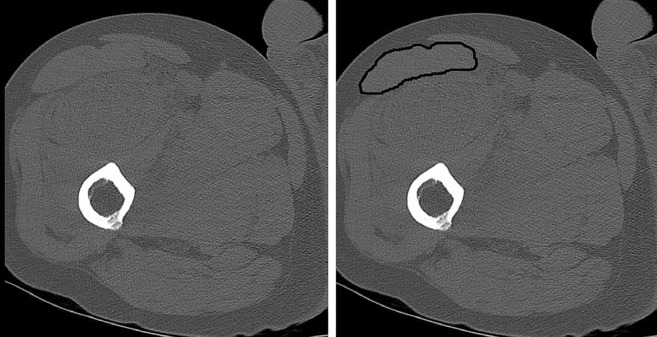
CT studies were performed immediately after admission using an Ingenuity CT system (Philips Healthcare, Cleveland, OH, USA). Patients were examined in the supine position with both hips in the neutral position and relaxed. Sagittal, coronal, and axial images were obtained with a slice thickness of 2.5 mm with no inter-slice gap, and axial images included the whole range of femur. The mean HFU and cross-sectional area of the rectus femoris were measured in the CT axial view of the uninjured limb at three-fifths of the interval from the anterior superior iliac spine to the superior patellar border as previously described20) (Fig. 2). CT images were analyzed by two blinded observers using the PACS measurement software and the mean value of two observers was used as the final value.
Fig. 2. Cross-sectional area of rectus femoris muscle was taken at three-fifths of the interval from the anterior superior iliac spine to the superior patellar border. By outlining the rectus femoris muscle using computed tomography images, average Hounsfield unit calculations and cross-sectional area of the rectus femoris was obtained.
4. Muscle Function Analysis
Hand grip strength was determined using a handheld dynamometer (JAMAR; Patterson Medical, Warrenville, IL, USA) and the standardized protocol from the American Society of Hand Therapists. Hand grip power was measured at 2 weeks postoperatively. Subjects were seated with shoulder adduction and rotation neutrally, elbow flexion at 90°, forearm in neutral and wrist between 0 and 30° of dorsiflexion22). Three consecutive measurements of each grip and hand after completing one test trial were obtained. Instructions were given to the volunteers as follows: “squeeze the handle as hard as possible.” After a maximal squeeze for a second, the peak value was registered. No encouragement was given during the measurements23). The mean value of three consecutive measurements was used as the final value.
Knee extensor power also was measured utilizing a handheld dynamometer (JAMAR; Patterson Medical) as previously described24). Knee extensor power was also measured at 2 weeks postoperatively when surgery site pain was improved and did not affect the contralateral side. Subjects were seated and their positions stabilized by holding on to the seat of the chair. Knees were positioned at a resting angle of 90° and the dynamometer was placed just above the ankle against the shin. Three consecutive measurements, after completing one test trial, were obtained. Instructions were given to the volunteers as follows: “extend the knee as hard as possible.” After a maximal squeeze for one second, the peak value was registered. No encouragement was given during the measurements. The mean value of three consecutive measurements was used as the final value.
5. Definition of Sarcopenia
The Asian Working Group for Sarcopenia (AWGS) recommendations were used to diagnose sarcopenia25) including the presence of low handgrip strength, low muscle mass and low physical performance. Other suggestions from the AWGS included: (i) definitions for low handgrip strength of <26 kg and <18 kg for men and women, respectively and (ii) using height-adjusted skeletal muscle mass with cutoff values of 7.0 kg/m2 and 5.4 kg/m2 for men and women, respectively, defined by the appendicular skeletal muscle mass/height2. Total skeletal muscle mass was estimated using the following formulas: 0.639×sum of upper mid-thigh muscle thickness×height−2.972 (for men) and 0.532×sum of upper mid-thigh muscle thickness×height−2.638 (for women) according to the approach outlined by Sanada et al.26). The assumed skeletal mass calculations were deemed inadequate by the AWGS recommendations, therefore we used it only when assessing low skeletal mass.
6. Statistical Analysis
IBM SPSS ver. 24.0 (IBM Corp., Armonk, NY, USA) software was used for statistical analyses. Spearman's correlation coefficient was used to estimate any correlation between sonoelastography and CT images. Analysis of variance (ANOVA) was used to assess the relationship between the grade of sonoelastography and the average HFU and to compare grip strength, knee extensor strength and length of hospital stay. Fisher's exact test was used to assess the relationship between sonoelastography grade and intensive care unit stay as well as low skeletal mass. Age adjustments were made using the analysis of covariance (ANCOVA) test. Diagnostic accuracy for low skeletal mass, including sensitivity and specificity of sonoelastographic images, was also analyzed. P-values less than 0.05 were considered statistically significant.
Intraobserver reliabilities in the measured parameters (e.g., sonoelastography interpretations) were assessed using the weighted Kappa coefficients method and the following scale: 0.00 (poor), 0.00–0.20 (slight), 0.21–0.40 (fair), 0.41–0.60 (moderate), 0.61–0.80 (substantial) and greater than 0.80 (almost perfect agreement).
RESULTS
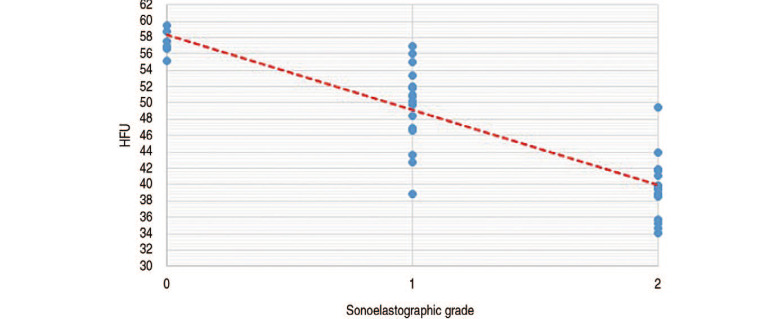
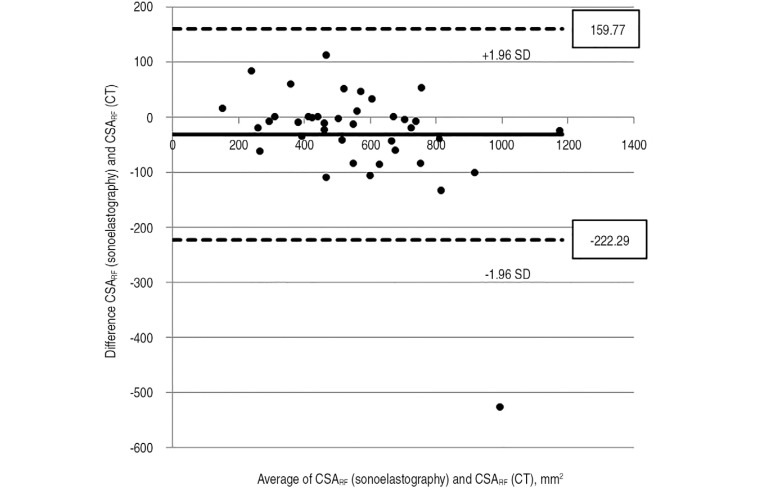
As shown in Fig. 3, there was a significant negative correlation (P<0.001) between mean HFU and sonoelastographic grade: 57.2 (grade 0), 49.8 (grade 1), and 39.4 (grade 2). The mean cross-sectional area of rectus femoris as determined using CT and sonoelastogrphy was 572.32 mm2 and 540.27 mm2, respectively; there was a significant positive correlation between these two modalities (P<0.001) (Fig. 4).
Fig. 3. Positive correlation between sonoelastographic grade and average Hounsfield unit (HFU) calculation.
Fig. 4. Positive correlation between CSARF (sonoelastography) and CSARF (computed tomography).
SD: standard deviation.
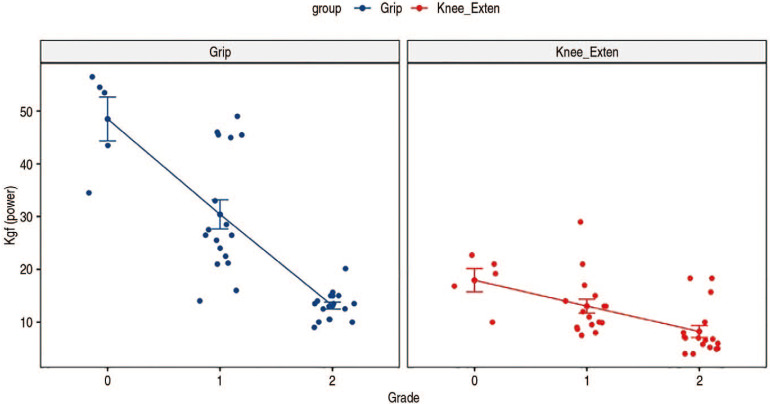
There were fewer sonoelastographic grade 0 cases compared with grades 1 and 2 (grade 0 [n=5]; grade 1 [n=17]; grade 2 [n=17]). As shown in Fig. 5, the mean grip strengths of the groups varied significantly (grade 0 [48.26 kgf]; grade 1 [30.63 kgf]; grade 2 [13.11 kgf]; P<0.001). When adjusting for age as a covariate, these differences were also significant (P<0.001). As also shown in Fig. 5, the mean knee extensor powers of the groups were also significantly different (grade 0 [17.93 kgf]; grade 1 [13.04 kgf]; grade 2 [8.22 kgf]; P<0.001); these differences were also significant when adjusting for age as a covariate (P<0.001).
Fig. 5. Significant differences in grip power and knee extensor power based on sonoelastography grade.
There was a significant difference between the grade of sonoelastography images and occurrence of a postoperative intensive care unit (ICU) stay (P=0.037)—five patients were admitted to the ICU stay and all had sonoelastophaphic grade 2 classifications. When adjusting for age as a covariate, this difference was also significant (P=0.028).
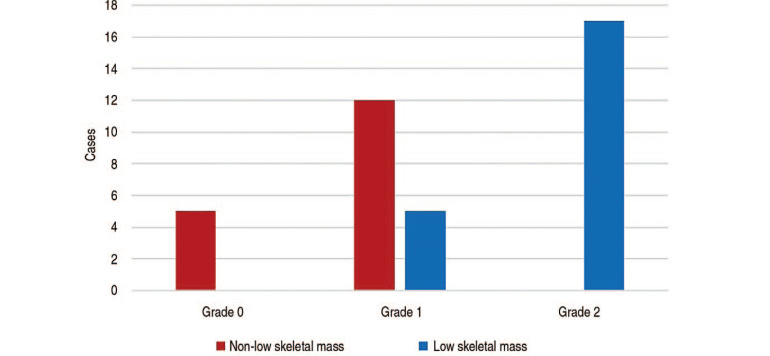
No patients with sonoelastographic grade 0 were diagnosed with low skeletal mass, compared with 5 and 17 in the grade 1 and grade 2 groups, respectively (Fig. 6). These intergroup differences were significant (P<0.001), and valid when taking age into account as a covariate (P<0.001).
Fig. 6. Frequency of non-sarcopenia and sarcopenia by sonoelastography grade.
The sensitivity and specificity of sonoelastography images for diagnosing low skeletal mass was 77.3% and 100%, respectively. The positive and negative predictive value of the sonoelastography images was 100% and 78.3%, respectively, and their accuracy was 87.5%.
Intraobserver agreement for sonoelastography interpretation demonstrated reproducibility and reliability; interobserver agreements were 0.74.
DISCUSSION
When evaluating for muscle quantity, sonoelastographic images displayed an excellent correlation with CT scans which measure the cross-sectional area of the rectus femoris muscle. Interestingly, muscle quantity as determined using sonoelastography tended to be under-estimated, an observation which may be explained by: (i) the level of compression applied during the examination despite the control efforts or (ii) insufficient relaxation of some patients and the resultant rectus femoris muscle contraction. In some cases, the rectus femoris muscle could not be captured in a single image. Accordingly, multiple images were captured and then joined together for measuring; this approach, although supported by the literature, could lead to errors. Abe et al.27) demonstrated that total skeletal muscle estimated using sonography is strongly correlated with both MRI and DEXA. Similarly, Noorkoiv et al.28) reported that US was a valid and reliable technique for the cross-sectional area assessment of the quadriceps femoris muscle at mid-thigh compared to CT.
Sonoelastographic imaging has also been shown to be a good tool for evaluating muscle quality; grip strength and knee extensor power significantly decreased as sonoelastographic grades increased. Furthermore, the grade of sonoelastographic images was shown to be effective at describing muscle function, even when excluding the impact of age. Moreover, the chance of a postoperative ICU stay increased when the rectus femoris muscle of patients had a sonoelastographic grade of 2, even when excluding the impact of age.
The European Working Group on Sarcopenia in Older People (EWGSOP) suggested a definition of sarcopenia and diagnostic algorithms in 2010; these have become the most widely used in the world2). The EWGSOP definition required measurements of three main categories for the diagnosis of sarcopenia: (i) muscle mass, (ii) muscle strength, and (iii) physical performance. These recommendations are compatible with current perspectives on sarcopenia. AWGS took similar approaches for the diagnosis of sarcopenia, but they developed an Asian consensus based on Asian-specific data25). However, the feasibility of applying these recommended diagnostic algorithms is limited because of their complexity. Hence, Ishii et al.29) developed a screening test for sarcopenia in older adults. The probability of sarcopenia was estimated with a score chart calculated by age, grip strength and calf circumference. They reported that sensitivity and specificity for diagnosing sarcopenia was 84.9% and 88.2% for men, 75.5% and 92.0% for women, respectively.
Sonoelastography is a useful tool to simultaneously evaluate muscle quantity and quality without radiation exposure. Additionally, sonoelastography is a relatively simple and rapid (roughly 5 minutes) procedure with broad accessibility. Although conventional B-mode US also facilitates an evaluation of muscle quality in accordance with its echo intensity, it is challenging to interpret30). Several studies suggested that manifestations of sarcopenia first appear in the quadriceps femoris muscle before whole body sarcopenia can be diagnosed27,31,32), and they support the strength of sonoelastography for evaluating sarcopenia.
Peng et al.33) reported that in patients undergoing hepatectomy or lobectomy for colorectal liver metastasis, those with sarcopenia were at an increased risk of: (i) major postoperative complications, (ii) longer hospital stays, and (iii) chance of ICU stay. Kim et al.34) suggested that sarcopenia was associated with poor prognosis, including higher mortality risk in patients with liver cirrhosis, regardless of which of the assessment methods for diagnosing sarcopenia were used. Moreover Kim et al.34) found that Asian populations had higher sarcopenia-related mortality rates compared to Western populations. Bokshan et al.35) noted that patients with sarcopenia had increased in-hospital complication risk, longer hospital stays, and increased mortality following thoracolumbar spinal surgery. As described above, sarcopenia is strongly associated with poorer postoperative outcomes. Here, a relationship between the chance of ICU stay postoperatively and sonoelastographic images was identified. Furthermore, since sonoelastographic images alone could support a diagnosis of sarcopenia, the authors suggest that they may also be a valuable prognostic tool.
Sonoelastography techniques have been proven viable for the diagnosis of cancers in the breast, thyroid, and prostate36,37) and are widely used in the management of musculoskeletal disorders38), such as tendon disorders (e.g., Achilles tendinopathy, lateral epicondylitis, rotator cuff tendinopathy)39,40,41). Sonoelastography could also be crucial in detecting subtle changes that occur early in the course of muscle disorders32) considering that earlier detection may improve functional prognosis. Therefore, if earlier diagnosis of sarcopenia could be supported by sonoelastography techniques, it may lead to an overall improvement of the general health of a patient.
This study has the following limitations. First, sonoelastography relies greatly on operator expertise (e.g., application of consistent probe compression, identification of imaging artifacts). To address this potential limitation: (i) sonoelastographic images were interpreted by two blinded observers with the mean of their assessments used as the final value and (ii) a quality monitoring factor was used to control for a consistent degree of pressure on the probe when capturing images. Second, the number of participants in this study was relatively small and selection bias might have arisen. Third, our study did not correspond to definition of the sarcopenia. We could not evaluate the patients' physical performance, which is one of three main categories to diagnose sarcopenia because they were not hard to ambulate. Therefore, we suggest that sonoelastography could be a useful tool to identify sarcopenia by capturing the presence of low skeletal mass. Furthermore, DEXA, which is most widely used to diagnose sarcopenia was not used to assess this study. It is also important to note that there is lack of consensus regarding the definition and diagnosis of sarcopenia using sonoelastography. Fourth, the power of knee extension might be underestimated because of the duration of bed rest. Lastly, despite literature suggesting that sarcopenia affects mortality, the mortality rate could not be estimated here since no patients died.
CONCLUSION
Sonoelastography is a simple, rapid, easily interpreted, accessible, and radiation-free procedure and may be a valuable alternative to identification of sarcopenia through a qualitative and quantitative assessment of low skeletal mass.
Footnotes
CONFLICT OF INTEREST: The authors declare that there is no potential conflict of interest relevant to this article.
References
- 1.Rosenberg IH. Summary comments. Am J Clin Nutr. 1989;50:1231–1233. [Google Scholar]
- 2.Cruz-Jentoft AJ, Baeyens JP, Bauer JM, et al. Sarcopenia: European consensus on definition and diagnosis: report of the European Working Group on Sarcopenia in Older People. Age Ageing. 2010;39:412–423. doi: 10.1093/ageing/afq034. [DOI] [PMC free article] [PubMed] [Google Scholar]
- 3.Fielding RA, Vellas B, Evans WJ, et al. Sarcopenia: an undiagnosed condition in older adults. Current consensus definition: prevalence, etiology, and consequences. International Working Group on Sarcopenia. J Am Med Dir Assoc. 2011;12:249–256. doi: 10.1016/j.jamda.2011.01.003. [DOI] [PMC free article] [PubMed] [Google Scholar]
- 4.Gariballa S, Alessa A. Sarcopenia: prevalence and prognostic significance in hospitalized patients. Clin Nutr. 2013;32:772–776. doi: 10.1016/j.clnu.2013.01.010. [DOI] [PubMed] [Google Scholar]
- 5.Jones KI, Doleman B, Scott S, Lund JN, Williams JP. Simple psoas cross-sectional area measurement is a quick and easy method to assess sarcopenia and predicts major surgical complications. Colorectal Dis. 2015;17:O20–O26. doi: 10.1111/codi.12805. [DOI] [PubMed] [Google Scholar]
- 6.Alexandre Tda S, Duarte YA, Santos JL, Wong R, Lebrão ML. Sarcopenia according to the European Working Group on Sarcopenia in Older People (EWGSOP) versus dynapenia as a risk factor for mortality in the elderly. J Nutr Health Aging. 2014;18:751–756. doi: 10.1007/s12603-014-0540-2. [DOI] [PubMed] [Google Scholar]
- 7.Leeper CM, Lin E, Hoffman M, et al. Computed tomography abbreviated assessment of sarcopenia following trauma: the CAAST measurement predicts 6-month mortality in older adult trauma patients. J Trauma Acute Care Surg. 2016;80:805–811. doi: 10.1097/TA.0000000000000989. [DOI] [PMC free article] [PubMed] [Google Scholar]
- 8.Moisey LL, Mourtzakis M, Cotton BA, et al. Skeletal muscle predicts ventilator-free days, ICU-free days, and mortality in elderly ICU patients. Crit Care. 2013;17:R206. doi: 10.1186/cc12901. [DOI] [PMC free article] [PubMed] [Google Scholar]
- 9.Du Y, Karvellas CJ, Baracos V, et al. Sarcopenia is a predictor of outcomes in very elderly patients undergoing emergency surgery. Surgery. 2014;156:521–527. doi: 10.1016/j.surg.2014.04.027. [DOI] [PubMed] [Google Scholar]
- 10.Bokshan SL, DePasse JM, Daniels AH. Sarcopenia in orthopedic surgery. Orthopedics. 2016;39:e295–e300. doi: 10.3928/01477447-20160222-02. [DOI] [PubMed] [Google Scholar]
- 11.Cooper C, Fielding R, Visser M, et al. Tools in the assessment of sarcopenia. Calcif Tissue Int. 2013;93:201–210. doi: 10.1007/s00223-013-9757-z. [DOI] [PMC free article] [PubMed] [Google Scholar]
- 12.Chien MY, Huang TY, Wu YT. Prevalence of sarcopenia estimated using a bioelectrical impedance analysis prediction equation in community-dwelling elderly people in Taiwan. J Am Geriatr Soc. 2008;56:1710–1715. doi: 10.1111/j.1532-5415.2008.01854.x. [DOI] [PubMed] [Google Scholar]
- 13.Abe T, Kawakami Y, Suzuki Y, Gunji A, Fukunaga T. Effects of 20 days bed rest on muscle morphology. J Gravit Physiol. 1997;4:S10–S14. [PubMed] [Google Scholar]
- 14.Strasser EM, Draskovits T, Praschak M, Quittan M, Graf A. Association between ultrasound measurements of muscle thickness, pennation angle, echogenicity and skeletal muscle strength in the elderly. Age (Dordr) 2013;35:2377–2388. doi: 10.1007/s11357-013-9517-z. [DOI] [PMC free article] [PubMed] [Google Scholar]
- 15.Boutin RD, Yao L, Canter RJ, Lenchik L. Sarcopenia: current concepts and imaging implications. AJR Am J Roentgenol. 2015;205:W255–W266. doi: 10.2214/AJR.15.14635. [DOI] [PubMed] [Google Scholar]
- 16.Ophir J, Céspedes I, Ponnekanti H, Yazdi Y, Li X. Elastography: a quantitative method for imaging the elasticity of biological tissues. Ultrason Imaging. 1991;13:111–134. doi: 10.1177/016173469101300201. [DOI] [PubMed] [Google Scholar]
- 17.Botar-Jid C, Damian L, Dudea SM, Vasilescu D, Rednic S, Badea R. The contribution of ultrasonography and sonoelastography in assessment of myositis. Med Ultrason. 2010;12:120–126. [PubMed] [Google Scholar]
- 18.de Bruin PF, Ueki J, Watson A, Pride NB. Size and strength of the respiratory and quadriceps muscles in patients with chronic asthma. Eur Respir J. 1997;10:59–64. doi: 10.1183/09031936.97.10010059. [DOI] [PubMed] [Google Scholar]
- 19.Seymour JM, Ward K, Sidhu PS, et al. Ultrasound measurement of rectus femoris cross-sectional area and the relationship with quadriceps strength in COPD. Thorax. 2009;64:418–423. doi: 10.1136/thx.2008.103986. [DOI] [PubMed] [Google Scholar]
- 20.Frey H. [Realtime elastography. A new ultrasound procedure for the reconstruction of tissue elasticity] Radiologe. 2003;43:850–855. doi: 10.1007/s00117-003-0943-2. German. [DOI] [PubMed] [Google Scholar]
- 21.Seo JB, Yoo JS, Ryu JW. Sonoelastography findings of supraspinatus tendon in rotator cuff tendinopathy without tear: comparison with magnetic resonance images and conventional ultrasonography. J Ultrasound. 2014;18:143–149. doi: 10.1007/s40477-014-0148-8. [DOI] [PMC free article] [PubMed] [Google Scholar]
- 22.Fess EE. Grip strength. In: Casanova JS, editor. Clinical assessment recommendations. 2nd ed. Chicago: American Society of Hand Therapists; 1992. pp. 41–45. [Google Scholar]
- 23.Peolsson A, Hedlund R, Oberg B. Intra- and inter-tester reliability and reference values for hand strength. J Rehabil Med. 2001;33:36–41. doi: 10.1080/165019701300006524. [DOI] [PubMed] [Google Scholar]
- 24.Chan OY, van Houwelingen AH, Gussekloo J, Blom JW, den Elzen WP. Comparison of quadriceps strength and handgrip strength in their association with health outcomes in older adults in primary care. Age (Dordr) 2014;36:9714. doi: 10.1007/s11357-014-9714-4. [DOI] [PMC free article] [PubMed] [Google Scholar]
- 25.Chen LK, Liu LK, Woo J, et al. Sarcopenia in Asia: consensus report of the Asian Working Group for Sarcopenia. J Am Med Dir Assoc. 2014;15:95–101. doi: 10.1016/j.jamda.2013.11.025. [DOI] [PubMed] [Google Scholar]
- 26.Sanada K, Kearns CF, Midorikawa T, Abe T. Prediction and validation of total and regional skeletal muscle mass by ultrasound in Japanese adults. Eur J Appl Physiol. 2006;96:24–31. doi: 10.1007/s00421-005-0061-0. [DOI] [PubMed] [Google Scholar]
- 27.Abe T, Thiebaud RS, Loenneke JP, Loftin M, Fukunaga T. Prevalence of site-specific thigh sarcopenia in Japanese men and women. Age (Dordr) 2014;36:417–426. doi: 10.1007/s11357-013-9539-6. [DOI] [PMC free article] [PubMed] [Google Scholar]
- 28.Noorkoiv M, Nosaka K, Blazevich AJ. Assessment of quadriceps muscle cross-sectional area by ultrasound extended-field-of-view imaging. Eur J Appl Physiol. 2010;109:631–639. doi: 10.1007/s00421-010-1402-1. [DOI] [PubMed] [Google Scholar]
- 29.Ishii S, Tanaka T, Shibasaki K, et al. Development of a simple screening test for sarcopenia in older adults. Geriatr Gerontol Int. 2014;14(Suppl 1):93–101. doi: 10.1111/ggi.12197. [DOI] [PubMed] [Google Scholar]
- 30.Strobel K, Hodler J, Meyer DC, Pfirrmann CW, Pirkl C, Zanetti M. Fatty atrophy of supraspinatus and infraspinatus muscles: accuracy of US. Radiology. 2005;237:584–589. doi: 10.1148/radiol.2372041612. [DOI] [PubMed] [Google Scholar]
- 31.Loenneke JP, Thiebaud RS, Abe T. Estimating site-specific muscle loss: a valuable tool for early sarcopenia detection? Rejuvenation Res. 2014;17:496–498. doi: 10.1089/rej.2014.1611. [DOI] [PubMed] [Google Scholar]
- 32.Brandenburg JE, Eby SF, Song P, et al. Ultrasound elastography: the new frontier in direct measurement of muscle stiffness. Arch Phys Med Rehabil. 2014;95:2207–2219. doi: 10.1016/j.apmr.2014.07.007. [DOI] [PMC free article] [PubMed] [Google Scholar]
- 33.Peng PD, van Vledder MG, Tsai S, et al. Sarcopenia negatively impacts short-term outcomes in patients undergoing hepatic resection for colorectal liver metastasis. HPB (Oxford) 2011;13:439–446. doi: 10.1111/j.1477-2574.2011.00301.x. [DOI] [PMC free article] [PubMed] [Google Scholar]
- 34.Kim G, Kang SH, Kim MY, Baik SK. Prognostic value of sarcopenia in patients with liver cirrhosis: a systematic review and meta-analysis. PLoS One. 2017;12:e0186990. doi: 10.1371/journal.pone.0186990. [DOI] [PMC free article] [PubMed] [Google Scholar]
- 35.Bokshan SL, Han AL, DePasse JM, et al. Effect of sarcopenia on postoperative morbidity and mortality after thoracolumbar spine surgery. Orthopedics. 2016;39:e1159–e1164. doi: 10.3928/01477447-20160811-02. [DOI] [PubMed] [Google Scholar]
- 36.Evans A, Whelehan P, Thomson K, et al. Invasive breast cancer: relationship between shear-wave elastographic findings and histologic prognostic factors. Radiology. 2012;263:673–677. doi: 10.1148/radiol.12111317. [DOI] [PubMed] [Google Scholar]
- 37.Zhang Y, Tang J, Li YM, et al. Differentiation of prostate cancer from benign lesions using strain index of transrectal real-time tissue elastography. Eur J Radiol. 2012;81:857–862. doi: 10.1016/j.ejrad.2011.02.037. [DOI] [PubMed] [Google Scholar]
- 38.Klauser AS, Miyamoto H, Bellmann-Weiler R, Feuchtner GM, Wick MC, Jaschke WR. Sonoelastography: musculoskeletal applications. Radiology. 2014;272:622–633. doi: 10.1148/radiol.14121765. [DOI] [PubMed] [Google Scholar]
- 39.Klauser AS, Miyamoto H, Tamegger M, et al. Achilles tendon assessed with sonoelastography: histologic agreement. Radiology. 2013;267:837–842. doi: 10.1148/radiol.13121936. [DOI] [PubMed] [Google Scholar]
- 40.De Zordo T, Lill SR, Fink C, et al. Real-time sonoelastography of lateral epicondylitis: comparison of findings between patients and healthy volunteers. AJR Am J Roentgenol. 2009;193:180–185. doi: 10.2214/AJR.08.2020. [DOI] [PubMed] [Google Scholar]
- 41.Buck AR, Verstraete N, Li Y, Schweizer A, Snedeker JG, Buck FM. Detection of small tendon lesions by sonoelastographic visualization of strain profile differences: initial experiences. Skeletal Radiol. 2012;41:1073–1079. doi: 10.1007/s00256-011-1349-2. [DOI] [PubMed] [Google Scholar]


