

Abstract
The effect of intracerebroventricular (i.c.v.) injection of a wide range of glucose concentrations on the behavioral response, central amino acid and monoamine contents was investigated in chicks exposed to a social isolation stressful condition. The chicks were given an i.c.v. injection of 0.21, 0.42, 0.84, and 1.68 µmol of D-glucose, and then behavioral changes were observed over 10 min. The behavioral stress response was dose-dependently decreased and calm behavior was increased by i.c.v. administration of glucose. In the diencephalon, glutamine was positively correlated, whereas glycine was negatively correlated with the dose of glucose. In the telencephalon, the dopamine metabolite and dopamine turnover rates were positively correlated, whereas dopamine was negatively correlated with doses of glucose. In the plasma, isoleucine and hydroxyproline were positively correlated with the dose of glucose, and several amino acids were also influenced by glucose levels.
These results suggest that the possible pathways of the sedative effect of glucose include: (1) amino acids synthesized from injected glucose, which can induce the sedative and/or hypnotic effects; (2) amino acids modified by injected glucose transported in the brain from the peripheral tissues; and (3) injected glucose-induced decreases in brain dopamine levels. In conclusion, these changes induced by central glucose interact and induce the sedative effect in neonatal chicks.
Keywords: amino acids, behavior, glucose, monoamine, stress
Introduction
Stress may induce profound effects on the mental and physical well-being of an individual, and can have an important role in the pathogenesis of various diseases. Chronic diseases such as mood disorders, melancholic depression, panic disorders, anxiety disorders, and gastrointestinal disturbances reflect defective regulation of stress responses and are induced either by hyperfunction or hypofunction of stress (Chrousos, 1998).
The stress response is necessary for survival of all animals. However, this response can also be detrimental when exaggerated or prolonged. The stress response in domesticated chickens can cause harmful changes to blood, skeletal integrity, and meat quality (Sandercock et al., 2001).
The chicken is a social animal that normally lives in small family groups or larger mixed groups with a relatively stable social structure. Indeed, close attachments are often formed between brood mates or members of a group (Marin et al., 2001). However, modern farming practices often impose several deviations from what might be considered the natural situation. Such deviations may include crowding, alteration of group membership, loss of contact with familiar flockmates, and exposure to strangers. Disrupting the birds' social environment or confining them in crowded spaces can cause them intense and prolonged distress (Jones and Harvey, 1987; Marin et al., 2001). Not only can this contribute to the development of depression (reduced vitality or even hopelessness), social withdrawal and cognitive impairment but it may also seriously damage the birds' health and productivity (Marin et al., 2001; Mendl, 1999).
The behavior of chicks under stressful conditions has been investigated (Panksepp et al., 1980; Sahley et al., 1981; Feltenstein et al., 2003). According to Panksepp et al. (1997), young animals that exhibit social bonding exhibit intense and persistent distress vocalization when isolated from their social support. Meanwhile, there are differences in behaviors between breeds of domestic chicks (Launay et al., 1993), and differences between strains clearly reflect different selective pressures for particular behavioral characteristics. Reducing stress sensitivity by feeding or genetic selection will increase growth and efficiency of food utilization, resistance to disease and reduce aggression. Productivity will increase with improved welfare of animals.
Central administration of amino acids such as DL-tryptophan (Kurauchi et al., 2006a), L-asparagine (Yamane et al., 2009b), L-proline (Hamasu et al., 2009a, 2010), L-serine (Asechi et al., 2006), L-arginine (Suenaga et al., 2008a), L-ornithine (Suenaga et al., 2008b), L-aspartate (Yamane et al., 2009b; Erwan et al., 2012), L-glutamate (Yamane et al., 2009c), ß-alanine (Tomonaga et al., 2004), L-alanine (Kurauchi et al., 2006b), L-cysteine (Yamane et al., 2009a), GABA (Shigemi, Tomonaga and Furuse, unpublished data), glycine (Asechi et al., 2006), and L-serine-ophosphate (L-SOP) (Asechi et al., 2006) attenuate the stress response in neonatal chicks.
Intracerebroventricular (i.c.v) injection of glucose attenuates the stress response of neonatal chicks exposed to an acute stressful condition (Asechi et al., 2008). However, the mechanism of this effect of glucose is unclear. As previously mentioned, a wide variety of both essential and nonessential amino acids can have a similar effect. Some pathway can synthesize the amino acids, e.g., phosphorylated pathway and the tricarboxylic acid (TCA) cycle. In glycolysis, some glycerate-3-phosphate is metabolized to 3-phosphohydroxy-pyruvate by phosphoglycerate dehydrogenase and subsequently to L-SOP by phosphoserine aminotransferase (phosphorylated pathway). Then, L-SOP can be converted to L-serine, glycine, L-cysteine, pyruvate, etc.. In addition, L-asparagine, L-glutamine, L-aspartate, L-glutamate, and L-alanine are produced via the TCA cycle. It is possible, therefore, that the sedative effect of glucose may be induced by its metabolites including various amino acids.
In addition to amino acids, monoamines exert a key role in the regulation of the stress response. Central injection of norepinephrine or serotonin can attenuate an acute stress response (Zhang et al., 2003, 2004). According to Hamasu et al. (2012), during restraint with isolation-induced stress, dopaminergic metabolism was clearly stimulated, and during fasting stress, not only dopaminergic activity but also serotonergic and norepinephrinergic metabolism were stimulated. The precursors of these monoamines are amino acids. From the results reported by Ogino et al. (2015), some amino acid and monoamine contents of the diencephalon and telencephalon were modified after i.c.v. injection of glucose dose-dependently under non-stressful condition. However, the sedative effect of glucose is very difficult to explain from defined amino acid, monoamine or metabolic pathway, since the study was done under absence of stress (Ogino et al., 2015). On the other hand, these results imply the possibility that the sedative effect of glucose under acute stressful conditions can be expressed using glucose lower or higher than 0.84 µmol which level was recognized as the efficient dose in the previous research (Asechi et al., 2008). Therefore, it is worth to examine the effect of lower concentrations of glucose on behavior and the central nervous system in chicks.
The aim of the present study was to clarify the relationships between the sedative effect of i.c.v. injected glucose, amino acid metabolism and monoamine metabolisms in neonatal chicks.
Materials and Methods
Animals and Food
One-day-old male layer type chicks (Julia) were purchased from a local hatchery (Murata Hatchery, Fukuoka, Japan) and housed in a windowless room at a constant temperature of 30±1°C. Continuous lighting was provided. The birds were given free access to a commercial starter diet (AX, Toyohashi Feed and Mills Co., Ltd., Toyohashi, Japan) and water. The chicks were reared in a group (20–25/cage) till the start of the experiment. On the day of the experiment, chicks (5-day-old) were assigned to treatment groups based on their body weight in order to produce uniform treatment groups. Experimental procedures followed the guidance for Animal Experiments in Faculty of Agriculture and in the Graduate Course of Kyushu University and the Law (NO. 105) and Notification (NO. 6) of the Government.
Preparation of Glucose Solution
D-Glucose was a gift from Nihon Shokuhin Kako Co., Ltd. (Tokyo, Japan). D-Glucose was dissolved in 0.85% saline containing 0.1% Evans Blue solution and stirred well in a vortex.
Experimental Procedure
I.c.v. injections were made using a microsyringe according to the method of Davis et al. (1979) and Koutoku et al. (2005). The stress and pain suffered by this method is minimal as described elsewhere (Koutoku et al., 2005). The injected volume was 10 µl.
The chicks were given i.c.v. injection of 0 (saline), 0.21, 0.42, 0.84, or 1.68 µmol of D-glucose. After the injection, the chicks were immediately placed in an acrylic monitoring cage (40 cm × 30 cm × 20 cm), and behavioral observations were made for 10 min. During this period, the chicks were deprived of water and diet. Chick vocalizations were simultaneously recorded using a computer with the software Windows Media Player (Microsoft Corporation, Redmond, WA, USA) and the number of distress vocalizations, which are shrill and intense calls, was counted using Sound Engine software (Coderium, Sapporo, Japan). Feltenstein et al. (2003) demonstrated that the number of distress vocalizations in isolated conditions significantly increased when compared to in the social group. Video cameras were positioned to record the behaviors of chicks from three different directions. Based on the method by van Luijtelaar et al. (1987), the chick's behaviors were classified into four categories: (1) active wakefulness; (2) standing/sitting motionless with eyes opened; (3) standing motionless with eyes closed; and (4) sitting motionless with the head drooped (sleeping posture) by watching the videotape. They demonstrated the correlation between sleeping posture and electrophysiological sleep with electroencephalogram measurement (van Luijtelaar et al., 1987). The monitoring systems were set in a separate room to avoid disturbing the animals. The blood was collected through the jugular vein into heparinized tubes at the conclusion of the behavioral tests. In addition, blood was collected from the intact group (neither i.c.v. injection nor isolation stress) were done. The number of chicks used as an intact group was 5.
The blood was centrifuged at 4°C and 10,000 × g for 4 min, and the plasma was collected and stored at −80°C until analysis. Blood glucose was determined using a glucose kit (Wako Pure Chemical Industries, Ltd., Osaka, Japan).
Finally, the birds were decapitated following anesthesia with isoflurane. The brains were removed and the location of the Evans Blue dye was confirmed. Data of chicks without dye in the lateral ventricle were deleted. Both sides of the telencephalon and diencephalon were quickly divided and stored in tubes. Then, these samples were dropped into liquid nitrogen for flash freezing and stored at −80°C in the deep freezer until analysis of amino acids, monoamines, and glucose.
Analysis of Monoamine in the Brain
Brain monoamine levels were analyzed according to the method of Tomonaga et al. (2008) with some modification. The brain tissues were homogenized in ice-cold 0.85% saline and left for 30 min on ice. Thereafter, the homogenates were centrifuged at 0°C and 20,000 × g for 15 min and filtered through an ultrafiltration tube (Millipore, Bedford, USA) for deproteinization. Thereafter, a mixture of equal parts of each supernatant and 0.4 M perchloric acid solution (PCA) containing 0.02 mM ethylendiaminetetraacetic acid disodium salt (EDTA·2Na) were adjusted to pH 3.0 by adding 1 M sodium acetate. A 30 µl portion of compound liquid was applied to high-performance liquid chromatography (HPLC) system (Eicom, Kyoto, Japan) with a 150 × 3.0 mm octadecyl silane (ODS) column (EICOMPAK SC-5ODS, Eicom) and an electrochemical detector (ECD-300, Eicom, Kyoto, Japan) at an applied potential of +750 mV versus an Ag/AgCl reference analytical electrode. Changes in electric current (nA) were recorded in a computer using an interface system (Power Chrom ver 2.3.2.J; AD Instruments, Tokyo, Japan). The mobile phase consisted of 0.1 M aceto-citric acid buffer (pH 3.5), methanol, 0.46 M sodium 1-octane sulfonate, 0.1 M sodium acetate, and EDTA·2Na (5 mg/ml) at a flow rate of 0.5 ml/min. The concentrations of monoamines and their metabolites including, dopamine (DA), norepinephrine (NE), epinephrine (E), 3-methoxy-4-hydroxy-phenyl-ethylene glycol (MHPG), 3, 4-dihydroxy-phenylacetic acid (DOPAC), homovanillic acid (HVA), serotonin (5-HT), 5-hydroxyindol acetic acid (5-HIAA), and their concentrations in the brain and monoamine turnover rate (metabolite/precursor), NE/DA, E/NE, E/DA, MHPG/NE, MHPG/DA, DOPAC/DA, HVA/DOPAC, HVA/DA, and 5-HIAA/5-HT were calculated.
Analysis of Free Amino Acids
Brain and plasma free amino acid levels were analyzed according to the method of Boogers et al. (2008) with some modifications. The brain tissues were homogenized, centrifuged, filtered, and combined with 0.4 M PCA containing 0.02 mM EDTA·2Na by same process as for the analysis of monoamines. The homogenates were adjusted to pH 7 with 1 M sodium hydroxide. Plasma was prepared by centrifuging at 4°C and 12,000 × g for 10 min, and filtered through an ultrafiltration tube (Millipore, Bedford, USA). Each sample (brain 20 µl; plasma 10 µl) was completely dried under reduced pressure. Dried residues were dissolved in 10 µl of 1 M sodium acetate-methanol-triethylamine (2:2:1) solution, re-dried, and dissolved in 20 µl of methanol-water-triethylamine-phenylisothiocyanate (7:1:1:1) solution. At room temperature for 20 min, phenylisothiocyanate was allowed to react with the amino groups, and the samples were dried again and dissolved in 200 µl of Pico-Tag Diluent (Waters, Milford, USA). These diluted samples were filtered through a 0.45 µm filter (Millipore, Bedford, USA). The same method was applied to standard solutions prepared by diluting a commercially available L-amino acid solution (type AN II and type B; Wako, Osaka, Japan) with distilled water. These derivatized samples were applied to a Waters HPLC system (Pico-Tag free amino acid analysis column (3.9 mm × 300 mm), Alliance 2690 separation module, 2487 dual-wavelength UV detector, and Millennium 32 chromatography manager; Waters, Milford, USA). They were equilibrated with buffer A [70 mM sodium acetate (pH 6.45 with 10% acetic acid)–acetonitrile (975:25)] and eluted with a linear gradient of buffer B [water–acetonitrile–methanol (40:45: 15)] (0, 3, 6, 9, 40, and 100%) at a flow rate of 1 ml/min at 46°C. The absorbance at 254 nm was applied to determine concentrations of free amino acids. Triethylamine and sodium acetate trihydrate were purchased from Wako (Osaka, Japan), while other drugs for which no manufacturer is noted were purchased from Sigma (St Louis, USA). The system applied here could not separate L- and D-form of amino acids. Accodingly, the results for determined amino acids are described only by the name of amino acids.
Analysis of Brain Glucose
Brain glucose was determined using a Glucose Assay Kit II (BioVision Inc., Milpitas, CA, USA). The brain tissues were homogenized, centrifuged, and filtered by the same process as for the analysis of monoamines and amino acids. The volume used for assay was 5 µl.
Statistical Analysis
All analysis were conducted using a regression analysis, and data for brain glucose levels were statistically analyzed by one-way analysis of variance (ANOVA), and Dunnett test was done as a post hoc test. Significant levels implied P< 0.05. Values are presented as means±S.E.M. Statistical analysis was made using commercially available package, Stat View (Version 5, SAS Institute, Cary, USA, 1998). All data in each group were first subjected to a Thompson rejection test as described by Kobayashi and Pillai (2013) to eliminate outliers (P<0.01), and the remaining data were used for the analysis among groups.
Results
Table 1 shows the effect of i.c.v. injection of glucose on various behavioral categories during the 10 min behavior observation. The time for active wakefulness was reduced and the time for standing motionless with eyes opened was increased with increasing doses of glucose. A negative dose-response relationship was observed between glucose and distress vocalizations, but no significant correlation was obtained (data not shown).
Table 1. Effect of i.c.v. injection of several doses of glucose on various behavioral categories of 5-day-old chicks after 10 min post injection.
| Glucose (µmol) |
|||||
|---|---|---|---|---|---|
| 0 | 0.21 | 0.42 | 0.84 | 1.68 | |
| Active wakefulness† | 223±84 | 86±48 | 109±47 | 136±41 | 1±1 |
| Standing/sitting motionless | 310±25 | 277±31 | 325±36 | 295±33 | 398±41 |
| with eyes opened† | |||||
| Standing motionless | 0±0 | 0±0 | 0±0 | 0±0 | 0±0 |
| with eyes closed | |||||
| Sitting motionless | 106±48 | 153±61 | 142±69 | 84±25 | 201±41 |
| with head drooped | |||||
| (sleeping posture) | |||||
| Total | 600 | 600 | 600 | 600 | 600 |
Values are means±S.E.M. in seconds. The number of chicks used in each group was 6–7. Effects with a probability of P<0.05 were considered to be significant.
P<0.05 on regression analysis. Active wakefulness (seconds/10 min)=175 (SE 35.1)−99.3 (SE 41.2)X (R2=0.167, P<0.05). Standing motionless with eyes opened (seconds/10 min)=285 (SE 21.7)+56.8 (SE 25.1)X (R2=0.155, P<0.05).
X=injected glucose in µmol.
Fig. 1 shows the effect of i.c.v. injection of several doses of glucose on plasma glucose level. There was a quadratic change (P<0.05) with the lowest value at 0.42 µmol. Fig. 2 shows the effect of i.c.v. injection of several doses of glucose on brain glucose concentration. There was no correlation between the injected dose and the glucose concentration in either the diencephalon or telencephalon, although the glucose concentration in the telencephalon (F(5,29)=2.975, P<0.05), intact group and 0.21 µmol glucose treated group were significantly lower than the control group.
Fig. 1.
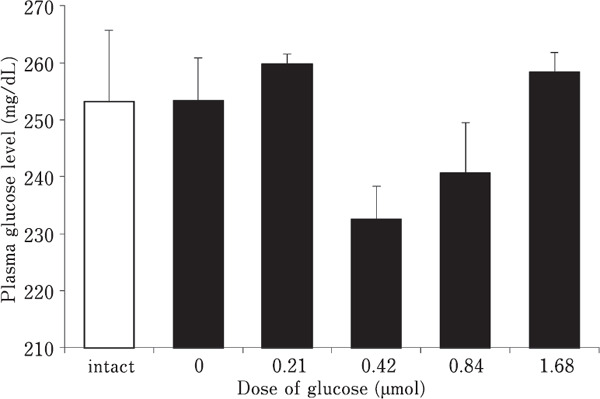
Effect of i.c.v. injection of several doses of glucose on plasma glucose level in 5-day-old layer chicks. Results are expressed as means±S.E.M. The number of chicks used in each group was as follows: intact 5 and others 6. Plasma glucose level (mg/dL)=257 (SE 5.56)−46.1 (SE 18.8)X+27.9 (SE 10.4)X2 (R2=0.215, P<0.05). X=injected glucose in µmol.
Fig. 2.
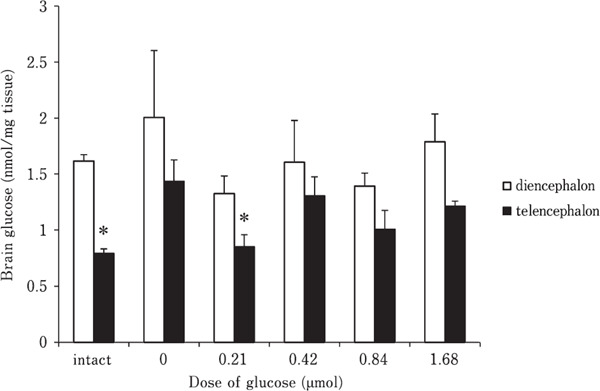
Effect of i.c.v. injection of several doses of glucose on brain glucose level in 5-day-old layer chicks. Results are expressed as means±S.E.M. The number of chicks used in each group was as follows: intact 4 and others 6–7. A probability of P<0.05 was considered to be significant. *, significant changes from control (0 µmol) group.
Tables 2–4 show the effects of i.c.v. administration of 0, 0.21, 0.42, 0.84, and 1.68 µmol of glucose on the amino acid contents of the diencephalon, telencephalon, and plasma 10 min post-injection. In the diencephalon, glutamine (P< 0.05) was positively correlated, whereas glycine (P<0.05) was negatively correlated with doses of glucose. Quadratic correlations were detected for alanine (P<0.05) and tyrosine (P<0.05), and a cubic correlation was detected in glutamate P<0.05). In the telencephalon, cystathionine (P<0.05) was negatively correlated with doses of glucose. Quadratic correlations were detected in threonine (P<0.05) with the lowest value at 0.84 µmol and lysine (P<0.05) with the highest value at 0.84 µmol, and a cubic correlation was detected in phenylalanine (P<0.05) and taurine (P<0.05). In the plasma, isoleucine (P<0.05) and hydroxyproline (P< 0.005) were positively correlated with the dose of glucose. Cubic correlations were detected in leucine (P<0.05), methionine (P<0.05), tyrosine (P<0.05), valine (P<0.05), alanine (P<0.01), cystathionie (P<0.05), and 1-methylhistidine (P<0.05). The regression equations of these amino acids are listed in Table 5.
Table 2. Dose-response effects of i.c.v. injection of glucose on amino acid contents of the diencephalon in 5-day-old chicks.
| Glucose (µmol) |
|||||
|---|---|---|---|---|---|
| 0 | 0.21 | 0.42 | 0.84 | 1.68 | |
| Histidine | 32±4 | 29±4 | 30±4 | 29±3 | 28±3 |
| Isoleucine | 82±4 | 84±2 | 85±3 | 85±4 | 85±4 |
| Leucine | 83±26 | 70±22 | 72±23 | 75±26 | 56±23 |
| Methionine | 45±4 | 38±2 | 44±2 | 44±1 | 42±2 |
| Phenylalanine | 108±7 | 105±3 | 106±5 | 106±2 | 114±6 |
| Threonine | 430±27 | 376±23 | 403±12 | 369±10 | 390±14 |
| Tryptophan | 9±9 | 1±1 | 2±2 | 1±1 | 1±1 |
| Tyrosine† | 109±4 | 92±7 | 97±3 | 92±4 | 101±4 |
| Valine | 297±8 | 268±5 | 305±6 | 296±5 | 307±12 |
| Asparagine | 134±5 | 125±4 | 129±10 | 130±3 | 135±8 |
| Glutamine2020 | 2384±85 | 2333±63 | 2471±82 | 2476±85 | 2610±119 |
| Proline | 128±6 | 121±5 | 123±4 | 119±3 | 115±6 |
| Serine | 625±23 | 609±21 | 587±8 | 585±8 | 579±20 |
| Arginine | 272±8 | 255±7 | 264±9 | 258±5 | 258±11 |
| Lysine | 160±8 | 174±26 | 159±12 | 164±6 | 145±6 |
| Ornithine | 18±2 | 16±1 | 18±0 | 15±1 | 18±2 |
| Aspartate | 1117±57 | 1027±57 | 1073±21 | 978±38 | 1017±70 |
| Glutamate2020 | 668±27 | 590±18 | 608±12 | 631±20 | 630±11 |
| β-Alanine | 32±2 | 30±2 | 31±2 | 33±2 | 28±2 |
| Alanine2020 | 357±15 | 321±11 | 325±8 | 307±11 | 326±16 |
| Anserine | 163±4 | 155±10 | 155±10 | 159±2 | 157±4 |
| Carnosine | 6±1 | 10±1 | 10±1 | 10±3 | 10±2 |
| Cystathionine | 23±3 | 16±2 | 15±4 | 15±5 | 15±4 |
| GABA | 602±19 | 617±13 | 618±7 | 609±8 | 611±17 |
| Glycine2020 | 1054±32 | 1043±24 | 1015±28 | 1023±38 | 931±44 |
| 3-Methyl-histidine | 193±21 | 218±32 | 215±41 | 227±24 | 159±14 |
| Taurine | 2518±44 | 2506±39 | 2531±66 | 2535±39 | 2437±87 |
Values are means±S.E.M. in pmol/mg wet tissue. The number of chicks used in each group was 6–7.
P<0.05 on regression analysis.
Table 3. Dose-response effects of i.c.v. injection of glucose on amino acid contents of the telencephalon in 5-day-old chicks.
| Glucose (µmol) |
|||||
|---|---|---|---|---|---|
| 0 | 0.21 | 0.42 | 0.84 | 1.68 | |
| Histidine | 35±6 | 28±3 | 33±3 | 28±6 | 25±5 |
| Isoleucine | 69±8 | 68±7 | 69±7 | 70±9 | 64±6 |
| Leucine | 183±16 | 175±13 | 195±17 | 164±18 | 180±15 |
| Methionine | 48±1 | 50±4 | 55±4 | 46±3 | 42±3 |
| Phenylalanine† | 120±6 | 129±11 | 147±8 | 118±10 | 138±7 |
| Threonine† | 568±41 | 509±26 | 534±24 | 495±39 | 608±25 |
| Tryptophan | 82±11 | 78±8 | 72±20 | 75±17 | 77±7 |
| Tyrosine | 129±4 | 133±14 | 128±11 | 119±8 | 114±10 |
| Valine | 490±32 | 566±35 | 505±33 | 470±20 | 503±13 |
| Asparagine | 171±8 | 170±7 | 162±12 | 172±12 | 169±16 |
| Glutamine | 3420±160 | 3383±160 | 3710±149 | 3377±210 | 3302±279 |
| Proline | 158±9 | 150±7 | 178±13 | 169±11 | 172±17 |
| Serine | 756±40 | 697±40 | 731±44 | 738±29 | 728±21 |
| Lysine† | 218±13 | 254±13 | 229±12 | 253±16 | 191±10 |
| Arginine | 273±17 | 251±15 | 268±10 | 250±16 | 259±19 |
| Ornithine | 35±2 | 27±2 | 33±2 | 26±2 | 29±3 |
| Aspartate | 1553±88 | 1506±104 | 1523±147 | 1454±108 | 1329±72 |
| Glutamate | 1368±56 | 1251±61 | 1350±72 | 1231±67 | 1327±114 |
| β-Alanine | 27±4 | 34±3 | 33±2 | 30±2 | 29±2 |
| Alanine | 563±19 | 536±35 | 588±34 | 520±33 | 555±43 |
| Anserine | 140±7 | 151±16 | 151±18 | 128±8 | 149±7 |
| Cystathionine† | 44±2 | 41±2 | 43±1 | 41±2 | 37±2 |
| GABA | 462±76 | 357±44 | 454±71 | 318±37 | 372±76 |
| Glycine | 1361±35 | 1368±52 | 1468±51 | 1287±77 | 1333±76 |
| Hydroxyproline | 392±254 | 400±237 | 386±249 | 196±196 | 271±204 |
| 3-Methyl-histidine | 677±37 | 653±40 | 644±24 | 570±34 | 625±16 |
| SOP | 11±11 | 10±10 | 0±0 | 0±0 | 31±14 |
| Taurine† | 8108±174 | 8591±181 | 8473±244 | 7972±224 | 7946±169 |
Values are means±S.E.M. in pmol/mg wet tissue. The number of chicks used in each group was 5–7.
P<0.05 on regression analysis.
Table 4. Dose-response effects of i.c.v. injection of glucose on plasma amino acid contents in 5-day-old chicks.
| Glucose (µmol) |
|||||
|---|---|---|---|---|---|
| 0 | 0.21 | 0.42 | 0.84 | 1.68 | |
| Histidine | 175±15 | 224±15 | 204±9 | 211±14 | 215±6 |
| Isoleucine† | 78±6 | 97±3 | 96±5 | 94±4 | 100±8 |
| Leucine† | 347±25 | 422±15 | 441±22 | 403±18 | 457±33 |
| Methionine† | 70±4 | 82±5 | 80±2 | 71±3 | 79±6 |
| Phenylalanine | 175±14 | 218±21 | 207±18 | 202±15 | 206±21 |
| Threonine | 1017±90 | 1108±41 | 1108±69 | 922±49 | 1103±106 |
| Tryptophan | 55±26 | 67±32 | 89±32 | 26±26 | 13±13 |
| Tyrosine† | 203±16 | 234±19 | 209±9 | 174±15 | 232±19 |
| Valine† | 348±22 | 444±25 | 445±13 | 428±15 | 461±29 |
| Asparagine | 290±17 | 315±9 | 311±22 | 300±11 | 286±22 |
| Glutamine | 1473±85 | 1456±72 | 1475±89 | 1475±33 | 1503±106 |
| Proline | 740±70 | 878±44 | 956±58 | 874±31 | 930±106 |
| Serine | 976±39 | 1161±40 | 1057±44 | 1039±33 | 1045±81 |
| Arginine | 514±28 | 619±21 | 548±31 | 555±17 | 606±45 |
| Lysine | 153±26 | 245±39 | 164±29 | 218±23 | 127±11 |
| Ornithine | 75±12 | 99±6 | 81±8 | 92±10 | 86±8 |
| Aspartate | 21±1 | 20±1 | 22±1 | 21±2 | 22±1 |
| Glutamate | 161±6 | 153±5 | 156±11 | 146±6 | 158±7 |
| β-Alanine | 13±1 | 18±2 | 16±1 | 15±1 | 16±2 |
| Alanine† | 859±42 | 1082±59 | 1146±70 | 967±44 | 1118±107 |
| Anserine | 24±2 | 26±1 | 27±1 | 25±0 | 26±1 |
| Cystathionine† | 38±2 | 42±1 | 41±1 | 39±1 | 41±2 |
| GABA | 0±0 | 0±0 | 0±00 | ±0 | 0±0 |
| Glycine | 713±50 | 767±32 | 768±25 | 739±19 | 788±36 |
| Hydroxyproline†† | 243±20 | 330±21 | 285±27 | 310±22 | 395±48 |
| 1-Methyl-histidine† | 30±1 | 39±5 | 38±1 | 33±2 | 31±1 |
| SOP | 23±2 | 24±2 | 21±4 | 21±2 | 20±3 |
| Taurine | 139±5 | 150±18 | 129±19 | 147±13 | 136±13 |
Values are means±S.E.M. in pmol/µl. The number of chicks used in each group was 6–7.
P<0.05 and
P<0.005 on regression analysis.
Table 5. Regression equation of brain amino acid contents (Tables 2, 3 and 4).
| Regression equation | R2 value | |
|---|---|---|
| Diencephalon (pmol/mg wet tissue) | ||
| Tyrosine | 105 (SE 3.84)−34.0 (SE 13.4)X+18.8 (SE 7.57)X2 | 0.181 |
| Glutamine | 2361 (SE 54.3)+149 (SE 64.4)X | 0.151 |
| Glutamate | 662 (SE 18.3)−374 (SE 137)X+600 (SE 236)X2−231 (SE 97.1)X3 | 0.209 |
| Alanine | 351 (SE 11.1)−93.2 (SE 37.5)X+46.7 (SE 20.7)X2 | 0.189 |
| Glycine | 1057 (SE 21.8)−68.8 (SE 25.5)X | 0.195 |
| Telencephalon (pmol/mg wet tissue) | ||
| Phenylalanine | 118 (SE 8.23)+127 (SE 64.5)X−229 (SE 112)X2+95.5 (SE 45.9)X3 | 0.158 |
| Threonine | 562 (SE 27.5)−172 (SE 90.0)X+118 (SE 50.2)X2 | 0.206 |
| Lysine | 223 (SE 11.1)+76.4 (SE 38.7)X−56.8 (SE 21.5)X2 | 0.322 |
| Cystathionine | 43.7 (SE 1.20)−3.80 (SE 1.39)X | 0.211 |
| Taurine | 8134 (SE 195)+2971 (SE 1438)X−5745 (SE 2462)X2+2328 (SE 1011)X3 | 0.248 |
| Plasma (pmol/µl) | ||
| Isoleucine | 86.8 (SE 3.72)+9.27 (SE 4.36)X | 0.135 |
| Leucine | 347 (SE 21.3)+493 (SE 163)X−762 (SE 281)X2+302 (SE 115)X3 | 0.339 |
| Methionine | 70.8 (SE 4.03)+72.0 (SE 29.9)X−133 (SE 51.3)X2+55.3 (SE 21.1)X3 | 0.211 |
| Tyrosine | 206 (SE 15.6)+158 (SE 116)X−388 (SE 199)X2+180 (SE 81.8)X3 | 0.245 |
| Valine | 352 (SE 21.1)+522 (SE 162)X−765 (SE 282)X2+294 (SE 116)X3 | 0.401 |
| Alanine | 857 (SE 70.2)+1597 (SE 515)X−2630 (SE 871)X2+1055 (SE 355)X3 | 0.281 |
| Cystathionine | 38.0 (SE 1.20)+24.1 (SE 9.27)X−43.0 (SE 16.5)X2+17.7 (SE 6.86)X3 | 0.227 |
| Hydroxyproline | 266 (SE 20.6)+73.3 (SE 22.9)X | 0.255 |
| 1-Methyl-histidine | 30.8 (SE 2.45)+50.1 (SE 18.7)X−84.2 (SE 32.4)X2+32.5 (SE 13.4)X3 | 0.244 |
X=injected glucose in µmol.
Tables 6 and 7 show the effects of i.c.v. administration of 0, 0.21, 0.42, 0.84, and 1.68 µmol of glucose on the monoamines, their metabolites, and their turnover rates in the diencephalon and telencephalon 10 min post-injection. In the diencephalon, HVA (P<0.05) was negatively correlated with the dose of glucose. Cubic correlations were detected for E/DA (P<0.0005) and HVA/DA (P<0.005). In the telencephalon, DOPAC (P<0.01), NE/DA (P<0.05), E/DA (P<0.05), MHPG/DA (P<0.05), DOPAC/DA (P<0.005) and HVA/DA (P<0.05) were positively correlated, whereas DA (P<0.05) was negatively correlated with doses of glucose. Cubic correlations were detected for E/NE (P<0.05) with the highest value in the control and 5-HIAA/5-HT (P< 0.05) with the lowest value in the control.
Table 6. Dose-response effects of i.c.v. injection of glucose on monoamine contents, their metabolites, and their metabolic turnover rates of the diencephalon in 5-day-old chicks.
| Glucose (µmol) |
|||||
|---|---|---|---|---|---|
| 0 | 0.21 | 0.42 | 0.84 | 1.68 | |
| DA | 591±62 | 688±34 | 550±37 | 742±73 | 546±57 |
| NE | 9±1 | 8±1 | 7±2 | 18±8 | 10±3 |
| E | 248±17 | 314±15 | 229±24 | 247±11 | 234±15 |
| MHPG | 727±52 | 902±109 | 758±120 | 708±100 | 696±56 |
| DOPAC | 63±8 | 68±4 | 56±6 | 45±5 | 67±3 |
| HVA† | 206±15 | 254±12 | 203±26 | 180±14 | 170±20 |
| 5-HT | 632±35 | 735±22 | 671±32 | 641±25 | 604±18 |
| 5-HIAA | 57±6 | 64±6 | 47±5 | 52±5 | 50±5 |
| NE/DA | 0.014±0.002 | 0.013±0.001 | 0.014±0.003 | 0.025±0.012 | 0.015±0.002 |
| E/NE | 27.6±3.93 | 36.8±3.55 | 31.7±7.26 | 24.7±7.71 | 29.6±4.01 |
| E/DA†† | 0.349±0.044 | 0.477±0.023 | 0.509±0.041 | 0.345±0.031 | 0.410±0.026 |
| MHPG/NE | 83.0±5.99 | 125±16.1 | 102±15.8 | 80.0±26.2 | 65.4±17.3 |
| MHPG/DA | 0.944±0.130 | 1.540±0.101 | 1.237±0.212 | 1.113±0.181 | 1.005±0.151 |
| DOPAC/DA | 0.101±0.012 | 0.102±0.006 | 0.126±0.011 | 0.095±0.010 | 0.110±0.007 |
| HVA/DOPAC | 2.69±0.241 | 3.25±0.275 | 3.11±0.121 | 3.20±0.183 | 2.87±0.259 |
| HVA/DA†† | 0.316±0.028 | 0.379±0.015 | 0.412±0.031 | 0.288±0.041 | 0.260±0.014 |
| 5-HIAA/5-HT | 0.100±0.011 | 0.088±0.009 | 0.077±0.003 | 0.080±0.010 | 0.079±0.010 |
| Regression equation | R2 value | |
|---|---|---|
| HVA | 225 (SE 13.1)−34.9 (SE 14.7)X | 0.159 |
| E/DA | 0.346 (SE 0.032)+1.01 (SE 0.241)X−1.82 (SE 0.414)X2+0.739 (SE 0.170)X3 | 0.421 |
| HVA/DA | 0.311 (SE 0.027)+0.603 (SE 0.198)X−1.12 (SE 0.341)X2+0.440 (SE 0.140)X3 | 0.442 |
Values are means±S.E.M. in pg/mg wet tissue. The number of chicks used in each group was 6–7.
P<0.05 and
P< 0.005 on regression analysis.
X=injected glucose in µmol.
Table 7. Dose-response effects of i.c.v. injection of glucose on monoamine contents, their metabolites, and their metabolic turnover rates of the telencephalon in 5-day-old chicks.
| Glucose (µmol) |
|||||
|---|---|---|---|---|---|
| 0 | 0.21 | 0.42 | 0.84 | 1.68 | |
| DA6† | 124±14 | 108±9 | 94±6 | 88±6 | 88±10 |
| NE | 7±0 | 8±1 | 7±1 | 7±0 | 7±1 |
| E | 108±4 | 96±3 | 94±8 | 101±5 | 97±7 |
| MHPG | 123±13 | 127±23 | 128±13 | 121±16 | 134±6 |
| DOPAC†† | 3±1 | 4±1 | 4±0 | 6±1 | 6±0 |
| HVA | 153±4 | 141±7 | 139±5 | 139±7 | 141±3 |
| 5-HT | 249±7 | 225±4 | 237±19 | 238±13 | 231±3 |
| 5-HIAA | 104±6 | 100±2 | 100±4 | 100±4 | 102±9 |
| NE/DA† | 0.056±0.007 | 0.073±0.006 | 0.077±0.005 | 0.084±0.011 | 0.085±0.009 |
| E/NE† | 15.1±0.661 | 12.5±1.13 | 12.2±0.932 | 14.3±0.724 | 13.5±1.09 |
| E/DA† | 0.806±0.090 | 0.906±0.089 | 0.852±0.041 | 1.05±0.104 | 1.05±0.074 |
| MHPG/NE | 17.2±1.92 | 17.4±5.18 | 18.7±2.00 | 17.1±1.85 | 18.7±0.913 |
| MHPG/DA† | 1.27±0.313 | 1.12±0.167 | 1.44±0.153 | 1.52±0.305 | 1.91±0.146 |
| DOPAC/DA†† | 0.021±0.004 | 0.034±0.010 | 0.036±0.006 | 0.067±0.019 | 0.069±0.004 |
| HVA/DOPAC | 50.3±11.5 | 30.5±4.62 | 35.8±6.10 | 33.7±8.91 | 20.2±0.902 |
| HVA/DA† | 1.14±0.079 | 1.21±0.050 | 1.57±0.100 | 1.52±0.167 | 1.65±0.186 |
| 5-HIAA/5-HT† | 0.408±0.030 | 0.433±0.020 | 0.527±0.031 | 0.414±0.026 | 0.450±0.032 |
| Regression equation | R2 value | |
|---|---|---|
| DA | 114 (SE 6.34)−19.1 (SE 7.49)X | 0.213 |
| DOPAC | 3.29 (SE 0.613)+2.18 (SE 0.770)X | 0.250 |
| NE/DA | 0.066 (SE 0.006)+0.014 (SE 0.006)X | 0.176 |
| E/NE | 15.1 (SE 0.834)−17.4 (SE 6.40)X+29.5 (SE 11.0)X2−11.7 (SE 4.49)X3 | 0.282 |
| E/DA | 0.845 (SE 0.057)+0.150 (SE 0.069)X | 0.178 |
| MHPG/DA | 1.19 (SE 0.158)+0.422 (SE 0.195)X | 0.170 |
| DOPAC/DA | 0.028 (SE 0.008)+0.030 (SE 0.010)X | 0.299 |
| HVA/DA | 1.23 (SE 0.090)+0.284 (SE 0.102)X | 0.251 |
| 5-HIAA/5-HT | 0.395 (SE 0.029)+0.525 (SE 0.219)X−0.879 (SE 0.375)X2+0.349 (SE 0.153)X3 | 0.225 |
Values are means±S.E.M. in pg/mg wet tissue. The number of chicks used in each group was 4–6.
P<0.05 and
P< 0.005 on regression analysis. X=injected glucose in µmol.
Discussion
The i.c.v. injection of 0.84 µmol of glucose was previously shown to have a sedative effect in chicks (Asechi et al., 2008). This effect appears to be dose-dependent in the present study. The brain glucose concentration did not differ at the end of the 10 min isolation stress irrespective of the dose of glucose applied. This fact implies that administered glucose was quickly metabolized. This was confirmed by the changes in amino acid and monoamine concentrations in the present study.
Glutamine (r=0.504, P<0.01) and valine (r=0.532, P<0.005) in the diencephalon and asparagine (r=0.404, P< 0.05) and phenylalanine (r=0.416, P<0.05) in the telencephalon were positively correlated with standing/sitting motionless with eyes opened. L-Asparagine has sedative and hypnotic effects (Yamane et al., 2009b, Erwan et al., 2012), and this is likely associated with the mechanism of the sedative effect of glucose. However, sitting motionless with head drooped, i.e. a sleeping posture, was not correlated with the dose of glucose. This result is consistent with previous research (Asechi et al., 2008). However, leucine (r=0.373, P<0.05) in the diencephalon and histidine (r=0.456, P<0.05), ornithine (r=0.402, P<0.05), GABA (r=0.417, P<0.05) and methionine (r=0.420, P<0.05) in the telencephalon were negatively correlated with sitting motionless with the head drooped (sleeping posture). Ornithine (Suenaga et al., 2008b) and GABA (Shigemi, Tomonaga and Furuse, unpublished data) have sedative and hypnotic effects, but these changes could not explain the mechanism of the sedative effect of glucose. In the previous study under non-stress condition, i.c.v. injection of glucose did not modify any amino acid concentration in the diencephalon (Ogino et al., 2015). This fact implys that i.c.v. effects of glucose on amino acid metabolism were different with or without stressfull conditions. This is the case for the telencephalon. Ogino et al. (2015) reported that methionine, glutamate, histidine, SOP, arginine, aspartate, glutamine, glycine and β-alanine were modified by i.c.v. injection of glucose in the telencephalon under non-stressful condition. However, the changes in these amino acids were not confirmed under acute stressful conditions, and cystathionine, threonine, lysine, phenylalanine and taurine were modified by i.c.v. glucose in the present study. The relationships between glucose and amino acid metabolism should be clarified associating with stressful conditions in the future.
Plasma glucose levels were quadratically changed after injection of several doses of glucose (Fig. 1). Ono et al. (1983) showed that i. c. v. infusion of glucose could affect peripheral glucose levels, as seen in the present study. These changes in plasma glucose concentrations following the i.c.v. injection of glucose may result from changes in corticosterone, E, glucagon, or growth hormone. During an isolated stressful condition, plasma corticosterone levels of neonatal chicks increase, but i.c.v. injection of glucose can reduce these levels (Asechi et al., 2008). Furthermore, plasma corticosterone increased by isolation stress was not affected to plasma glucose levels (Yanagita et al., 2011). In the present study, brain E may not have influenced plasma glucose concentrations since E was not significantly modified in either brain regions. Thus, alteration of plasma glucose levels in the present study was likely not due to either corticosterone or E. On the other hand, insulin is the only hormone that can reduce plasma glucose levels. I.c.v. administration of glucose can induce an increase in peripheral insulin levels (Ono et al., 1983). In the present study, we did not measure plasma insulin levels, but it is likely that insulin secretion was induced by i.c.v. injection of glucose and thus decreased the plasma glucose levels. The secretion of insulin may be supported by the following facts. The large neutral amino acids (LNAAs), including L-histidine, L-isoleucine, L-leucine, L-methionine, L-phenylalanine, L-threonine, L-tryptophan, L-tyrosine, and L-valine all compete for the same transport system, which pattern in plasma are modified by the effect of insulin, and transmission through the blood-brain barrier is proportional to the magnitude of each amino acid ratio among the LNAAs. As a result, some of the LNAA such as histidine, isoleucine, leucine, methionine, tyrosine, and valine contents in the plasma were modified. Thus the ratios involving LNAA were modified including isoleucine/LNAA, leucine/LNAA, phenylalanine/LNAA, threonine/LNAA, and valine/LNAA. Valine, methionine and leucine were negatively correlated with brain glucose levels: valine (r=0.365, P<0.05); methionine (r=0.442, P<0.05); and leucine (r=0.495, P<0.005). These results affirm the possibility that i.c.v. administration of glucose induced secretion of insulin and then some LNAAs were incorporated to peripheral tissues. Furthermore, it is likely that an amino acid transported from the periphery to the brain induced the sedative effect of glucose.
Glucose levels in the telencephalon increased in the control group compared with the intact group, indicating that isolation stress enhanced brain glucose levels. On the other hand, this increase induced by isolation stress was decreased by 0.21 µmol glucose. While the mechanism is unclear, alterations in amino acids concentrations such as tyrosine, glutamine, and glutamate of the brain and valine and alanine of the plasma may be involved. Among them, L-glutamate (Yamane et al., 2009c) and L-alanine (Kurauchi et al., 2006b) synthesized via TCA cycle from glucose have sedative and hypnotic effects. In addition, L-glutamine is also produced via the same pathway although does not have the sedative and hypnotic effects (Yamane et al., 2009b). Thus, amino acids produced from TCA cycle might be important to induce the sedative effect of glucose.
Monoamines are produced from amino acids and can function as neurotransmitters. Judging from the regression analysis, the catecholamines DA, NE, and E, metabolites of L-tyrosine, and their metabolites were modified: HVA in the diencephalon and DA and DOPAC in the telencephalon. In addition, DA turnover rates were modified in both brain regions, but these modifications were caused by the decrease of DA levels. Increasing extracellular DA levels are induced by stress (Roungé-Pont et al., 1995), and stress-induced DA release in the nucleus accumbens is influenced by corticosterone (Roungé-Pont et al., 1998). According to Hamasu et al. (2009b), a 30 min handling-stress resulted in a significant increase in extracellular HVA, a DA metabolite. This implied that DA release was induced by stress and quickly metabolized to HVA. On the other hand, DA contents and DOPAC/DA in the diencephalon and telencephalon were significantly increased by restraint with isolation stress (Hamasu et al., 2012). I.c.v. glucose decreased HVA in the diencephalon and DA in the telencephalon. It is suggested that the sedation and hypnotic effects of glucose was partly induced by modification of DA metabolism in the brain.
While glucose itself is an important energy source for the brain, in the present study, we focused on the effect of glucose on amino acid and monoamine metabolism in the brain. The i.c.v. injection of glucose dose-dependently induced sedative effects under the isolation stress. The possible pathways of this effect of glucose are as follows: (1) amino acids synthesized through the TCA cycle from injected glucose, which induced the sedative and/or hypnotic effects; (2) peripheral LNAA pattern were modified by injected glucose, and amino acids transported into the brain from the periphery could lead to the sedative effect; and (3) decreased plasma corticosterone induced by injected glucose could lead to decreased brain DA levels which induce stress responses. Taken together, supplementation of glucose to the brain may help the stress response through the modification of amino acid and monoamine metabolism as well as supply of energy source. To induce the sedative effect, these changes may interact with each other. Future studies are necessary to elucidate these interactions.
Acknowledgments
A part of this project has been supported by a Grant-in-Aid for Scientific Research from the Japan Society for the Promotion of Science (No. 23248046).
Conflict of interest
The authors declare that they have no conflict of interest.
References
- Asechi M, Tomonaga S, Tachibana T, Han L, Hayamizu K, Denbow DM, Furuse M. Intracerebroventricular injection of L-serine analogs and derivatives induces sedative and hypnotic effects under an acute stressful condition in neonatal chicks. Behavioural Brain Research, 170: 71-77. 2006. [DOI] [PubMed] [Google Scholar]
- Asechi M, Kurauchi I, Tomonaga S, Yamane H, Suenaga R, Tsuneyoshi Y, Denbow DM, Furuse M. Relationships between the sedative and hypnotic effects of intracerebroventricular administration of L-serine and its metabolites, pyruvate and the derivative amino acids contents in the neonatal chicks under acute stressful conditions. Amino Acids, 34: 55-60. 2008. [DOI] [PubMed] [Google Scholar]
- Boogers I, Plugge W, Stokkermans YQ, Duchateau AL. Ultraperformance liquid chromatographic analysis of amino acids in protein hydrolysates using an automated pre-column derivatisation method. Journal of Chromatography A 1189: 406-409. 2008. [DOI] [PubMed] [Google Scholar]
- Chrousos GP. Stressors, stress, and neuroendocrine integration of the adaptive response. Annals of the New York Academy of Sciences, 851: 311-335. 1998. [DOI] [PubMed] [Google Scholar]
- Davis JL, Masuoka DT, Gerbrandt LK, Cherkin A. Autoradiographic distribution of L-proline in chicks after intracerebral injection. Physiology & Behavior, 22: 693-695. 1979. [DOI] [PubMed] [Google Scholar]
- Erwan E, Tomonaga S, Yoshida J, Nagasawa M, Ogino Y, Denbow DM, Furuse M. Central administration of L- and D-aspartate attenuates stress behaviors by social isolation and CRFin neonatal chicks. Amino Acids, 43: 1969-1976. 2012. [DOI] [PubMed] [Google Scholar]
- Feltenstein MW, Lambdin LC, Ganzera M, Ranjith H, Dharmaratne W, Nanayakkara NP, Khan IA, Sufka KJ. Anxiolytic properties of Piper methysticum extract samples and fractions in the chick social-separation-stress procedure. Phytotherapy Research, 17: 210-216. 2003. [DOI] [PubMed] [Google Scholar]
- Hamasu K, Haraguchi T, Kabuki Y, Adachi N, Tomonaga S, Sato H, Denbow DM, Furuse M. L-Proline is a sedative regulator of acute stress in the brain of neonatal chicks. Amino Acids, 37: 377-382. 2009. a. [DOI] [PubMed] [Google Scholar]
- Hamasu K, Shigemi K, Kabuki Y, Tomonaga S, Denbow DM, Furuse M. Central L-proline attenuates stress-induced dopamine and serotonin metabolism in the chick forebrain. Neuroscience Letters 460: 78-81. 2009. b. [DOI] [PubMed] [Google Scholar]
- Hamasu K, Shigemi K, Tsuneyoshi Y, Yamane H, Sato H, Denbow DM, Furuse M. Intracerebroventricular injection of L-proline and D-proline induces sedative and hypnotic effects by different mechanisms under an acute stressful condition in chicks. Amino Acids, 38: 57-64. 2010. [DOI] [PubMed] [Google Scholar]
- Hamasu K, Kabuki Y, Tomonaga S, Denbow DM, Furuse M. Changes in brain monoamine metabolism of neonatal chicks under two different acute stress conditions. British Poultry Science 53: 145-149. 2012. [DOI] [PubMed] [Google Scholar]
- Jones RB, Harvey S. Behavioural and adrenocortical response of domestic chicks to systematic reduction in group size and to sequential disturbance of companions by the experimenter. Behavioural Processes, 14: 291-303. 1987. [DOI] [PubMed] [Google Scholar]
- Kobayashi K, Pillai KS. Transformation of data and outliers. A Handbook of Applied Statistics in Pharmacology. CRC Press: Taylor & Francis Group; pp. 37-46. 2013. [Google Scholar]
- Koutoku T, Takahashi H, Tomonaga S, Oikawa D, Saito S, Tachibana T, Han L, Hayamizu K, Denbow DM, Furuse M. Central administration of phosphatidylserine attenuates isolation stress-induced behavior in chicks. Neurochemistry International, 47: 183-189. 2005. [DOI] [PubMed] [Google Scholar]
- Kurauchi I, Asechi M, Tachibana T, Han L, Hayamizu K, Denbow DM, Furuse M. Intracerebroventricular injection of tryptophan, but not lysine or methionine, induces sedative effect during an acute stressful condition in neonatal chicks. Journal of Applied Animal Research, 31: 25-28. 2006. a. [Google Scholar]
- Kurauchi I, Asechi M, Tachibana T, Han L, Hayamizu K, Denbow DM, Furuse M. Intracerebroventricular injection of L-alanine induces a sedative effect under an acute stressful condition in neonatal chicks. Journal of Poultry Science, 43: 384-387. 2006. b. [Google Scholar]
- Launay F, Mills AD, Faure JM, Williams JB. Effect of CRF on isolated Japanese quails selected for fearfulness and for society. Physiology & Behavior, 54: 111-118. 1993. [DOI] [PubMed] [Google Scholar]
- Marin RH, Freytes P, Guzman D, Jones RB. Effect of an acute stressor on fear and on the social reinstatement response of domestic chicks to cagemates and strangers. Applied Animal Behaviour Science, 71: 57-66. 2001. [DOI] [PubMed] [Google Scholar]
- Mendl M. Performing under pressure: stress and cognitive function. Applied Animal Behaviour Science, 65: 221-244. 1999. [Google Scholar]
- Ogino Y, Tomonaga S, Yoshida J, Nagasawa M, Furuse M. Central administration of glucose modifies brain amino acid metabolisms in neonatal chicks. Journal of Poultry Science, 52: 28-33. 2015. [Google Scholar]
- Ono T, Steffens AB, Sasaki K. Influence of peripheral and intracerebroventricular glucose and insulin infusions on peripheral and cerebrospinal fluid glucose and insulin levels. Physiology & Behavior, 30: 301-306 1983. [DOI] [PubMed] [Google Scholar]
- Panksepp J, Bean NJ, Bishop P, Vilberg T, Sahley TL. Opioid blockade and social comfort in chicks. Pharmacology Biochemistry and Behavior, 13: 673-683. 1980. [DOI] [PubMed] [Google Scholar]
- Panksepp J. Brain systems for the mediation of social separationdistress and social-reward. Annals of the New York Academy of Sciences, 15: 78-100. 1997. [DOI] [PubMed] [Google Scholar]
- Rougé-Pont F, Marinelli M, Moal ML, Simon H, Piazza PV. Stress-induced sensitization and glucocorticoids. II. Sensitization of the increase in extracellular dopamine induced by cocaine depends on stress-induced corticosterone secretion. Journal of Neuroscience, 15: 7189-7195. 1995. [DOI] [PMC free article] [PubMed] [Google Scholar]
- Rougé-Pont F, Deroche V, Moal ML, Piazza PV. Individual differences in stress-induced dopamine release in the nucleus accumbens are influenced by corticosterone. European Journal of Neuroscience, 10: 3903-3907. 1998. [DOI] [PubMed] [Google Scholar]
- Sahley TL, Panksepp J, Zolovick AJ. Cholinergic modulation of separation distress in the domestic chick. European Journal of Pharmacology, 72: 261-264. 1981. [DOI] [PubMed] [Google Scholar]
- Sandercock DA, Hunter RR, Nute GR, Mitchell MA, Hocking PM. Acute heat stress-induced alterations in blood acid-base status and skeletal muscle membrane integrity in broiler chickens at two ages: implications for meat quality. Poultry Science, 80: 418-425. 2001. [DOI] [PubMed] [Google Scholar]
- Suenaga R, Tomonaga S, Yamane H, Kurauchi I, Tsuneyoshi Y, Sato H, Denbow DM, Furuse M. Intracerebroventricular injection of L-arginine induces sedative and hypnotic effects under an acute stress in neonatal chicks. Amino Acids, 35: 139-146. 2008. a. [DOI] [PubMed] [Google Scholar]
- Suenaga R, Yamane H, Tomonaga S, Asechi M, Adachi N, Tsuneyoshi Y, Kurauchi I, Sato H, Denbow DM, Furuse M. Central L-arginine reduced stress responses are mediated by L-ornithine in neonatal chicks. Amino Acids, 35: 107-113. 2008. b. [DOI] [PubMed] [Google Scholar]
- Tomonaga S, Tachibana T, Takagi T, Saito ES, Zhang R, Denbow DM, Furuse M. Effect of central administration of carnosine and its constituents on behaviors in chicks. Brain Research Bulletin, 63: 75-82. 2004. [DOI] [PubMed] [Google Scholar]
- Tomonaga S, Yamane H, Onitsuka E, Yamada S, Sato M, Takahata Y, Morimatsu F, Furuse M. Carnosine-induced antidepressant-like activity in rats. Pharmacology Biochemistry and Behavior, 89: 627-632. 2008. [DOI] [PubMed] [Google Scholar]
- van Luijtelaar EL, van der Grinten CP, Blokhuis HJ, Coenen AM. Sleep in the domestic hen (Gallus domesticus). Physiology & Behavior, 41: 409-414. 1987. [DOI] [PubMed] [Google Scholar]
- Yamane H, Asechi M, Tsuneyoshi Y, Denbow DM, Furuse M. Central L-cysteine induces sleep, and D-cysteinr induces sleep and abnormal behavior during acute stress in neonatal chicks. Animal Science Journal, 80: 428-432. 2009. a. [DOI] [PubMed] [Google Scholar]
- Yamane H, Asechi M, Tsuneyoshi Y, Kurauchi I, Denbow DM, Furuse M. Intracerebroventricular injection of L-aspartic acid and L-asparagine induces sedative effects under an acute stressful condition in neonatal chicks. Animal Science Journal, 80: 286-290. 2009. b. [DOI] [PubMed] [Google Scholar]
- Yamane H, Tsuneyoshi Y, Denbow DM, Furuse M. N-Methyl-D-aspartate and alpha-amino-3-hydroxy-5-methyl-4-isoxazolepropionate receptors involved in the induction of sedative effects under an acute stress in neonatal chicks. Amino Acids, 37: 733-739. 2009. c. [DOI] [PubMed] [Google Scholar]
- Yanagita K, Shiraishi J, Kawakami S, Bungo T. Time course changes in the blood parameters and the expression of diencephalic CRH and AVT mRNA due to acute isolation stress in chicks. Journal of Poultry Science, 48: 125-129. 2011. [Google Scholar]
- Zhang R, Tachibana T, Takagi T, Koutoku T, Denbow DM, Furuse M. Centrally administrated norepinephrine modifies the behavior induced by corticotropin-releasing factor in neonatal chicks. Journal of Neuroscience Research, 74: 630-636. 2003. [DOI] [PubMed] [Google Scholar]
- Zhang R, Tachibana T, Takagi T, Koutoku T, Denbow DM, Furuse M. Serotonin modifies corticotropin-releasing factor-induced behaviors in chicks. Behavioural Brain Research, 151: 47-52. 2004. [DOI] [PubMed] [Google Scholar]