

Abstract
Aims/Introduction
Type 2 diabetes mellitus is the leading cause of kidney failure worldwide, but few effective long‐term treatments are available.
Methods
This was an investigator‐initiated multicenter prospective intervention study in which ipragliflozin (50 mg) was administered once daily, and glycemic control, estimated glomerular filtration rate (eGFR) and adverse events were evaluated until 104 weeks after starting research.
Results
There were 407 patients analyzed. In the eGFR ≥90 group and eGFR ≥60 to <90 group, eGFR had significantly decreased compared with baseline at all time points from 4 to 104 weeks. There were significant increases in the eGFR ≥45 to <60 groups compared with baseline at 36 weeks (2.3 ± 1.0) and 52 weeks (2.6 ± 1.2). Comparison between the eGFR <60, urine albumin‐to‐creatinine ratio >300 group and the eGFR <60, urine albumin‐to‐creatinine ratio <300 group showed a greater reduction in eGFR in the former (−5.4 ± 2.4 vs 3.3 ± 1.1) at 12 weeks and was maintained to 104 weeks. In any group, eGFR did not significantly decrease until 104 weeks compared with 4 weeks. The urine albumin‐to‐creatinine ratio after 52 weeks and after 104 weeks was significantly decreased compared with baseline in the eGFR ≥90 group.
Conclusions
Ipragliflozin lowers eGFR and corrects hyperfiltration in patients with high eGFR (eGFR ≥60). In patients with low eGFR (eGFR ≥30 to <60), ipragliflozin has the possibility of increasing eGFR and exerting a renoprotective effect.
Keywords: Diabetic nephropathy, Ipragliflozin, Sodium–glucose cotransporter 2 inhibitor
In the estimated glomerular filtration rate (eGFR) ≥90 group and eGFR ≥60 to <90 group, eGFR had significantly decreased compared with baseline at all time points from 4 to 104 weeks. There were significant increases in the eGFR ≥45 to <60 groups compared with baseline at 36 weeks (2.3 ± 1.0) and 52 weeks (2.6 ± 1.2). In each group, there was no significant change compared with 12 weeks at all time points between 24 and 104 weeks.
Introduction
The challenge in Japan is to prevent the introduction of dialysis as a result of the deterioration of diabetic nephropathy. The total number of chronic dialysis patients in Japan at the end of 2017 was 334,505, an increase of 4,896 from the previous year 1 . Diabetic nephropathy is the most common underlying disease in dialysis patients. In October 2017, the Japan Diabetes Society and the Japanese Society of Nephrology jointly adopted the STOP‐DKD Declaration 2 in an aggressive drive to combat diabetic kidney disease (DKD). Sodium–glucose cotransporter 2 (SGLT2) inhibitors have the potential to conquer this challenge. SGLT2 is responsible for most of the reabsorption of glucose filtered by the kidney. Pharmacological inhibition of SGLT2 alleviates hyperglycemia by lowering the renal glucose threshold, thereby increasing excretion of urinary glucose 3 . In addition to reducing bodyweight and blood pressure, and improving lipid profiles 4 , 5 , 6 , it has also been reported to have a renoprotective effect 7 , 8 , 9 , 10 , 11 , 12 , 13 , 14 .
As mentioned in the EMPA‐REG OUTCOME study 12 and the CANVAS Program 13 , the renoprotective effect of SGLT2 inhibitors has been reported in various forms, but stratified analysis has not yet been carried out in long‐term studies of ipragliflozin administration. We proactively collected information on the efficacy and safety of ipragliflozin for almost 2 years, up to 104 weeks 15 , 16 , 17 , 18 , 19 . Here, we have used these data to examine the effect of ipragliflozin on the kidney, from the viewpoints of stratified analysis based on the estimated glomerular filtration rate (eGFR) at the start of administration of ipragliflozin, and the presence or absence of combined use with other drugs, such as angiotensin II receptor blocker (ARB), angiotensin‐converting enzyme inhibitors or diuretics.
Methods
Study design
This was an investigator‐driven, prospective, multicenter study evaluating the efficacy and safety of ipragliflozin as monotherapy or combination therapy in outpatients with type 2 diabetes mellitus. The present study was carried out in accordance with the study protocol, the Declaration of Helsinki and “Ethical Guidelines for Clinical Studies” by the Health, Labor and Welfare Ministry. The study was commenced at 33 centers in Kanagawa Prefecture, Japan, in June 2014, with patient registration by electronic data capture being continued until 31 August 2017. All patients provided written informed consent to enrollment in this study.
Participants
The participants were Japanese patients with type 2 diabetes mellitus who were aged >20 years at the time of giving informed consent and with glycated hemoglobin (HbA1c) ≥6.0 (National Glycohemoglobin Standardization Program value) despite treatment for at least 12 weeks (diet alone, diet and exercise or diet and exercise plus antidiabetic drug therapy).
Exclusion criteria were as follows: (i) a history of hypersensitivity to ipragliflozin; (ii) a history of severe ketotic diabetic coma within the past 6 months; (iii) severe infection, preoperative/postoperative state or severe trauma; and (iv) severe renal impairment. Patients who switched medications at baseline were excluded from this analysis.
Treatment
Patients received oral ipragliflozin (50 mg once a day before or after breakfast) for 104 weeks. Concomitant use of other SGLT2 inhibitors was not permitted. In addition, treatment with diet, exercise or specified health foods could not be started, discontinued or modified during the study period. If possible, there were also no commencement, discontinuation or dosage changes of medications for underlying diseases, such as antiplatelet agents, antihypertensive drugs and lipid‐lowering agents.
Evaluation
In this subgroup analysis, we evaluated the relationship between ipragliflozin and renal function from the following points.
Patient backgrounds classified into four groups (eGFR ≥30 to <45, ≥45 to <60, ≥60 to <90 and ≥90 mL/min/1.73 m2) according to eGFR baseline values. Cases with no baseline eGFR were excluded.
Change from baseline in eGFR at 4, 12, 24, 36, 52, 78 and 104 weeks, and change from 4 weeks in eGFR at 12 weeks, and change from 12 weeks in eGFR at 104 weeks in the groups in point 1. The same status change in groups divided into quartiles by the baseline value of eGFR. The same status changes excluding the addition of antidiabetic drugs in the groups in point 1. The same status changes excluding the patients using diuretics medications at baseline in the groups in point 1.
Change from baseline in HbA1c, systolic blood pressure (SBP), diastolic blood pressure and BMI at 4, 12, 24, 36, 52, 78 and 104 weeks, and change from baseline in urine albumin‐to‐creatinine ratio (UACR) at 52 and 104 weeks in the groups in point 1.
Annual change rate of eGFR in the groups in point 1 from baseline to 4 weeks and from 4 to 104 weeks. The same status change in groups divided into quartiles by the baseline value of eGFR.
Change from baseline in eGFR at 4, 12, 24, 36, 52, 78 and 104 weeks in UACR ≥300 and UACR <300 patients within the eGFR <60 group.
Multiple regression analysis of factors affecting the annual change rate of eGFR based on the population of point 4. We also analyzed the annual change rate of eGFR from baseline to 104 weeks only for those with data after week 8. SBP, BMI, eGFR, HbA1c, taking renoprotective drugs (ARB, angiotensin‐converting enzyme inhibitor and diuretics), age, duration of disease and sex were used as explanatory variables.
The incidence of adverse drug reactions in groups in point 1.
When two or more points of data were absent, including baseline data, the test values for these cases are excluded from analysis.
Statistical analysis
The data were analyzed using R version 3.5.2 (R Foundation for Statistical Computing, Vienna, Austria, https://www.R‐project.org/). Variation within groups was examined by a paired t‐test or Wilcoxon signed‐rank test. anova or the 2‐test was used to compare patient backgrounds between groups, the Student’s t‐test was used to compare test values between groups and the Tukey Kramer test or Steel–Dwass test was used to compare test values among multiple groups. A multiple regression analysis was carried out by the stepwise method using the Akaike information criterion as a sensitivity analysis. Missing values were supplemented by last observation carried forward, except for UACR and the annual change rate of eGFR.
The significance level was 5% on either side. Demographic characteristics are presented as the mean ± standard deviation or the number of cases (%), and the observed values are presented as the mean ± standard error or median (first quartile, third quartile) for continuous variables. Multiplicity was not considered for changes in test values within groups.
Preferred Terms from the Medical Dictionary for Regulatory Activities, Japanese version 18.0 (Japanese Maintenance Organization, Tokyo, Japan) were used for coding adverse reactions, and System Organ Class terms were also used.
Ethics approval and consent to participate
All procedures followed were in accordance with the ethical standards of the responsible committee on human experimentation (institutional and national), and with the Helsinki Declaration of 1964 and later versions. We obtained approval of the study protocol and informed consent form from the institutional review board of Meiwa Hospital (Dojin Kinen Kai Healthcare Corporation) on 17 June 2014 before the start of the study.
Results
Of the 458 registered patients, seven were excluded because of suspect data, and six were excluded because of the absence of baseline eGFR and 38 were excluded because of switching medications at baseline, leaving 407 patients subject to safety evaluation. The breakdown by eGFR was as follows ≥90: 141 patients, ≥60 to <90: 210 patients, ≥45 to <60: 41 patients and ≥30 to <45: 15 patients (Table 1).
-
The transition and amount of change of eGFR based on the eGFR at the starting point is shown in Figures 1 and S1. eGFR had significantly decreased compared with baseline at all time points between 4 and 104 weeks in the eGFR ≥90 group and eGFR ≥60 to <90 group. In the eGFR ≥45 <60 group, the eGFR at 36 and 52 weeks was significantly higher than baseline. There was no significant change in the eGFR ≥30 to <40 group. In addition, the amount of change in eGFR at each time point in the eGFR ≥90 group was significantly different (larger reductions) compared with the eGFR ≥60 to <90 and the eGFR ≥45 to <60 groups. In the eGFR ≥45 to <60 group and the eGFR ≥60 to <90 group, a significant increase in eGFR was observed from 4 to 12 weeks. In each group, there was no significant change compared with 12 weeks at all time points between 24 and 104 weeks.
In the pattern divided into quartiles by the baseline value of eGFR, the top one‐quarter group showed a significant decrease compared with the baseline at all time points between 4 and 104 weeks (Figures S2,S3). However, in the lowest one‐quarter group, no significant change was observed. In the lower two groups, a significant increase in the eGFR at 12 weeks was observed compared with 4 weeks. In each group, there was no significant change compared with 12 weeks at all time points between 24 and 104 weeks. In the analysis excluding additional cases of antidiabetic drugs, the tendency was almost the same as the result in cases where the relevant cases were not excluded (Figure S4). The results were similar when excluding diuretic use cases, too (data not shown).
Variations in other test values are shown in Figure 2. A significant increase in diastolic blood pressure at 24 weeks was observed in the eGFR ≥30 to <45 group (Figure 2b), but most of the other indicators in each group showed significant improvements. A significant decrease in UACR was seen only in the eGFR ≥90 group (Figure 2d). The only differences in the amount of change between the groups were in diastolic blood pressure at 24 weeks and in HbA1c.
Significant differences were observed in the annual change rate of eGFR between 0–4 weeks and 4–104 weeks in the eGFR ≥90 group and the eGFR ≥60 to <90 group (Figure 3a). In the pattern divided into quartiles by the baseline value of eGFR, significant differences were observed in the annual change rate of eGFR between 0 and 4 weeks and 4 and 104 weeks in every group, except for the lowest group (Figure 3b).
Comparison of patients in the UACR ≥300 and UACR <300 groups in the eGFR <60 group showed a significant decrease in eGFR in the UACR ≥300 group, and a significant increase in the UACR <300 group. A significant difference in changes was observed between the two groups (Figure 4).
With regard to factors that affect the annual rate of change of eGFR from baseline to 4 weeks, a high eGFR value at the starting point and advanced age were significant factors in the decrease in eGFR (Table S1). However, there was no significant factor that affects the annual rate of change of eGFR from 4 to 104 weeks. With regard to factors that affect the annual rate of change of eGFR from baseline to 104 weeks, a high SBP value, a high eGFR value, advanced age and being female were significant factors in the decrease in eGFR.
With regard to the incidence of adverse reactions, only cystitis occurred at a significantly higher incidence in the eGFR ≥30 to <45 group. No differences among the groups were observed with regard to other adverse events (Table S2).
Table 1.
Patient backgrounds
| eGFR ≥90 (n = 141) | eGFR ≥60 to <90 (n = 210) | eGFR ≥45 to <60 (n = 41) | eGFR ≥30 to <45 (n = 15) | P | |
|---|---|---|---|---|---|
| Age (years) | 49.4 ± 11.5 | 57.2 ± 10.1 | 65.6 ± 10.9 | 66.9 ± 6.5 | <0.001* |
| Male/female | 78 (55.3%)/63 (44.7%) | 107 (51%)/103 (49%) | 22 (53.7%)/19 (46.3%) | 6 (40%)/9 (60%) | 0.658 |
| Duration of disease (years) | 7.5 ± 6.2 | 11.1 ± 8.0 | 11.9 ± 8.6 | 15.7 ± 8.9 | <0.001* |
| Drinker | 59 (41.8%) | 75 (35.7%) | 18 (43.9%) | 4 (26.7%) | 0.432 |
| Smoker | 55 (39%) | 61 (29%) | 8 (19.5%) | 6 (40%) | 0.060 |
| Diabetic retinopathy | 14 (9.9%) | 29 (13.8%) | 7 (17.1%) | 5 (33.3%) | 0.070 |
| Cataract | 12 (8.5%) | 41 (19.5%) | 9 (22%) | 6 (40%) | 0.002* |
| Diabetic neuropathy | 7 (5%) | 32 (15.2%) | 3 (7.3%) | 7 (46.7%) | <0.001* |
| Diabetic nephropathy | 33 (23.4%) | 57 (27.1%) | 15 (36.6%) | 12 (80%) | <0.001* |
| High blood pressure | 67 (47.5%) | 126 (60%) | 30 (73.2%) | 11 (73.3%) | 0.008* |
| Dyslipidemia | 85 (60.3%) | 139 (66.2%) | 27 (65.9%) | 11 (73.3%) | 0.595 |
| Fatty liver | 61 (43.3%) | 114 (54.3%) | 16 (39%) | 6 (40%) | 0.099 |
| Concomitant medication | |||||
| Sulfonylurea | 37 (26.2%) | 70 (33.3%) | 14 (34.1%) | 5 (33.3%) | 0.521 |
| Biguanide | 82 (58.2%) | 129 (61.4%) | 22 (53.7%) | 9 (60%) | 0.799 |
| Thiazolidine | 21 (14.9%) | 32 (15.2%) | 11 (26.8%) | 4 (26.7%) | 0.191 |
| DPP‐4 inhibitors | 90 (63.8%) | 129 (61.4%) | 34 (82.9%) | 12 (80%) | 0.036* |
| GLP‐1 agonists | 3 (2.1%) | 3 (1.4%) | 0 (0%) | 0 (0%) | 0.740 |
| α‐Glucosidase inhibitors | 7 (5%) | 27 (12.9%) | 4 (9.8%) | 4 (26.7%) | 0.017* |
| Glinides | 7 (5%) | 13 (6.2%) | 3 (7.3%) | 2 (13.3%) | 0.618 |
| Insulin preparation | 38 (27%) | 58 (27.6%) | 13 (31.7%) | 9 (60%) | 0.054 |
| ARB | 42 (29.8%) | 91 (43.3%) | 21 (51.2%) | 7 (46.7%) | 0.023* |
| ACE inhibitors | 1 (0.7%) | 4 (1.9%) | 0 (0%) | 2 (13.3%) | 0.004* |
| Diuretic | 2 (1.4%) | 13 (6.2%) | 4 (9.8%) | 2 (13.3%) | 0.040* |
Data are the mean ± standard deviation or n (%).
P < 0.05 (analysis of variance or χ2‐test). ACE, angiotensin‐converting enzyme; ARB, angiotensin receptor blocker; DPP‐4, dipeptidyl peptidase‐4; eGFR, estimated glomerular filtration rate; GLP‐1, glucagon‐like peptide‐1.
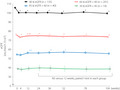
Figure 1.
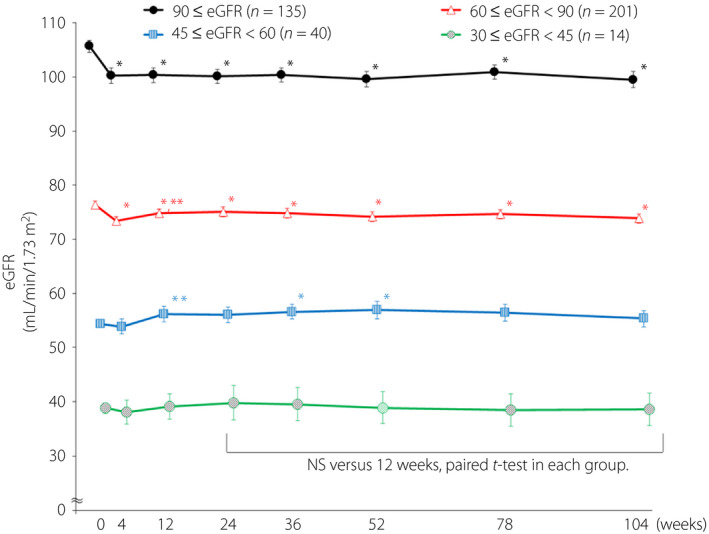
Changes in estimated glomerular filtration rate (eGFR) by starting point values. Data are mean ± standard error. *P < 0.05 (vs 0 week, paired t‐test). **P < 0.05 (vs 4 weeks, paired t‐test). NS, not significant.
Figure 2.
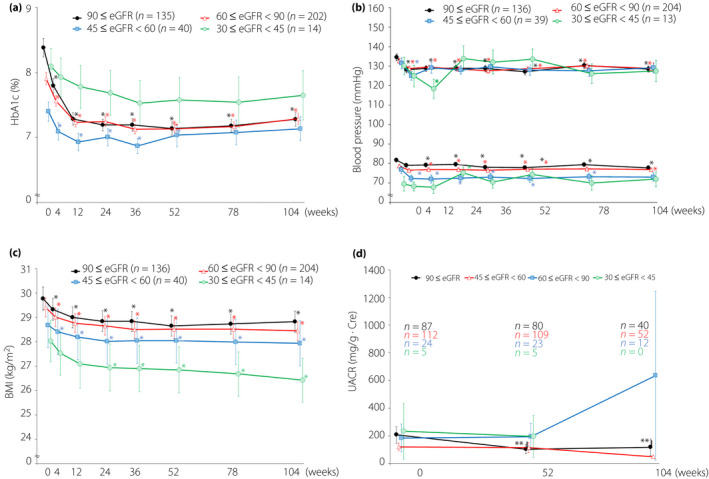
Changes in glycated hemoglobin (HbA1c), systolic blood pressure, diastolic blood pressure, body mass index (BMI), urine albumin‐to‐creatinine ratio (UACR) by starting point values. Data are mean ± standard error. eGFR, estimated glomerular filtration rate. *P < 0.05 (vs 0 week, paired t‐test). **P < 0.05 (vs 0 week, Wilcoxon signed‐rank test).
Figure 3.
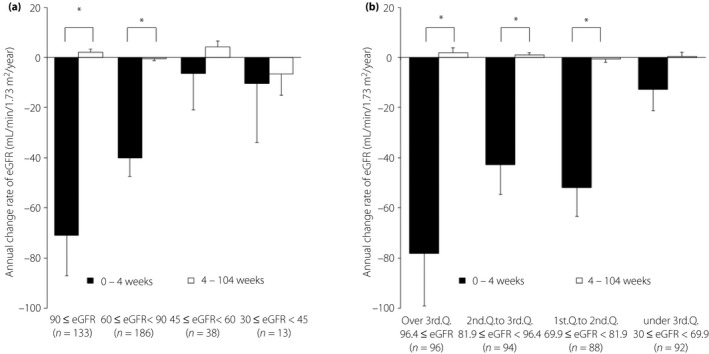
Annual change rate of estimated glomerular filtration rate (eGFR). Data are mean ± standard error. *P < 0.05 (paired t‐test). W, week.
Figure 4.
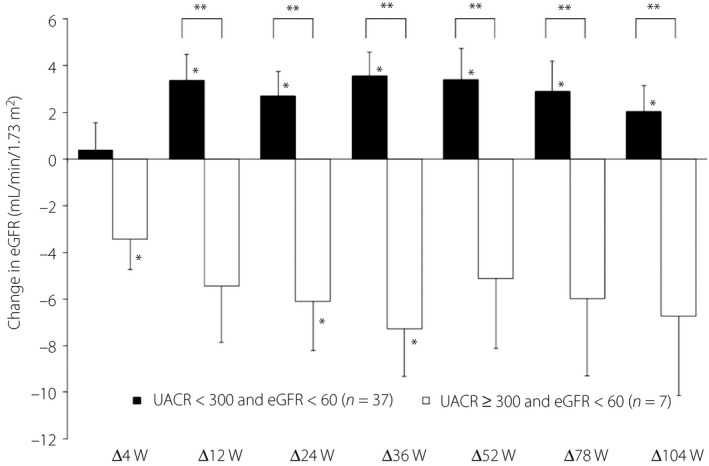
Amount of change in estimated glomerular filtration rate (eGFR) by starting point. Data are mean ± standard error. *P < 0.05 (vs 0 week, paired t‐test). **P < 0.05 (Student’s t‐test). UACR, urine albumin‐to‐creatinine ratio; W, week.
Discussion
In the present study, a significant decrease in eGFR was observed in the eGFR ≥90 group and the eGFR ≥60 to <90 group, but no significant decreases were observed in the eGFR <60 groups. With regard to stratified analysis of eGFR at the starting point, similar reports have been made up to 6 months 7 , 8 , and a similar trend was seen in long‐term administration that lasted approximately 2 years. There were 184 patients who added on antidiabetic drugs, but in the analysis excluding additional cases of them, the tendency was almost the same. These results show that ipragliflozin is a renoprotective drug even when administered long‐term.
In addition, there was no significant change compared with 12 weeks at all time points between 24 and 104 weeks. Significant differences were observed in the annual change rate of eGFR between 0 and 4 weeks and 4 and 104 weeks in the eGFR ≥90 group and the eGFR ≥60 to <90 group. Even if eGFR decreases significantly at the beginning of administration, it does not continue to decrease at the same speed thereafter, and can be used safely. According to a report on stratified analysis of eGFR with long‐term administration of dapagliflozin 14 , there is a drop of about 4, particularly in the first 6 months in the eGFR ≥ 90 and eGFR ≥60 to <90 groups, followed by a more gradual decrease. In the same study, eGFR increased minimally in the eGFR <60 group up to 2 years after the start of administration, then turned to a decline thereafter. In our study, eGFR had already decreased significantly by week 4 of administration in the eGFR ≥90 (−5.4 ± 1.2) and eGFR ≥60 to <90 groups (−3.0 ± 0.6). Subsequently, eGFR remained constant. The present study lasted 2 years and the results up to this point are similar, indicating that even if the SGLT2 inhibitor is a different type, it might show similar variations in test values. In contrast, Kurose et al. 20 reported that stratification analysis by eGFR was carried out in a post‐marketing survey of luseogliflozin, but no significant change in eGFR was observed in any of the groups. It is unknown why there was no significant change. However, post‐marketing surveillance of SGLT2 inhibitors in Japanese older adults, such as STELLA‐ELDER, J‐STEP/EL‐STUDY, was similar to the present results 21 , 22 . They did not do stratified analysis by eGFR. However, in a population with an eGFR of approximately 70 at the baseline, eGFR declined after 1 month and then leveled off after rebounding. Our results are reasonable for this point.
Some patient groups must be carefully monitored. In our analysis of the eGFR <60 patient group, we compared changes in eGFR at UACR ≥300 and UACR <300, and found a significant difference in the changes between the two groups. The UACR ≥300 group showed a significant decrease in eGFR, whereas the UACR <300 group showed a significant increase. Yamanouchi et al. 23 reported that patients with non‐proteinuric DKD had a lower risk of CKD progression and all‐cause mortality than patients with proteinuric DKD . The present results here were similar, and proteinuric DKD patients required careful observation. However, even in the case of eGFR <60, eGFR significantly increased in UACR <300, and in stratified analysis based on eGFR at the starting point, a significant decrease in UACR was observed in the eGFR ≥90 group. Even with eGFR ≥60 to <90, there was a decreasing trend in UACR, although it was not significant. This suggests a renoprotective action.
We analyzed factors that affect the annual rate of change of eGFR in three patterns at different periods. As a result, high eGFR and advanced age at the start were significant factors in eGFR reduction from baseline to 4 weeks. With regard to factors that affect the annual rate of change of eGFR from baseline to 104 weeks, a high SBP value, a high eGFR value, advanced age and being female were significant factors in the decrease in eGFR. In a meta‐analysis, Wang et al. 11 reported that although the eGFR preservation effect of SGLT2 inhibitors was not significantly related to basic patient characteristics (age, BMI, HbA1c, eGFR level), it was affected by drug administration (treatment period, SGLT2 inhibitor type, SGLT2 dose). As the Wang et al. 11 report was a meta‐analysis, detailed patient backgrounds are unknown, so comparisons cannot be made. However, it was clear that age and eGFR at initiation of administration in Japanese patients were major influences in both the short term and long term. Sex and SBP were also involved in long‐term changes in eGFR. Regarding sex differences, we thought that the sex difference in the eGFR formula is affected. For SBP, Imai et al. 24 reported that the higher the SBP, the lower the eGFR is likely to be, and Bakris et al. 25 reported that proper control of blood pressure and preventing high blood pressure leads to a slower GFR reduction rate. There is no significant factor for the change from 4 to 104 weeks. However, we should be aware of the above variables. The concomitant use of renoprotective drugs, such as ARB, angiotensin‐converting enzyme inhibitors or diuretics, showing no influence was also a new finding.
Excessive infiltration of glucose into tubular epithelial cells through SGLT2 has been shown to induce expression of inflammatory and fibrotic markers 26 . The vicious cycle of SGLT2 upregulation, and increases in blood glucose and body fluid volume might worsen the pathophysiology of diabetic nephropathy in a synergistic manner and contribute to the progression of renal dysfunction. SGLT2 inhibitors are thought to exert renoprotective effects by inhibiting this. Mouse experiments suggest that ipragliflozin acts directly on tubular cells by inhibiting SGLT2, and might protect renal tubular cells from renal damage as a result of metabolic disorders, regardless of improvements in blood glucose level or weight loss 27 . This blood glucose‐independent renoprotective effect has also been reported for luseogliflozin 28 . Kidokoro et al. 29 also reported that empagliflozin increased urinary adenosine excretion and reduced hyperfiltration through afferent arteriolar constriction, effects that were abolished by A1 adenosine receptor blockade in mice. In addition, ipragliflozin has been reported to suppress renal and glomerular hypertrophy, and reduce nicotinamide adenine dinucleotide phosphate oxidase 4 expression and subsequent oxidative stress in mice 30 . The fact that eGFR levels were maintained without decreasing in the eGFR <60 group in the present study suggests that this renoprotective effect confirmed in animal experiments might also occur in humans. As hyperfiltration as a result of hyperglycemia occurs in the eGFR ≥90 group, it is considered that the condition has been corrected from an unfavorable state to a normal state. It is thought that hyperfiltration of the glomeruli is resolved through the macula densa by promotion of sodium reabsorption in the tubules due to the SGLT2 inhibitory action. This point is also supported by the fact that a significant negative correlation was observed in eGFR values at the starting point and the amount of change in eGFR at all time points.
With regard to the amount of change in HbA1c, it had significantly decreased in the eGF ≥90 group compared with the eGFR ≥60 to <90 and eGFR ≥45 to <60 groups. The fact that the value at the starting point (8.38 ± 1.64) was significantly higher in the eGFR ≥90 group compared with the eGFR ≥60 to <90 (7.91 ± 1.33) and eGFR ≥45 to <60 (7.40 ± 0.95) groups is a factor. Although there was a difference in the amount of change, there were no significant differences in the measured values between groups, and as tests within the group also showed a significant decrease at most time points, eGFR at the starting point is not believed to have an effect. This point has been reported in studies of tofogliflozin 31 , and has been reproduced here in this study of ipragliflozin. Stratification analysis of eGFR at the starting point in patients treated with canagliflozin showed HbA1c decreases were larger in groups with high eGFR at the starting point, but HbA1c levels at the starting point were almost the same at 8.2–8.3 32 . This result was obtained because of the difference in baseline values in this examination, and it also shows that there was no excessive reduction in blood glucose. Kashiwagi et al. 33 reported that ipragliflozin significantly reduced HbA1c in patients with mild renal dysfunction, but no significant improvement was seen in patients with moderate renal dysfunction when compared with placebo. The Kashiwagi et al. 33 study suggests that the low level of HbA1c (7.55 ± 0.526) at the starting point was a factor. In the present study, HbA1c at the starting point in the eGFR ≥45 to <60 group was 7.40 ± 0.95, which was lower than that reported by Kashiwagi et al. However, the small number of cases in the placebo group of the placebo‐controlled studyby Kashiwagi et al. might also be a factor. As the present study had no control group, comparisons with other agents cannot be made. However, we believe that results obtained from actual clinical practice are significant, as this differs from the strictly controlled special environment of clinical trials.
With the exception of the eGFR ≥30 to <45 group, which had a small number of participants, significant reductions in blood pressure and BMI were observed, but there were almost no differences in the amount of change between groups. These results are similar to the canagliflozin report 32 , and have been reproduced in the case of ipragliflozin.
Yokote et al. 22 reported no new safety concerns in a 1‐year post‐marketing study of 8,505 participants. The same applies to the present 2‐year study. The incidence of hypoglycemia in this study was 0.49% overall. In a large‐scale survey of other SGLT2 inhibitors in Japanese participants, the incidence of hypoglycemia was 0.32–1.07% 20 , 22 , 34 , and we believe that this incidence is reasonable. However, as reported previously, although serious hypoglycemia was not observed during the course of the study, serious adverse events of ketosis and dehydration were observed. Medication was continued in all patients, even on sick days, and we considered it crucial that thorough guidance be given to promptly withdraw medication on sick days. Although the frequency of cystitis was high in the eGFR ≥30 to <45 group, in this stratified analysis of eGFR, all patients who developed cystitis as an adverse reaction were women, and the proportion of women in the same group was high, which is thought to be a factor. The difference is not believed to be due to eGFR.
There were several limitations to the present study. One was that we could not set a control group because of a 2‐year long‐term observational study in the real world. For this reason, we discussed the difference from the previous report 14 . Another limitation was exploratory analysis, as the sample size was not based on eGFR fluctuations.
In conclusion, ipragliflozin reduced eGFR and corrected hyperfiltration in patients with high eGFR. This fact suggested the possibility of increasing eGFR in patients with low eGFR and exerting a renoprotective effect. Ipragliflozin did not decrease the eGFR until 104 weeks compared with 4 weeks. Ipragliflozin is a drug that can be used safely for a long time. The renoprotective effect of ipragliflozin is not affected by renoprotective drugs, such as ARB, and only the eGFR value at the starting point and age were factors in the change. Although differences in changes of HbA1c arose depending on the baseline value, no differences as a result of eGFR at the starting point arose in changes to blood pressure or BMI.
Disclosure
This research was planned by the Study Group of the Diabetes Committee of Kanagawa Physicians Association and was financially supported by Astellas Pharma Inc. The company was not involved in the study design, patient enrollment, data aggregation and analysis, data interpretation or preparation of this report. However, the sponsor had no role in study design; collection, analysis and interpretation of data; writing of the manuscript; and the decision to submit the manuscript for publication. IM has received research grant support from Astellas Pharma Inc. The other authors declare no conflict of interest.
Supporting information
Figure S1 | Amount of change in estimated glomerular filtration rate.
Figure S2 | Changes in estimated glomerular filtration rate (groups divided into quartiles by the baseline value of estimated glomerular filtration rate). Data are mean ± standard error.
Figure S3 | Amount of change in estimated glomerular filtration rate (groups divided into quartiles by the baseline value of estimated glomerular filtration rate).
Figure S4 | Changes in estimated glomerular filtration rate (excluding the addition of antidiabetic drugs).
Table S1 | Analysis of factors affecting annual change rate of estimated glomerular filtration rate.
Table S2 | Adverse reactions.
Acknowledgments
This study is a prospective study of the Kanagawa Physicians Association that is currently in progress. We thank the physicians and staff of the Kanagawa Physicians Association involved in the research, and the patients participating in this study.
J Diabetes Investig 2020; 11: 1248–1257
Clinical Trial Registry UMIN Clinical Trials Registry UMIN000014425
References
- 1. The Japanese Society for Dialysis Therapy . Current status of dialysis therapy, 2017. Available from https://docs.jsdt.or.jp/overview/ (Japanese) Accessed August 1, 2019. 10.4009/jsdt.51.699. [DOI]
- 2. Japanese Society of Nephrology and The Japan Diabetes Society . Strategic action Plan for Diabetic Kidney Disease. Available from https://cdn.jsn.or.jp/data/STOP‐DKD.pdf (Japanese) Accessed August 1, 2019.
- 3. Scheen AJ. Pharmacodynamics, efficacy and safety of sodium‐glucose co‐transporter type 2 (SGLT2) inhibitors for the treatment of type 2 diabetes mellitus. Drugs 2015; 75: 33–59. [DOI] [PubMed] [Google Scholar]
- 4. Kashiwagi A, Kazuta K, Yoshida S, et al Randomized, placebo‐controlled, double‐blind glycemic control trial of novel sodium‐dependent glucose cotransporter 2 inhibitor ipragliflozin in Japanese patients with type 2 diabetes mellitus. J Diabetes Investig 2014; 5: 382–391. [DOI] [PMC free article] [PubMed] [Google Scholar]
- 5. Nishimura R, Tanaka Y, Koiwai K, et al Effect of empagliflozin monotherapy on postprandial glucose and 24‐hour glucose variability in Japanese patients with type 2 diabetes mellitus: a randomized, double‐blind, placebo‐controlled, 4‐week study. Cardiovasc Diabetol 2015; 14: 11. [DOI] [PMC free article] [PubMed] [Google Scholar]
- 6. Kaku K, Watada H, Iwamoto Y, et al Efficacy and safety of monotherapy with the novel sodium/glucose cotransporter‐2 inhibitor tofogliflozin in Japanese patients with type 2 diabetes mellitus: a combined Phase 2 and 3 randomized, placebo‐controlled, double‐blind, parallel‐group comparative study. Cardiovasc Diabetol 2014; 13: 65. [DOI] [PMC free article] [PubMed] [Google Scholar]
- 7. Tosaki T, Kamiya H, Himeno T, et al Sodium‐glucose co‐transporter 2 inhibitors reduce the abdominal visceral fat area and may influence the renal function in patients with type 2 diabetes. Intern Med 2017; 56: 597–604. [DOI] [PMC free article] [PubMed] [Google Scholar]
- 8. Ito D, Ikuma‐Suwa E, Inoue K, et al Effects of ipragliflozin on diabetic nephropathy and blood pressure in patients with type 2 diabetes: an open‐label study. J Clin Med Res 2017; 9: 154–162. [DOI] [PMC free article] [PubMed] [Google Scholar]
- 9. Perkovic V, Jardine MJ, Neal B, et al Canagliflozin and renal outcomes in type 2 diabetes and nephropathy. N Engl J Med 2019; 380: 2295–2306. [DOI] [PubMed] [Google Scholar]
- 10. Sugiyama S, Jinnouchi H, Yoshida A, et al Renoprotective effects of additional SGLT2 inhibitor therapy in patients with type 2 diabetes mellitus and chronic kidney disease stages 3b–4: a real world report from a Japanese Specialized Diabetes Care Center. J Clin Med Res 2019; 11: 267–274. [DOI] [PMC free article] [PubMed] [Google Scholar]
- 11. Wang C, Zhou Y, Kong Z, et al The renoprotective effects of sodium‐glucose cotransporter 2 inhibitors versus placebo in patients with type 2 diabetes with or without prevalent kidney disease: a systematic review and meta‐analysis. Diabetes Obes Metab 2019; 21: 1018–1026. [DOI] [PubMed] [Google Scholar]
- 12. Wanner C, Inzucchi SE, Lachin JM, et al Empagliflozin and progression of kidney disease in type 2 diabetes. N Engl J Med 2016; 375: 323–34. [DOI] [PubMed] [Google Scholar]
- 13. Neal B, Perkovic V, Mahaffey KW, et al Canagliflozin and cardiovascular and renal events in type 2 diabetes. N Engl J Med 2017; 377: 644–657. [DOI] [PubMed] [Google Scholar]
- 14. Mosenzon O, Wiviott SD, Cahn A, et al Effects of dapagliflozin on development and progression of kidney disease in patients with type 2 diabetes: an analysis from the DECLARE‐TIMI 58 randomised trial. Lancet Diabetes Endocrinol 2019; 8: 606–617. [DOI] [PubMed] [Google Scholar]
- 15. Iizuka T, Iemitsu K, Takihata M, et al Efficacy and safety of ipragliflozin in Japanese patients with type 2 diabetes: interim outcome of the ASSIGN‐K study. J Clin Med Res 2016; 8: 116–125. [DOI] [PMC free article] [PubMed] [Google Scholar]
- 16. Iemitsu K, Iizuka T, Takihata M, et al Factors influencing changes in hemoglobin A1c and body weight during treatment of type 2 diabetes with ipragliflozin: interim analysis of the ASSIGN‐K study. J Clin Med Res 2016; 8: 373–378. [DOI] [PMC free article] [PubMed] [Google Scholar]
- 17. Iemitsu K, Kawata T, Iizuka T, et al Effectiveness of ipragliflozin for reducing hemoglobin A1c in patients with a shorter type 2 diabetes duration: interim report of the ASSIGN‐K study. J Clin Med Res 2017; 9: 793–801. [DOI] [PMC free article] [PubMed] [Google Scholar]
- 18. Kawata T. Study on effectiveness and safety ASSIGN‐K with the SGLT2 inhibitor 104 weeks administration for patients with type 2 diabetes. J Jpn Phys Assoc 2018; 33: S96 (Japanese). [Google Scholar]
- 19. Kawata T, Iemitsu K, Taro A, et al Study on effectiveness and safety ASSIGN‐K with the ipragliflozin 104 weeks administration for patients with type 2 diabetes. J Constitut Med 2018; 80: 235–235. [Google Scholar]
- 20. Kurose T, Inagaki N, Fukatsu A, et al Evaluation of the safety and efficacy of SGLT2 inhibitor luseogliflozin in elderly patients with type 2 diabetes mellitus‐post‐marketing surveillance in elderly patients (final report). Jpn Pharmacol Ther 2017; 45: 559–569. [Google Scholar]
- 21. Yokote K, Terauchi Y, Nakamura I, et al Real‐world evidence for the safety of ipragliflozin in elderly Japanese patients with type 2 diabetes mellitus (STELLA‐ELDER): final results of a post‐marketing surveillance study. Expert Opin Pharmacother 2016; 17: 1995–2003. [DOI] [PubMed] [Google Scholar]
- 22. Utsunomiya K, Shimmoto N, Senda M, et al Safety and effectiveness of tofogliflozin in elderly Japanese patients with type 2 diabetes mellitus: a post‐marketing study (J‐STEP/EL Study). J Diabetes Investig 2017; 8: 766–775. [DOI] [PMC free article] [PubMed] [Google Scholar]
- 23. Yamanouchi M, Furuichi K, Hoshino J, et al Nonproteinuric versus proteinuric phenotypes in diabetic kidney disease: a propensity score‐matched analysis of a nationwide. Biopsy‐Based Cohort Study. Diabetes Care 2019; 42: 891–902. [DOI] [PubMed] [Google Scholar]
- 24. Imai E, Horio M, Yamagata K, et al Slower decline of glomerular filtration rate in the Japanese general population: a longitudinal 10‐year follow‐up study. Hypertens Res 2008; 31: 433–441. [DOI] [PubMed] [Google Scholar]
- 25. Bakris GL, Williams M, Dworkin L, et al Preserving renal function in adults with hypertension and diabetes: a consensus approach. National Kidney Foundation Hypertension and Diabetes Executive Committees Working Group. Am J Kidney Dis 2000; 36: 646–661. [DOI] [PubMed] [Google Scholar]
- 26. Panchapakesan U, Pegg K, Gross S, et al Effects of SGLT2 inhibition in human kidney proximal tubular cells–renoprotection in diabetic nephropathy? PloS One 2013; 8: e54442. [DOI] [PMC free article] [PubMed] [Google Scholar]
- 27. Takagi S, Li J, Takagaki Y, et al Ipragliflozin improves mitochondrial abnormalities in renal tubules induced by a high‐fat diet. J Diabetes Investig 2018; 9: 1025–1032. [DOI] [PMC free article] [PubMed] [Google Scholar]
- 28. Kojima N, Williams JM, Takahashi T, et al Effects of a new SGLT2 inhibitor, luseogliflozin, on diabetic nephropathy in T2DN rats. J Pharmacol Exp Ther 2013; 345: 464–472. [DOI] [PMC free article] [PubMed] [Google Scholar]
- 29. Kidokoro K, Cherney DZI, Bozovic A, et al Evaluation of glomerular hemodynamic function by empagliflozin in diabetic mice using in vivo imaging. Circulation 2019; 140: 303–315. [DOI] [PubMed] [Google Scholar]
- 30. Kamezaki M, Kusaba T, Komaki K, et al Comprehensive renoprotective effects of ipragliflozin on early diabetic nephropathy in mice. Sci Rep 2018; 8: 4029. [DOI] [PMC free article] [PubMed] [Google Scholar]
- 31. Utsunomiya K, Senda M, Kakiuchi S, et al Safety and efficacy of tofogliflozin in Japanese patients with type 2 diabetes mellitus in real‐world clinical practice: results of 3‐month interim analysis of a long‐term post‐marketing surveillance study (J‐STEP/LT). J Diabetes Investig 2019; 10: 1272–1283. [DOI] [PMC free article] [PubMed] [Google Scholar]
- 32. Neuen BL, Ohkuma T, Neal B, et al Cardiovascular and renal outcomes with canagliflozin according to baseline kidney function. Circulation 2018; 138: 1537–1550. [DOI] [PMC free article] [PubMed] [Google Scholar]
- 33. Kashiwagi A, Takahashi H, Ishikawa H, et al A randomized, double‐blind, placebo‐controlled study on long‐term efficacy and safety of ipragliflozin treatment in patients with type 2 diabetes mellitus and renal impairment: results of the long‐term ASP1941 safety evaluation in patients with type 2 diabetes with renal impairment (LANTERN) study. Diabetes Obes Metab 2015; 17: 152–160. [DOI] [PMC free article] [PubMed] [Google Scholar]
- 34. Yoshida S, Kim H, Takumi Y. Investigation of the safety and efficacy of dapagliflozin for type 2 diabetes in elderly patients‐final report of the dapagliflozin observational study (DIANTHUS study). Jpn Pharmacol Ther 2017; 45: 357–384 (Japanese). [Google Scholar]
Associated Data
This section collects any data citations, data availability statements, or supplementary materials included in this article.
Supplementary Materials
Figure S1 | Amount of change in estimated glomerular filtration rate.
Figure S2 | Changes in estimated glomerular filtration rate (groups divided into quartiles by the baseline value of estimated glomerular filtration rate). Data are mean ± standard error.
Figure S3 | Amount of change in estimated glomerular filtration rate (groups divided into quartiles by the baseline value of estimated glomerular filtration rate).
Figure S4 | Changes in estimated glomerular filtration rate (excluding the addition of antidiabetic drugs).
Table S1 | Analysis of factors affecting annual change rate of estimated glomerular filtration rate.
Table S2 | Adverse reactions.