Abstract
Cell-generated tractions play an important role in various physiological and pathological processes such as stem-cell differentiation, cell migration, wound healing, and cancer metastasis. Traction force microscopy (TFM) is a technique for quantifying cellular tractions during cell–matrix interactions. Most applications of this technique have heretofore assumed that the matrix surrounding the cells is linear elastic and undergoes infinitesimal strains, but recent experiments have shown that the traction-induced strains can be large (e.g., more than 50%). In this paper, we propose a novel three-dimensional (3D) TFM approach that consistently accounts for both the geometric nonlinearity introduced by large strains in the matrix, and the material nonlinearity due to strain-stiffening of the matrix. In particular, we pose the TFM problem as a nonlinear inverse hyperelasticity problem in the stressed configuration of the matrix, with the objective of determining the cellular tractions that are consistent with the measured displacement field in the matrix. We formulate the inverse problem as a constrained minimization problem and develop an efficient adjoint-based minimization procedure to solve it. We first validate our approach using simulated data, and quantify its sensitivity to noise. We then employ the new approach to recover tractions exerted by NIH 3T3 cells fully encapsulated in hydrogel matrices of varying stiffness. We find that neglecting nonlinear effects can induce significant errors in traction reconstructions. We also find that cellular tractions roughly increase with gel stiffness, while the strain energy appears to saturate.
1 Introduction
Tractions exerted by cells play a crucial role in mechanical and structural events in biology such as tissue contraction, folding, and embryonic morphogenesis, as well as in many basic cellular functions such as proliferation, migration, and stem-cell differentiation [1–4]. In order to understand the impact of cellular tractions on various physiological and pathological processes, it is critical to measure tractions with high spatiotemporal resolution and to correlate them either causally or statistically with a biological process of interest [5]. For instance, the polarity and anisotropy of tractions have been found to be important for cancer cell invasion [6]; different traction distributions can modulate translation and transcription of vascular endothelial cells [7].
Traction force microscopy (TFM) is a robust tool to quantify cellular forces during cell–material interactions [8,9]. In TFM, two-dimensional (2D) substrates or three-dimensional (3D) extracellular matrices (ECMs) interacting with the cell are typically embedded with fiducial markers (e.g., fluorescent microbeads), so that the displacement of substrates/ECMs in response to cellular forces can be measured by tracking the motion of these markers. Cellular tractions are then computationally reconstructed by means of a suitable model that relates tractions, deformations, and known mechanical properties of substrates/ECMs. Other experimental techniques [10], such as cantilever-based force sensors [11] and fluorescence resonance energy transfer [12] have also been used to quantify cellular forces.
In initial TFM studies, cells were typically cultured on 2D substrates, and transverse deformations of substrates induced by cellular forces were measured [13–17]. The measured displacement was then used to compute planar surface tractions through the inverse Boussinesq formulation [18]. More recently, it was found that even cells seeded on flat 2D surfaces can apply 3D traction forces inducing out-of-plane deformations of substrates [19–21], highlighting the importance of measuring all the three components of tractions. Further, the biological behavior of a cell on 2D substrates can be drastically different from that of the same cell in its native 3D environment [22,23]. Motivated by this, Legant et al. developed a 3D TFM technique to quantify 3D tractions exerted by cells fully encapsulated in 3D ECMs [24]. In this work, a discretized Green's function was constructed using the finite element method (FEM) to connect unit tractions applied at the cell surface to the induced bead displacements. Then, an inverse problem with appropriate regularization was solved to reconstruct tractions that produce a displacement field that best matches the measured displacement field.
There are several challenges in measuring cellular tractions in 3D. In particular, it is costly to measure the cell–ECM interface and bead displacements with high resolution in 3D [25]. Further, it is critical to determine the mechanical properties of the ECM and develop appropriate constitutive models to characterize them. In particular, most ECMs exhibit a nonlinear stress–strain response at finite strains [26,27]. However, most available 3D TFM methods employ the linear (infinitesimal) elasticity theory to describe the mechanical behavior of the ECM.
High-resolution imaging techniques have shown that cellular tractions can induce large deformations in the ECM with strain magnitudes of up to 50–70% [24,28]. For this reason, the nonlinear behavior of the ECM must be incorporated in order to accurately quantify cellular tractions. There are several sources of this nonlinear behavior. First, when the strain in the ECM exceeds a certain threshold (typically around 10%), the linear (infinitesimal) strain tensor is no longer appropriate to characterize the deformation of the ECM, and the finite strain tensor (e.g., Lagrangian or Eulerian strain tensor) incorporating nonlinear terms must be adopted. Second, the large strains and local rotations of the ECM can lead to non-negligible changes in the geometry of the cell–ECM interface, thus introducing the so-called geometric nonlinearity. Third, the ECM often exhibits a nonlinear stress–strain response at finite strains, which necessitates a nonlinear constitutive model for the ECM and introduces material nonlinearity.
Motivated by these observations, Dong and Oberai [29] developed an efficient nonlinear 3D TFM algorithm, accounting for both the geometric and material nonlinearities. More specifically, the TFM problem was posed as an inverse problem, with the objective of finding the traction field that is consistent with the measured displacement. The inverse problem was solved as a constrained minimization problem, where the difference between the predicted and measured displacements was minimized. The predicted displacement was obtained by solving the equations of equilibrium for a hyperelastic, strain-stiffening ECM in response to a candidate traction field, making use of the FEM. A gradient-based, iterated optimization procedure was employed to solve the minimization problem, and the gradient was efficiently computed by solving a linearized adjoint equation. These authors also tested the performance of the algorithm on synthetic data, and concluded that incorporating the nonlinear effect can improve the accuracy of the traction reconstruction by as much as 20%. Very recently, an FEM-based iterative method was used to estimate tractions in a hyerelastic, Neo-Hookean matrix [30]; however, this method does not account for the material nonlinearity induced by ECM stiffening.
While the approach developed in Ref. [29] incorporates nonlinear effects and is computationally efficient, it has the drawback that it is based on solving nonlinear hyperelasticity problems in the relaxed configuration of the ECM, under the assumption that the cell shape in the relaxed state is known. However, this shape is often unknown in practice, since the relaxed state of the ECM is typically achieved by lysing the cell [24], which makes it difficult, if not impossible, to locate the cell–ECM interface in the relaxed state. This has prevented the application of this approach to experimentally acquired data. Indeed, all the results presented in Ref. [29] were obtained on simulated displacement data. In this work, we develop a novel nonlinear 3D TFM algorithm that can be easily applied to experimental data. In contrast to the approach of Ref. [29], we solve the nonlinear hyperelasticity problem in the stressed configuration of the ECM, which can be readily measured in the experiment before cell lysis [24]. We also demonstrate that not accounting for this difference between the relaxed and stressed state of the ECM can lead to large errors (approximately 40%) in the tractions near cell protrusions.
The “direct” TFM method has also been used to determine cellular tractions [20,21,31]. In this method, the measured displacement field is differentiated to determine the strain field, and the stress/traction field is “directly” computed via the constitutive relation for the ECM. This method circumvents the solution of an inverse problem and is computationally more efficient. However, the spatial derivatives tend to amplify noise artifacts, and a precise measurement of displacement field—especially at locations close to the cell–ECM interface—is required to accurately quantify cellular tractions [25].
In the remainder of the paper, we first present our 3D TFM framework, including the experimental methods, generation of geometric models and finite element mesh, and traction reconstructions. Thereafter, we validate the proposed method by quantifying its error in recovering a chosen, simulated traction field, and examine the effect of noise in the measured displacement field. We also quantify the error associated with ignoring or improperly accounting for the nonlinear effects. Further, we employ our approach to recover tractions exerted by NIH 3T3 cells fully encapsulated in biologically relevant, synthetic hydrogel matrices with varying stiffness. In particular, we investigate the effect of ECM stiffness on traction magnitude and total strain energy stored in the ECM. We also quantify the differences in tractions obtained from methods that incur different assumptions regarding ECM nonlinearity. We end with the conclusions of this study.
2 Experimental Methods
2.1 Cell Culture.
NIH 3T3 cells (American Type Culture Collection; ATCC, Manassas, VA) were maintained in high-glucose DMEM containing 10% bovine serum, 2 mM l-glutamine, 100 units/ml penicillin, and 100 mg/ml streptomycin (all from Invitrogen, Carlsbad, CA). Cells were incubated in a humidified chamber maintained at 37 °C and 5% .
2.2 Hydrogel Synthesis and Cell Encapsulation.
Three-dimensional dextran hydrogels were prepared via mixing Dex-MA (70% methacrylation, 4% w/v) with 8 mM-thiolated RGD peptide (CGRGDS, Aapptec, Louisville, KY) in the presence of matrix metalloprotenase (MMP)-cleavable dithiol-containing peptide crosslinker (CGPQGIAGQGCR, Aapptec, Louisville, KY), as described previously [32]. Two types of fluorescent polystyrene microbeads of diameter 0.2 (Bangs Laboratories, Fishers, IN; Dragon Green (FSDG002) and Suncoast Yellow (FSSY002)) were also added in a ratio of 1:200 (v/v) to the mixed hydrogel precursor solution. Note that the pore size of dextran hydrogels (within nanoscale range) is much smaller than the diameter of the beads used in this study. Therefore, the beads were physically encapsulated in the gel and did not diffuse out. The pH of the solution was then adjusted approximately to 8 with NaOH (1 M) to initiate hydrogel formation through Michael-type addition reaction. For 3D cell encapsulation, NIH 3T3 fibroblasts were resuspended in the pH-adjusted hydrogel solutions to a final concentration of 60,000 cells/mL. Prior to encapsulation, the cells were stained using 1:1000 CellMask deep red cell membrane dye (ThermoFisher Scientific, Waltham, MA; C10046) and incubating at 37 °C for 5 min. Eighty microliter of the cell-containing hydrogel solution was deposited onto uncoated glass-bottomed 35 mm dishes (MaTek Corporation, Ashland, MA; P35G-1.0-20) and allowed to polymerize for 45 min in 37 °C incubator before adding cell culture medium. Differing amounts of peptide crosslinker were added at thiol-methacrylate ratio of 0.5, 0.75, or 1 to achieve soft, intermediate, and stiff hydrogels. Note that the mechanical properties for these gels are not significantly altered during the course of cell culturing (∼3 days) [24] (also see Fig. 13), because the MMP-sensitive peptide used in this work (CGPQGIAGQGCR) has a very low degradation rate [33,34].
2.3 Hydrogel Mechanical Characterization.
Bulk hydrogel mechanical properties were measured using a strain-controlled Discovery HR-2 oscillatory shear rheometer (TA Instruments, New Castle, DE), with a 20 mm diameter cone-on plate geometry, 2 deg cone angle, and at a 62 gap distance at 37 °C. Dextran hydrogels were prepared using the same compositions employed in the 3D TFM experiments described above. Hydrogel precursor solutions were deposited onto the rheometer Peltier plate for in situ mechanical stiffness measurements. To determine hydrogel formation and gelation kinetics, time sweep studies were first performed at a constant 6 rad/s frequency, 1% strain; followed by frequency sweeps conducted over a logarithmic scale from 0.1 rad/s to 100 rad/s at a fixed strain amplitude of 1% to confirm the mechanical stability of resulting hydrogels. Finally, to determine the nonlinear elastic response at large strains, strain sweeps were performed on samples from to a maximum strain of at a constant frequency 6 rad/s. Data were collected from multiple measurements of four independent samples.
2.4 Microscopy.
Encapsulated cells and polystyrene beads were imaged with a numerical aperture, water-immersion objective (LD C-Apochromat; Carl Zeiss, Oberkochen, Germany) on a Yokogawa CSU-21-Zeiss Axiovert 200M inverted spinning-disk microscope with an Evolve EMCCD camera (Photometrics, Tucson, AZ). A volume of μm3 was imaged around each cell with voxel dimensions μm3. After the images of beads and cells in stressed gels were acquired, the cells were treated with 0.1% triton-x [8,35,36] for 30 min to allow for cell lysis and matrix relaxation. Cell lysis was confirmed in bright field before images of beads in the relaxed hydrogels were acquired.
2.5 Bead Displacement Calculations.
The displacement vector fields in the gels were calculated from the images of the beads in stressed and unstressed states using a custom matlab script as described previously [24]. Briefly, microscopy image stacks of the beads encapsulated within the hydrogels were imported into matlab and bead centroids were identified in both the stressed and relaxed states. Then, the bead centroids in the two states were matched using a feature vector-based algorithm relating the relative position of each bead to its neighbors. Bead displacements were obtained after two rounds of bead matching. After the first round of bead matching, a quadratic correction was applied to the displacement of all beads to correct for temperature-dependent swelling and mechanical drift in the gel. The quadratic correction was computed by minimizing the total bead displacement as described by Legant et al. [24]. After applying the quadratic correction, a second round of bead matching was performed to compute the final displacement field, which was then used for traction force calculations. By quantifying the difference in bead locations before and after cell lysis, we observed that microbeads far from the cell had no displacement, implying that these microbeads were immobilized in the gel regions where cellular forces are absent. On the other hand, microbeads in the periphery of cells showed significant bead displacements due to cellular forces.
3 Generation of Geometric Model and Mesh
The 3D image data were segmented using ITK-SNAP [37], yielding a voxel dataset where each voxel has been identified as either belonging to the cell or the gel. The segmentation process was to a large extent automatic, naturally prone to introducing a variety of voxel artifacts. These artifacts manifested themselves as segmentation errors due to variations in gray-scale values close to the threshold that separated cell and the gel. With the help of procedures that we developed [38], the encountered artifacts can be eliminated. A next step removed physically implausible situations (e.g., two voxels of different material connecting through a single common corner vertex), creating a voxel dataset that was suitable for the generation of a nonmanifold boundary representation.
The nonmanifold boundary representation was constructed by triangulating the interface between the cell and the gel voxels as well as the outer boundary of the scanned specimen. The triangulation defined the geometry from which the topology of the model was constructed, namely, two geometric regions for the cell and the gel, plus all supporting lower-order geometric entities (faces, edges, and vertices) to form a fully valid nonmanifold model. Next, a volume preserving smoothing method was applied to the geometry of the faces, which to this point retained the stair-case like features of the voxels. The final step consisted of creating additional geometric vertices (interior to the geometric region representing the gel), one for each microbead. The measured displacements for the microbeads were stored with the corresponding geometric vertex so that a complete run-ready input deck for the analysis process can be generated solely relying on the geometric model and the information stored within. We note that it is important to accurately determine and represent the interface between the cell and the gel. Failure to do so can result in geometric errors that will propagate into the computational analysis [39]. The systematic characterization of these errors is important; however, it is beyond the scope of this work and will be pursued in the future.
With a proper nonmanifold model available, a finite element mesh can be constructed [40]. The finite element mesh was independent of the triangulation defining the geometry of the cell. This was an essential feature of our process, which allowed us to focus on creating a finite element mesh that was tailored for the analysis. Proper mesh refinements can be applied in areas where the analyst expected large gradients (typically close to the cell), while further away from the cell the mesh can be coarser. This can be guided by visualizing the measured displacement fields. Note also that the meshing algorithm forced the creation of a mesh vertex at each geometric vertex, ensuring that there was a mesh vertex located where a measured displacement value was available. Overall, this approach allowed us to control the discretization error, minimizing a source of errors in the overall process.
The last step consisted of generating the input deck that served as the sole input for the solver. This was driven by attributes [41] associated with entities of the geometric model. Together with the classification of the mesh entities discretizing the cell's outer surface, as well as the placement of mesh vertices at each microbead location—with a reference back to the displacement information collected for each bead—allowed this process to be fully automatically, capturing everything required to run the analysis.
4 Reconstruction of Cellular Tractions
In this section, we present our new algorithm for reconstructing tractions exerted by cells fully encapsulated in 3D hydrogel matrices. As already mentioned in the Introduction section, our method accounts for both the geometric and material nonlinearities and generalizes the nonlinear 3D TFM approach of Ref. [29]. The main advance is the formulation of the problem in the stressed configuration of the ECM, which enables its application to real experimental data. In the following, we first present the nonlinear forward problem that describes the response of a 3D hydrogel matrix to cellular tractions. We then formulate the nonlinear inverse problem to determine the traction field at the cell–matrix interface, given the measured displacements and the mechanical properties of the matrix.
4.1 Forward Nonlinear Hyperelasticity Problem.
We consider a single cell embedded within a 3D ECM made from a hydrogel, which is assumed to be incompressible and isotropic. The above assumption is known to be appropriate for covalently crosslinked amorphous gels, such as dextran gels and polyacrylamide gels [31,42]. These gels typically have a characteristic diffusion timescale (of the order of hours) much longer than the loading timescale (of the order of minutes), thereby exhibiting an almost incompressible behavior. In addition, the hydrogel is known to exhibit a nonlinear stress–strain response at finite strains [42]. Hence, a nonlinear hyperelastic model, the modified Blatz model [29,43], is used to characterize the behavior of the gel.
The forward problem is posed on the spatial domain occupied by the hydrogel matrix surrounding the cell, which is truncated at a certain distance away from the cell where the displacement induced by cellular tractions has decayed [20,24]. Then, the displacement field, , and the pressure field, p, in the gel satisfy the equations of equilibrium given by
| (1) |
| (2) |
| (3) |
| (4) |
Here, Eq. (1) is a statement of equilibrium for the gel in the stressed configuration Ω, where T is the Cauchy stress tensor, and the operator denotes the gradient with respect to the coordinate x in the stressed configuration, Eq. (2) places an incompressibility constraint on the hydrogel, and , where is the deformation gradient, with X denoting the coordinate of the gel in the relaxed configuration. Moreover, Eqs. (3) and (4) define the displacement and traction boundary conditions, respectively, where the displacement is prescribed on , while the traction is prescribed on . Furthermore, defines the closed boundary of the spatial domain Ω, , and n denotes the outward unit normal to the boundary .
The above equations are closed by a constitutive equation for the Cauchy stress T, which is given by the modified Blatz model [29,43], i.e.,
| (5) |
In the above expression, μ is the shear modulus of the hydrogel at zero strain, γ is the nonlinear parameter that determines the exponential strain-stiffening of the gel, is the left Green–Lagrange stretch tensor, and is the trace of .
It is remarked that the forward hyperelasticity problem for the displacement field, , and the pressure field, p, is formulated in the stressed configuration of the hydrogel matrix. A similar approach of solving finite-strain hyperelasticity problems in the stressed configuration can be found in Refs. [44] and [45]. That is we solve for and , where represents coordinates in the stressed configuration (prelysis in our case). In order to determine the deformation gradient from , we make use of the following relation:
| (6) |
where is the second-order identity tensor. This formulation is motivated by the fact that the cell geometry in the stressed state ( in Eq. (4)) is readily accessible in the TFM experiment [24], while the cell geometry in the relaxed state is usually unknown after cell lysis. Finally, note that the forward problem can be solved by means of a nonlinear, stabilized, mixed finite element method [46], and the details are provided in Appendix A.
4.2 Inverse Problem for the Traction Field.
Next, we formulate the inverse problem of determining the cellular tractions, t, at the cell–matrix interface, , given the measured displacements at discrete locations in the hydrogel, as well as the mechanical properties of the gel. We pose the inverse problem as a constrained minimization problem, where the objective is to find a traction field that generates a displacement field that best matches the measured displacements. A gradient-based optimization method, limited memory Broyden–Fletcher–Goldfarb–Shanno (L-BFGS) [47], is employed to iteratively solve the minimization problem, and the gradient is efficiently computed by solving an appropriate adjoint equation [29,43,48,49].
The inverse problem is stated as follows: Given the displacement vectors measured at N bead locations, (), determine the traction field, t, such that the objective function
| (7) |
is minimized subject to the constraint that the predicted displacement field, u, satisfies the forward problem defined by Eqs. (1)–(5). In Eq. (7), the first term is the displacement mismatch term, where the () are the predicted displacement vectors at the N bead locations. The second term is a regularization term that helps to smooth the possible traction solutions to the ill-posed inverse problem. In this work, we use the total variation diminishing (TVD) regularization, where is the surface gradient of the traction field on (recall that n is the outward unit normal to the surface), and c is a small nonzero constant that ensures the differentiability of the regularization term when . Note that the TVD regularization suppresses large oscillations of the traction field while preserving the steepness of the tractions. Since the tractions may vary significantly as we move from the cell body to cell protrusions, the TVD regularization is useful in preserving the sharp transition of the traction field. Note also that the selection of α depends on the noise level in the measured displacements, and the standard L-curve approach [50] is used to determine the optimal values of α.
In order to solve the inverse problem using a gradient-based optimization technique, we need to determine the gradient of the objective function π with respect to the traction field t. Following the work of Refs. [29,43,48], and [49], we make use of an appropriately derived adjoint field to efficiently compute this gradient (see Appendix B for details).
In summary, given the measured displacements, the mechanical properties and the deformed geometry of the hydrogel matrix, the traction field at the cell–matrix interface can be reconstructed as follows:
For a given guess of the traction field t, solve the nonlinear Eqs. (1)–(5) to determine the primal fields u and p.
Solve the linear adjoint equations to determine the adjoint fields.
Use the primal and adjoint fields to determine the objective function and the gradient vector.
Utilize the L-BFGS optimization method to obtain an updated estimate of the traction field. Then, steps 1–4 are repeated until convergence.
The initial guess for the traction field t is set to zero, and the L-BFGS iterations are considered to be converged when the relative change in the displacement matching term over the last five iterations is less than . Note that our algorithm can be easily modified to account for matrix compressibility. This is important for measuring cellular tractions in fibrous ECMs such as collagen gels and matrigels, which are highly compressible [25,51–53]. Our inverse problem solver is available on GitHub.2
5 Sensitivity of Tractions to Noise and Nonlinearity
In this section, we conduct numerical tests to validate the new TFM algorithm. We investigate the effect of experimental noise on our ability to accurately recover tractions. We also examine the error induced by neglecting or incorrectly accounting for the nonlinear effects in the TFM problem.
We assume that the cell shape is known in the stressed (or prelysis) state, but unknown in the relaxed (postlysis) state, consistent with our experimental measurements. Given the cell geometry, the mechanical properties of the gel, and a chosen traction field applied at the cell–gel interface, we compute the true displacement field sampled at the bead locations by solving a forward problem (Eqs. (1)–(5)). We add noise to these displacements to mimic the effect of instrument noise and errors in the displacement estimation algorithm in real experiments. The noisy “measured” displacements, (), are given by Ref. [29]
| (8) |
where denotes a random vector with its three components given by , i = 1, 2, 3, and is the standard normal distribution. The parameter η controls the level of noise in the “measured” displacement field. In this work, we select and 5%, which is relevant for a TFM experiment [16,54].
Using these synthetic displacements (Eq. (8)) as input, we compute the traction field by means of the new TFM algorithm described above. Since this algorithm consistently accounts for all nonlinear effects and is posed in the current (stressed) configuration, we refer to these results as NL-CUR.
We examine the effect of ignoring all the nonlinear effects by using the same measured displacements in an algorithm that uses infinitesimal strains, a linear constitutive model and does not distinguish between the geometry in the current and reference states of the ECM. This approach is similar to the method used in Ref. [24], and we refer to these results as LIN. Note that in the linear constitutive model, for the shear modulus we make use of the zero-strain shear modulus μ that appears in the modified Blatz model (see Eq. (5)).
We also examine the effect of not accounting for the geometric differences between the current (stressed) and the reference (relaxed) state. This is done by using the measured displacements in an algorithm that accounts for the nonlinearity in the strain tensor and in the constitutive behavior of the ECM, but incorrectly uses the geometry of the current state as that of the reference state. We refer to these results as NL-REF.
We assess the performance of these algorithms by quantifying the difference between the recovered and exact traction fields. In particular, we define the average error for the traction field as
| (9) |
where denotes the Ln norm of a vector field a defined on the cell surface , and n is a positive integer. We also define the maximum local error for the traction field as
| (10) |
These metrics defined in Eqs. (9) and (10) contain useful information. For NL-CUR, they represent the error induced by measurement noise, while for LIN and NL-REF they also include the error associated with incorrectly accounting for the nonlinear effects.
We consider a microglial cell model shown in Fig. 1(a). The geometric model and mesh are generated from a set of Z-stack microscopy images courtesy of Sebastian Rhode at ZEISS Microscopy. The cell is approximately and is embedded within a cubic hydrogel matrix with an edge length of . The mesh contains 9641 vertices and 51,544 tetrahedral elements. The shear modulus μ of the matrix is set to 0.6 kPa, and the nonlinear parameter γ is set to 0.5. In order to mimic realistic cellular forces, we apply tractions that are large at the tips of the two protrusions and decrease toward the cell center (Fig. 1(b)). The resulting displacement field is displayed on a 2D cross section of the gel (Fig. 1(c)), and on the cell surface (Fig. 1(d)). We also reconstruct the cell surface in the relaxed state by warping the current cell surface by the displacement vector (i.e., ). The resulting surface is displayed as a transparent surface in Fig. 1(d). We observe noticeable differences between the cell geometries in the stressed and relaxed states, particularly at the tips of the cell protrusions.
Fig. 1.
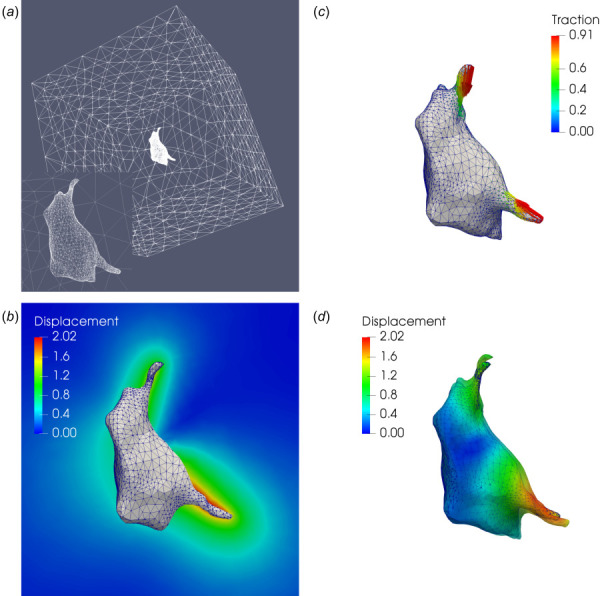
Microglial cell: (a) finite element mesh on the cell–gel interface and the surface of the truncating domain; (b) simulated tractions (in kPa) applied to the cell surface; (c) displacement field (in ) on a 2D cross section of the hydrogel matrix; (d) displacement field (in ) on the cell surface, where the solid and transparent surfaces represent the cell geometry in the stressed and relaxed configurations, respectively
We treat vertices within of the cell surface (excluding the surface itself) as bead locations. This yields a total of 7023 bead locations, which is of the same order as the number of beads in a typical 3D TFM experiment [24]. We add noise to displacement vectors at those vertices to generate the “measured” displacements (Eq. (8)), which are then used to recover the traction field by solving an inverse problem. For a typical run, the inverse solver converges in about 1600 iterations (Fig. 9 in Appendix D), taking around 140 min on a standard desktop equipped with four cores (Intel(R) Core(TM) i7-3820 CPU at 3.60 GHz). Figure 2 shows the reconstructed traction field , the local traction error , and the reconstructed displacement field u, obtained using NL-CUR (a–c), LIN (d–f), and NL-REF (g–i) for 1% noise. It can be seen that NL-CUR yields the lowest tractions and traction errors (Figs. 2(a) and 2(b)), while LIN and NL-REF tend to overestimate the traction field, especially at the tips of the protrusions.
Fig. 2.
![Traction reconstructions for the microglial cell with 1% noise showing tractions t (in kPa), local traction errors |t−t̂| (in kPa), and reconstructed displacement fields u (in μm) on 2D cross sections of the hydrogel matrix. (a)–(c) Results for our new algorithm (NL-CUR); (d)–(f) results for the linear elasticity approach of Ref. [24] (LIN); (g)–(i) results for the nonlinear approach of Dong and Oberai [29] (NL-REF).](https://cdn.ncbi.nlm.nih.gov/pmc/blobs/d081/7477711/dcb35d3554c2/bio-19-1547_081012_g002.jpg)
Traction reconstructions for the microglial cell with 1% noise showing tractions (in kPa), local traction errors (in kPa), and reconstructed displacement fields (in ) on 2D cross sections of the hydrogel matrix. (a)–(c) Results for our new algorithm (NL-CUR); (d)–(f) results for the linear elasticity approach of Ref. [24] (LIN); (g)–(i) results for the nonlinear approach of Dong and Oberai [29] (NL-REF).
It is important to note that even though LIN neglects strain stiffening thus underestimating the shear modulus at finite strains, it ends up overestimating the traction field (Fig. 2(d)). This is because LIN makes use of the linear approximation for the strain which overestimates the true value of the strain field. This effect acts in opposition to the underestimation of the shear modulus, yielding a net overestimation of the traction field (note that traction is roughly the product of modulus with strain at the cell–matrix interface). Thus, the relative poor performance of LIN is a consequence of neglecting all the nonlinear effects (i.e., nonlinear strain, material nonlinearity, and geometric nonlinearity), and not due to the simple underestimation of the shear modulus.
In Table 1, we summarize the errors in the traction field recovered by the three different methods at 1% and 5% noise levels. We observe that our new TFM approach (NL-CUR) can reasonably recover the traction field at both levels of noise, yielding an average error of 14.1% and 25.5%, respectively, for 1% and 5% noise. The errors in predicting the maximum traction values are somewhat smaller: 11.5% and 20%, respectively.
Table 1.
| NL-CUR | LIN | NL-REF | ||||
|---|---|---|---|---|---|---|
| Error | ||||||
| (%) | 14.1 | 25.5 | 23.9 | 27.7 | 23.6 | 27.1 |
| (%) | 11.5 | 20.0 | 38.4 | 30.1 | 44.2 | 35.3 |
At the 1% noise level we observe that not accounting for nonlinearity (LIN) and not distinguishing between the current and reference state (NL-REF) both lead to approximately an additional 10% error in . When measurement noise is higher (5%) these differences are not significant (), indicating thereby that in this case the error due to measurement noise overwhelms the error emanating from incorrect models on nonlinear behavior.
When comparing error in the maximum value of the traction vector (), we observe that errors incurred by incorrectly accounting for the nonlinear effects are more significant. At 1% noise, the errors are approximately four times higher, and at 5% noise level they are around twice as much. Thus, correctly accounting for the ECM nonlinearity appears to make a significant difference when predicting the maximum traction values. We note that the maximum values of tractions typically occur at cell protrusions, which are known to be hubs for force-mediated mechanotransduction [24].
6 Results and Discussion
Having established the need to correctly account for the ECM nonlinearity, in this section, we employ our TFM procedure to recover the tractions exerted by NIH 3T3 fibroblasts fully encapsulated in dextran-based hydrogels of different stiffnesses. The gels used in this work have a shear modulus of 0.4–5 , a range similar to that of commonly used extracellular matrices and in vivo tissues such as brain, mammary, and muscle tissues [24,55,56].
We consider three gels with low, medium, and high stiffness, and make use of the modified Blatz model (Eq. (5)) to describe gel behavior. We determine the relevant material parameters, i.e., the shear modulus at zero strain, μ, and the nonlinear parameter, γ, by fitting the modulus-strain curve derived from Eq. (5) to the corresponding experimental data (see Appendix C for details). The material parameters for each gel are provided in Table 2. For each gel stiffness, we recover tractions for three different cells, yielding a total of nine cells.
Table 2.
Material parameters for the dextran-based hydrogels
| Dextran gel | μ () | |
|---|---|---|
| Soft | 0.50 | 0.50 |
| Medium | 2.07 | 0.67 |
| Stiff | 4.12 | 0.64 |
Figure 3 displays images from our TFM workflow for soft (a–c), medium (d–f), and stiff (g–i) gels. For each gel stiffness, we show representative results for one cell. In particular, Figs. 3(a), 3(d), and 3(g) are 3D reconstructions of fluorescence images of 3T3 cells encapsulated in a hydrogel containing fluorescent beads. We observe that the morphologies of the three cells in the stressed (prelysis state) are rather complex and different from each other. Figures 3(b), 3(e), and 3(h) show the 3D geometric models of the cells, as well as the measured bead displacements in the hydrogels. For clarity, we only display displacement vectors for beads that lie within 20 μm from the cell surface, which are used as inputs for traction reconstructions. Incorporating measurements of beads larger than 20 μm from the cell surface is found to have no significant effects on the recovered tractions (also see Ref. [24]). We observe that most of the displacement vectors point inward toward the cell, indicating overall contractile cellular tractions (see below). Figures 3(c), 3(f), and 3(i) display the finite element mesh on the cell–gel interface and on the outer surface of the computational domain. The mesh for the soft, medium, and stiff gels is comprised of 24,906, 30,662, 26,664 mesh vertices and 131,657, 157,642, 141,509 linear tetrahedral elements, respectively. Further refining the mesh does not substantially change the recovered tractions. All the bead locations for displacement measurements are rendered as vertices in the finite element mesh, thus making it convenient to compute the difference between the measured and predicted displacement vectors.
Fig. 3.
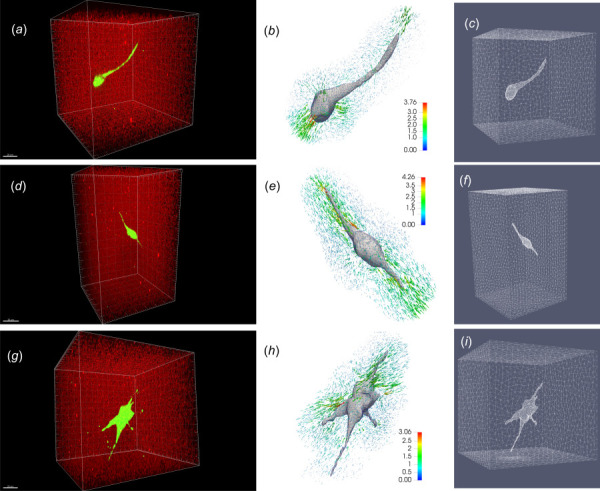
Nonlinear 3D TFM workflow for three representative NIH 3T3 cells fully encapsulated in soft ((a)–(c)), medium ((d)–(f)), and stiff ((g)–(i)) dextran-based hydrogel matrices, respectively. (a), (d), and (g) Three-dimensional reconstruction of fluorescence images showing geometry of a 3T3 cell encapsulated in a hydrogel containing fluorescent beads. The scale bar in (a), (d), and (g) is of , , and , respectively. (b), (e), and (h): the geometrical model of the cells and bead displacements color coded by magnitude (). (c), (f), and (i) finite element mesh on the cell–gel interface and the surface of the truncating domain.
Figures 4(a), 4(d), and 4(g) show the corresponding results for cellular tractions recovered by using the new TFM approach (NL-CUR). Results for the other cells are shown in Fig. 10 in Appendix D. We observe that cells typically exert strong contractile forces at the tips of long extensions. The cellular tractions are primarily shear tractions, although small normal tractions are also present near the body of the cells. The above observations are consistent with those of Ref. [24]. Interestingly, the cell in Fig. 4(g) applies noticeable protrusive forces at the bottom right extension, consistent with the fact that the bead displacements close to this particular extension point outward away from the cell (see Fig. 3(h)). This suggests that the cell could be in the process of migration, thus generating protrusive forces at the leading edge of the extension [57].
Fig. 4.
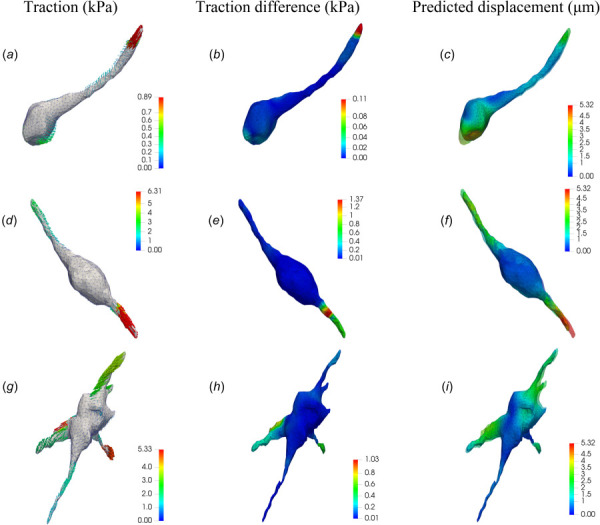
Results of the TFM problem for three NIH 3T3 cells fully encapsulated in soft ((a)–(c)), medium ((d)–(f)), and stiff ((g)–(i)) dextran-based hydrogel matrices, respectively. (a), (d), and (g) tractions fields (in kPa) recovered by means of the nonlinear TFM algorithm (NL-CUR) (only the traction vectors are color coded, while the cell surface is not color coded). (b), (e), and (h) Magnitude of the difference between traction vectors (in kPa) recovered using the nonlinear (NL-CUR) and the linear (LIN) TFM algorithm. (c), (f), and (i) Predicted displacement fields (in ) on the cell surfaces, where the transparent surfaces represent the recovered cell surfaces in the relaxed configuration. Color bar in each figure denotes the magnitude of the corresponding vector field.
Figures 4(b), 4(e), and 4(h) display the magnitude of the difference between traction vectors recovered by the new approach (NL-CUR) and the linear approach (LIN). Recall that this difference represents the effect of not including any nonlinear effect in the traction reconstruction. We observe that for all the three cases, the difference is significant at cell protrusions, and is small near the cell body. This is because the strains are typically very large in proximity to cell protrusions, thus introducing stronger nonlinear effects. In particular, the magnitude of the traction difference can be as large as 30% of that of the reconstructed tractions (compare Fig. 4(e) with Fig. 4(d)).
Figures 4(c), 4(f), and 4(i) display the predicted displacement fields (on the cell surfaces) resulting from the recovered cellular tractions (Figs. 4(a), 4(d), and 4(g)). As expected, the spatial distribution of the displacement fields is qualitatively similar to that of the traction fields, being large near the tips and relatively small near the center of the cell. In addition, we reconstruct the cell surfaces in the relaxed (or postlysis) state, and the results are shown as transparent surfaces in Figs. 4(c), 4(f), and 4(i). We note that as the contractile tractions are released, the gel relaxes and the cells appear to stretch out. We also note that there are significant differences between cell surfaces in the relaxed and stressed states, particularly at cell protrusions. These differences are ignored in a linear 3D TFM analysis, calling into question the validity of this approach for cells with strong contractile tractions.
We investigate the difference among tractions recovered from different models (LIN, NL-REF, and NL-CUR), for all the nine cells considered in this study. Recall that LIN ignores all nonlinear effects, NL-REF ignores geometric nonlinear effects, and NL-CUR accounts for all nonlinear effects. Given that the ground truth of the cellular tractions is unknown, for each cell, we compute the difference between the tractions obtained using NL-CUR and the other two models. In particular, we evaluate the root-mean-square difference, , and the maximum local difference, , among the tractions obtained using different methods. Note that the definitions of and are completely analogous to those of and in Eqs. (9) and (10), respectively, but with the ground truth replaced by the traction field obtained from NL-CUR.
Figure 5 shows the mean and standard deviation of the differences for the nine cells. We observe significant differences in the traction vectors. The mean root-mean-square differences across the nine cells (d2) are 14% for LIN and 21.8% for NL-REF. These values are even higher when considering difference in the maximum () tractions values (25.3% for LIN and 35.3% for NL-REF). Moreover, these differences are found to be more pronounced for cases where the maximum principal stretch induced by cellular tractions is large than 1.5 (see Fig. 14 in Appendix D). This is because for those cases, the nonlinear effects induced by large deformation and strain stiffening play a more important role. We also note that as the cell-generated strain becomes larger, the signal to noise ratio in the measured displacements increases, facilitating accurate traction reconstructions using the nonlinear approach. Thus, the above results reinforce the conclusion drawn in Sec. 5 that the accurate evaluation of tractions requires a consistent approach for modeling the nonlinear ECM behavior.
Fig. 5.
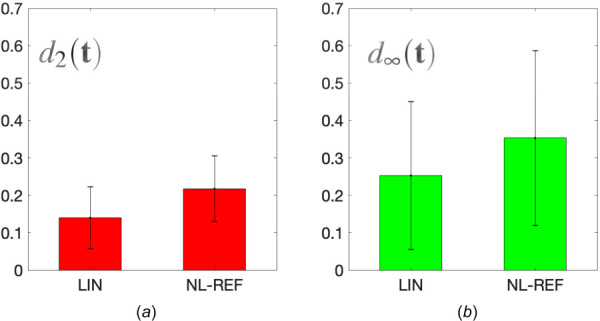
Difference in tractions recovered from different TFM algorithms, where tractions obtained from NL-CUR are used as benchmarks. Results are shown for the mean and standard deviation of the traction difference, as measured by and , for all the nine cells considered in this study.
Our ability to estimate cellular tractions and gel deformation while fully accounting for the nonlinear effects provides us with an opportunity to accurately compute strain and strain energy density within the gel. Figures 6(a), 6(c), and 6(e) show the first principal stretch, and Figs. 6(b), 6(d), and 6(f) display the strain energy density on 2D cross sections of the gels (see also Figs. 11 and 12 in Appendix D). From the stretch figures, we observe that large deformations in the gels take place predominantly in the vicinity of long protrusions, as a result of strong forces exerted by cell protrusions. For all the three cases, the maximum principal stretch is very large (1.6–1.9), suggesting once again that the infinitesimal strain assumption is not valid for these cases. The distribution of the strain energy density (Figs. 6(b), 6(d), and 6(f)) is qualitatively similar to that of the principal stretch, the main difference being that it decays faster as a function of the distance from the cell surface. This is because the strain energy density has stronger-than quadratic dependence on strain measures.
Fig. 6.
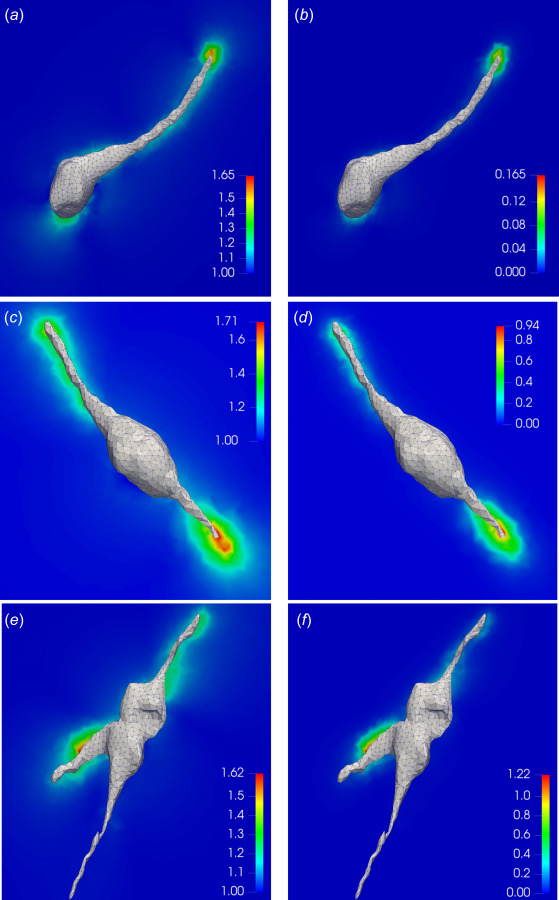
Results for the first principal stretch and strain energy density on the 2D cross sections of hydrogel matrices surrounding the cells. (a), (c), and (e) The local profile of the first principal stretch in the soft, medium, and stiff gels, respectively. (b), (d), and (f) The local profile of the strain energy density (in kPa) in the soft, medium, and stiff gels, respectively.
Finally, we investigate the effect of matrix stiffness on the net cellular force (Fig. 7(a)) and total strain energy (Fig. 7(b)) in the gels. As a measure of the net force, we consider the L1 norm of the tractions, while for strain energy we consider the integral of the strain energy density over the entire gel. We present results obtained from NL-CUR, LIN, and NL-REF for all nine cells. Recall that for each gel stiffness we consider three cells, which are denoted by different symbols (dot, square, or asterisk). We observe that cellular force increases with matrix stiffness, while the total strain energy appears to saturate. Note that the total strain energy is roughly proportional to the net cellular force times the (average) displacement at the cell–matrix interface. Given that the displacement of the cell–matrix interface can be quite different for different gel stiffnesses (e.g., see Figs. 4(c), 4(f), and 4(i)), the behavior of the net force and total strain energy can be distinct from each other. Saturation of the strain energy suggests that there could be a limit beyond which the cells cannot increase their total acto-myosin contractility in response to gel stiffness, and is consistent with studies of cells on 2D substrates [58–60].
Fig. 7.
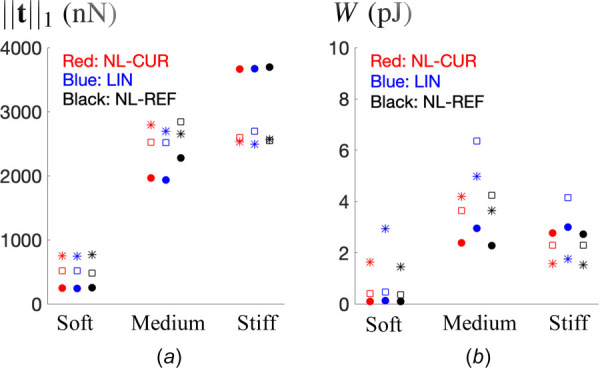
The impact of the gel stiffness on the (a) net cellular force and (b) total strain energy in the hydrogel matrices. Results are shown for NL-CUR, LIN, and NL-REF. For each gel stiffness, three cells are considered, as depicted by different symbols (dot, square, or asterisk). (For interpretation of the references to color in this figure legend, the reader is referred to the web version of this article.)
We note that the net cellular force is less sensitive to the method (Fig. 7(a)), while the total strain energy is very sensitive (Fig. 7(b)). Specifically, we observe from Fig. 7(b) that LIN predicts larger strain energy compared with the other two methods. As mentioned before, this is because LIN makes use of the linear approximation for the strain and overpredicts the strain field.
7 Conclusion
In this work, a novel 3D TFM technique was developed to recover tractions exerted by single cells fully encapsulated in 3D nonlinear hyperelastic matrices. The TFM problem was posed as an inverse problem, and the objective was to determine the traction field (at the cell–matrix interface) that is consistent with the measured displacement field in the matrix. The inverse problem was formulated as a constrained minimization problem, where the difference between the measured and predicted displacements is minimized, under the constraint that the predicted displacement field satisfies the equations of equilibrium. The problem was solved by means of a gradient-based minimization procedure, and the gradient was efficiently evaluated using the adjoint method.
The 3D TFM approach was validated using synthetic data generated from a realistic cell model and simulated tractions. The error in the reconstructed tractions was quantified through comparisons with the ground truth. It was found that our approach can recover the traction field accurately. It was also found that improperly accounting for the nonlinear effects can lead to significant errors in the traction field, especially at the cell protrusions, highlighting the necessity of incorporating the nonlinear effects to accurately measure cellular tractions.
The 3D TFM approach was then used to recover tractions exerted by NIH 3T3 cells embedded within dextran-based hydrogel matrices with varying stiffness. The inclusion of the nonlinear effects in geometry, strain and material behavior allowed us to consistently evaluate mechanical quantities and fields that are biologically significant [61–63]. These include the unstressed state of the cell, the appropriate measures of stretch, and strain energy density in the gel. It was observed that the net cellular force increased with the gel stiffness, and the strain energy (or the mechanical work done by the cell) saturated with increasing gel stiffness.
We conclude by highlighting the distinctive features of the new 3D TFM technique. First, it consistently accounts for the complex geometry of the cells, the finite strains in the matrix, as well as the nonlinear elastic response of the matrix. For this reason, it is expected to yield accurate reconstruction of cellular tractions. Second, the TFM problem is solved in the stressed configuration of the matrix, where the cell geometry can be readily determined in experiments. This makes it applicable to a broad range of biological studies. Third, through the use of appropriately derived adjoint fields, the TFM problem can be solved efficiently. Thus, the TFM approach can be applied to large-scale problems with a large number of tracking beads, and it can reconstruct traction vectors on a well-resolved mesh on the cell surface (e.g., 103–104 grid points). Finally, by appropriately modifying the constitutive relation in Eq. (5), the TFM approach can be used to compute cellular tractions in any elastic materials. In particular, it is of great interest to measure tractions in fibrous ECMs such as collagen gels and matrigels, which necessitate more advanced constitutive models to incorporate ECM heterogeneity and anisotropy. A first step in that direction is provided by the recent work of Ref. [53], where a fiber-based homogenization model is employed to characterize the complex behavior of fibrous ECMs.
Acknowledgment
D. S. and A. O. wrote the article. D.S. and A.O. developed the computational formulation. D. S. and L. D. carried out all simulations. M. G., L. L., and C. S. C. performed experiments. O. K., A. L., and M. B. generated geometric models and finite element mesh. A. O. supervised the project.
This work was supported in part by the National Institutes of Health under Grant Number 1R41CA224898-01. Mukund Gupta, Linqing Li, and Christopher S. Chen also acknowledge support from the National Institutes of Health (EB00262), the NSF Science and Technology Center for Engineering MechanoBiology (CMMI-1548571), the Human Frontier Science Program (RGP0035/2016), and the Biological Design Center at Boston University. The authors declare no conflict of interest.
Appendix A. Weak Formulation of the Forward Problem
We solve the forward problem, as defined by Eqs. (1)–(5) in the main text, by means of the finite element method, which is based on the weak (or variational) formulation of the problem. The weak form may by derived by multiplying the equilibrium equation (Eq. (1)) and the incompressibility equation (Eq. (2)) with weighting functions, integrating over Ω, performing integration by parts on the former, and then imposing the traction boundary condition (Eq. (4)). In particular, the weak formulation of the forward problem can be stated as follows: find such that
| (A1) |
where
| (A2) |
| (A3) |
The function spaces , and in the above equations are defined as
| (A4) |
| (A5) |
| (A6) |
where L2 is the space of square-integrable functions, while H1 is the Sobolev space of square-integrable functions with square-integrable first derivatives.
The weak form (A1) may be discretized by selecting finite dimensional spaces and using Galerkin approach. This leads to a set of nonlinear algebraic equations for the displacement and pressure degrees-of-freedom that can be solved by means of the Newton–Raphson method. However, for incompressible materials, it is well known that the standard Galerkin method yields spurious oscillations in the pressure field and locking in the displacement field, unless very specific choices are made for the displacement and pressure function spaces. This restriction can be overcome by stabilizing the Galerkin formulation with residue-based terms [46]. In particular, the discrete stabilized Galerkin formulation is given by: find such that
| (A7) |
where the stabilization term is given by
| (A8) |
In the above expression, the subscript denotes the L2 inner product evaluated in the interior of the eth element, is the total number of the volume elements, and is the stabilization factor, where , he is the characteristic length of the eth element, and μ is the shear modulus of the hydrogel matrix at zero strain. In our numerical implementation, all the variables, including the displacement, pressure, and traction, are represented by bilinear finite element basis functions.
Appendix B. Gradient of the Objective Function
In the main text of the paper, the inverse problem for solving the traction field is formulated as a constrained minimization problem, where the objective function π in Eq. (7) is minimized by means of a gradient-based optimization technique. In this section, we evaluate the gradient of π with respect to the traction field by means of an efficient, adjoint-based strategy.
The gradient of the regularization term (the second term in Eq. (7)) is relatively easy to evaluate; however, the gradient of the displacement mismatch term (the first term in Eq. (7)) is challenging to compute, due to the implicit dependence of the displacement field u on the traction field t through the constraint of the forward problem (Eqs. (1)–(5), or equivalently, Eq. (A7)). This difficulty can be circumvented through the use of an appropriately chosen adjoint field, which is derived by constructing the Lagrangian of π. That is
| (B1) |
where it is recalled that , and . Note that plays the role of a Lagrange multiplier field.
Next, we define the variation of a functional in the usual way. That is, for a functional f(x) which depends on x, the variation in the direction of δx is given by
| (B2) |
Therefore, the variation of the Lagrangian L is given by
| (B3) |
Setting in Eq. (B3) yields an equation for , i.e.,
| (B4) |
The above equation is identical to Eq. (A7) and, thus, satisfies the forward problem. Making use of this condition in Eq. (B1), we have that , and hence .
Next, we examine the condition for which the expression of δL can be further simplified. In particular, we set to arrive at the equation
| (B5) |
where is the linearization of the left-hand side of Eq. (A7) with respect to , as given by
| (B6) |
In Eq. (B5), is the Dirac delta, where denotes the coordinate of the kth bead in the stressed configuration, is the measured displacement field in the hydrogel matrix. Making use of Eqs. (A2) and (A8), as well as of Eqs. (5) and (6), may be rewritten as
| (B7) |
where the fourth-order tensor is given by
| (B8) |
Here, is the left Green–Lagrange stretch tensor, is the trace of , δij is the Kronecker delta, and γ is the nonlinear parameter for the hydrogel matrix.
We remark that Eq. (B5) provides a well-posed linear problem for , where the left-hand side of this problem, Eq. (B7), is the adjoint of the linearized version of the original forward problem, Eq. (A7). For this reason, Eq. (B5) is referred to as the adjoint problem, and the adjoint field.
With given by the forward problem Eq. (B4) and given by the adjoint problem Eq. (B5), we have from Eq. (B3) that
| (B9) |
Appendix C. Calibration of the Material Parameters for Hydrogels
In this Appendix, we briefly describe the procedure for calibrating the two material parameters, μ and γ, for the dextran-based hydrogels used in this work.
The hydrogel is subjected to homogeneous simple shear deformation in the mechanical tests, and the deformation gradient may be written in the matrix form
| (C1) |
where s denotes the amount of shear. Making use of the modified Blatz model [29,43] in Eq. (5), we have that the simple shear stress is given by
| (C2) |
In the experiment, the storage modulus G of the hydrogel is recorded as a function of the amount of shear, so that
| (C3) |
We can then determine μ and γ by fitting to the experimental data G(s) using the Least-Squares Fitting package in matlab. For each gel stiffness, data for four independent mechanical tests were used for the curve fitting. Results for the experimental data, along with the curves of best fit, are displayed in Fig. 8. Note that for each gel stiffness, the infinitesimal-strain shear modulus, μ, is used in the linear elasticity model (LIN), see the dotted lines in Fig. 8.
Fig. 8.
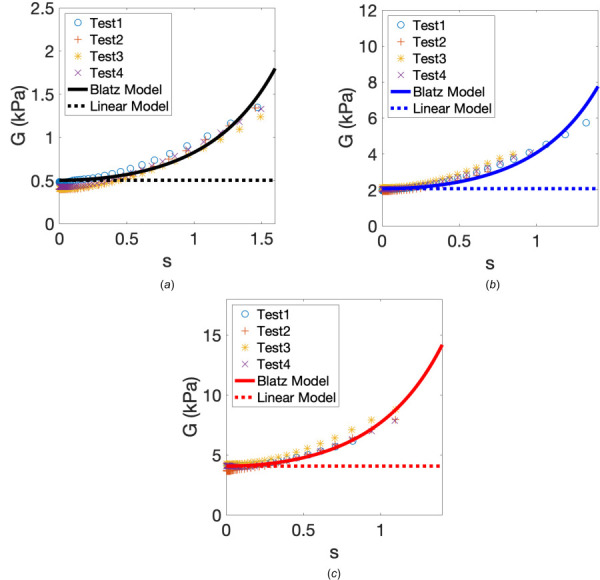
The storage modulus, G (in kPa), as a function of the amount of shear, s, for (a) soft, (b) medium, and (c) stiff gels. For each gel stiffness, data for four independent tests and the curve of the best fit are shown. Material parameters are as follows for each gel stiffness: (a) soft gel, kPa, ; (b) medium gel, kPa, ; (c) stiff gel, kPa, . The shear modulus μ used in the linear elasticity model (LIN) is also displayed for each gel stiffness.
Appendix D. Supplementary Figures
Fig. 9.
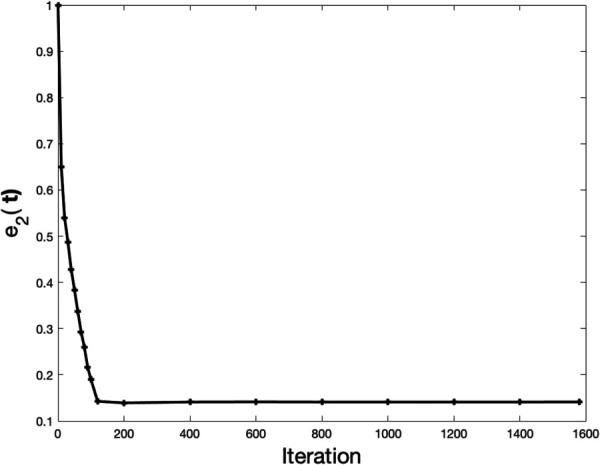
Microglial cell: the error ( defined by Eq. (9)) in the traction field as a function of iteration of optimization. Results are shown for NL-CUR and 1% noise. It can be seen that drops rapidly at the beginning, but changes slowly afterwards until convergence.
Fig. 10.
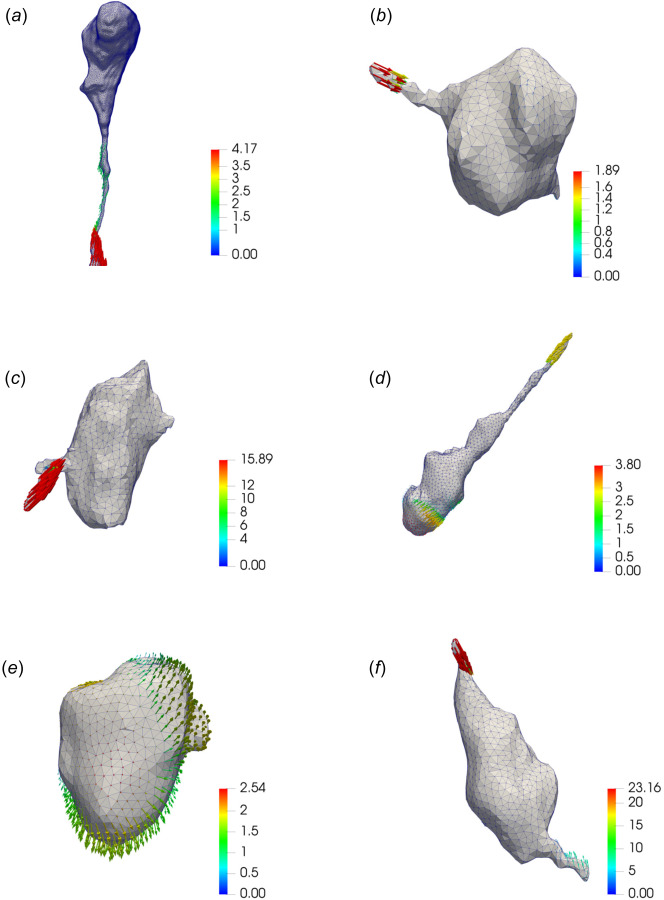
Recovered traction fields (in kPa) for NIH 3T3 cells fully encapsulated in the soft ((a) and (b)), medium ((c) and (d)), and stiff ((e) and (f)) dextran-based hydrogel matrices. All the results are obtained by means of the new TFM algorithm (NL-CUR).
Fig. 11.
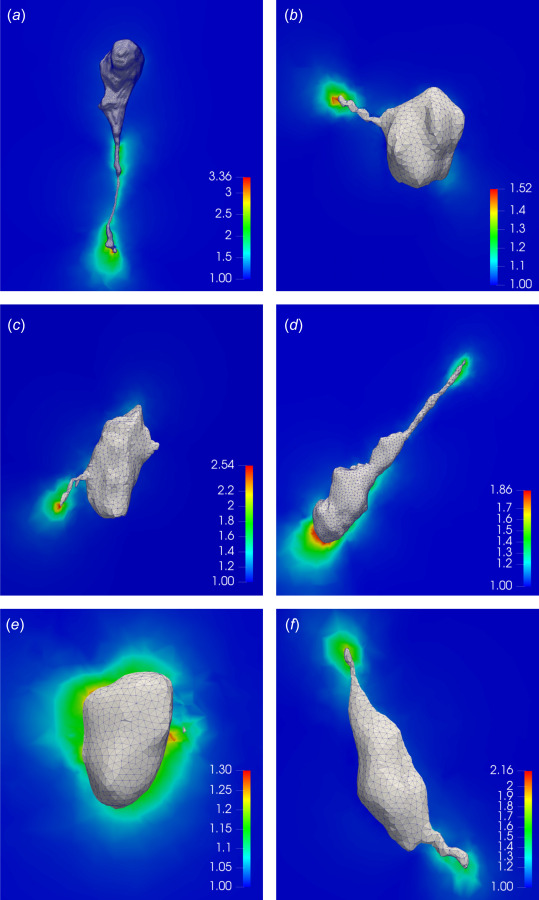
First principal stretch on the 2D cross sections of hydrogel matrices surrounding the NIH 3T3 cells. Results are shown for the soft ((a) and (b)), medium ((c) and (d)), and stiff ((e) and (f)) hydrogels. All the results are obtained by means of the new TFM algorithm (NL-CUR).
Fig. 12.
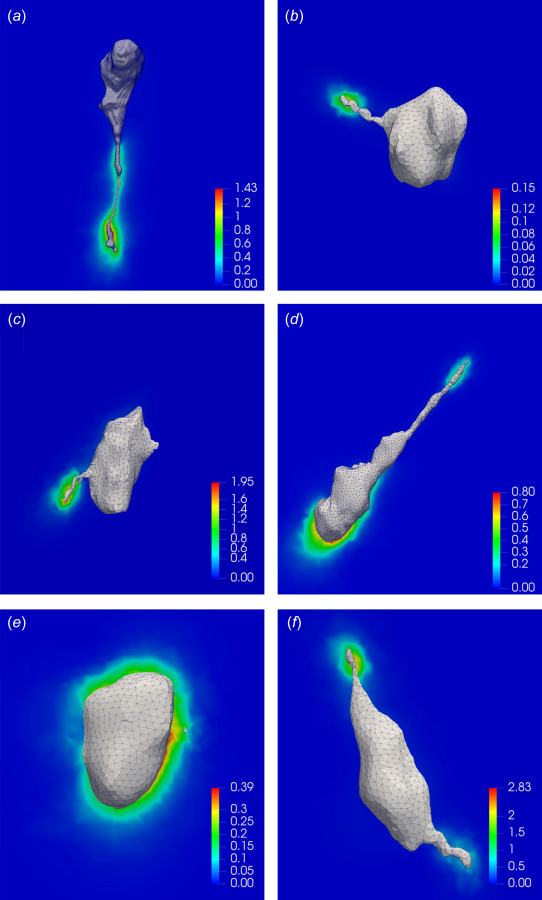
Strain energy density (in kPa) on the 2D cross sections of hydrogel matrices surrounding the NIH 3T3 cells. Results are shown for the soft ((a) and (b)), medium ((c) and (d)), and stiff ((e) and (f)) hydrogels. All the results are obtained by means of the new TFM algorithm (NL-CUR).
Fig. 13.
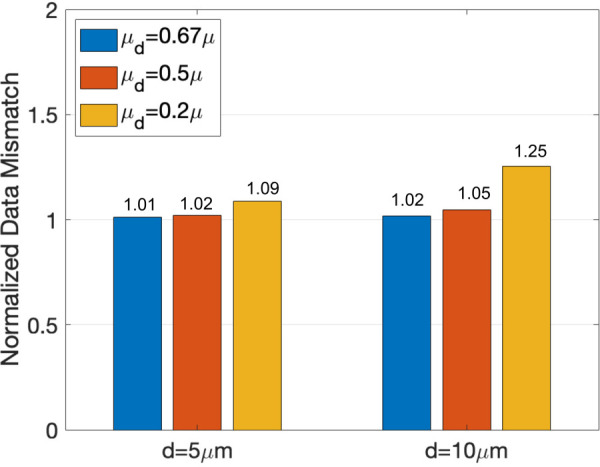
Sensitivity analysis of the displacement mismatch (see Eq. (7)) to hydrogel degradation. Representative results are shown for the 3T3 cell in Fig. 3(d). In particular, we allow for possible hydrogel degradation by setting the shear modulus (μd) of the hydrogel matrix within either or of the cell surface to 0.67×, , or that of the surrounding pristine matrix. We then solve the inverse problem for each of the above cases, and plot the associated displacement data mismatch (see Eq. (7)) normalized by that for a pristine matrix with no degradation. We find that all hydrogels with degradation lead to larger displacement data mismatch, indicating thereby that the measured displacement data are most consistent with the modulus of the pristine hydrogel.
Fig. 14.
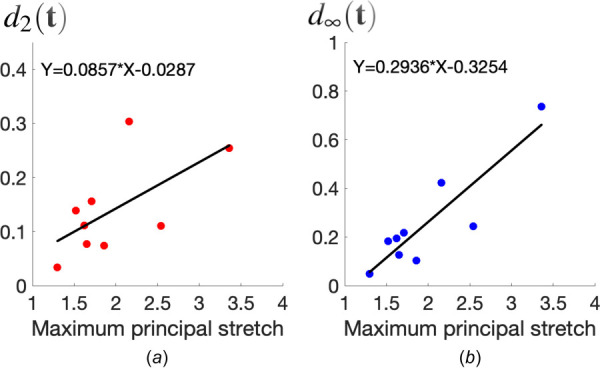
Difference between tractions recovered from NL-CUR and LIN for all the nine cells considered in this study. (a) Root-mean-square difference as a function of the maximum principal stretch in the ECM; (b) maximum local difference as a function of the maximum principal stretch in the ECM. We observe that these differences generally increase with the maximum principal stretch. Roughly speaking, when the maximum principal stretch is larger than 1.5, the difference between NL-CUR and LIN is found to be significant, with d2 greater than 10%, and greater than 20%.
Footnotes
Funding Data
National Institutes of Health (EB00262; Funder ID: 10.13039/100000002).
NSF Science and Technology Center for Engineering MechanoBiology (CMMI-1548571; Funder ID: 10.13039/100000001).
Human Frontier Science Program (RGP0035/2016; Funder ID: 10.13039/501100000854).
Biological Design Center at Boston University (Funder ID: 10.13039/100007161).
References
- [1]. Iskratsch, T. , Wolfenson, H. , and Sheetz, M. P. , 2014, “ Appreciating Force and Shape-the Rise of Mechanotransduction in Cell Biology,” Nat. Rev. Mol. Cell Biol., 15(12), pp. 825–833. 10.1038/nrm3903 [DOI] [PMC free article] [PubMed] [Google Scholar]
- [2]. Mui, K. L. , Chen, C. S. , and Assoian, R. K. , 2016, “ The Mechanical Regulation of Integrin–Cadherin Crosstalk Organizes Cells, Signaling and Forces,” J. Cell Sci., 129(6), pp. 1093–1100. 10.1242/jcs.183699 [DOI] [PMC free article] [PubMed] [Google Scholar]
- [3]. Huang, S. , Chen, C. S. , and Ingber, D. E. , 1998, “ Control of Cyclin d1, p27kip1, and Cell Cycle Progression in Human Capillary Endothelial Cells by Cell Shape and Cytoskeletal Tension,” Mol. Biol. Cell, 9(11), pp. 3179–3193. 10.1091/mbc.9.11.3179 [DOI] [PMC free article] [PubMed] [Google Scholar]
- [4]. Li, L. , Eyckmans, J. , and Chen, C. S. , 2017, “ Designer Biomaterials for Mechanobiology,” Nat. Mater., 16(12), pp. 1164–1168. 10.1038/nmat5049 [DOI] [PMC free article] [PubMed] [Google Scholar]
- [5]. Schwarz, U. S. , and Soiné, J. R. , 2015, “ Traction Force Microscopy on Soft Elastic Substrates: A Guide to Recent Computational Advances,” Biochim. Biophys. Acta, Mol. Cell Res., 1853(11), pp. 3095–3104. 10.1016/j.bbamcr.2015.05.028 [DOI] [PubMed] [Google Scholar]
- [6]. Koch, T. M. , Münster, S. , Bonakdar, N. , Butler, J. P. , and Fabry, B. , 2012, “ 3D Traction Forces in Cancer Cell Invasion,” PLoS One, 7(3), p. e33476. 10.1371/journal.pone.0033476 [DOI] [PMC free article] [PubMed] [Google Scholar]
- [7]. Hur, S. S. , del Alamo, J. C. , Park, J. S. , Li, Y.-S. , Nguyen, H. A. , Teng, D. , Wang, K.-C. , Flores, L. , Alonso-Latorre, B. , Lasheras, J. C. , and Chien, S. , 2012, “ Roles of Cell Confluency and Fluid Shear in 3-Dimensional Intracellular Forces in Endothelial Cells,” Proc. Natl. Acad. Sci., 109(28), pp. 11110–11115. 10.1073/pnas.1207326109 [DOI] [PMC free article] [PubMed] [Google Scholar]
- [8]. Style, R. W. , Boltyanskiy, R. , German, G. K. , Hyland, C. , MacMinn, C. W. , Mertz, A. F. , Wilen, L. A. , Xu, Y. , and Dufresne, E. R. , 2014, “ Traction Force Microscopy in Physics and Biology,” Soft Matter, 10(23), pp. 4047–4055. 10.1039/c4sm00264d [DOI] [PubMed] [Google Scholar]
- [9]. Mulligan, J. A. , Bordeleau, F. , Reinhart-King, C. A. , and Adie, S. G. , 2018, “ Traction Force Microscopy for Noninvasive Imaging of Cell Forces,” Biomechanics in Oncology, Springer, Berlin, pp. 319–349. 10.1007/978-3-319-95294-9_15 [DOI] [PMC free article] [PubMed] [Google Scholar]
- [10]. Polacheck, W. J. , and Chen, C. S. , 2016, “ Measuring Cell-Generated Forces: A Guide to the Available Tools,” Nat. Methods, 13(5), pp. 415–423. 10.1038/nmeth.3834 [DOI] [PMC free article] [PubMed] [Google Scholar]
- [11]. Tan, J. L. , Tien, J. , Pirone, D. M. , Gray, D. S. , Bhadriraju, K. , and Chen, C. S. , 2003, “ Cells Lying on a Bed of Microneedles: An Approach to Isolate Mechanical Force,” Proc. Natl. Acad. Sci., 100(4), pp. 1484–1489. 10.1073/pnas.0235407100 [DOI] [PMC free article] [PubMed] [Google Scholar]
- [12]. Grashoff, C. , Hoffman, B. D. , Brenner, M. D. , Zhou, R. , Parsons, M. , Yang, M. T. , McLean, M. A. , Sligar, S. G. , Chen, C. S. , Ha, T. , and Schwartz, M. A. , 2010, “ Measuring Mechanical Tension Across Vinculin Reveals Regulation of Focal Adhesion Dynamics,” Nature, 466(7303), pp. 263–266. 10.1038/nature09198 [DOI] [PMC free article] [PubMed] [Google Scholar]
- [13]. Oliver, T. , Jacobson, K. , and Dembo, M. , 1995, “ Traction Forces in Locomoting Cells,” Cell Motil. Cytoskeleton, 31(3), pp. 225–240. 10.1002/cm.970310306 [DOI] [PubMed] [Google Scholar]
- [14]. Dembo, M. , and Wang, Y.-L. , 1999, “ Stresses at the Cell-to-Substrate Interface During Locomotion of Fibroblasts,” Biophys. J., 76(4), pp. 2307–2316. 10.1016/S0006-3495(99)77386-8 [DOI] [PMC free article] [PubMed] [Google Scholar]
- [15]. Butler, J. P. , Tolic-Nørrelykke, I. M. , Fabry, B. , and Fredberg, J. J. , 2002, “ Traction Fields, Moments, and Strain Energy That Cells Exert on Their Surroundings,” Am. J. Physiol.: Cell Physiol., 282(3), pp. C595–C605. 10.1152/ajpcell.00270.2001 [DOI] [PubMed] [Google Scholar]
- [16]. Sabass, B. , Gardel, M. L. , Waterman, C. M. , and Schwarz, U. S. , 2008, “ High Resolution Traction Force Microscopy Based on Experimental and Computational Advances,” Biophys. J., 94(1), pp. 207–220. 10.1529/biophysj.107.113670 [DOI] [PMC free article] [PubMed] [Google Scholar]
- [17]. Wang, J. H. , and Lin, J.-S. , 2007, “ Cell Traction Force and Measurement Methods,” Biomech. Model. Mechanobiol., 6(6), pp. 361–371. 10.1007/s10237-006-0068-4 [DOI] [PubMed] [Google Scholar]
- [18]. Landau, L. D. , and Lifshitz, E. M. , 1959, Course of Theoretical Physics: Theory and Elasticity, Vol. 7, Pergamon Press, Oxford, UK. 10.1063/1.3057037 [DOI] [Google Scholar]
- [19]. Legant, W. R. , Choi, C. K. , Miller, J. S. , Shao, L. , Gao, L. , Betzig, E. , and Chen, C. S. , 2013, “ Multidimensional Traction Force Microscopy Reveals Out-of-Plane Rotational Moments About Focal Adhesions,” Proc. Natl. Acad. Sci., 110(3), pp. 881–886. 10.1073/pnas.1207997110 [DOI] [PMC free article] [PubMed] [Google Scholar]
- [20]. Franck, C. , Maskarinec, S. A. , Tirrell, D. A. , and Ravichandran, G. , 2011, “ Three-Dimensional Traction Force Microscopy: A New Tool for Quantifying Cell-Matrix Interactions,” PLoS One, 6(3), p. e17833. 10.1371/journal.pone.0017833 [DOI] [PMC free article] [PubMed] [Google Scholar]
- [21]. Toyjanova, J. , Bar-Kochba, E. , López-Fagundo, C. , Reichner, J. , Hoffman-Kim, D. , and Franck, C. , 2014, “ High Resolution, Large Deformation 3D Traction Force Microscopy,” PLoS One, 9(4), p. e90976. 10.1371/journal.pone.0090976 [DOI] [PMC free article] [PubMed] [Google Scholar]
- [22]. Cukierman, E. , Pankov, R. , Stevens, D. R. , and Yamada, K. M. , 2001, “ Taking Cell-Matrix Adhesions to the Third Dimension,” Science, 294(5547), pp. 1708–1712. 10.1126/science.1064829 [DOI] [PubMed] [Google Scholar]
- [23]. Zaman, M. H. , Kamm, R. D. , Matsudaira, P. , and Lauffenburger, D. A. , 2005, “ Computational Model for Cell Migration in Three-Dimensional Matrices,” Biophys. J., 89(2), pp. 1389–1397. 10.1529/biophysj.105.060723 [DOI] [PMC free article] [PubMed] [Google Scholar]
- [24]. Legant, W. R. , Miller, J. S. , Blakely, B. L. , Cohen, D. M. , Genin, G. M. , and Chen, C. S. , 2010, “ Measurement of Mechanical Tractions Exerted by Cells in Three-Dimensional Matrices,” Nat. Methods, 7(12), pp. 969–971. 10.1038/nmeth.1531 [DOI] [PMC free article] [PubMed] [Google Scholar]
- [25]. Hall, M. S. , Long, R. , Feng, X. , Huang, Y. , Hui, C.-Y. , and Wu, M. , 2013, “ Toward Single Cell Traction Microscopy Within 3D Collagen Matrices,” Exp. Cell Res., 319(16), pp. 2396–2408. 10.1016/j.yexcr.2013.06.009 [DOI] [PMC free article] [PubMed] [Google Scholar]
- [26]. Storm, C. , Pastore, J. J. , MacKintosh, F. C. , Lubensky, T. C. , and Janmey, P. A. , 2005, “ Nonlinear Elasticity in Biological Gels,” Nature, 435(7039), pp. 191–194. 10.1038/nature03521 [DOI] [PubMed] [Google Scholar]
- [27]. Yang, Y-L. , and Kaufman, L. J. , 2009, “ Rheology and Confocal Reflectance Microscopy as Probes of Mechanical Properties and Structure During Collagen and Collagen/Hyaluronan Self-Assembly,” Biophys. J., 96(4), pp. 1566–1585. 10.1016/j.bpj.2008.10.063 [DOI] [PMC free article] [PubMed] [Google Scholar]
- [28]. Bar-Kochba, E. , Toyjanova, J. , Andrews, E. , Kim, K.-S. , and Franck, C. , 2015, “ A Fast Iterative Digital Volume Correlation Algorithm for Large Deformations,” Exp. Mech., 55(1), pp. 261–274. 10.1007/s11340-014-9874-2 [DOI] [Google Scholar]
- [29]. Dong, L. , and Oberai, A. A. , 2017, “ Recovery of Cellular Traction in Three-Dimensional Nonlinear Hyperelastic Matrices,” Comput. Methods Appl. Mech. Eng., 314, pp. 296–313. 10.1016/j.cma.2016.05.020 [DOI] [Google Scholar]
- [30]. Cóndor, M. , and García-Aznar, J. , 2019, “ An Iterative Finite Element-Based Method for Solving Inverse Problems in Traction Force Microscopy,” Comput. Methods Programs Biomed., 182, p. 105056. 10.1016/j.cmpb.2019.105056 [DOI] [PubMed] [Google Scholar]
- [31]. Hall, M. S. , Long, R. , Hui, C.-Y. , and Wu, M. , 2012, “ Mapping Three-Dimensional Stress and Strain Fields Within a Soft Hydrogel Using a Fluorescence Microscope,” Biophys. J., 102(10), pp. 2241–2250. 10.1016/j.bpj.2012.04.014 [DOI] [PMC free article] [PubMed] [Google Scholar]
- [32]. Trappmann, B. , Baker, B. M. , Polacheck, W. J. , Choi, C. K. , Burdick, J. A. , and Chen, C. S. , 2017, “ Matrix Degradability Controls Multicellularity of 3D Cell Migration,” Nat. Commun., 8(1), p. 371. 10.1038/s41467-017-00418-6 [DOI] [PMC free article] [PubMed] [Google Scholar]
- [33]. Patterson, J. , and Hubbell, J. A. , 2010, “ Enhanced Proteolytic Degradation of Molecularly Engineered Peg Hydrogels in Response to MMP-1 and MMP-2,” Biomaterials, 31(30), pp. 7836–7845. 10.1016/j.biomaterials.2010.06.061 [DOI] [PubMed] [Google Scholar]
- [34]. Patterson, J. , and Hubbell, J. A. , 2011, “ Sparc-Derived Protease Substrates to Enhance the Plasmin Sensitivity of Molecularly Engineered Peg Hydrogels,” Biomaterials, 32(5), pp. 1301–1310. 10.1016/j.biomaterials.2010.10.016 [DOI] [PubMed] [Google Scholar]
- [35]. Yoon, C. , Choi, C. , Stapleton, S. , Mirabella, T. , Howes, C. , Dong, L. , King, J. , Yang, J. , Oberai, A. , Eyckmans, J. , and Chen, C. S. , 2019, “ Myosin Iia–Mediated Forces Regulate Multicellular Integrity During Vascular Sprouting,” Mol. Biol. Cell, 30(16), pp. 1974–1984. 10.1091/mbc.E19-02-0076 [DOI] [PMC free article] [PubMed] [Google Scholar]
- [36]. Piotrowski, A. S. , Varner, V. D. , Gjorevski, N. , and Nelson, C. M. , 2015, “ Three-Dimensional Traction Force Microscopy of Engineered Epithelial Tissues,” Tissue Morphogenesis, Springer, Berlin, pp. 191–206. [DOI] [PubMed] [Google Scholar]
- [37]. Yushkevich, P. A. , Piven, J. , Hazlett, H. C. , Smith, R. G. , Ho, S. , Gee, J. C. , and Gerig, G. , 2006, “ User-Guided 3D Active Contour Segmentation of Anatomical Structures: Significantly Improved Efficiency and Reliability,” Neuroimage, 31(3), pp. 1116–1128. 10.1016/j.neuroimage.2006.01.015 [DOI] [PubMed] [Google Scholar]
- [38]. Klaas, O. , Beall, M. W. , and Shephard, M. S. , 2013, “ Construction of Models and Meshes of Heterogeneous Material Microstructures From Image Data,” Image-Based Geometric Modeling and Mesh Generation, Springer, Berlin, pp. 171–193. 10.1007/978-94-007-4255-0_10 [DOI] [Google Scholar]
- [39]. Mangado, N. , Piella, G. , Noailly, J. , Pons-Prats, J. , and Ballester, M. Á. G. , 2016, “ Analysis of Uncertainty and Variability in Finite Element Computational Models for Biomedical Engineering: Characterization and Propagation,” Front. Bioeng. Biotechnol., 4, p. 85. 10.3389/fbioe.2016.00085 [DOI] [PMC free article] [PubMed] [Google Scholar]
- [40]. Beall, M. W. , and Shephard, M. S. , 1997, “ A General Topology-Based Mesh Data Structure,” Int. J. Numer. Methods Eng., 40(9), pp. 1573–1596. [DOI] [Google Scholar]
- [41]. O'Bara, R. M. , Beall, M. W. , and Shephard, M. S. , 2002, “ Attribute Management System for Engineering Analysis,” Eng. Comput., 18(4), pp. 339–351. 10.1007/s003660200030 [DOI] [Google Scholar]
- [42]. Rattan, S. , Li, L. , Lau, H. K. , Crosby, A. J. , and Kiick, K. L. , 2018, “ Micromechanical Characterization of Soft, Biopolymeric Hydrogels: Stiffness, Resilience, and Failure,” Soft Matter, 14(18), pp. 3478–3489. 10.1039/C8SM00501J [DOI] [PubMed] [Google Scholar]
- [43]. Goenezen, S. , Barbone, P. , and Oberai, A. A. , 2011, “ Solution of the Nonlinear Elasticity Imaging Inverse Problem: The Incompressible Case,” Comput. Methods Appl. Mech. Eng., 200(13–16), pp. 1406–1420. 10.1016/j.cma.2010.12.018 [DOI] [PMC free article] [PubMed] [Google Scholar]
- [44]. Govindjee, S. , and Mihalic, P. A. , 1996, “ Computational Methods for Inverse Finite Elastostatics,” Comput. Methods Appl. Mech. Eng., 136(1–2), pp. 47–57. 10.1016/0045-7825(96)01045-6 [DOI] [Google Scholar]
- [45]. Govindjee, S. , and Mihalic, P. A. , 1998, “ Computational Methods for Inverse Deformations in Quasi-Incompressible Finite Elasticity,” Int. J. Numer. Methods Eng., 43(5), pp. 821–838. [DOI] [Google Scholar]
- [46]. Klaas, O. , Maniatty, A. , and Shephard, M. S. , 1999, “ A Stabilized Mixed Finite Element Method for Finite Elasticity.: Formulation for Linear Displacement and Pressure Interpolation,” Comput. Methods Appl. Mech. Eng., 180(1–2), pp. 65–79. 10.1016/S0045-7825(99)00059-6 [DOI] [Google Scholar]
- [47]. Byrd, R. H. , Lu, P. , Nocedal, J. , and Zhu, C. , 1995, “ A Limited Memory Algorithm for Bound Constrained Optimization,” SIAM J. Sci. Comput., 16(5), pp. 1190–1208. 10.1137/0916069 [DOI] [Google Scholar]
- [48]. Oberai, A. A. , Gokhale, N. H. , and Feijóo, G. R. , 2003, “ Solution of Inverse Problems in Elasticity Imaging Using the Adjoint Method,” Inverse Probl., 19(2), pp. 297–313. 10.1088/0266-5611/19/2/304 [DOI] [Google Scholar]
- [49]. Gokhale, N. H. , Barbone, P. E. , and Oberai, A. A. , 2008, “ Solution of the Nonlinear Elasticity Imaging Inverse Problem: The Compressible Case,” Inverse Probl., 24(4), p. 045010. 10.1088/0266-5611/24/4/045010 [DOI] [Google Scholar]
- [50]. Vogel, C. R. , 2002, Computational Methods for Inverse Problems, Vol. 23, SIAM, Philadelphia, PA. 10.1137/1.9780898717570 [DOI] [Google Scholar]
- [51]. Picu, R. , Deogekar, S. , and Islam, M. , 2018, “ Poisson's Contraction and Fiber Kinematics in Tissue: Insight From Collagen Network Simulations,” ASME J. Biomech. Eng., 140(2), p. 021002. 10.1115/1.4038428 [DOI] [PMC free article] [PubMed] [Google Scholar]
- [52]. Lake, S. P. , and Barocas, V. H. , 2011, “ Mechanical and Structural Contribution of Non-Fibrillar Matrix in Uniaxial Tension: A Collagen-Agarose Co-Gel Model,” Ann. Biomed. Eng., 39(7), pp. 1891–1903. 10.1007/s10439-011-0298-1 [DOI] [PMC free article] [PubMed] [Google Scholar]
- [53]. Song, D. , Hugenberg, N. , and Oberai, A. A. , 2019, “ Three-Dimensional Traction Microscopy With a Fiber-Based Constitutive Model,” Comput. Methods Appl. Mech. Eng., 357, p. 112579. 10.1016/j.cma.2019.112579 [DOI] [PMC free article] [PubMed] [Google Scholar]
- [54]. Soiné, J. R. , Brand, C. A. , Stricker, J. , Oakes, P. W. , Gardel, M. L. , and Schwarz, U. S. , 2015, “ Model-Based Traction Force Microscopy Reveals Differential Tension in Cellular Actin Bundles,” PLoS Comput. Biol., 11(3), p. e1004076. 10.1371/journal.pcbi.1004076 [DOI] [PMC free article] [PubMed] [Google Scholar]
- [55]. Paszek, M. J. , Zahir, N. , Johnson, K. R. , Lakins, J. N. , Rozenberg, G. I. , Gefen, A. , Reinhart-King, C. A. , Margulies, S. S. , Dembo, M. , Boettiger, D. , Hammer, D. A. , and Weaver, V. M. , 2005, “ Tensional Homeostasis and the Malignant Phenotype,” Cancer Cell, 8(3), pp. 241–254. 10.1016/j.ccr.2005.08.010 [DOI] [PubMed] [Google Scholar]
- [56]. Discher, D. E. , Janmey, P. , and Wang, Y-L. , 2005, “ Tissue Cells Feel and Respond to the Stiffness of Their Substrate,” Science, 310(5751), pp. 1139–1143. 10.1126/science.1116995 [DOI] [PubMed] [Google Scholar]
- [57]. Wisdom, K. M. , Adebowale, K. , Chang, J. , Lee, J. Y. , Nam, S. , Desai, R. , Rossen, N. S. , Rafat, M. , West, R. B. , Hodgson, L. , and Chaudhuri, O. , 2018, “ Matrix Mechanical Plasticity Regulates Cancer Cell Migration Through Confining Microenvironments,” Nat. Commun., 9(1), p. 4144. 10.1038/s41467-018-06641-z [DOI] [PMC free article] [PubMed] [Google Scholar]
- [58]. Ghibaudo, M. , Saez, A. , Trichet, L. , Xayaphoummine, A. , Browaeys, J. , Silberzan, P. , Buguin, A. , and Ladoux, B. , 2008, “ Traction Forces and Rigidity Sensing Regulate Cell Functions,” Soft Matter, 4(9), pp. 1836–1843. 10.1039/b804103b [DOI] [Google Scholar]
- [59]. Tee, S.-Y. , Fu, J. , Chen, C. S. , and Janmey, P. A. , 2011, “ Cell Shape and Substrate Rigidity Both Regulate Cell Stiffness,” Biophys. J., 100(5), pp. L25–L27. 10.1016/j.bpj.2010.12.3744 [DOI] [PMC free article] [PubMed] [Google Scholar]
- [60]. Califano, J. P. , and Reinhart-King, C. A. , 2010, “ Substrate Stiffness and Cell Area Predict Cellular Traction Stresses in Single Cells and Cells in Contact,” Cell. Mol. Bioeng., 3(1), pp. 68–75. 10.1007/s12195-010-0102-6 [DOI] [PMC free article] [PubMed] [Google Scholar]
- [61]. Ron, A. , Azeloglu, E. U. , Calizo, R. C. , Hu, M. , Bhattacharya, S. , Chen, Y. , Jayaraman, G. , Lee, S. , Neves-Zaph, S. R. , Li, H. , Gordon, R. E. , He, J. C. , Hone, J. C. , and Iyengar, R. , 2017, “ Cell Shape Information is Transduced Through Tension-Independent Mechanisms,” Nat. Commun., 8(1), p. 2145. 10.1038/s41467-017-02218-4 [DOI] [PMC free article] [PubMed] [Google Scholar]
- [62]. McBeath, R. , Pirone, D. M. , Nelson, C. M. , Bhadriraju, K. , and Chen, C. S. , 2004, “ Cell Shape, Cytoskeletal Tension, and Rhoa Regulate Stem Cell Lineage Commitment,” Dev. Cell, 6(4), pp. 483–495. 10.1016/S1534-5807(04)00075-9 [DOI] [PubMed] [Google Scholar]
- [63]. Chen, C. S. , Mrksich, M. , Huang, S. , Whitesides, G. M. , and Ingber, D. E. , 1997, “ Geometric Control of Cell Life and Death,” Science, 276(5317), pp. 1425–1428. 10.1126/science.276.5317.1425 [DOI] [PubMed] [Google Scholar]


