

Abstract
Dusty convection, convective activity powered by radiative heating of dust, is a ubiquitous phenomenon in Mars’s atmosphere but is especially deep (that is, impactful on the middle atmosphere) and widespread during planet-encircling dust events (PEDE) that occur every few Mars Years (MY). Yet the relative roles of dusty deep convection and global dynamics, such as the principal meridional overturning cell (PMOC) and the radiative tides, in dust storm development and the vertical transport of dust and water are still unclear. Here, observations from the Mars Climate Sounder on board Mars Reconnaissance Orbiter (MRO-MCS) are used to study dusty deep convection and its impact on middle atmospheric water content during the MY 34 PEDE (commenced June 2018). Additional context is provided by MRO-MCS observations of the MY 28 PEDE (commenced June 2007). This investigation establishes that a few, localized centers of dusty deep convection in the tropics formed in the initial phases of both PEDE simultaneously with a substantial increase in middle atmospheric water content. The growth phase of the MY 34 PEDE was defined by episodic outbreaks of deep convection along the Acidalia and Utopia storm tracks as opposed to less episodic, more longitudinally distributed convective activity during the MY 28 PEDE. The most intense convection during both PEDE was observed in southern/eastern Tharsis, where MRO-MCS observed multiple instances of deep convective clouds transporting dust to altitudes of 70–90 km. These results suggest that Martian PEDE typically contain multiple convectively active mesoscale weather systems.
PLAIN LANGUAGE SUMMARY
Just as the heat released by condensing water vapor powers thunderstorms in Earth’s atmosphere, very dusty air heated by the Sun in Mars’s atmosphere can power dust clouds that tower many tens of kilometers. These dust towers are most common in Mars’s rare and impressive planet-encircling dust events, when dust is rapidly lifted from the surface and the planet’s atmosphere fills with a thick haze of dust. But the role of dust towers is unknown. In one view, dust towers randomly form from dust lifted by stronger trade winds in the dust event. In another view, the dust towers organize into a few hurricane-like storms that spread dust around the planet. Here we study the two most recent planet-encircling dust events in 2007 and 2018. We find that dust towers first form at the same time as a rapid increase in water at high latitudes observed early in each event. In the 2018 storm, dust tower forming weather systems initially formed near the Equator along low elevation pathways along which strong cold fronts in the northern hemisphere may have traveled. Dust towers east of Mars’s high Tharsis volcanoes were especially strong.
1. Introduction
When Mariner 9 arrived in Martian orbit in 1971, dust storms had obscured the surface of the planet with a nearly global haze of dust. Dust storms on Mars had been observed and recognized by telescopic observers since the late 19th century [Martin and Zurek, 1993], but the perspective provided by Mariner 9 from orbit underlined the extreme size and duration of what now are called planet-encircling dust events (PEDE).
In the wake of this Mars Year (MY) 9 PEDE (in the sense of Clancy et al. [2000]; Piqueux et al. [2015]), two major hypotheses were developed to explain the evolution and structure of PEDE. In the view of Gierasch and Goody [1973], PEDE were the Martian analog to terrestrial hurricanes, mesoscale vortices that grew by converting the solar radiation absorbed by dust into the kinetic energy of winds that mobilized more dust. Opposing that view was Leovy et al. [1973], which argued that the orientation of wind streaks observed in the wake of the MY 9 PEDE was consistent with dust lifting by an intensified, zonally symmetric planetary meridional overturning cell (PMOC) and zonal jets modulated by the radiative tides rather than by widespread mesoscale vortices. (Arguably, the relative emphasis on the tides as opposed to the mean PMOC distinguished the hypothesis of Leovy et al. [1973] from later hypotheses focused on dust storms originating from a state change to a more intense global circulation [e.g., Schneider, 1983] or from a global circulation primed by exchange between Mars’s reservoirs of orbital and rotational angular momentum [Shirley, 2017; Mischna and Shirley, 2017; Newman et al., 2019]). The hypotheses of Gierasch and Goody [1973] and Leovy et al. [1973] thus define the end members of thinking about the fundamental dynamical scale of PEDE (mesoscale vs. global) but both identify the feedback between radiative heating of dust and intensified winds/circulation as central to the phenomenon at that dynamical scale.
And just as these two hypotheses shaped the predictive models of the studies that introduced them, they still shape the terminology used when talking about the structure and development of PEDE and other large-scale dust storm activity. Some examples include “lifting center” [Liu et al., 2003], “(dusty) hurricane” [Leovy et al., 1973; Rafkin, 2009], “tidal gate” [Wang et al., 2003], and “intensified Hadley circulation [PMOC]” [Haberle, 1986]. And so the use of “lifting center” and “intensified Hadley circulation” by Basu et al. [2006] signified a compromise model in which a stronger global circulation helped an initial mesoscale circulation induce secondary mesoscale circulations elsewhere on the planet, grounded in the analysis by Strausberg et al. [2005] of the PEDE in MY 25 (2001).
The vertical velocities required by the dusty hurricane model of Gierasch and Goody [1973] (as named by Leovy et al. [1973]) were 0.05–0.2 ms−1. However, it is now increasingly recognized that Mars’s atmosphere generates a spectrum in horizontal and penetrative depth of mesoscale and microscale convective activity powered by the radiative heating of dust (hereafter dusty convection). Dusty convection is capable of vertical transport from the surface/out of the boundary layer to higher altitudes on timescales on the order of hours, that is, with vertical velocities > 1 ms−1. If this convection reaches the middle atmosphere (above 50 km), it is regarded as “deep” [Heavens et al., 2018; Heavens et al., 2019]. Early mesoscale modeling inspired the proposal of Rafkin [2003] that dusty convection above the boundary layer might play a comparable role in vertical mixing to the PMOC and eventually the proposal that the combined circulations of dusty convective structures were the PMOC [Rafkin, 2012].
The central element of the proposal of Rafkin [2003] is that dusty convection was analogous to moist convective “hot towers” in the Earth’s tropics [Riehl and Malkus, 1958] and therefore would be expected to generate structures in atmospheric constituents analogous to the minimum in moist static energy/local maximum in humidity in the tropical upper troposphere of the Earth. Detached layers of dust and water vapor in Mars’s atmosphere discovered in the succeeding decade [e.g., Heavens et al., 2011a; Maltagliati et al., 2011; Guzewich et al., 2013; Heavens et al., 2015] likely are the “hot tower”-generated structures predicted by Rafkin [2003]. Modeling by Spiga et al. [2013] of a local dust storm with cellular structure on 30 km scales observed by Määttänen et al. [2009] further argued that dust storms could be/contain mesoscale systems that rapidly transport dust and other constituents high above the boundary layer and even into the middle atmosphere. Parameterization within a GCM of convective transport in dust storms can reproduce the detached layering of dust in Mars’s atmosphere during southern spring and summer without a PEDE [Wang et al., 2018].
Mars’s putative “hot towers” are more than curiosities of its present day meteorology, they are a potential factor in Mars’s climate evolution during Amazonian time. It has been recently proposed that water vapor transported along with dust in deep convection within dust storms (and PEDE in particular) serves as a feedstock for hydrogen production by photolysis in the middle atmosphere, thereby enhancing hydrogen escape [Chaffin et al., 2017; Heavens et al., 2018]. If true, the details of dust storm organization and convective activity are important controls on the magnitude and spatial extent of water vapor transport into the middle atmosphere and the degree to which hydrogen escape/water loss from Mars is and has been enhanced by present and past dust storm activity.
The purpose of this study is to study the occurrence and evolution of dusty deep convection during a PEDE. We use MRO-MCS observations of the PEDE during MY 34 (hereafter 34P) to characterize the spatiotemporal variability of dusty deep convection, infer the organization of its associated mesoscale structures, and study its impact on the mixing of water into the middle atmosphere. Observations of the PEDE in MY 28 (hereafter 28P) will be used to support the analysis, but the primary focus will be 34P. Because visible imagery of dust storms tends to be analyzed as daily global maps by Earth date, we shall mostly discuss the evolution of the storm in the Earth calendar in the text, but we will provide conversions to Mars date at 12:00 UTC of the relevant Earth day for single dates or for 0:00 UTC of the first day to 23:59 UTC in the case of ranges. We also will refer to Mars date in the figures and figure captions.
2. Methods
2.1. Mars Reconnaissance Orbiter-Mars Climate Sounder Data
The primary data presented here are: (1) calibrated limb and off-nadir radiance observations in nine broadband channels ranging from the visible to the thermal infrared [McCleese et al., 2007] that can be referenced to altitude based on instrument pointing; (2) vertical temperature, dust opacity, and water ice opacity profiles (from the surface to 80 km) retrieved with version 5.2.4 (for 28P and MY 29–33) or 5.3.2 (for 34P) of the retrieval algorithm from a selection of nadir/off-nadir and limb observations by MRO-MCS [Kleinböhlet al., 2009, 2011, 2017], which can be referenced to pressure or altitude; and (3) retrieved surface temperature from MRO-MCS nadir/off-nadir measurements where available (not during 28P) [Kleinböhl et al., 2011]. MRO-MCS radiance and retrieval data is archived in NASA’s Planetary Data System (PDS) [MCS, cited 2019a,c]. Version 5.3.2 uses information from far-infrared channels in which dust is less opaque (Kleinböhl et al., Diurnal Variations of Dust during the Mars Year 34 Global Dust Event, submitted to J. Geophys Res. for this special issue). Elevation data and plotted altitude is relative to the Mars areoid, and is from the MRO-MCS retrieval product or the 16 point per degree map made from MGS-MOLA observations [Smith et al., 2003].
Observing nearly continuously since Ls= 111° of MY 28, MRO-MCS has observed the limb forward (mostly) or backward (rarely) in the track of MRO. MRO’s polar orbit has drifted between approximately 14:30 and 15:30 Local Solar Time (LST) at the Equator on the dayside during the course of its mission [Zurek and Smrekar, 2007]. MRO-MCS can look to either side and so during dedicated campaigns, it has observed about 90 minutes earlier or later in local time at the Equator than the MRO orbit [Kleinböhl et al., 2013]. MCS also made on-planet views at nadir and off-nadir geometries. Off-nadir views were made during 34P. No on-planet views were made during 28P.
The resolution of limb radiance observations is ≈ 5 km in the vertical. However, the horizontal resolution of a limb observation in the direction of pointing is potentially 200 km or longer, depending on the limb opacity [Kleinböhl et al., 2009]. MRO-MCS limb observations are typically made in sets of 8, in which individual observations are nominally spaced by ≈ 6 km but sets of observations can be spaced by varying distances. When plotting, radiance observations and retrievals will be interpolated but whitespace will be put over interpolations greater than 400 km, but note that structures less than 200 km in width will be under-resolved by limb observations in all circumstances.
When observing forward and in-track, the FOV of on-planet observations corresponds to an along-track resolution of ≈ 1 km in the nadir and ≈ 2.9 km at the center of the detector array at the nominal off-nadir observational angle of 8.9° below the limb (surface incidence angle of 67°), which is smeared to ≈ 6 km by spacecraft motion during the 2.048 s integration time of individual observations [Hayne et al., 2012; Bandfield et al., 2013; Hayne et al., 2014].
MRO-MCS retrievals can be used to estimate the dust mass mixing ratio (MMR), water ice MMR, and the total water content (ice + saturated vapor) [Heavens et al., 2010; Heavens et al., 2011a; Heavens et al., 2018]. Uncertainties in dust MMR are at the 10–20% level, while water ice MMR and water content are uncertain by a factor of two because of uncertainties in water ice particle size and (in the case of water content) temperature [Heavens et al., 2010, 2018]. Note that our technique for diagnosing total water content requires the presence of clouds [Heavens et al., 2018] and thus its coverage decreased as more of the atmosphere was heated to water vapor sub-saturation during the course of the PEDE [Vandaele et al., 2019].
Under high opacity conditions, where MRO-MCS retrievals typically do not meet quality control standards, radiance observations in the thermal infrared (converted here to brightness temperature) can be used to identify and study deep convective structures semi-quantitatively [Heavens et al., 2015; Heavens, 2017; Heavens et al., 2019]. The significance of individual channels and viewing geometries can be intuited from their use in the retrieval algorithm. Limb observations in channels A1–A3 (centered within the 15μm CO2 band at 16.5μm, 15.9μm, and 15.4μm) are used to retrieve temperature profiles at progressively higher altitudes between 20–80 km [McCleese et al., 2007; Kleinböhl et al., 2009], while on-planet views in these channels are sometimes used to retrieve near-surface atmospheric temperatures [Kleinböhl et al., 2011]. While A1–A3 are more transparent to aerosol than other parts of the thermal infrared spectrum, high amounts of aerosol in the limb may re-emit infrared radiation forward of the tangent point at higher altitude, producing anomalously cold or warm features, depending on the local thermal structure. Limb observations in channels A4 and A5 (centered at at 11.8μm, and 22.2μm, where sensitivity to gas absorption/emission is minimal) are used to retrieve vertical profiles of water ice and dust opacity [McCleese et al., 2007; Kleinböhl et al., 2009], while the on-planet views is the B1 channel (centered at 31.7μm, where gas sensitivity is minimal and aerosol sensitivity is much lower than in A4 and A5) is used to retrieve surface temperature [Kleinböhl et al., 2011]. A4 is sensitive to water ice, while both A4 and A5 are sensitive to dust. While the differential sensitivities of A4, A5, and B1 to surface temperature, dust, and water ice could enable dust and water column opacities to be retrieved from on-planet views, this idea is not currently incorporated into the retrieval algorithm.
It is also possible to use changes in dust MMR on nearly coincident orbits about a day apart and the accompanying temperature retrievals to estimate fast (sub-diurnal timescale) vertical dust fluxes, reported here as orbital averages corrected for meridional advection. (A correction for zonal advection is not feasible.) The vertical dust fluxes presented here differ from those presented in Heavens et al. [2018], because they do not correct for sedimentation in cases where there is no dust MMR observed at a particular altitude and latitude during either orbit. This modification eliminates an “echo” effect, where the brief appearance of large amounts of dust in one orbit results in estimating an artificially large vertical dust flux during the succeeding orbit.
These fluxes are designed to recover the vertical, non-local (in the sense of Rafkin [2012]) dust transport that occurs on timescales faster than the diurnal cycle, and thus they exclude contributions consistent with vertical eddy diffusivities less than 1–9 × 108 cm2 s−1, depending on altitude. These diffusivities are equal to or exceed the maximum values used by Conrath [1975] to model the decaying phase of the PEDE in 1971 and thus may exclude the effects of dust transport driven by a planetary circulation strengthened by the widespread dust heating.
When estimating dust fluxes, the dust retrievals were filtered to remove artifacts stemming from radiance leaking into the wings of instrument field of view at high altitude [Heavens et al., 2015; Heavens et al., 2018]. The same filter has been applied to all dust retrievals analyzed here. The filter is not perfect, so in one instance, such an artifact was excluded manually.
When dust injected into the middle atmosphere by deep convection is observed within a few hours of injection, the terminal velocity of the dust is a reasonable proxy for the convective velocity of injection [Heavens et al., 2019]. Following Heavens et al. [2011b], the terminal velocity (vt) of dust particles in the Martian atmosphere was estimated as:
| (1) |
where k is a proportionality constant of ≈ 15 kg m−3 s−1 and r is the radius of the dust particle. The effective radius of dust assumed is that assumed by the retrieval algorithm of MRO-MCS, 1.06 μm, which may underestimate dust size in the middle atmosphere during PEDE by up to a factor of 2 [Clancy et al., 2010, 2019]. And the retrieved temperature and pressure was used to estimate density, which can increase significantly in the middle and upper atmosphere during global dust storm activity [Withers and Pratt, 2013]. Thus, we will speak of vt levels and layers because Eq. 1 relates such levels and layers to those formed by contours in density or specific volume, such that the density scale height is the e-folding scale for vt. If the principal control on density is taken to be pressure, vt is also inversely proportionate to atmospheric mass above the vt surface, which is one factor in UV photolysis rates.
2.2. Identifying Dusty Deep Convection
Dusty convection is the rapid, efficient, vigorous overturning of the atmosphere required to neutralize an unstable distribution of density generated by shortwave heating of atmospheric dust [Heavens et al., 2019]. Dusty convection is defined as “deep” when it mixes significant dust into the middle atmosphere and/or above the climatological mean hygropause [Heavens et al., 2019] as opposed to dusty convection reaching lower altitudes, such as that associated with the climatological average detached dust layer called the High Altitude Tropical Dust Maximum [Heavens et al., 2011b; Wang et al., 2018].
Present understanding of dusty convection from the vertical dust distribution and other information is interpreted on the basis of two principles. First, a dust distribution with a local maximum above the surface (a detached dust layer, DDL) is evidence for localized convective mixing to the approximate altitude of the maximum [Rafkin, 2003, 2012]. Second, sub-diurnal timescale transport of dust to the middle atmosphere is also evidence for deep convective mixing.
Observational studies interpreted using these principles suggest that dusty deep convection is far more frequent and widespread during PEDE than any other circumstance [Heavens et al., 2015; Heavens et al., 2018]. Outside of PEDE and some regional dust storms, dusty deep convection is extremely rare [Heavens et al., 2015; Kleinböhl et al., 2015; Heavens et al., 2018; Clancy et al., 2019]. The exception is Tharsis. Outside of regional storms and PEDE, a dusty deep convective system forms in Tharsis in the season just after northern summer solstice one out of every eight sols (on average), one out of every twenty sols around northern autumnal equinox (the season when 34P commenced), and less than once every 60 sols around southern summer solstice (the season when 28P commenced) [Heavens et al., 2015].
The primary deep convective structure considered by the observational studies cited above are DDL with extreme properties, that is, DDL with a high dust MMR in the middle atmosphere. (For example, Heavens et al. [2015] defined extreme DDL as having a dust MMR of 47 ppm above 50 km altitude.) extreme DDL are interpreted as outflow from a “core”: a vertically deep structure containing high concentrations of dust and presumably associated with strong convective updrafts and downdrafts [Heavens et al., 2019]. Extreme DDL can be observed up to 3500 km from their cores [Heavens et al., 2015].
But the observational record of cores presents a paradox. Extreme DDL in Tharsis are more commonly associated with cores than extreme DDL during PEDE [Heavens et al., 2015]. The proposed resolution to this paradox is that cores are intense, surface-based convection, which is suppressed as a thick dust haze builds over the planet during a PEDE. However, heating associated with the dust storm reduces the stability between 20–50 km altitude, enabling sufficiently dusty, elevated airmasses to convect and form layers called “streamers” as they are horizontally advected by the wind [Heavens et al., 2019]. If true, streamers form because of the shortwave heating of atmospheric dust and mix into the middle atmosphere; they are just as much a type of dusty deep convection as the surface-based cores. But note that the potential importance of shortwave heating to vertical transport of DDL (extreme or otherwise) is not a novel idea [Spiga et al., 2013; Daerden et al., 2015].
In this study, the intensity of deep convection will be judged from: (1) sub-diurnal timescale vertical dust flux above vt = 0.1–0.3 ms−1 [e.g., Heavens et al., 2018]; (2) the vertical and horizontal distribution of dust above vt = 0.1 ms−1; (3) in map view by significant dust (opacity of 10−4 km−1 in the MRO-MCS A5 channel centered at 463 cm−1/22.2μm) above vt = 0.3 ms−1; and (4) in cross-sections of retrieved dust profiles by the magnitude of dust MMR and vt at which significant dust is observed. In the case of (4), DDL should be parallel to vt contours, streamers should cross vt contours but not originate from the surface, and cores should originate from the surface and cross vt contours.
These different forms of presentation (and differing vt and opacity thresholds) are chosen to enable as clear and efficient plotting of the data as possible rather than to ensure exact equivalence. It would be possible to construct something analogous to (2–4) from (1), but any such metric constructed from the vertical dust flux would not be able to be corrected for meridional advection and would be difficult to compare with observations from other spacecraft in the future. Plots of (2) may include dust opacity less than 10−4 km−1, but because these plots are made on a logarithmic scale, the results are not materially affected if dust opacities less than 10−4 km−1 are excluded.
The critical vt range of 0.1–0.3 ms−1 arises from the principle that any dust that reaches this atmospheric layer or above will leave it by sedimentation within a sol, because the ratio between the density scale height (8–10 km) and length of sol (88756 s) is ≈ 0.1 ms−1. This condition thus limits the timescale on which dust advected from elsewhere can affect the observation, though Heavens et al. [2015] suggests that the corresponding length scale can be up to 3500 km. Whether coincidentally or not, vt = 0.1 ms−1 also corresponds to an altitude near 50 km, and thus to the extreme DDL criterion of Heavens et al. [2015]; the approximate boundary between the lower and middle atmosphere; and a typical hygropause altitude in southern summer [Heavens et al., 2018].
At this range of vt, 10−4 km−1 will correspond to a dust MMR of approximately 11–33 ppm, which corresponds to visible column opacities of 1–3 for uniformly mixed dust. (See Heavens et al. [2011a,b] for the basic quantitative framework.) It also can be demonstrated from Heavens et al. [2011a,b] that daytime heating rates for dust in the tropical middle atmosphere at these mass mixing ratios will be 1.8 Kh−1–5.4 Kh−1, comparable in magnitude to middle atmospheric gas radiative and dynamical heating rates in a wide variety of conditions inside and outside dust storms [López-Puertas and López-Valverde, 1995; Medvedev and Hartogh, 2007; Kuroda et al., 2009]. Thus, dust identified as deep convective in origin should be a significant agent of direct radiative heating in daylit conditions.
3. Results
3.1. Global Evolution of the Event
Deep convective activity during 34P varied episodically on timescales of ≈ 1–3 weeks rather than increasing to a peak and then decreasing over the course of the event. This can be illustrated by the orbital-average vertical dust flux and water content, which have been plotted as two figures that cover overlapping periods and in which each bar of points corresponds to a single orbit. Fig. 1 focuses on the inception of the storm as observed on the dayside, while Fig. 1 covers the pre-storm state through the beginning of the decay of the event on both the dayside and the nightside.
Figure 1.

Temporal evolution of deep convective activity and middle atmospheric water content during Ls=185°–200° of MY 34 as measured by orbital average fast (sub-diurnal timescale) dust flux (kg m−2 s−1) and orbital average atmospheric total water content (ppmv) for the dayside (PM). Labeled black contours indicate the orbital average terminal velocity (ms−1).
During the first episode, significant vertical dust transport on the dayside crossed the critical 47 km altitude (the altitude criterion for extreme DDL: [Heavens et al., 2015]) and 0.1 ms−1 vt contour on 3 June 2018 (MY 34, Ls=186.77°) and peaked above the 0.3 ms−1 vt contour on 6 June (Ls=188.49°) (Figs. 1a and 2a) before decreasing somewhat by 10 June (Ls=190.81°). In the second episode, significant vertical dust transport on the dayside almost reached vt of 3 ms−1 on 11–13 June (Ls=191.10°–192.85°) before weakening to a level comparable to the beginning of the first stage about 15 June (Ls=193.73°). A third episode began on 17 June (Ls=194.90°), peaked on 23 June (Ls=198.44°) above vt=1 ms−1, and weakened until 2–4 July (Ls=203.51°–205.31°) (Figs. 1a and 2a). Deep convective activity in a fourth episode peaked about 9–10 July (Ls=207.73°–208.34°) above vt=1 ms−1 (Fig. 2a). Dust transport on the dayside thereafter remained below vt=0.3 ms−1, but a fifth episode may have peaked around 24 July (Ls=217.20°) (Fig. 2a). Because dusty deep convection is primarily driven by solar heating of dust, the temporal variability of vertical dust transport on the nightside is muted (Fig. 2b). Dust injected during the day has had several hours to settle before being observed at night and compared to the previous night’s dust to diagnose the flux.
Figure 2.

Temporal evolution of deep convective activity and middle atmospheric water content during Ls=180°–235° of MY 34 as measured by orbital average fast (sub-diurnal timescale) dust flux (kg m−2 s−1) and orbital average atmospheric total water content (ppmv) for the dayside (PM) and nightside (AM). Labeled black contours indicate the orbital average terminal velocity (ms−1).
Deep convective activity during 34P was not only episodically variable but also mainly was confined to longitudes that spanned about a third of the planet at any one time. Deep convective transport episodes apparent in the dayside flux analysis map well onto instances when large amounts of dust were observed in particular longitudinal bands at vt>0.1 ms−1 (Fig. 3a). Thus, the first episode took place near 0°–60° W, the second and third episodes near 90° W, the fourth episode peaked near 0° and 90° W, and the fifth seemed strongest somewhere between 60° E and 60° W (Fig. 3a). The spikiness of the dayside vertical dust flux in Figs. 1a and 2a is also a consequence of dust transport being confined to a single longitudinal band. Recall that each bar of points in Figs. 1a–b and 2a–d represents the average vertical dust flux or water content volume mixing ratio for a single orbit. So each spike indicates significant vertical dust transport on 3–4 of the 13 MRO orbits along which MRO-MCS observed, as opposed to all 13.
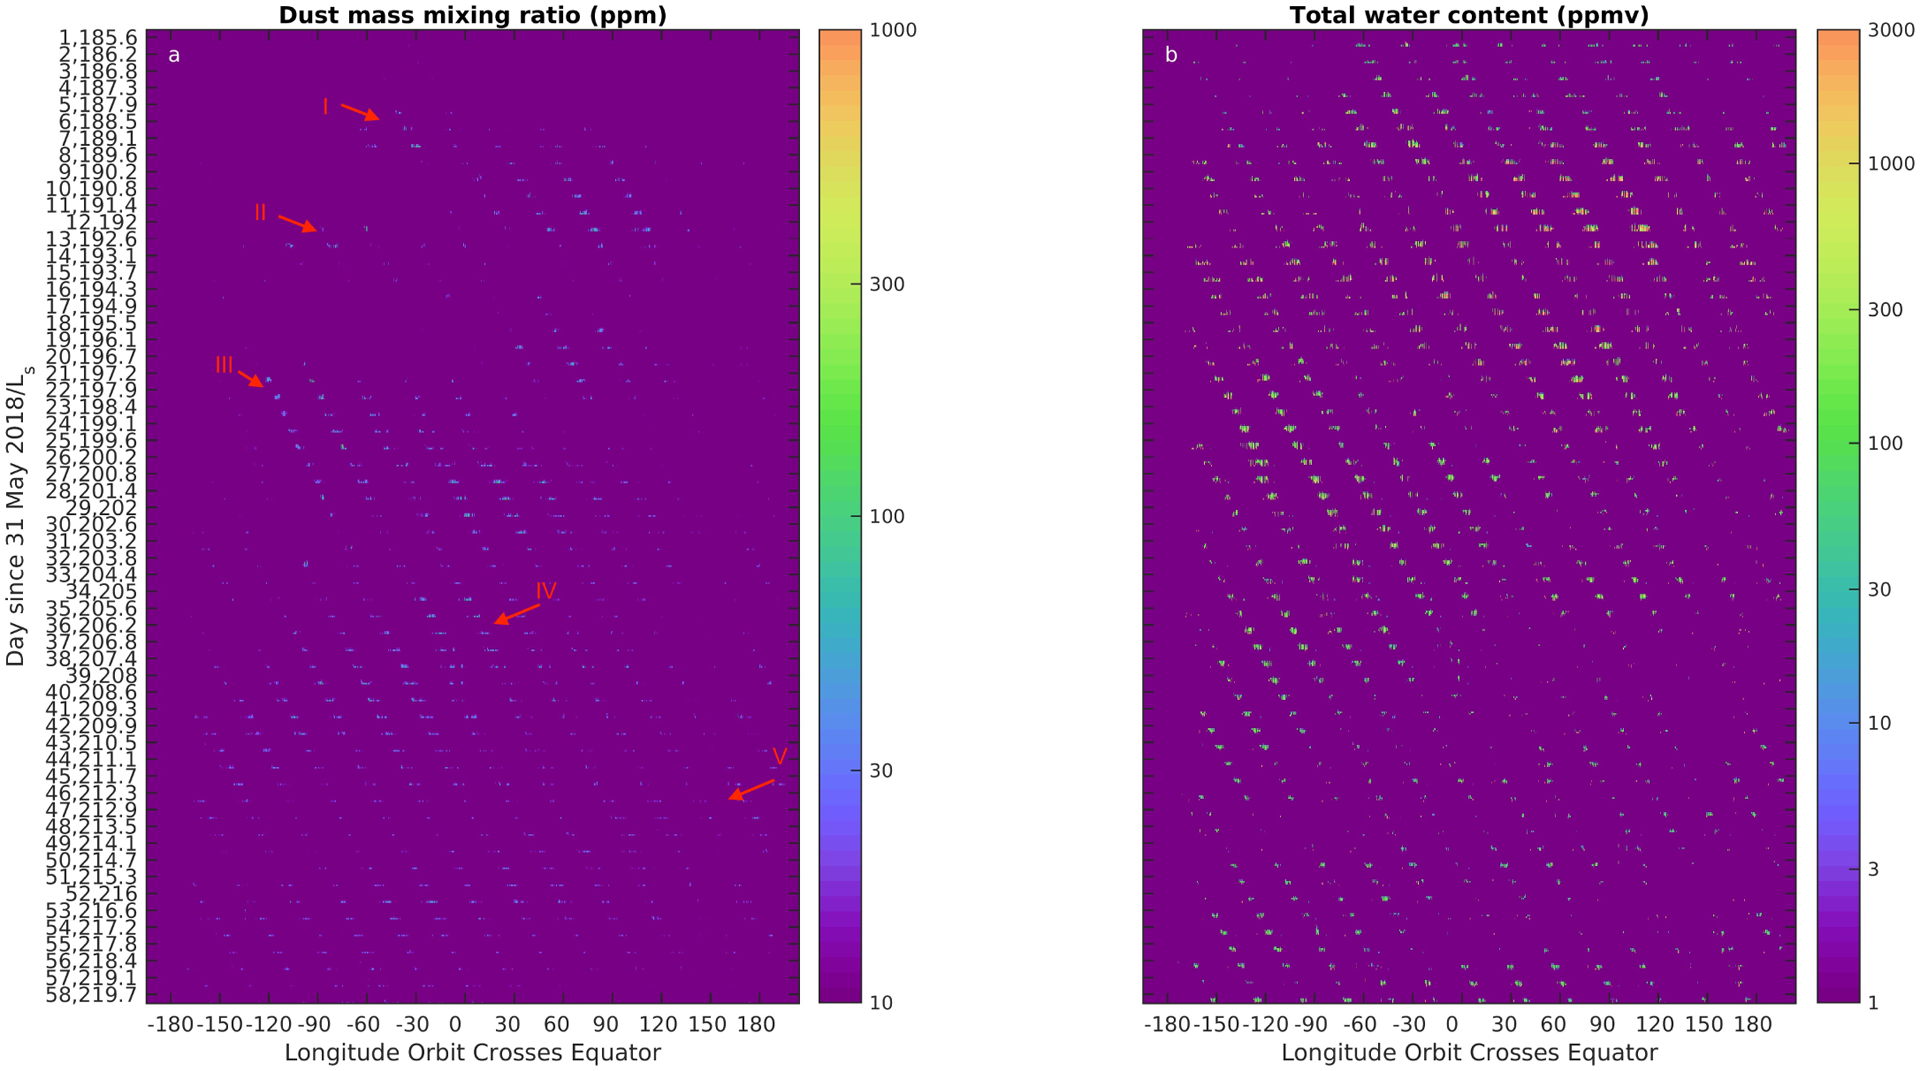
Figure 3.

Temporal and longitudinal evolution of dust MMR (ppm) and total water content (ppmv) on the dayside above the 0.1 ms−1 vt contour. Each plot is divided by Earth day since 31 May 2018 (MY 34, Ls=185.05°) into 58 divisions. In each division is plotted the relevant quantity (e.g., dust MMR) interpolated between vt =0.1 ms−1 and 10 ms−1 based on retrievals from in-track observations along each orbit on that Earth day. The data from each orbit is plotted so that data at the Equator is plotted at the central longitude at which in-track observations cross the Equator, more southerly data is plotted up to 10° west of the central longitude, and more northerly data is plotted up to 10° east of the central longitude. Binning of data in an individual orbit is at a resolution of 3° in latitude. Instances in (a) in which deep convection could propagate like a wave are numbered with red Roman numerals near their date and longitude of commencement. The inferred propagation direction is indicated with a red arrow. Portions of this figure are expanded in Figs. S1a–b to illustrate its construction.
Yet as these dust transport episodes peaked and then decayed at one longitude, there was weaker dust transport to the east during the first three episodes. If Fig. 3a is read as a Hovmöller [1949] diagram, it is as if deep convective activity was being excited by an eastward-propagating wave traveling 10–20 ms−1. Thereafter, the propagation direction of convective transport seems to shift westward during the fourth episode and a fifth episode difficult to identify in Fig. 2a (Fig. 3a). While high altitude dust observed on the nightside likely was injected during the day, the approximate pattern of dust variability above vt =0.1 ms−1 on the dayside was replicated at night (Fig. 4a).
Figure 4.
Temporal and longitudinal evolution of dust MMR (ppm) and total water content (ppmv) on the nightside above the 0.1 ms−1 vt contour. Each plot is divided by Earth day since 31 May 2018 (MY 34, Ls=185.05°) into 58 divisions. In each division is plotted the relevant quantity (e.g., dust MMR) interpolated between vt =0.1 ms−1 and 10 ms−1 based on retrievals from in-track observations along each orbit on that Earth day. The data from each orbit is plotted so that data at the Equator is plotted at the central longitude at which in-track observations cross the Equator, more southerly data is plotted up to 10° west of the central longitude, and more northerly data is plotted up to 10° east of the central longitude. Binning of data in an individual orbit is at a resolution of 3° in latitude. Instances in (a) in which deep convection could propagate like a wave are numbered with red Roman numerals near their date and longitude of commencement. The inferred propagation direction is indicated with a red arrow.
Middle atmospheric water content was significantly perturbed during the first convective episode. The hygropause and total water content near 50 km began to increase about 5 June 2018 (MY 34, Ls=187.92°) (Figs. 1b and 2c–d), when water content first increased to ≈ 300 ppmv around 0°–45° E (Fig. 3b). The longitudinal extent of ≈ 300 ppmv of water content peaked on 7 or 8 June (Ls=189.07° or 189.65°) and then again around 15 June (Ls=193.73°) (Fig. 3b). After about 20 June (Ls=196.67°), clouds (and thus water content as diagnosed here) below 50 km mostly disappeared (Figs. 2c–d) and water content above vt=0.1 ms−1 decreased as well on the dayside (Fig. 3b). Nevertheless, water content on the nightside above vt=0.1 ms−1 increased and the global mean nightside hygropause altitude peaked at 75 km around 29 June (Ls=202.01°) (Fig. 2d), suggesting the disappearance of clouds on the dayside probably did not result from reduced middle atmospheric water vapor concentrations. Nightside water content was distributed more widely in longitude than dust in the wake of the first two transport episodes and may have increased in magnitude or longitudinal extent in response to the other episodes (Fig. 4b).
In the following five subsections, we will consider the evolution of deep convection during 34P as distinct episodes delineated either by initiation in the west and propagation to the east, as in Fig. 3a, or by the variability in dayside dust flux (Fig. 2a), where the first definition is unworkable. In the remaining subsection, we will compare 34P with 28P.
3.2. Episode I: 4–11 June 2018 (MY 34, Ls =187.05°–191.68°)
Deep convective activity first initiated on 3–4 June (MY 34, Ls=186.48°–187.63°) (Fig. 1a). By 6–7 June (Ls=188.20°–189.36°), significant dust reached vt = 0.3 ms−1 in multiple areas of a region confined to 100°–20° W, 60° S–40° N (Fig. 5). Deep convective activity then remained at a lower level until an outbreak of activity on 11 June (Ls=191.39°) north of Hellas (Figs. 3a; 5), which is interpreted as the westernmost extent of the episode.
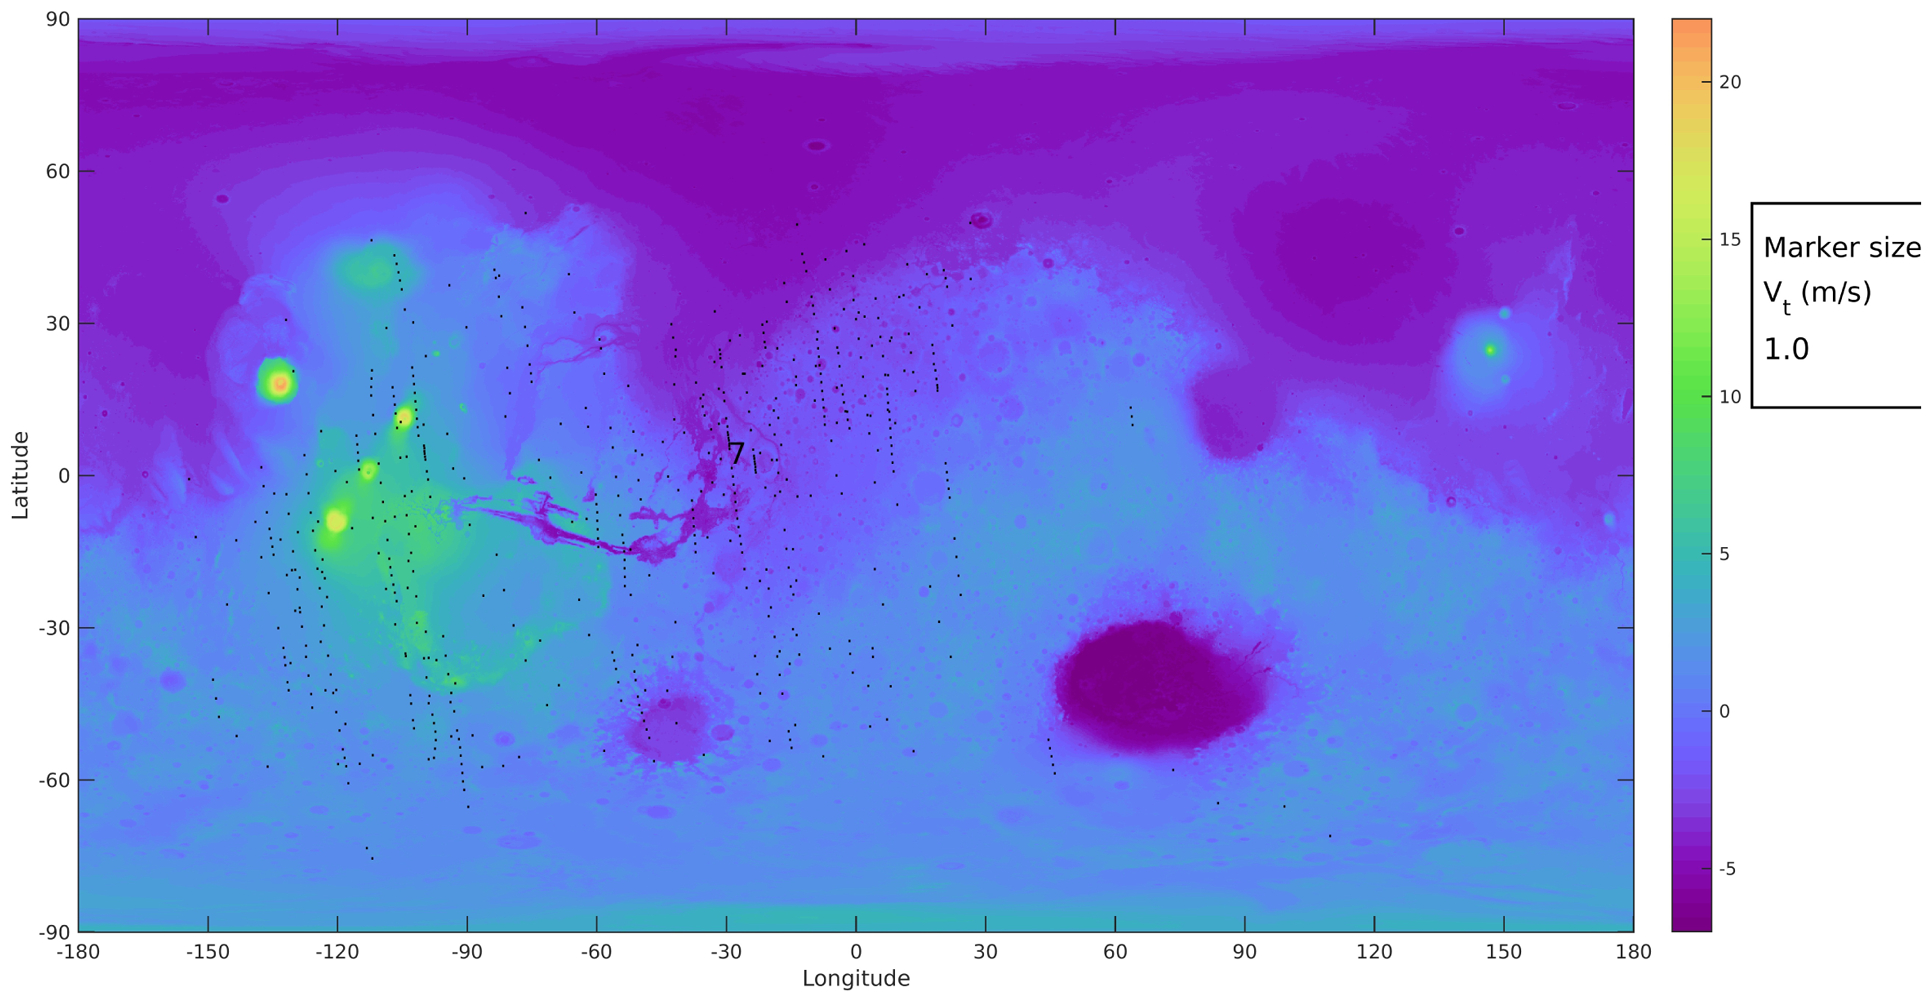
Figure 5.

Deep convective activity on the dayside (9–21 LST) during Episode I (4–11 June 2018; MY 34, Ls=187.05°–191.68°). The estimated vt at the highest altitude at which dust opacity is 104 km−1 sets marker size, while the day of June is indicated by marker number. Markers at vt < 0.3 ms−1 are not plotted. Color contours indicate surface elevation (km). The box to the left of the colorbar shows how the font size of markers changes across the dynamic range of vt plotted, rounded to the nearest 0.1 ms−1.
The strongest deep convective activity during Episode I was between Argyre and Eos Chasma (10°–40° S, 40° W) (Fig. 5). This activity peaked on 6 June (Ls=188.49°), when MRO-MCS observed a substantial DDL along the 0.1 ms−1 vt contour over the tropics and much of the extratropics (Fig. 6a). Near 20° S, 45 °W, dust MMR increased to 160 ppm and the layer bent to cross the 0.3 ms−1 vt contour, implying it was a streamer. A cross-track retrieval near 30 °S to the west of the cross-section in (Figs. 6a–d) showed there was significant dust at a vt of almost 0.5 ms−1 (Fig. 5). The temperature structure had an inversion at all observed latitudes, with warmer temperatures near the surface, decreasing temperature up to 30–40 km altitude, and temperature warming to 220 K up to 60 km altitude (Fig. 6b). Radiance observations showed features corresponding to the dust layering as well as possible heating above the streamer at 20° S and 75 km altitude (Figs. 6c–d).
Figure 6.

Cross-sectional views of deep convective activity from analysis of in-track retrievals and radiance observations (forward limb views) that crossed the Equator near 46° W, MY 34, Ls=188.62°, 15:30 LST (6 June 2018, 17:03–17:35 UTC): (a) Dust MMR (ppm, color contours) with vt (ms−1, red labeled contours; (b) Temperature (K, color contours) and locations where water content can be diagnosed (black crosses); (c) Brightness temperature in the dust-sensitive MRO-MCS A5 channel (K, color contours); (d) Brightness temperature in the temperature-sensitive MRO-MCS A3 channel (K, color contours). Note that the radiance observations have been over-interpolated at 1 km resolution to approximate the over-interpolation of the retrievals. Altitude is relative to the MOLA datum. The surface elevation has been plotted in panels (a) and (b) but is generally below 0 km.
Radiance observations also showed a very bright feature in A5 (brightness temperature > 190 K) that spanned the tropics and peaked at 35 km altitude just south of the Equator, that is, below the region where retrieval was successful, but was dimmer near 5° S (Fig. 6c). In A3, the latitude band occupied by this feature was dimmer than the surrounding environment (Fig. 6d). There was more brightness variability near the Equator in channels observing in more transparent portions of the 15 μm CO2 band (contrast the more opaque to CO2 A3 channel in Fig. 7c with the less opaque to CO2 A1 channel in Fig. 7a) as well as in the aerosol-sensitive A4 and A5 channels (Figs. 7d–f). The same was true in the corresponding off-nadir views (Figs. 7g–l), which indicated brightness temperature variations of 5–20 K over 4° of latitude.
Figure 7.

Cross-sectional views of deep convective activity from radiance observations along an orbit that crossed the Equator near 46° W, MY 34, Ls=188.62°, 15:30 LST (6 June 2018, 17:12–17:30 UTC): (a-f) Brightness temperature in forward limb views in the labeled MRO-MCS channels (K, color contours); (g-l) Brightness temperature (K) averaged over all detectors in off-nadir views in the MRO-MCS channels labeled in the panel in the row above. Retrieved surface temperatures are plotted along with the surface temperature-sensitive off-nadir B1 radiances in (l). Note that the forward limb views have been over-interpolated at 1 km resolution to approximate the over-interpolation of the retrievals. Altitude is relative to the MOLA datum.
The interpretation we draw from these observations is that the DDL and streamer were outflow from the 35 km altitude structure centered near 5° S, which may not have been observed where or when it was most intense. Off-nadir brightness temperatures were lowest in Figs. 7g–h,j–l, an indicator of low surface/boundary layer temperatures because of reduced sunlight at the surface. Surface temperature retrievals on the sides of the core mostly followed B1 brightness temperature, except near the Equator, indicating high aerosol opacity (Fig. 7l).
Therefore, the 35 km structure likely was a core: an organized deep convective system near the Equator much smaller in horizontal scale than its outflow in the middle atmosphere. The extent of middle atmospheric outflow may have resulted from intensification of the mean meridional circulation regionally rather than the mesoscale circulation of the core [Shirley et al., 2019]. The streamer could heat the atmosphere at 25 K/h, which if balanced by adiabatic cooling in the isothermal temperature region through which it passed, would have allowed it to ascend at a velocity of 1.5 ms−1.
The core was associated with colder surface and air temperatures below 20 km than the surrounding environment. This inference does not come from the cool limb brightness temperatures in the core, which likely indicate that the limb was so optically thick due to aerosol that atmospheric emission was being viewed forward of and thus at higher altitude than the tangent point (Figs. 7a–f). Nor does it come from retrieved surface temperature, which is not reported at or near 5° S and does not have a consistent trend toward 5° S in the reported surface temperatures (Fig. 7l). Instead, a significant surface temperature minimum at 5° S is implied by the consistency in the brightness temperature minima at 5° S between A4, A5, and B1 (Figs. 7j–l), which are sensitive to surface temperature but have varying transparency to dust (Fig. S2). The presence of a temperature minimum below 20 km is implied by the similarity in brightness temperature variability in A1 and A2 (Figs. 7g–h) with A4, A5, and B1. There is a brightness temperature minimum in A3 (Fig. 7i), but it is horizontally broader and weaker in magnitude than in the other channels. The brightness temperature variability to the north of 5° S also suggests there was some sort of horizontal banding in dust opacity and temperature within the structure.
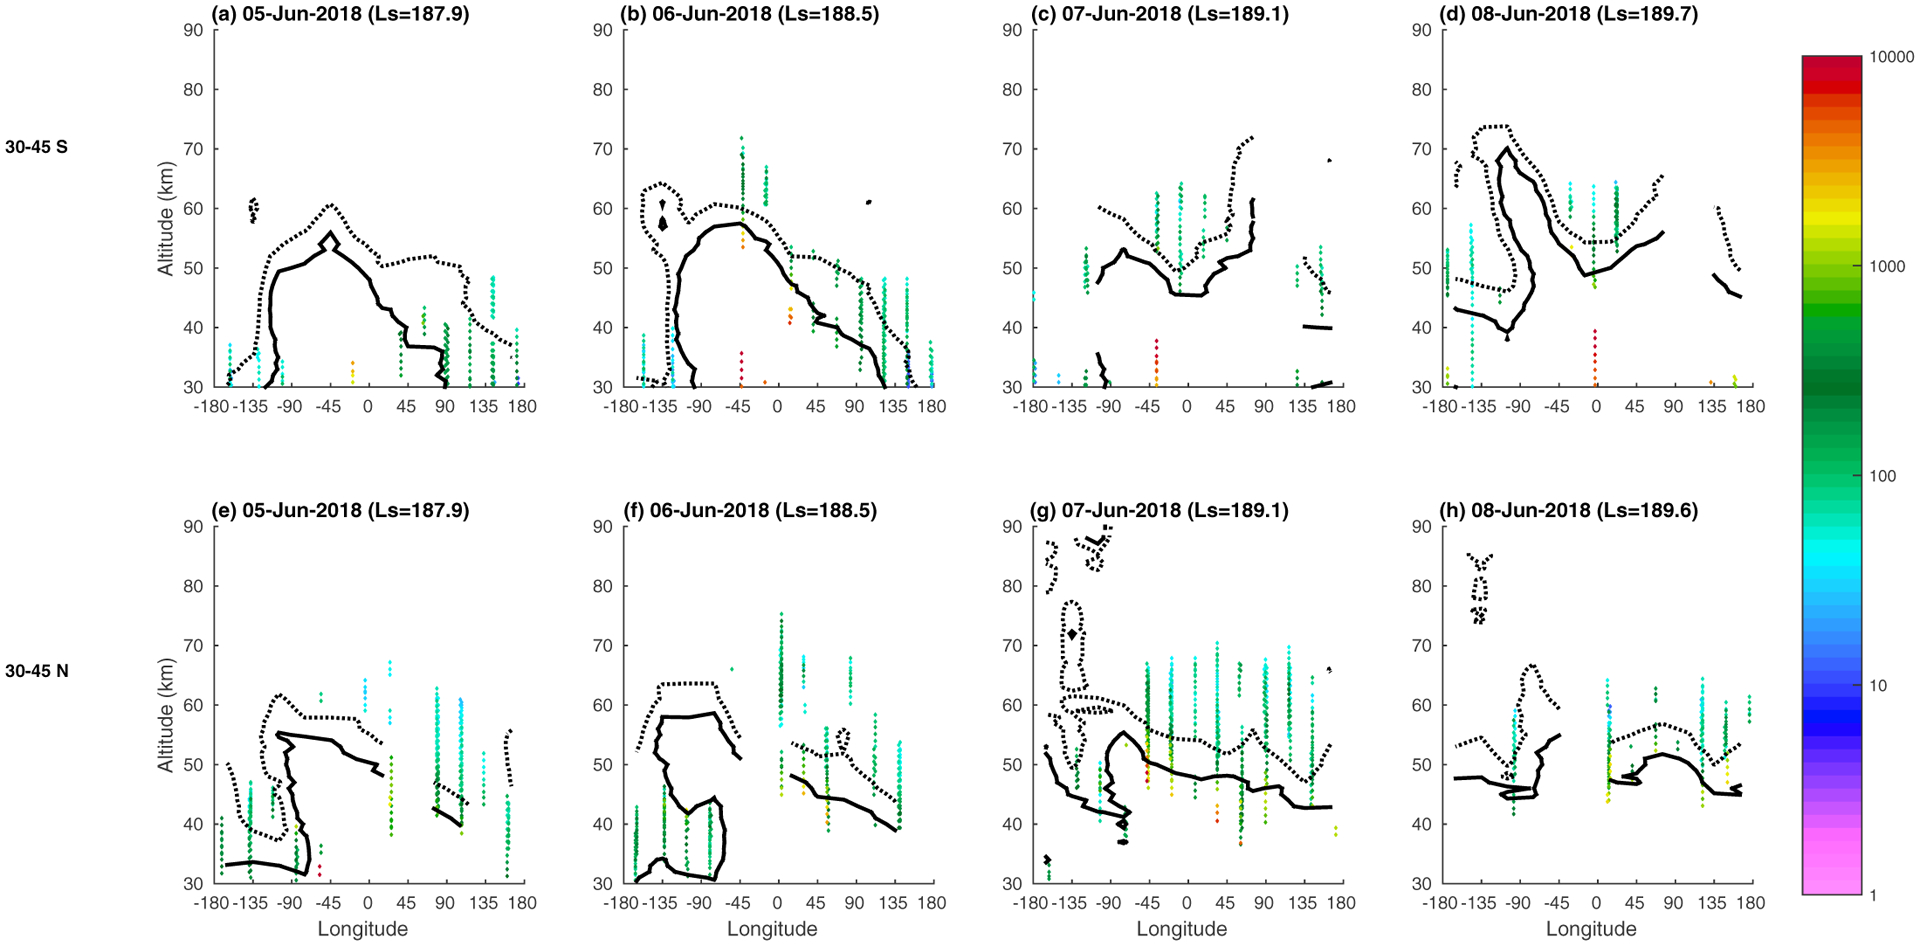
The vertical distribution of water changed synchronously with the convective activity during Episode I. On 3 June 2018 (MY 34, Ls=186.77°), the hygropause (as inferred from total water content) was approximately symmetric about the Equator, where it peaked at 55 km altitude on the dayside and the nightside (Figs. 8a and 9a). Thereafter on the nightside, atmospheric temperatures above 30 km warmed, total water content at 50 km increased, and the tropical hygropause gradually increased to 65 km (Figs. 9b–h). On the dayside, the tropical hygropause rose to 70 km; the hygropause between 30°–45° N rose from 40–70 km between 3–6 June (Ls=186.48°–188.78°); and the hygropause between 30°–45° S rose to 65 km between 6–8 June (Ls=188.20°–189.94°) (Figs. 9b–h). Poleward of 45° in both hemispheres, the hygropause was somewhat perturbed during Episode I, but the perturbation in the northern hemisphere had disappeared by 10 June despite minimal change in atmospheric temperature near 65 km altitude (Fig. 9h). However, temperatures at high northern and southern latitudes had warmed preferentially in the hemisphere centered on the prime meridian, which would explain the disappearance of water ice clouds (and the disappearance of water content inferred from water ice clouds) (Figs. 10a–h). Indeed, the observations reported by Vandaele et al. [2019] demonstrate substantial increases in middle atmospheric water vapor poleward of 60° in both hemispheres.
Figure 8.

Evolution of the vertical distribution of water on the dayside (9–21 LST) during Episode I. Colored markers indicate the estimated total water content (ppmv) for the day, latitude, and altitude marked. The 170 K and 180 K contours for zonal average temperature (K) are plotted with dotted and solid lines respectively.
Figure 9.

Evolution of the vertical distribution of water on the nightside (21–9 LST) during Episode I. Colored markers indicate the estimated total water content (ppmv) for the day, latitude, and altitude marked. The 170 K and 180 K contours for zonal average temperature (K) are plotted with dotted and solid lines respectively.
Figure 10.
Evolution of the longitudinal distribution of water on the dayside (9–21 LST) during Episode I. Colored markers indicate the estimated total water content (ppmv) for the day, longitude, and altitude marked in the latitude bands labeled on the left side of each row. The Ls in each panel label is the mean of the data used. The 170 K and 180 K contours for zonal average temperature (K) are plotted with dotted and solid lines respectively.
Along with the increase in the nightside hygropause during Episode I, water content at 50 km in the tropics increased from 50–100 ppmv to 1000 or even 10000 ppmv (Figs. 9a–h), which exceeds the best estimates of water vapor mixing ratios in the tropics by 1–2 orders of magnitude [McConnochie et al., 2018]. (A few values similarly high were diagnosed on the dayside in Figs. 8a–h.) We interpret these unrealistically high values of water content as overestimates of the saturation vapor pressure created by the transport of water ice clouds into areas too warm for clouds to condense. At 180 K, the vapor pressure over ice will change by a factor of 6–7 for a 10 K change in temperature in either direction [Murphy and Koop, 2005]. So if water ice forms on the dayside and is observed at night in a region even 20 K warmer before the water ice sublimates, water content errors of almost two orders of magnitude are possible. This kind of change could result from sedimentation of water ice particles and/or diurnal temperature changes resulting from the thermal tides. (Note the altitude change between the zonal mean 170 K and 180 K isotherms in Figs. 8a–h or Figs. 9a–h can be < 5 km.)
Increased vertical mixing of water during Episode I did not occur at all longitudes simultaneously and sometimes was associated with dusty deep convection. The hygropause between 30°–45° S was typically close to 40 km and no higher than 50 km on 5 June 2018 (MY 34, Ls=187.92°) (Fig. 10a). Yet on 6 June (Ls=188.49°), the hygropause near 45 ° W rose to 70 km (the apparent peak of deep convective activity during Episode I) and then relaxed to 65 km on the two succeeding days (Figs. 10b–d). Tracing the water content estimate to the retrieval confirms that there was a 190 ppm water ice cloud above, to the south of, and clearly separated from the dustiest part of the DDL associated with the convective system in Figs. 6–7. While not shown here for the sake of brevity, the activity north of Hellas on 11 June (Ls=191.39°) was capped by water ice clouds with MMRs up to 145 ppm. At 30°–45° N, the hygropause was already 65 km at longitudes distal from the Martian dateline on 5 June (Ls=187.92°), rose to 75 km near the prime meridian on 6 June, and then was uniformly at 60 km by 8 June (Ls=189.65°).
3.3. Episode II: 12–20 June 2018 (MY 34 Ls=191.68°–196.95°)
Deep convective activity in the western hemisphere re-initiated on 12 June 2018 (MY 34, Ls=191.98°) to the north of Argyre (30° S, 30° W) and on 13 June (Ls=192.56°) in Nilus (35° N, 60° W). Both of these areas had been active on 6 June (Ls=188.49°). In addition, a new, extremely intense area of deep convection was active on 12–14 June (Ls=191.68°–193.44°) in eastern Tharsis/western Valles Marineris (10° S, 100° W). All of this activity had weakened by 15 June (Ls=193.73°) (Fig. 11). Deep convective activity then re-initiated north of Hellas (30° S, 50° E) and developed in parts of Arabia Terra (10° N, 30° E) on 18 June. Another area of deep convective activity developed in Isidis (15° N, 90° E) on 19 June (Ls=196.08°) before weakening on 20 June (Ls=196.67°) to close the episode (Fig. 2a). With the exception of the activity near Tharsis, deep convection was associated with dust MMR similar to that in Episode I (< 150 ppm) in the form of DDL or streamers without a clear connection to high dust MMR at lower altitudes.
Figure 11.

Deep convective activity on the dayside (9–21 LST) during Episode II (12–20 June 2018; MY 34 Ls=191.68°–196.95°). The estimated vt at the highest altitude at which dust opacity is 10−4 km−1 sets marker size, while the day of June is indicated by marker number. Markers at vt < 0.1 ms−1 are not plotted. Color contours indicate surface elevation (km). The box to the left of the colorbar shows how the font size of markers changes across the dynamic range of vt plotted, rounded to the nearest 0.1 ms−1.
The most intense deep convection of 34P was observed in eastern Tharsis during Episode II on 12–13 June 2018 (MY 34, Ls=191.68°–192.85°) in the form of cores that penetrated deeply into the middle atmosphere. Retrieved dust MMRs of 400–600 ppm were observed near the Equator at altitudes of up to 75 km and vt > 1 ms−1 (e.g., Fig. 12a). Note that significant dust at higher latitudes was confined below 40–50 km (vt< 0.1 ms−1), demonstrating that deep convective activity was localized near the Equator. This column of dusty air was associated with extremely high temperatures, particularly on 13 June (Ls=192.56°), when retrieved temperatures at 65 km altitude near the Equator peaked near 220 K (40–50 K higher than on the dayside at all other longitudes). Limb radiance observations in comparison with the retrievals suggest that the positive temperature anomaly associated with the dust heating (and possibly the dust itself) might have reached > 90 km altitude (Figs. 12a–d; 13a–d). But the feature was less pronounced in A5 and B1, which could suggest the updraft had weakened and dust had settled from the highest altitude it reached (Figs. 13e–f). Limb radiances dimmed below 40 km near the Equator, suggesting aerosol concentrations there were higher than the surrounding environment. The core observed on the previous day was shallower (Figs. S3a–f).
Figure 12.

Cross-sectional views of deep convective activity from analysis of in-track retrievals and radiance observations (forward limb views) that crossed the Equator near 98° W, MY 34, Ls=192.28°, 15:30 LST (13 June 2018, 00:30–01:12 UTC): (a) Dust MMR (ppm, color contours) with vt (ms−1, red labeled contours; (b) Temperature (K, color contours) and locations where water content can be diagnosed (black crosses); (c) Brightness temperature in the dust-sensitive MRO-MCS A5 channel (K, color contours); (d) Brightness temperature in the temperature-sensitive MRO-MCS A3 channel (K, color contours). The color scale in the brightness temperature plots matches the color scale in Figs. 7a–f, but the 140 K brightness temperature contour is plotted with a red dotted line to emphasize the vertical extent of the core; Note that the radiance observations have been over-interpolated at 1 km resolution to approximate the over-interpolation of the retrievals. Altitude is relative to the MOLA datum. The surface elevation has been plotted in panels (a) and (b).
Figure 13.

Cross-sectional views of deep convective activity from radiance observations along an orbit that crossed the Equator near 98° W, MY 34, Ls=192.28°, 15:30 LST (13 June 2018, 00:30–01:12 UTC): (a-f) Brightness temperature in forward limb views in the labeled MRO-MCS channels (K, color contours). The scale matches the color scale in Figs. 7a–f, but the 140 K brightness temperature contour is plotted with a red dotted line to emphasize the vertical extent of the core; (g-l) Brightness temperature (K) averaged over all detectors in off-nadir views in the MRO-MCS channels labeled in the panel in the row above. Retrieved surface temperatures are plotted along with the surface temperature-sensitive off-nadir B1 radiances in (l). Note that the forward limb views have been over-interpolated at 1 km resolution to approximate the over-interpolation of the retrievals. Altitude is relative to the MOLA datum.
The sign of the thermal contrast between the core and the surrounding environment below 40 km is unclear. On one hand, off-nadir observations showed negative brightness temperature anomalies near the Equator indicative of cooler surface and air temperatures below 20 km than the surrounding environment (Figs. 13g–l). On the other hand, retrieved surface temperatures increased toward the center of the off-nadir B1 brightness temperature minimum (Fig. 7l), implying surface temperatures and aerosol opacity (presumably dust) were both increasing toward the center of the core. The apparent contradiction could be resolved if either the core below 20 km was a temperature minimum but surrounded by a ring of warm air, or there was so much dust opacity that A1, A4, A5, and B1 lost sensitivity to surface temperature and were only sensitive to anomalously cool atmosphere above an anomalously warm surface.
The vertical distribution of total water content was distributed more evenly in longitude during Episode II than Episode I (Fig. 3b) but otherwise did not change significantly. The altitude of the tropical hygropause varied between 60–70 km, while hygropause altitude was much lower in the mid–high latitudes (Fig. 14). Yet clouds appear below the polar warming at these latitudes near the 170 K isotherm, so significant water is likely present at higher altitude, as suggested by the observations of Vandaele et al. [2019]. The deep convective activity in eastern Tharsis reached so high an altitude and was associated with air so warm that any water ice cloud formation that resulted from it likely would have been unobservable by MRO-MCS.
Figure 14.

Evolution of the vertical distribution of water on the dayside (9–21 LST) during Episode II (12–20 June; MY 34 Ls=191.68°–196.95°). Colored markers indicate the estimated total water content (ppmv) for the day, latitude, and altitude marked. The 170 K and 180 K contours for zonal average temperature (K) are plotted with dotted and solid lines respectively.
3.4. Episode III: 21 June–3 July 2018 (MY 34, Ls=196.96°–204.71°)
During Episode III, deep convective activity of an intensity similar to that observed in areas other than eastern Tharsis during Episodes I and II was observed throughout the tropics and mid-latitudes, more commonly near Tharsis and less commonly to the west of Tharsis and east of Hellas (Fig. 15). Stronger deep convective activity was concentrated around the Tharsis Montes and Alba Patera on multiple, non-consecutive days. Isolated activity of this intensity was observed elsewhere (Fig. 15). Like Episodes I and II, lower intensity convective activity evolved episodically eastward, starting near 90° W on 22 June 2018 (MY 34, Ls=197.85°) and reaching 90° E around 28 June (Ls=201.42°) (Fig. 3a).
Figure 15.

Deep convective activity on the dayside (9–21 LST) during Episode III (21 June-3 July 2018; MY 34, Ls=196.96°–204.71°). The estimated vt at the highest altitude at which dust opacity is 10−4 km−1 sets marker size for vt > 1 ms−1 and the marker is the day of June or July corresponding to the observation. Instances where vt > 0.3 ms−1 are marked with a dot. Color contours indicate surface elevation (km). The box to the left of the colorbar shows how the font size of markers changes across the dynamic range of vt plotted, rounded to the nearest 0.1 ms−1.
While deep convection was more widespread during Episode III than any other time during 34P, the top of the dust over roughly half the planet was at or below vt=0.1 ms−1 on any given day (Figs. 16a–d). Elsewhere, dust was observed at higher altitude/vt, particularly in the Northern Hemisphere.
Figure 16.

Deep convective activity on the dayside from retrievals from forward limb observations (near 15:30 LST) during Episode III (21 June-3 July 2018; MY 34, Ls=196.96°–204.71°). Dust MMR (ppm, color contours) for all orbits and latitudes between 60° S and 60° N on the labeled day is interpolated on vt and plotted. The retrievals are spaced by retrieval number so that variations in orbit length indicate fewer or greater successful retrievals. Red vertical lines indicate the approximate boundaries between orbits. Black vertical lines indicate the Equator and are labeled with the east longitude where the orbit crosses the Equator. The latitude or latitudinal range where dust MMR > 400 ppm are indicated with red labels. The locations of the profiles are plotted in map view in Fig. S4.
The most interesting structure on each day sampled in Fig. 16 was observed in the orbit nearest 105° W or the orbit to the west. On 22 June 2018 (MY 34, Ls=197.85°), there was extremely dusty air (> 400 ppm) near this longitude in the southern tropics that appears to have formed into a streamer moving horizontally northwest and vertically to vt > 1 ms−1 (Fig. 16a). On 26 June (Ls=200.22°), the dust was bilobally distributed along the meridian (Fig. 16b). This distribution of dust was somewhat mirrored by the distribution of dust along the orbit to the west, where there were two distinct DDL above the typical dust top in less convectively active areas of the planet (Fig. 16b). On 28 June (Ls=201.42°), there was again extremely dusty air near 105° W in the southern mid-latitudes that appears to have formed a streamer to the north (Fig. 16c). (This feature also was present in east-looking limb views from the next orbit.) A similar structure was observed on 3 July (Ls=204.41°) near 104° W, though the dustiest air was just north of the Equator at the northern edge of the streamer (Fig. 16d).
That the dustiest air observed during Episode III was in southeastern Tharsis and was likely advected to the north and northwest suggests that the deep convective activity over Tharsis Montes and Alba Patera inferred from Fig. 15 were probably streamers from a long-lived area of deep convective activity in southeastern Tharsis rather than deep convective activity centered where dust was observed at the highest vt. It is difficult to identify other centers of convective activity during Episode III, except perhaps for one near the prime meridian in the northern tropics on 28 June 2018 (MY 34, Ls=201.42°) (Figs. 15, 16c), where dust was almost vt = 1 ms−1 on two successive orbits (centered at 7 ° E and 20 ° W) and then lower in the two subsequent orbits. Additional non-uniformity in the vertical dust distribution of the middle atmosphere could be observed in the deep convectively active areas of the planet in Fig. 15. For example, DDL above vt = 0.1 ms−1 were observed near 24 ° W and 36 ° E on 22 June (Ls=197.85°) (Fig. 16a); and near 49 ° W and near 87 ° E on 3 July (Ls=204.41°) (Fig. 16d).
If deep convective activity persisted in a single location throughout Episode III, the center of this activity could be constrained by off-nadir radiance observations. We therefore analyzed radiance observations from the lowermost detector in each channel, which should observe the shortest atmospheric path and thus have the greatest contribution (if any) from the surface. The resulting analysis shows that the area to the southeast of the Tharsis Montes was the global maximum in dayside brightness temperature during Episode III in all thermal infrared channels except A3 (Figs. 17a–h). (Note that A2, A4, B2, and B3 are not shown for brevity.) Brightness temperatures in these channels were also high on Olympus Mons and the Tharsis Montes themselves. These volcanoes rise above the bulk of the global dust haze and so radiance contributions from their warm surfaces are expected [see Wilson and Richardson, 2000]. Nightside radiance observations show a negative brightness temperature anomaly in the thermal infrared channels other than A3 southeast of the Tharsis Montes, particularly in B1 (Fig. S5).
Figure 17.

Lower atmospheric temperature anomaly in southeastern Tharsis during Episode III (21 June–3 July; MY 34, Ls=196.96°–204.71°): (a-d) Mean brightness temperature (K) of dayside off-nadir views for the lowest viewing detector in the labeled channels binned at 2° × 2° resolution. Temperatures less than the minimum of the corresponding temperature scale or empty bins are plotted in the darkest purple color: (e-h) Brightness temperature (K) of dayside off-nadir views for the lowest viewing detector in the labeled channels (dots) plotted on MOLA topography contoured every 2 km, starting at 10 km to emphasize high topography. Temperatures less than the minimum of the corresponding temperature scale are not plotted.
The positive brightness temperature anomaly southeast of the Tharsis Montes coincided with a positive anomaly in retrieved surface temperature there (Fig. 18c–d). Surface temperatures peaked at 262 K, 10–30 K warmer than all other longitudes at the same latitude band, but there was a 20 K range in variability near 105° W (not including an outlier at 232 K) (Fig. 18c) Such an anomaly is climatologically unusual and was not observed in MY 29–33 (see examples in Figs. 18a–b).
Figure 18.
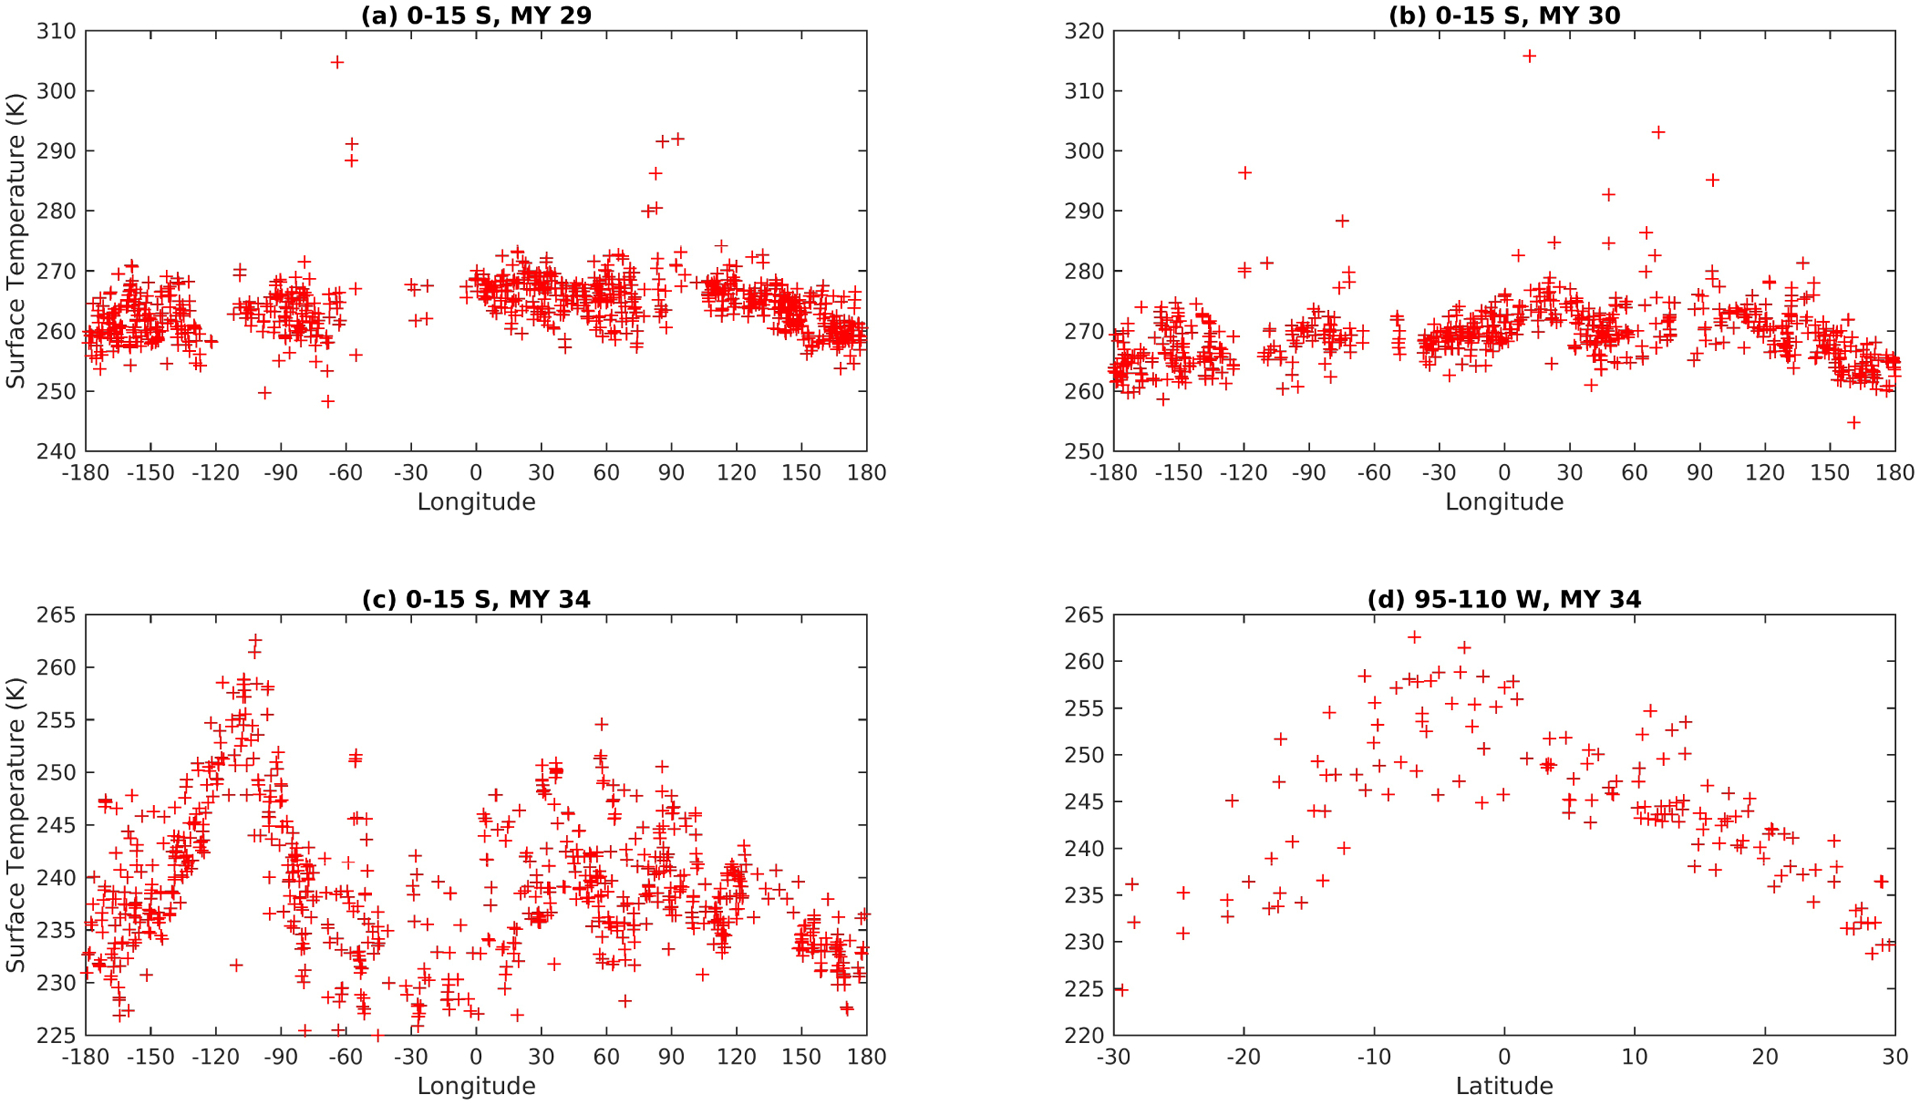
(a-c) Retrieved surface temperatures in the labeled latitude or longitude range vs. longitude or latitude during the Ls range corresponding to Episode III (MY 34, Ls=196.9623°–204.7123°) at 14–16 LST during the labeled Mars Years.
Fig. 18c also establishes the credibility of the surface temperature retrievals under all but the dustiest conditions, where the quantity is simply not reported. Surface temperatures at the longitude of the Mars Science Laboratory Curiosity (5° S, 137° E) were approximately 240 K, consistent with what was observed by Curiosity at this time [Guzewich et al., 2019]. Visible column opacity at Curiosity was > 6 at this time.
The anomalous warmth in surface temperature and brightness temperature in channels other than A3 southeast of the Tharsis Montes suggests there was very warm air within the first 10 km of the surface (elevation relative to the areoid of 7 km). If there were warm air much higher than this, there would be an anomaly in A3; the warm surface of Olympus Mons at 21 km is evident in Fig. 17b. Exact constraints would require radiative transfer modeling beyond the scope of this study.
The most likely explanation for the anomalous warmth here is that the area is, at times, unusually clear of dust. Atmospheric clarity would explain why peak surface temperatures are close to the 260–270 K range typical in this area during MY 29 and MY 30 (Figs. 18–b). Atmospheric clarity would explain why peak B1 brightness temperatures (259 K) are close to peak surface temperatures (262 K). Finally, atmospheric clarity would explain both the positive and negative temperature anomalies. A surface below a transparent atmosphere will warm rapidly during the day and cool rapidly to space during the night. The variability in surface temperature near 105° W in 18c) suggests that the area was not always clear but often was encroached upon by the extremely dusty air observed near 105° W in Figs. 16a,b,d. Therefore, it appears as if the clearest and dustiest airmasses in the low-mid latitudes during Episode III were in the same part of Mars.
In possible response to widespread and more persistent convection, the vertical distribution of water changed somewhat during Episode III. Where it can be diagnosed on the dayside (primarily in the southern tropics and northern tropics/mid-latitudes), the hygropause increased from 70 km to 75–80 km (Fig. 19). The first hint of this change is on 22–23 June 2018 (MY 34, Ls=197.55°–198.74°), when the hygropause increased to 75–80 km in the southern tropics. This perturbation in the hygropause initially was confined mostly to 69°–125° W (Figs. S6b,g). Water content on the nightside increased at these longitudes as well (Fig. 4), but the nightside hygropause altitude remained at 65–70 km throughout the period, coinciding with a temperature structure that may have been the cold phase of a diurnal or semidiurnal tide (Fig. S7).
Figure 19.

Evolution of the vertical distribution of water on the dayside (9–21 LST) during a portion of Episode III (21–29 June 2018; MY 34, Ls=196.96°–204.71°). Colored markers indicate the estimated total water content (ppmv) for the day, latitude, and altitude marked. The 170 K and 180 K contours for zonal average temperature (K) are plotted with dotted and solid lines respectively.
3.5. Episode IV: 4–15 July 2018 (MY 34, Ls=204.71°–211.99°)
The spatial extent and intensity of deep convective activity broadly weakened during Episode IV. Most deep convective activity was confined to the hemisphere from 130° W–50°E, and almost of all of this activity mixed significant dust below vt= 1 ms−1 (Fig. 20). The one exception was a small DDL (MMR up to 90 ppm) at 65 km above a broad dusty airmass (MMRs up to 100 ppm at 37 km) over Chryse and eastern Valles Marineris (Fig. 20). Nevertheless, the dust distribution in this orbit and adjoining orbits was similar to that seen in convectively active areas outside of Tharsis during Episode III. In addition, the vertical dust flux analysis shows that convective mixing of dust increased and then decayed to a level slightly above Episode I at the end of the episode (Fig. 2a).
Figure 20.
Deep convective activity on the dayside (9–21 LST) during Episode IV (4–15 July 2018; MY 34, Ls=204.71°–211.99°). The estimated vt at the highest altitude at which dust opacity is 10−4 km−1 sets marker size for vt > 1 ms−1 and the marker is the day of June or July corresponding to the observation. Instances where vt > 0.3 ms−1 are marked with a dot. Color contours indicate surface elevation (km). The box to the left of the colorbar shows how the font size of markers changes across the dynamic range of vt plotted, rounded to the nearest 0.1 ms−1.
3.6. Episode V: 16–29 July 2018 (MY 34, Ls=211.99°–220.60°)
Deep convective activity entirely disappeared during Episode V. While some dust remained above vt=0.1 ms−1 (Fig. 3a), the dust opacity contour of 10−4 km−1 stayed below this level everywhere, such that a figure like Fig. 20 would be completely empty. The convective dust fluxes after this point (Fig. 2a) likely were the result of zonal advection and/or minor streamers.
At the end of the episode, there was a break in MRO-MCS observations. After observations resumed, dust fluxes above vt=0.1 ms−1 were minimal, and the hygropause on the nightside had decreased in altitude by ≈ 10 km (Figs. 2a–b,d). The hygropause on the dayside decreased in altitude by 10 km around 16 August 2018 (MY 34, Ls=231.53°) (Figs. 2c).
3.7. Comparison with 28P
Convective activity was less episodic and longitudinally focused during 28P than 34P. After the initial episode of convection began on 24 June 2007 (MY 28, Ls=263.72°), convective activity peaked on 29 June (Ls=266.88°) and remained at that level until 11 July (Ls=274.42°) (when significant flux reached vt=1 ms−1 (Figs. 21a–b). Convective activity then began to decay by 28 July (Ls=284.98°). Dust above the vt=0.1 ms−1 level was confined to 0°–90° W during the initial episode. But the direction of travel of any putative convection-exciting waves is ambiguous (Fig. 22a). The convective episode of 11 July (Ls=274.42°) may have propagated westward after initiating near 60° E (Fig. 22a). However, besides these episodes, moderate amounts of dust were present at all longitudes above the vt=0.1 ms−1 level (Fig. 22a).
Figure 21.

Temporal evolution of deep convective activity and middle atmospheric water content during 28P as measured by orbital average fast (sub-diurnal timescale) dust flux (kg m−2 s−1) and orbital average atmospheric total water content (ppmv) for the dayside (PM) and nightside (AM). Labeled black contours indicate the orbital average terminal velocity (ms−1).
Figure 22.

Temporal and longitudinal evolution of dust MMR (ppm) and total water content (ppmv) on the dayside above the 0.1 ms−1 vt contour. Each plot is divided by Earth day since 20 June 2007 (MY 28, Ls=260.56°) into 58 divisions. In each division is plotted the relevant quantity (e.g., dust MMR) interpolated between vt =0.1 ms−1 and 10 ms−1 based on retrievals from in-track observations along each orbit on that Earth day. The data from each orbit is plotted so that data at the Equator is plotted at the central longitude at which in-track observations cross the Equator, more southerly data is plotted to the west of the central longitude up to 10°, and more northerly data is plotted to the east of the central longitude up to 10°. Binning of data in an individual orbit is at a resolution of 3° in latitude. Days without data are obscured by whitespace.
Water content in the middle atmosphere increased synchronously with the initiation of convective dust transport during 28P around 24–27 June 2007 (MY 28, Ls=263.41°–265.93°) (Figs. 21a–d; 22b). However, cloudiness below 50 km disappeared simultaneously, and indeed cloudiness at any altitude disappeared in late July (after Ls=280°) (Figs. 21c–d; 22b). That significant water content above the vt=0.1 ms−1 level re-appeared at all longitudes in early August (after Ls=288°) suggests water vapor was approximately well-distributed in longitude prior to this time (Fig. 22b). Comparison with Fedorova et al. [2018] suggests that water vapor rapidly increased in the middle atmosphere of the southern hemisphere during Ls= 262°–264° and in the northern hemisphere about a week later (Ls= 266°–268°). Water vapor then increased to a new maximum in both hemispheres (particularly at 70 km) just after the second convective episode began (Ls=276°).
Convective systems similar to those in 34P were observed during the two major stages of intensification of 28P. On 27 June 2007 (MY 28, Ls=265.62°), the system in Figs. 23a–h was centered near 35° S, if the lobes to the north and south at 65 km suggest dust is diverging from that area. Retrievals were only successful at the north end of the feature (indicated by the vertical line in Figs. 23a–h), where dust MMR was 95 ppm at 56 km altitude. Dust MMR > 100 ppm may have been mixed to > 60 km at the center of the feature, where the altitude which significant dust reaches appears to be 30 km higher than at the Equator. Under non-dust storm conditions, dust is both simulated and observed to be more deeply mixed at the Equator than at 35° S [Richardson and Wilson, 2002; Kahre et al., 2006; McCleese et al., 2010], emphasizing how strong and localized vertical transport can be in the convective systems that form early in PEDE. Deep convective activity intermediate in intensity between the activity observed in southeastern Tharsis during Episodes II and III of 34P was observed in southern Tharsis during the second episode of intensification of 28P (≈ Ls =275°) (Figs. 21a–b, 24a–d). Because of a gap in MRO-MCS observations between 16–23 July (Ls=277.54°–281.89°), we cannot fully assess how persistent deep convection was during this episode, but there were hints of a core near the antimeridian as late as 26 July (Ls=283.75°) (Fig. 22a).
Figure 23.

Cross-sectional views of a deep convective system from forward limb views from MY 28, Ls=265.71°, 15:00 LST (27 June 2007, 15:33–15:52 UTC). The views pass the Equator near 1° W. Each panel shows brightness temperature in the labeled MRO-MCS channels (K, color contours). Note that the radiance observations have been over-interpolated at 1 km resolution to approximate the over-interpolation of the retrievals. Altitude is relative to the MOLA datum. The mean latitude of the retrieval mentioned in the text is indicated with a vertical black line.
Figure 24.

Cross-sectional views of deep convective activity from analysis of in-track retrievals and radiance observations (forward limb views) that crossed the Equator near 116° W, MY 28, Ls=275.61°, 15:30 LST (13 Jul 2007, 9:22–9:54 UTC): (a) Dust MMR (ppm, color contours) with vt (ms−1, red labeled contours with labels marked by black crosses; (b) Temperature (K, color contours) and locations where water content can be diagnosed (black crosses); (c) Brightness temperature in the dust-sensitive MRO-MCS A5 channel (K, color contours); (d) Brightness temperature in the temperature-sensitive MRO-MCS A3 channel (K, color contours). Note that the radiance observations have been over-interpolated at 1 km resolution to approximate the over-interpolation of the retrievals. Altitude is relative to the MOLA datum. The surface elevation has been plotted in panels (a) and (b).
4. Discussion
In this discussion, we will focus on interpreting: (1) the episodicity of deep convection; (2) mesoscale organization of deep convective structures; (3) the relative roles of mesoscale and larger-scale circulations in PEDE evolution; and (4) the impact of deep convection on the distribution of atmospheric water vapor.
4.1. Episodic Behavior of Deep Convective Activity
Deep convection during 34P was episodic. Sub-diurnal dayside dust fluxes rose and fell several times before returning to a level indicative of no deep convection (no significant flux above vt = 0.1 ms−1). The altitude of significant dust transport almost declined to pre-storm levels on 15 June 2018 (MY 34, Ls=193.73°) (Figs. 2a,1a), and there was a similar local minimum in dust fluxes (Fig. 2a) around 4 July (Ls=205.01°). This behavior clearly contrasts with 28P, during which the altitude of significant dust transport smoothly increased/remained steady until 11 July 2007 (MY 28, Ls=274.42°) and then quickly increased to higher levels for two weeks before decaying with the storm (Fig. 21a).
The division of deep convective activity into Episodes I–V was an interpretive choice motivated by the apparent westerly propagation of deep convective activity in Figs. 3a and 4a. However, this choice of divisions is not unique. The storm could have been divided into three episodes on the basis of Fig. 2a, in which Episode “1” was defined to end with the pause in deep convective activity on 17 June 2018 (MY 34, Ls=194.90°) and Episode “2” with the pause on 4 July (Ls=205.01°).
Nevertheless, the division of Episode “1” into two parts (Episode I and II) is preferable, because a similar spatiotemporal pattern of deep convective activity repeats in each episode. There is a burst in activity along the axis between Tharsis and Chryse followed by a burst in activity along the axis between Arabia and Isidis approximately 5–6 days later (Figs. 5,11).
One hint to the underlying dynamics is that the first and second axis of each episode coincides with the Acidalia and Utopia storm tracks associated with cross-equatorial flushing storms: frontal disturbances in the northern hemisphere that can induce dust storm activity in the low latitudes and even cross the Equator to affect the southern mid-latitudes [Wang et al., 2003, 2005; Wang, 2007]. (Indeed, Guzewich et al. [2019] attributes the origin of 34P to this mechanism.) It is therefore possible that the initial convective episodes were driven by baroclinic disturbances propagating along the storm tracks. Typical periods of these waves are 6.7 and 2.3 sols [Haberle et al., 2018], which would imply it would take 1.2 to 3.3 sols for a disturbance to move between Acidalia and Utopia. The delayed response between Acidalia and Utopia storm track activity could be the effect of the tidal gate mechanism, in which disturbances only can move southward when frontal and tidal winds interfere constructively. The tidal gate is estimated to be open 40% of the time [Wang et al., 2003]. If a strong baroclinic disturbance with period of 2.3 sols that entered Acidalia only entered Utopia the third time it passed it, this would correspond to 5.8 sols or approximately 6 days. However, the observations presented here only establish an association of deep convective episodes with the storm tracks; they provide no direct evidence for the role of baroclinic disturbances.
Deep convective activity in Tharsis/Syria/Solis may have been steady during Episode III (Fig. 15), but the phasing of deep convective activity elsewhere suggests that episodic forcing of convective activity along the storm tracks continued during Episode III. The weakening of deep convective activity during Episode IV likely indicates the breakdown of the persistent deep convective activity over Tharsis, because the distribution of weaker convective activity was broadly similar to Episode III (Fig. 20). Deep convective activity ceased during Episode V, which we would propose likely resulted from the termination of dust lifting.
Clancy et al. [2010] and Guzewich et al. [2013] interpreted the asymmetric distribution of middle atmospheric dust during 25P as a wavenumber 1 structure (with a maximum at 90° W) resembling a slowly westward-propagating Rossby wave. The observations presented here, particularly Fig. 3a and 20, might be interpreted to suggest that such a wave developed during 34P and mediated the last outbreaks of deep convection.
28P formed around southern summer solstice, when baroclinic activity is normally weak [e.g., Lewis et al., 2016; Mulholland et al., 2016] and flushing storms rare [Wang, 2017]. Therefore, if baroclinic activity was the source of episodic convection during the early stages of 34P, its absence would explain why the first three weeks of 28P was almost a single episode of deep convective systems spreading broadly in longitude. 28P’s other contrast with 34P was its history of interaction with Tharsis. Deep convective activity may have developed in Tharsis about 30 June 2007 (MY 28, Ls=267.51°) (Fig. 22a) but remained at an intensity similar to elsewhere on the planet until 11 July (Ls=274.42°) when it amplified.
4.2. Mesoscale Organization of Deep Convective Structures
MRO-MCS data provides limited information about the circulations associated with deep convective structures. In Episode I, the strongest convection was associated with cold, near-surface air just south of the Equator (Figs. 6c,d, 7a–l) and shallower, banded convection to the north of the Equator. However, cold surface temperatures are the expected consequence of the reduction of sunlight reaching the surface by a thick haze of dust [e.g., Heavens, 2017]. In Episode II, the first day of intense deep convection (12 June 2018; MY 34, Ls=191.98°) over eastern Tharsis was associated with cold surface temperatures just south of the Equator (Fig. S3l). But on the second day (13 June; Ls=192.56), surface temperatures warmed toward the center of a core near the Equator but were not necessarily warm at the center (Fig. 13l). Both of these episodes evolved in such a way to suggest a connection with disturbances along the Acidalia and Utopia storm tracks. In Episode III, persistent cores of deep convection over southeastern Tharsis intruded on the margins of a region of relatively clear air, the warmest surface/near-surface air on the planet (Figs. 17a–h).
Our main inference from these observations as well as the episodic development of deep convection is that convective organization outside of Tharsis likely was defined by whatever episodic external forcing generated it, resulting in cold core/ thermally indirect circulations in the lower atmosphere. Thermally indirect circulations in the lower atmosphere would be the null hypothesis for dust storms, because the high opacity of dust tends to strongly cool the surface and possibly some depth of the lower atmosphere during the daytime.
Something different seems to have happened to the south and east of Tharsis Montes. Repeated observation of high dust MMRs here suggests one or more areas of intense dust lifting were persistent from day to day, particularly during Episode III. This persistence would require a steady external forcing not available elsewhere on the planet or a circulation that was self-maintaining, such as the “dusty hurricane” of Gierasch and Goody [1973] or Rafkin [2009].
Further support for the idea of a persistent, warm core, deep convective circulation in eastern Tharsis comes from 25P (the PEDE in Mars Year 25/2001). During the long decay phase of that storm, puffy (cumuliform) dust clouds persisted in association with a secondary lifting center further southeast of the Tharsis Montes in Syria Planum [Strausberg et al., 2005; Kulowski et al., 2017]. But there is limited information about the impact of this system on the vertical distribution of dust. A DDL with large dust particles (reff =2μm) was observed at 75 km altitude at 12–14° S, 174 ° W about 10 days after Strausberg et al. [2005] inferred dust lifting had ceased.
Deep convective activity during 28P may not have been as persistent. It is possible that the increased convective mixing in 28P after 11 July 2007 (MY 28, Ls=274.42°) was due to the formation of a similar circulation in Syria Planum (Figs. 21a, 23). Yet by 26 July (Ls=283.75°), the most intense deep convection had shifted to the antimeridian (Fig. 22a). However, MRO-MCS made no on-planet views during that period to confirm the presence of a lower atmospheric thermal anomaly or trace the lower atmospheric origins of the exceptionally dusty airmasses observed in the middle atmosphere. Moreover, a break in MR-MCS observations makes it difficult to assess the persistence of dusty deep convection between 11–26 July (Ls=274.11°–Ls=283.44°). And even in the better observing conditions of 34P, we were unable to find an incontestable example of warm surface/lower atmospheric temperatures co-existing with high amounts of dust, which certainly could arise from making 2–4 off-nadir observations at most at the scale of severe tropical cyclone eyewall structures (60 km) [Schubert et al., 2007] or the analogous structures in simulated warm core dust storms (120 km) [Rafkin, 2009]. The unusual temperature/dust structures we did find: the warming toward the center of the Tharsis core on 13 June 2018 (MY 34, Ls=192.56°) and the unusually warm, clear conditions to the southeast of the Tharsis Montes may be consistent with strong subsidence/downdrafts in the wake of strong convective updrafts. Subsidence is a factor known to shape the lower atmospheric thermal structure of tropical cyclones [Schubert et al., 2007] and may have implications for the thermodynamics of the circulations involved. A role for subsidence driven by downslope winds from the Tharsis Montes themselves cannot be excluded [Wolkenberg et al., 2010] but would be unusual in daytime hours [Hunt et al., 1980; Rafkin et al., 2002; Benson et al., 2003; Michaels et al., 2006; Spiga and Forget, 2009] unless tidal forcing is sufficient to oppose the typical daytime upslope flow [Rafkin and Michaels, 2003].
4.3. The Relative Role of Mesoscale and Planetary Circulations in PEDE
While the information this study can provide about convective organization within the PEDE is limited, it may be possible to constrain the extent to which dust lifting within the PEDE could have been driven by mesoscale convective systems of some sort (e.g., “dusty hurricanes”) as opposed to larger-scale circulations. The evidence from 34P seems to argue for larger-scale circulations driving initial storm expansion but mesoscale convection bringing the PEDE to maturity/peak intensity. In 28P, convection but still was critical to bringing the storm to peak intensity during the mature phase but may have played a larger role during the expansion phase than during 34P.
The initial area of dust lifting from which the MY 34 PEDE expanded formed on 30 May 2018 (MY 34, Ls=184.47°), preceding the initial convective activity of Episode I by at least 4 sols [Sánchez-Lavega et al., 2019]. Moreover, the eastward expansion of dust lifting during the first ten sols of the storm likewise preceded the development of convection. Dust-lifting reached 60° E by 8 June (Ls=189.65°) [Sánchez-Lavega et al., 2019], approximately 3 sols before the convective activity near Hellas that closed Episode I. The apparently short lifetimes of convective systems likewise seem to preclude a leading role in PEDE expansion during Episodes I and II.
Yet Montabone et al. [2019] argues that observations of column opacity suggest that “the activation of secondary lifting centers in Tharsis” beginning at Ls = 197° (21 June 2018) amplified the storm to PEDE status. In other words, the persistent, deep convective system that seems to have formed during Episode III was crucial to the final phase of PEDE expansion. Strausberg et al. [2005] suggests that the secondary lifting center in Syria Planum was likewise important for the longevity of 25P, and it is reasonable to speculate that a persistent deep convective system formed in that case.
During 28P, high altitude dust expanded to most longitudes by 30 June–1 July 2007 (MY 28, Ls=267.20°–268.46°) (Fig. 22a), soon after the development of secondary lifting centers distant from the primary lifting center of Hellas [Wang and Richardson, 2015]. This synchrony suggests there may have been a stronger relationship between storm expansion and mesoscale convection than in 34P. While we cannot infer whether the convective activity that developed near Tharsis around 11 July (Ls=274.42°) was persistent, its development may have significantly affected dust loading globally. Column opacities measured at the Mars Exploration Rovers Spirit and Opportunity increased rapidly from Ls = 265°–270°, stabilized at Spirit and decreased at Opportunity, and then rapidly increased to higher levels than before at both sites around Ls = 277° [Lemmon et al., 2015].
4.4. Dusty Deep Convection and Atmospheric Water Content
Most of the evidence for a relationship between dusty deep convection and middle atmospheric water vapor can be reduced to two points. The rapid increase in hygropause altitude/middle atmospheric water content during Episode I and the initial deep convective episode of 28P was simultaneous with the development of deep convection. The increase in dayside hygropause altitude/middle atmospheric water content to its maximum altitude was synchronous with the most widespread deep convective activity during 34P, that is, Episode III. Atmospheric water content likewise seems to have increased during the second convective episode of 28P.
The obstacle to establishing a stronger causal relationship is that water detection based on the water ice cloud distribution is biased by the atmospheric heating effects of dust, which in 34P indisputably altered the thermal structure of the Martian atmosphere. On 3 June 2018 (MY 34, Ls=186.77°), the zonal average 180 K isotherm was near 30 km altitude in the dayside tropics (Fig. 8a). By 29 June (Ls=202.01°), it was at 65 km altitude (Fig. 19i). This change makes it difficult to infer atmospheric water content from the water ice cloud distribution and trace it to a dusty convective system, just as inferring the water vapor distribution from sublimating ice clouds probably causes unrealistically high estimates of atmospheric water content (> 1000 ppmv) in Fig. 9, for example. The same issue affects comparisons of dayside and nightside water content. Water ice clouds typically form in the 10 km above the 170 K isotherm, but this isotherm is 5–15 km lower on the nightside than the dayside in the tropics (Figs. 8;9;19; S5).
We propose two ways forward. First, the distribution of dusty deep convection outlined in this study needs to be compared with the directly observed water vapor distribution by instruments aboard ExoMars TGO [Vandaele et al., 2019]. Second, the water content distribution found by this study and direct observations of water vapor should be compared with a water cycle in a GCM that does not parameterize mesoscale convection such as that of Shaposhnikov et al. [2019] as a null hypothesis for the effects of deep convection. Comparison of Fig. 2b of Shaposhnikov et al. [2019] with Fig. 2a of Heavens et al. [2018] suggests the model hygropause is 15 km too low in the tropics and 20–30 km too low in the northern mid-latitudes, though diurnal averaging of the model output may explain some of the difference. A identification of a similar bias in a simulation of a PEDE forming near northern fall equinox would imply that deep convection is necessary to maintain high middle atmospheric water content during PEDE and ultimately drive enhanced water loss by hydrogen escape.
While the relationship between middle atmospheric water vapor and deep convection remains uncertain, our analysis does establish that the hygropause in the tropics and mid-latitudes was 65–75 km during the PEDE and probably at most or all longitudes. Taking the observations of Vandaele et al. [2019] into account, the hygropause was similarly elevated near the poles; it was just generally too warm for water ice clouds to form. Therefore the middle atmosphere would have been approximately as moist during 34P as during 28P. And it is in this light that any measurements related to hydrogen escape should be assessed.
5. Summary and Conclusions
In this study, we have characterized the occurrence of dusty deep convection and the evolution of the distribution of middle atmospheric water content in the MY 34 PEDE. We find that dusty deep convection initially developed along the Acidalia and Utopia storm tracks in the tropics during the first three weeks of June 2018 (≈ MY 34, Ls=186°–196°) in distinct episodes. This activity then became more widespread and less episodic during late June and early July (≈ Ls=196°–204°) before mostly dissipating by the middle of July (≈ 212°). The episodic nature of deep convection during this PEDE contrasts somewhat with the MY 28 PEDE, during which deep convection intensified in only two distinct episodes and was more widely distributed in longitude. These contrasts between the two PEDEs suggest that the relative roles of convectively active mesoscale circulations and larger-scale circulations in the expansion phase of a PEDE can vary.
The most intense convection during the MY 34 PEDE took place on 12–13 June 2018 (MY 34, Ls=191.68°–192.85°) in eastern equatorial Tharsis. One or more convective towers reached at least 70 km and may have reached > 90 km altitude and contained vertical velocities of 10 ms−1. Convective development in this case was likely in response to a disturbance moving along the Acidalia storm track.
It is possible that a self-maintaining, deep convective circulation was located in eastern Tharsis during late June and early July 2018 (MY 34, Ls=196.96°–204.71°). Unusually dusty airmasses and intense deep convection were observed on multiple days in this area. At the same time, an adjoining area to the southeast of the Tharsis Montes had dayside lower atmospheric temperatures 10–20 K warmer than the surrounding environment (and an opposite anomaly at night), suggestive of an unusually clear airmass and possibly strong subsidence. However, we lack the high resolution temperature, wind, and pressure measurements that would enable more definite conclusions about the circulation in this area. However, unusually intense deep convective circulations may have developed to the southeast of the Tharsis Montes during the last three PEDEs, enabling informed targeting of future confirmatory measurements. As these circulations are potentially implicated in the final phase of expansion/maturation/intensification of the PDE as well as the duration of the PEDE, their study is of high priority for understanding PEDE dynamics.
Middle atmospheric water content rapidly increased simultaneously with the initiation of deep convection during the PEDE. The dayside hygropause in the tropics rose from 55 to 70 km altitude during the initial phase of the PEDE and rose to 75 km during the peak of deep convective activity. However, our technique for estimating middle atmospheric water content does not allow unambiguous demonstration of a relationship between increased middle atmospheric water content and convective activity. Instead, our analysis provides an important constraint on modeling the Martian water cycle that, along with direct measurements of the water vapor distribution by ExoMars TGO, should enable the role of dusty deep convection to be inferred from biases in models where it is absent. No doubt, similar methods will be required to quantify how important mesoscale dusty deep convection is to the evolution of a PEDE relative to planetary-scale dynamics.
Supplementary Material
Key Points:
Deep convection during the MY 34 PEDE was more episodic than in the MY 28 PEDE
The tallest convective clouds during the MY 34 PEDE were more than 80 km high
Tropical hygropause altitude increased from 55 km to 65–70 km during the initial convective episode, peaking at 75–80 km during a later one.
Acknowledgments
This work was supported by the NASA Mars Data Analysis, Solar System Workings, and Nexus for Exoplanet System Science programs (NNX14AM32G, NNX15AI33G, and NNX15AE05G). Work at the Jet Propulsion Laboratory, California Institute of Technology is performed under contract with NASA. We thank Armin Kleinböhl, Mike Smith, and an anonymous reviewer for helpful comments on this manuscript. Mars Climate Sounder retrieval and radiance products and Mars Orbiter Laser Altimeter products are publicly available from NASA’s Planetary Data System [MCS, cited 2019b,c; Smith et al., 2003]. The orbital average dust flux and water content analyses are available from Mendeley [Heavens, cited 2019].
References
- Bandfield JL, Wolff MJ, Smith MD, Schofield JT, and McCleese DJ (2013), Radiometric comparison of Mars Climate Sounder and Thermal Emission spectrometer measurements, Icarus, 225, 28–39, doi: 10.1016/j.icarus.2013.03.007. [DOI] [Google Scholar]
- Basu S, Wilson J, Richardson M, and Ingersoll A (2006), Simulation of spontaneous and variable global dust storms with the GFDL Mars GCM, Journal of Geophysical Research: Planets, 111(E9), doi: 10.1029/2005JE002660. [DOI] [Google Scholar]
- Benson JL, Bonev BP, James PB, Shan KJ, Cantor BA, and Caplinger MA (2003), The seasonal behavior of water ice clouds in the Tharsis and Valles Marineris regions of Mars: Mars Orbiter Camera observations, Icarus, 165(1), 34–52, doi: 10.1016/S0019-1035(03)00175-1. [DOI] [Google Scholar]
- Chaffin MS, Deighan J, Schneider NM, and Stewart AIF (2017), Elevated atmospheric escape of atomic hydrogen from Mars induced by high-altitude water, Nature Geosci, 10, 174–178, doi: 10.1038/ngeo2887. [DOI] [Google Scholar]
- Clancy RT, Sandor BJ, W. M. J., Christensen PR, Smith MD, Pearl JC, Conrath BJ, and Wilson RJ(2000), An intercomparison of ground-based millimeter, MGS TES, and Viking atmospheric temperature measurements: Seasonal and interannual variability of temperatures and dust loading in the global Mars atmosphere, J. Geophys. Res, 105, 9553–9571. [Google Scholar]
- Clancy RT, Wolff MJ, Whitney BA, Cantor BA, Smith MD, and McConnochie TH (2010), Extension of atmospheric dust loading to high altitudes during the 2001 Mars dust storm: MGS TES limb observations, Icarus, 207, 98–109, doi: 10.1016/j.icarus.2009.10.011. [DOI] [Google Scholar]
- Clancy RT, Wolff MJ, Smith MD, Kleinböhl A, Cantor BA, Murchie SL, Toigo AD, Seelos K, Lefévre F, Montmessin F, Daerden F, and Sandor BJ (2019), The distribution, composition, and particle properties of Mars mesospheric aerosols: An analysis of CRISM visible/near-IR limb spectra with context from near-coincident MCS and MARCI observations, Icarus, 328, 246–273, doi: 10.1016/j.icarus.2019.03.025. [DOI] [Google Scholar]
- Conrath BJ (1975), Thermal Structure of the Martian Atmosphere during the Dissipation of the Dust Storm of 1971, Icarus, 24, doi: 10.1016/0019-1035(75)90156-6. [DOI] [Google Scholar]
- Daerden F, Whiteway JA, Neary L, Komguem L, Lemmon MT, Heavens NG, Cantor BA, Hébrard E, and Smith MD (2015), A solar escalator on Mars: Self-lifting of dust layers by radiative heating, Geophysical Research Letters, 42(18), 7319–7326, doi: 10.1002/2015GL064892. [DOI] [Google Scholar]
- Fedorova A, Bertaux J-L, Betsis D, Montmessin F, Korablev O, Maltagliati L, and Clarke J (2018), Water vapor in the middle atmosphere of Mars during the 2007 global dust storm, Icarus, 300, 440–457, doi: 10.1016/j.icarus.2017.09.025. [DOI] [Google Scholar]
- Gierasch PJ, and Goody RM (1973), A model of a martian great dust storm, J. Atmos. Sci, 30(2), 169–179, doi: 10.1175/1520-0469(1973)030<0169:AMOAMG>2.0.CO;2. [DOI] [Google Scholar]
- Guzewich SD, Talaat ER, Toigo AD, Waugh DW, and McConnochie TH (2013), High-altitude dust layers on Mars: Observations with the Thermal Emission Spectrometer, J. Geophys. Res, 118, 1177–1194, doi: 10.1002/jgre.20076. [DOI] [Google Scholar]
- Guzewich SD, Lemmon M, Smith CL, Martínez G, de Vicente-Retortillo A, Newman CE, Baker M, Campbell C, Cooper B, Gómez-Elvira J, Harri A-M, Hassler D, Martin-Torres FJ, McConnochie T, Moores JE, Kahanpää H, Khayat A, Richardson MI, Smith MD, Sullivan R, de la Torre Juarez M, Vasavada AR, Viúdez-Moreiras D, Zeitlin C, and Zorzano Mier M-P (2019), Mars Science Laboratory Observations of the 2018/Mars Year 34 Global Dust Storm, Geophysical Research Letters, 46(1), 71–79, doi: 10.1029/2018GL080839. [DOI] [Google Scholar]
- Haberle RM (1986), Interannual Variability of Global Dust Storms on Mars, Science, 234(4775), 459–461, doi: 10.1126/science.234.4775.459. [DOI] [PubMed] [Google Scholar]
- Haberle RM, de la Torre Juarez M, Kahre MA, Kass DM, Barnes JR, Hollingsworth JL, Harri A-M, and Kahanpää H(2018), Detection of northern hemisphere transient eddies at gale crater mars, Icarus, 307, 150–160, doi: 10.1016/j.icarus.2018.02.013. [DOI] [Google Scholar]
- Hayne PO, Paige DA, Schofield JT, Kass DM, KleinbÃuhl A, Heavens NG, and McCleese DJ (2012), Carbon dioxide snow clouds on mars: South polar winter observations by the mars climate sounder, J. Geophys. Res, 117(E8), doi: 10.1029/2011JE004040. [DOI] [Google Scholar]
- Hayne PO, Paige DA, and Heavens NG (2014), The role of snowfall in forming the seasonal ice caps of Mars: Models and constraints from the Mars Climate Sounder, Icarus, 231, 122–130, doi: 10.1016/j.icarus.2013.10.020. [DOI] [Google Scholar]
- Heavens N (cited 2019), Convective Dust Flux, Water Flux, and Water Content Estimates For The Martian Atmosphere Based On Observations by The Mars Reconnaissance Orbiter, version 1, Mendeley, doi: 10.17632/7tc5wkkk4s.1. [DOI] [Google Scholar]
- Heavens NG (2017), Textured Dust Storm Activity in Northeast Amazonis-Southwest Arcadia, Mars: Phenomenology and Dynamical Interpretation, J. Atmos. Sci, 74(4), 1011–1037, doi: 10.1175/JAS-D-16-0211.1. [DOI] [PMC free article] [PubMed] [Google Scholar]
- Heavens NG, Benson JL, Kass DM, Kleinböhl A, Abdou WA, McCleese DJ, Richardson MI, Schofield JT, Shirley JH, and Wolkenberg PM (2010), Water ice clouds over the Martian tropics during northern summer, Geophys. Res. Lett, 37, L18202, doi: 10.1029/2010GL044610. [DOI] [Google Scholar]
- Heavens NG, Richardson MI, Kleinböhl A, Kass DM, McCleese DJ, Abdou W, Benson JL, Schofield JT, Shirley JH, and Wolkenberg PM (2011a), The vertical distribution of dust in the Martian atmosphere during northern spring and summer: Observations by the Mars Climate Sounder and analysis of zonal average vertical dust profiles, J. Geophys. Res, 116(E4), doi: 10.1029/2010JE003691, E04003. [DOI] [Google Scholar]
- Heavens NG, Richardson MI, Kleinböhl A, Kass DM, McCleese DJ, Abdou W, Benson JL, Schofield JT, Shirley JH, and Wolkenberg PM (2011b), Vertical distribution of dust in the Martian atmosphere during northern spring and summer: High-altitude tropical dust maximum at northern summer solstice, J. Geophys. Res, 116(E1), doi: 10.1029/2010JE003692, E01007. [DOI] [Google Scholar]
- Heavens NG, Cantor BA, Hayne PO, Kass DM, Kleinböhl A, McCleese DJ, Piqueux S, Schofield JT, and Shirley JH (2015), Extreme detached dust layers near Martian volcanoes: Evidence for dust transport by mesoscale circulations forced by high topography, Geophys. Res. Lett, 42, 3730–3738, doi: 10.1002/2015GL064004. [DOI] [Google Scholar]
- Heavens NG, Kleinböhl A, Chaffin MS, Halekas JS, Kass DM, Hayne PO, McCleese DJ, Piqueux S, Shirley JH, and Schofield JT (2018), Hydrogen escape from Mars enhanced by deep convection in dust storms, Nature Astron, 2, 126–132, doi: 10.1038/s41550-017-0353-4. [DOI] [Google Scholar]
- Heavens NG, Kass DM, Shirley JH, Piqueux S, and Cantor BA (2019), An Observational Overview of Dusty Deep Convection in Martian Dust Storms, J. Atmos. Sci, doi: 10.1175/JAS-D-19-0042.1, in press. [DOI] [PMC free article] [PubMed] [Google Scholar]
- Hovmöller E (1949), The trough-and-ridge diagram, Tellus, 1(2), 62–66, doi: 10.1111/j.2153-3490.1949.tb01260.x. [DOI] [Google Scholar]
- Hunt GE, Pickersgill AO, James PB, and Johnson G (1980), Some diurnal properties of clouds over the martian volcanoes, Nature, 286(5771), 362–364, doi: 10.1038/286362a0. [DOI] [Google Scholar]
- Kahre MA, Murphy JR, and Haberle RM (2006), Modeling the Martian dust cycle and surface dust reservoirs with the NASA Ames general circulation model, Journal of Geophysical Research: Planets, 111(E6), doi: 10.1029/2005JE002588. [DOI] [Google Scholar]
- Kleinböhl A, Schofield JT, Kass DM, Abdou WA, Backus CR, Sen B, Shirley JH, Lawson WG, Richardson MI, Taylor FW, Teanby NA, and McCleese DJ (2009), Mars Climate Sounder limb profile retrieval of atmospheric temperature, pressure, and dust and water ice opacity, J. Geophys. Res, 114(E10), doi: 10.1029/2009JE003358, E10006. [DOI] [PMC free article] [PubMed] [Google Scholar]
- Kleinböhl A, Schofield JT, Abdou WA, Irwin PGJ, and de Kok RJ (2011), A single-scattering approximation for infrared radiative transfer in limb geometry in the Martian atmosphere, J. Quant. Spectrosc. Radiat. Transf, 112(10), 1568–1580, doi: 10.1016/j.jqsrt.2011.03.006. [DOI] [Google Scholar]
- Kleinböhl A, Wilson RJ, Kass D, Schofield JT, and McCleese DJ (2013), The semidiurnal tide in the middle atmosphere of Mars, Geophys. Res. Lett, 40(10), 1952–1959, doi: 10.1002/grl.50497. [DOI] [Google Scholar]
- Kleinböhl A, Schofield JT, Kass DM, Abdou WA, and McCleese DJ (2015), No widespread dust in the middle atmosphere of Mars from Mars Climate Sounder observations, Icarus, 261, 118–121, doi: 10.1016/j.icarus.2015.08.010. [DOI] [Google Scholar]
- Kleinböhl A, Friedson AJ, and Schofield JT (2017), Two-dimensional radiative transfer for the retrieval of limb emission measurements in the Martian atmosphere, J. Quant. Spectrosc. Radiat. Transf, 187, 511–522, doi: 10.1016/j.jqsrt.2016.07.009. [DOI] [Google Scholar]
- Kulowski L, Wang H, and Toigo AD (2017), The seasonal and spatial distribution of textured dust storms observed by Mars Global Surveyor Mars Orbiter Camera, Adv. Space Res, 59(2), 715–721, doi: 10.1016/j.asr.2016.10.028. [DOI] [Google Scholar]
- Kuroda T, Medvedev AS, Hartogh P, and Takahashi M (2009), On forcing the winter polar warmings in the martian middle atmosphere during dust storms, J. Meteor. Soc. Japan Ser. II, 87(5), 913–921, doi: 10.2151/jmsj.87.913. [DOI] [Google Scholar]
- Lemmon MT, Wolff MJ, Bell JF, Smith MD, Cantor BA, and Smith PH (2015), Dust aerosol, clouds, and the atmospheric optical depth record over 5 Mars years of the Mars Exploration Rover mission, Icarus, 251, 96–111, doi: 10.1016/j.icarus.2014.03.029, dynamic Mars. [DOI] [Google Scholar]
- Leovy CE, Zurek RW, and Pollack JB (1973), Mechanisms for Mars Dust Storms, Journal of the Atmospheric Sciences, 30(5), 749–762, doi: 10.1175/1520-0469(1973)030<0749:MFMDS>2.0.CO;2. [DOI] [Google Scholar]
- Lewis SR, Mulholland DP, Read PL, Montabone L, and Wilson RJ (2016), The solsticial pause on Mars: 1. a planetary wave reanalysis, Icarus, 264, 456–464, doi: 10.1016/j.icarus.2015.08.039. [DOI] [Google Scholar]
- Liu J, Richardson MI, and Wilson RJ (2003), An assessment of the global, seasonal, and interannual spacecraft record of Martian climate in the thermal infrared, Journal of Geophysical Research: Planets, 108(E8), doi: 10.1029/2002JE001921. [DOI] [Google Scholar]
- López-Puertas M, and López-Valverde M (1995), Radiative energy balance of co2 non-lte infrared emissions in the martian atmosphere, Icarus, 114(1), 113–129, doi: 10.1006/icar.1995.1047. [DOI] [Google Scholar]
- Määttänen A, Fouchet T, Forni O, Forget F, Savijärvi H, Gondet B, Melchiorri R, Langevin Y, Formisano V, Giuranna M, and Bibring JP (2009), A study of the properties of a local dust storm with Mars Express OMEGA and PFS data, Icarus, 201(2), 504–516, doi: 10.1016/j.icarus.2009.01.024. [DOI] [Google Scholar]
- Maltagliati L, Montmessin F, Fedorova A, Korablev O, Forget F, and Bertaux JL (2011), Evidence of Water Vapor in Excess of Saturation in the Atmosphere of Mars, Science, 333, 1868, doi: 10.1126/science.1207957. [DOI] [PubMed] [Google Scholar]
- Martin LJ, and Zurek RW (1993), An Analysis of the History of Dust Activity on Mars, J. Geophys. Res, 98, 3221–3246, doi: 10.1029/92JE02937. [DOI] [Google Scholar]
- McCleese DJ, Schofield JT, Taylor FW, Calcutt SB, Foote MC, Kass DM, Leovy CB, Paige DA, Read PL, and Zurek RW (2007), Mars Climate Sounder: An investigation of thermal and water vapor structure, dust and condensate distributions in the atmosphere, and energy balance of the polar regions, J. Geophys. Res, 112(E5), doi: 10.1029/2006JE002790, E05S06. [DOI] [Google Scholar]
- McCleese DJ, Heavens NG, Schofield JT, Abdou WA, Bandfield JL, Calcutt SB, Irwin PGJ, Kass DM, Kleinböhl A, Lewis SR, Paige DA, Read PL, Richardson MI, Shirley JH, Taylor FW, Teanby N, and Zurek RW (2010), Structure and dynamics of the Martian lower and middle atmosphere as observed by the Mars Climate Sounder: Seasonal variations in zonal mean temperature, dust, and water ice aerosols, J. Geophys. Res, 115(E12), doi: 10.1029/2010JE003677, E12016. [DOI] [Google Scholar]
- McConnochie TH, Smith MD, Wolff MJ, Bender S, Lemmon M, Wiens RC, Maurice S, Gasnault O, Lasue J, Meslin P-Y, Harri A-M, Genzer M, Kemppinen O, Martinez GM, DeFlores L, Blaney D, Johnson JR, and Bell JF (2018), Retrieval of water vapor column abundance and aerosol properties from ChemCam passive sky spectroscopy, Icarus, 307, 294–326, doi: 10.1016/j.icarus.2017.10.043. [DOI] [Google Scholar]
- MCS (cited 2019a), MRO MCS Reduced Data Records (RDR), Available from: https://atmos.nmsu.edu/data_and_services/atmospheres_data/MARS/mcs.html (Last accessed 13 September 2019).
- MCS (cited 2019b), MRO MCS Derived Data Records (DDR), Available from: https://atmos.nmsu.edu/data_and_services/atmospheres_data/MARS/mcs.html (Last accessed 13 September 2019).
- Medvedev AS, and Hartogh P (2007), Winter polar warmings and the meridional transport on Mars simulated with a general circulation model, Icarus, 186(1), 97–110, doi: 10.1016/j.icarus.2006.08.020. [DOI] [Google Scholar]
- Michaels TI, Colaprete A, and Rafkin S (2006), Significant vertical water transport by mountain-induced circulations on Mars, Geophys. Res. Lett, 33, doi: 10.1029/2006GL026562, L16201. [DOI] [Google Scholar]
- Mischna MA, and Shirley JH (2017), Numerical modeling of orbit-spin coupling accelerations in a Mars general circulation model: Implications for global dust storm activity, Planetary and Space Science, 141, 45–72, doi: 10.1016/j.pss.2017.04.003. [DOI] [Google Scholar]
- Montabone L, Spiga A, Kass DM, Kleinböhl A, Forget F, and Millour E (2019), Martian Year 34 Column Dust Climatology from Mars Climate Sounder Observations: Reconstructed Maps and Model Simulations, arXiv e-prints, arXiv:1907.08187 [Google Scholar]
- Mulholland DP, Lewis SR, Read PL, Madeleine JBM, and Forget F (2016), The solsticial pause on Mars: 2. modelling and investigation of causes, Icarus, 264, 465–477, doi: 10.1016/j.icarus.2015.08.038. [DOI] [Google Scholar]
- Murphy DM, and Koop T (2005), Review of the vapour pressures of ice and supercooled water for atmospheric applications, Quarterly Journal of the Royal Meteorological Society, 131(608), 1539–1565, doi: 10.1256/qj.04.94. [DOI] [Google Scholar]
- Newman C, Lee C, Mischna M, Richardson M, and Shirley J (2019), An initial assessment of the impact of postulated orbit-spin coupling on Mars dust storm variability in fully interactive dust simulations, Icarus, 317, 649–668, doi: 10.1016/j.icarus.2018.07.023. [DOI] [Google Scholar]
- Piqueux S, Byrne S, Kieffer HH, Titus T, and Hansen CJ (2015), Enumeration of Mars years and seasons since the beginning of telescopic exploration, Icarus, 251, 332–338, doi: 10.1016/j.icarus.2014.12.014. [DOI] [Google Scholar]
- Rafkin SCR (2003), Reflections on Mars Global Climate Modeling from a Mesoscale Meteorologist, in First International Workshop on Mars atmosphere modeling and observations, Granada, Spain, 13–15 January 2003. [Google Scholar]
- Rafkin SCR (2009), A positive radiative-dynamic feedback mechanism for the maintenance and growth of Martian dust storms, J. Geophys. Res, 114, doi: 10.1029/2008JE003217, E01009. [DOI] [Google Scholar]
- Rafkin SCR (2012), The potential importance of non-local, deep transport on the energetics, momentum, chemistry, and aerosol distributions in the atmospheres of Earth, Mars, and Titan, Plan. Space Sci, 60, 147–154, doi: 10.1016/j.pss.2011.07.015. [DOI] [Google Scholar]
- Rafkin SCR, and Michaels TI (2003), Meteorological predictions for 2003 Mars Exploration Rover high-priority landing sites, Journal of Geophysical Research: Planets, 108(E12), doi: 10.1029/2002JE002027. [DOI] [Google Scholar]
- Rafkin SCR, Maria M. R. V. Sta., and Michaels TI (2002), Simulation of the atmospheric thermal circulation of a martian volcano using a mesoscale numerical model, Nature, 419, 697–699, doi: 10.1038/nature01114. [DOI] [PubMed] [Google Scholar]
- Richardson MI, and Wilson RJ (2002), A topographically forced asymmetry in the martian circulation and climate, Nature, 416(6878), 298–301, doi: 10.1038/416298a. [DOI] [PubMed] [Google Scholar]
- Riehl H, and Malkus J (1958), On the heat balance in the equatorial trough zone, Geophysica, 6(3–4), 503–538, doi:doi: 10.1016/0011-7471(64)90337-7. [DOI] [Google Scholar]
- Sánchez-Lavega A, del Río-Gaztelurrutia T, Hernández-Bernal J, and Delcroix M (2019), The Onset and Growth of the 2018 Martian Global Dust Storm, Geophysical Research Letters, 46(11), 6101–6108, doi: 10.1029/2019GL083207. [DOI] [Google Scholar]
- Schneider EK (1983), Martian great dust storms: Interpretive axially symmetric models, Icarus, 55(2), 302–331, doi: 10.1016/0019-1035(83)90084-2. [DOI] [Google Scholar]
- Schubert WH, Rozoff CM, Vigh JL, McNoldy BD, and Kossin JP (2007), On the distribution of subsidence in the hurricane eye, Quarterly Journal of the Royal Meteorological Society, 133(624), 595–605, doi: 10.1002/qj.49. [DOI] [Google Scholar]
- Shaposhnikov DS, Medvedev AS, Rodin AV, and Hartogh P (2019), Seasonal Water ‘Pump’ in the Atmosphere of Mars: Vertical Transport to the Thermosphere, Geophysical Research Letters, 46(8), 4161–4169, doi: 10.1029/2019GL082839. [DOI] [Google Scholar]
- Shirley JH (2017), Orbit-spin coupling and the circulation of the martian atmosphere, Planetary and Space Science, 141, 1–16, doi: 10.1016/j.pss.2017.04.006. [DOI] [Google Scholar]
- Shirley JH, Kleinböhl A, Kass DM, Steele LJ, Heavens NG, Suzuki S, Piqueux S, Schofield JT, and M. D. J. (2019), Rapid expansion and evolution of a regional dust storm in the Acidalia Corridor during the initial growth phase of the Martian global dust storm of 2018, Geophys. Res. Lett, doi: 10.1002/2019GL084317, in press. [DOI] [Google Scholar]
- Smith D, Neumann G, Arvidson RE, Guinness EA, and Slavney S (2003), Mars Global Surveyor Laser Altimeter Mission Experiment Gridded Data Record: MGS-M-MOLA-5-MEGDR-L3-V1.0, Available from: http://pds-geosciences.wustl.edu/mgs/mgs-m-mola-5-megdr-l3-v1/mgsl_300x/meg016/megt90n000eb.img (last accessed 13 September 2019).
- Spiga A, and Forget F (2009), A new model to simulate the Martian mesoscale and microscale atmospheric circulation: Validation and first results, J. Geophys. Res, 114, E02009, doi: 10.1029/2008JE003242. [DOI] [Google Scholar]
- Spiga A, Faure J, Madeleine JB, Määttänen A, and Forget F (2013), Rocket dust storms and detached dust layers in the Martian atmosphere, J. Geophys. Res, 118(4), 746–767, doi: 10.1002/jgre.20046. [DOI] [Google Scholar]
- Strausberg MJ, Wang H, Richardson MI, Ewald SP, and Toigo AD (2005), Observations of the initiation and evolution of the 2001 Mars global dust storm, J. Geophys. Res, 110, doi: 10.1029/2004JE002361, E02006. [DOI] [Google Scholar]
- Vandaele AC, Korablev O, Daerden F, Aoki S, Thomas IR, Altieri F, López-Valverde M, Villanueva G, Liuzzi G, Smith MD, Erwin JT, Trompet L, Fedorova AA, Montmessin F, Trokhimovskiy A, Belyaev DA, Ignatiev NI, Luginin M, Olsen KS, Baggio L, Alday J, Bertaux J-L, Betsis D, Bolsée D, Clancy RT, Cloutis E, Depiesse C, Funke B, Garcia-Comas M, Gérard J-C, Giuranna M, Gonzalez-Galindo F, Grigoriev AV, Ivanov YS, Kaminski J, Karatekin O, Lefèvre F, Lewis S, López-Puertas M, Mahieux A, Maslov I, Mason J, Mumma MJ, Neary L, Neefs E, Patrakeev A, Patsaev D, Ristic B, Robert S, Schmidt F, Shakun A, Teanby NA, Viscardy S, Willame Y, Whiteway J, Wilquet V, Wolff MJ, Bellucci G, Patel MR, López-Moreno J-J, Forget F, Wilson CF, Svedhem H, Vago JL, Rodionov D, Patel M, Alonso-Rodrigo G, Bauduin S, Carrozzo G, Clancy RT, Crismani M, Da Pieve F, D’Aversa E, Etiope G, Fedorova A, Fussen D, Geminale A, Gkouvelis L, Holmes J, Hubert B, Ignatiev N, Kasaba Y, Kass D, Kleinbohl A, Lanciano O, Nakagawa H, Novak RE, Oliva F, Piccialli A, Renotte E, Ritter B, Schneider N, Sindoni G, Smith M, Thiemann E, Thomas I, Vander Auwera J, Wilquet V, Wolkenberg P, Yelle R, Anufreychik K, Arnold G, Belyaev D, Duxbury N, Fouchet T, Grassi D, Guerlet S, Hartogh P, Ignatiev N, Khatuntsev I, Kokonkov N, Krasnopolsky V, Kuzmin R, Lacombe G, Lellouch E, Määttänen A, Marcq E, Martin-Torres J, Medvedev A, Moshkin B, Olsen K, Quantin-Nata C, Rodin A, Shematovich V, Thomas N, Trokhimovsky A, Vazquez L, Vincendon M, Wilson C, Zasova L, Zelenyi L, Zorzano MP, Team NS, and Team AS (2019), Martian dust storm impact on atmospheric H2O and D/H observed by ExoMars Trace Gas Orbiter, Nature, doi: 10.1038/s41586-019-1097-3. [DOI] [PubMed] [Google Scholar]
- Wang C, Forget F, Bertrand T, Spiga A, Millour E, and Navarro T (2018), Parameterization of Rocket Dust Storms on Mars in the LMD Martian GCM: Modeling Details and Validation, J. Geophys. Res, 123(4), 982–1000, doi: 10.1002/2017JE005255. [DOI] [Google Scholar]
- Wang H (2007), Dust storms originating in the northern hemisphere during the third mapping year of Mars Global Surveyor, Icarus, 189, 325–343, doi: 10.1016/j.icarus.2007.01.014. [DOI] [Google Scholar]
- Wang H (2017), Major dust storms and westward traveling waves on Mars, Geophysical Research Letters, 44(8), 3493–3501, doi: 10.1002/2017GL072894. [DOI] [Google Scholar]
- Wang H, and Richardson MI (2015), The origin, evolution, and trajectory of large dust storms on Mars during Mars Years 24–30 (1999–2011), Icarus, 251, 112–127, doi: 10.1016/j.icarus.2013.10.033. [DOI] [Google Scholar]
- Wang H, Richardson MI, Wilson RJ, Ingersoll AP, Toigo AD, and Zurek RW (2003), Cyclones, tides, and the origin of a cross-equatorial dust storm on Mars, Geophysical Research Letters, 30(9), doi: 10.1029/2002GL016828. [DOI] [Google Scholar]
- Wang H, Zurek RW, and Richardson MI (2005), Relationship between frontal dust storms and transient eddy activity in the northern hemisphere of Mars as observed by Mars Global Surveyor, Journal of Geophysical Research: Planets, 110(E7), doi: 10.1029/2005JE002423. [DOI] [Google Scholar]
- Wilson RJ, and Richardson MI (2000), The Martian atmosphere during the Viking mission. I. Infrared measurements of atmospheric temperatures revisited., Icarus, 145, 555–579, doi: 10.1006/icar.2000.6378. [DOI] [Google Scholar]
- Withers P, and Pratt R (2013), An observational study of the response of the upper atmosphere of Mars to lower atmospheric dust storms, Icarus, 225(1), 378–389, doi: 10.1016/j.icarus.2013.02.032. [DOI] [Google Scholar]
- Wolkenberg P, Formisano V, Rinaldi G, and Geminale A (2010), The atmospheric temperatures over Olympus Mons on Mars: An atmospheric hot ring, Icarus, 207(1), 110–123, doi: 10.1016/j.icarus.2009.11.005. [DOI] [Google Scholar]
- Zurek RW, and Smrekar SE (2007), An overview of the Mars Reconnaissance Orbiter (MRO) science mission, J. Geophys. Res, 112, doi: 10.1029/2006JE002701, E05S01. [DOI] [Google Scholar]
Associated Data
This section collects any data citations, data availability statements, or supplementary materials included in this article.