Abstract
The Modern-Era Retrospective Analysis for Research and Applications, version 2 (MERRA-2), is NASA’s latest reanalysis for the satellite era (1980 onward) using the Goddard Earth Observing System, version 5 (GEOS-5), Earth system model. MERRA-2 provides several improvements over its predecessor (MERRA-1), including aerosol assimilation for the entire period. MERRA-2 assimilates bias-corrected aerosol optical depth (AOD) from the Moderate Resolution Imaging Spectroradiometer and the Advanced Very High Resolution Radiometer instruments. Additionally, MERRA-2 assimilates (non bias corrected) AOD from the Multiangle Imaging SpectroRadiometer over bright surfaces and AOD from Aerosol Robotic Network sunphotometer stations. This paper, the second of a pair, summarizes the efforts to assess the quality of the MERRA-2 aerosol products. First, MERRA-2 aerosols are evaluated using independent observations. It is shown that the MERRA-2 absorption aerosol optical depth (AAOD) and ultraviolet aerosol index (AI) compare well with Ozone Monitoring Instrument observations. Next, aerosol vertical structure and surface fine particulate matter (PM2.5) are evaluated using available satellite, aircraft, and ground-based observations. While MERRA-2 generally compares well to these observations, the assimilation cannot correct for all deficiencies in the model (e.g., missing emissions). Such deficiencies can explain many of the biases with observations. Finally, a focus is placed on several major aerosol events to illustrate successes and weaknesses of the AOD assimilation: the Mount Pinatubo eruption, a Saharan dust transport episode, the California Rim Fire, and an extreme pollution event over China. The article concludes with a summary that points to best practices for using the MERRA-2 aerosol reanalysis in future studies.
1. Introduction
The Modern-Era Retrospective Analysis for Research and Applications, version 2 (MERRA-2), is NASA’s latest reanalysis for the satellite era (1980 onward) using the Goddard Earth Observing System, version 5 (GEOS-5), Earth system model. MERRA-2 provides several improvements over its predecessor MERRA-1 (Rienecker et al. 2011), including online aerosol fields that interact with model radiation fields (i.e., aerosol direct and semidirect effects) for the entire period (Randles et al. 2017, hereafter Part I).
In recent years, to better understand the role of aerosols in the climate system and their impacts on air quality, significant efforts have been made to greatly increase both space- and ground-based observations of aerosols. Simultaneously, global aerosol models are becoming more complex while better representing many important observed aerosol properties [especially aerosol optical depth (AOD); Kinne et al. 2006]. Satellite observations have sparse geographical and temporal coverage due to cloud contamination, uncertainties in aerosol retrievals, and sensor-specific data gaps. Although they provide continuity, aerosol models experience uncertainties due to emissions and physical parameterizations. One approach to provide a better representation of aerosols in the atmosphere is to take advantage of both models and sparse observations using data assimilation techniques. By combining the high temporal and spatial coverage of a global model with constraints provided by available observations, the development of data assimilation capabilities can potentially provide a better characterization of aerosols than either a model or observational network alone. Several operational and weather and climate research centers have developed aerosol data assimilation capabilities on a global scale recently (Tanaka et al. 2003; Zhang et al. 2008; Benedetti et al. 2009; Sekiyama et al. 2010; Pérez et al. 2011; Buchard et al. 2015; Rubin et al. 2016; Lynch et al. 2016). Moreover, on regional scales, several studies have shown positive impacts of assimilation of satellite and/or ground-based aerosol observations on air quality forecasts (Li et al. 2013; Chen et al. 2014; Schwartz et al. 2014; Saide et al. 2014; McHenry et al. 2015).
In addition to assimilating bias-corrected Moderate Resolution Imaging Spectroradiometer (MODIS) AOD from both the Terra and Aqua satellites, MERRA-2 includes assimilation of bias-corrected AOD from the space-based Advanced Very High Resolution Radiometer (AVHRR) over ocean. Non-bias-corrected AOD is also assimilated from the space-based Multiangle Imaging SpectroRadiometer (MISR) over bright surfaces and from ground-based Aerosol Robotic Network (AERONET) stations (Level-2 AOD). It is important to evaluate aerosol diagnostics other than AOD. While AOD is directly constrained by observations in MERRA-2, other aerosol diagnostics depend both on the quality of the observed AOD and the quality of the background forecast (i.e., aerosol speciation, size, and vertical structure, plus the assumed optical properties that are used to convert aerosol mass to AOD). Furthermore, like the AOD, these diagnostics also depend on the parameterization of error covariances in the aerosol data assimilation algorithm.
This paper is the second of a pair that summarize our effort to evaluate MERRA-2 aerosol fields. Part I focused on describing the aerosol data assimilation system as well as the performance of MERRA-2 AOD by means of innovation statistics and relative to independent (unassimilated) AOD observations. Here we present an evaluation of MERRA-2 aerosol fields that are not directly constrained during the assimilation process. We assess the performance of the aerosol reanalysis by means of comparisons to ground-based, satellite, and aircraft measurements as in Buchard et al. (2015, 2016). We also focus our analysis on particular events (e.g., volcanic, dust, biomass burning, and pollution events) to demonstrate a sample of the capabilities and limitations of the MERRA-2 aerosol reanalysis. Finally, as in Part I, throughout this study we demonstrate the impact of AOD assimilation on aerosol properties and distributions (see section 2b).
In section 2, we briefly summarize the MERRA-2 aerosol assimilation system and we describe the additional control experiment that is used to highlight the impacts of AOD assimilation. Section 3 presents an assessment of two aerosol properties—the aerosol index (AI) and absorption AOD (AAOD)—compared with Ozone Monitoring Instrument (OMI) measurements. Next, we evaluate the vertical distribution of aerosols using lidar observations from the Cloud–Aerosol Lidar with Orthogonal Polarization (CALIOP) and from airborne High Spectral Resolution Lidar (HSRL) instruments during atmospheric composition field campaigns over the United States. The last part of this section is a qualitative evaluation of MERRA-2 surface PM2.5 on a global scale followed by a quantitative analysis of PM2.5 over the continental United States using data collected by the U.S. Environmental Protection Agency (EPA) and the Interagency Monitoring of Protected Visual Environments (IMPROVE) networks. In section 4, we present case studies of four major aerosol events: the Pinatubo eruption in 1991, a Saharan dust event and transport over the Atlantic in 2010, the Rim Fire that occurred in California in 2013, and an extreme pollution event in China in winter 2013. We conclude in section 5 with a summary that points out the known issues and limitations of the MERRA-2 aerosol fields that are not directly constrained by the assimilated AOD observations.
2. MERRA-2 aerosol system overview
a. MERRA-2 aerosol modeling system
Here we summarize the MERRA-2 modeling system with an emphasis on the treatment of aerosols. An overview of the MERRA-2 modeling system is given by Gelaro et al. (2017), and more details specific to the aerosols in the MERRA-2 system (i.e., aerosol module, emissions, aerosol data assimilation method) can be found in Part I.
Briefly, MERRA-2 uses the GEOS-5 Earth system model (Rienecker et al. 2008; Molod et al. 2015) and the three-dimensional variational data assimilation (3DVar) Gridpoint Statistical Interpolation analysis system (GSI) (Wu et al. 2002; Kleist et al. 2009). The GEOS-5 model is radiatively coupled to the Goddard Chemistry Aerosol Radiation and Transport model (GOCART; Chin et al. 2002; Colarco et al. 2010) aerosol module and simulates five types of aerosols [dust, sea salt, sulfate, and black and organic carbon (BC and OC)]. Aerosol optical properties are as described in Colarco et al. 2010) and are primarily based on the Optical Properties of Aerosols and Clouds (OPAC) database (Hess et al. 1998) with updated dust optical properties that incorporate nonsphericity (Meng et al. 2010; Colarco et al. 2014).
Note that in MERRA-2, aerosol and meteorological observations are jointly assimilated within GEOS-5. The assimilation of AOD in GEOS-5 involves very careful cloud screening and homogenization of the observing system by means of a neural net scheme that translates MODIS and AVHRR radiances into AERONET calibrated AOD (550 nm). The system also assimilates (non bias corrected) MISR 550-nm AOD over bright surfaces (albedo >0.15) and surface-based AERONET AOD observations at 550 nm. (Note that AERONET measurements are interpolated to 550 nm using the Angström relationship and the closest available channels, generally 500 and 675 nm.)
From 2010, GEOS-5 is driven by daily biomass burning emissions derived from MODIS Fire Radiative Power (FRP) retrievals using the Quick Fire Emission Dataset (QFED) emissions (Darmenov and da Silva 2015). As detailed in Part I, prior to 2010 MERRA-2 used monthly mean biomass burning emissions. These emissions apply a QFED scaling to RETROv2 emissions (1980–96; Duncan et al. 2003) and the Global Fire Emission Dataset (GFED), version 3.1 (1997–2009; Randerson et al. 2006; van der Werf et al. 2006). This scaling allowed for the calibration of historical emissions to post-2010 QFED emissions (i.e., it helped to minimize discontinuities between the different biomass burning emission inventories considered). MERRA-2 aerosols are also driven by historical anthropogenic and volcanic emissions used by the Aerosol Comparisons between Observations and Models (AeroCom) modeling community (Diehl et al. 2012; http://aerocom.met.no). The model resolution is 0.5° × 0.625° latitude by longitude with 72 hybrid-eta layers from the surface to 0.01 hPa.
We include assimilation of various quality-controlled AOD observations every 3 h by means of analysis splitting and the local displacement ensemble (LDE) methodology (Buchard et al. 2015, 2016; Part I). The LDE method tries to correct for misplaced aerosol “plumes” by considering aerosol properties (speciation, vertical distribution) in neighboring grid boxes to try and minimize the difference between the model forecast and the assimilated observations (i.e., the AOD increment). Note that in regions where the LDE algorithm is not attempting to correct for misplaced plumes, the AOD increment is applied as a vertical scaling factor (i.e., the extinction profile shifts rather than changes shape). Therefore, in many cases, if aerosol mass at a given level is too high (low) relative to observations, applying the AOD increment can exacerbate (reduce) this bias.
AOD is the total column extinction due to all aerosol species. This two-dimensional property does not contain information about either the vertical distribution of aerosol extinction or the contribution of any given aerosol species to the extinction at any level of the atmosphere. The model forecast determines the aerosol distributions (mass, speciation, vertical location) and, combined with species-specific assumptions of optical properties and hygroscopic growth, we can calculate the AOD (see Part I for further details on the conversion of aerosol mass to optical properties). From the assimilation, we determine an AOD increment (see Part I for further details on the calculation of the AOD increment). Importantly, this 2D AOD increment does not contain sufficient information content to correct errors in the aerosol speciation, the vertical distribution of aerosols, or the model-assumed relationship between aerosol mass and optical properties. Rather, these aerosol distributions and properties arise from the forecast model assumptions and the formulation of the aerosol data assimilation algorithm that includes the LDE methodology.
b. Control experiment without AOD assimilation
To illustrate the impacts of the AOD assimilation, we perform a control run (hereafter M2REPLAY). In this simulation, we used the exact same modeling system used for MERRA-2, driven by MERRA-2 meteorology (winds, temperature, specific humidity) and identical aerosol emissions, but without the assimilation of AOD observations. M2REPLAY was performed in “replay” mode (e.g., Colarco et al. 2010; Buchard et al. 2014). In replay mode, the model functions like an offline chemical transport model (CTM) in that meteorology from a previous analysis (here, MERRA-2) is used to drive the model for a specified period. However, unlike in a CTM where the meteorological state is interpolated between analysis time steps, in the replay framework the system makes self-consistent meteorological forecasts between 6-h analysis times. Because of computational constraints, M2REPLAY was performed for the EOS period (post 2000) only. Importantly, because M2REPLAY does not include AOD assimilation, comparisons of MERRA-2 aerosol fields to M2REPLAY indicate the impact of AOD assimilation on simulated aerosol properties and spatial distributions.
3. Evaluation against independent observations
In section 3, we present an assessment of MERRA-2 aerosol optical properties, vertical distribution, and surface PM2.5 building on our analysis methods from Buchard et al. (2015) and Buchard et al. (2016). We point out that, in constraining the AOD, the assimilation does not directly constrain, for example, the aerosol absorption optical depth, the ultraviolet aerosol index, the aerosol vertical distribution, or the surface concentration (see section 2a). We therefore perform a comparison of these aerosol properties to observations as independent validation for MERRA-2.
We start by comparing MERRA-2 simulated AI and AAOD to OMI retrievals. The vertical distribution of aerosols is evaluated using CALIOP measurements over regions characterized by different aerosol types and over the continental United States using airborne HSRL measurements from several field campaigns. The global distribution of MERRA-2 surface PM2.5 is qualitatively compared to published work from van Donkelaar et al. (2010), and we more quantitatively assess PM2.5 using data collected by the U.S. EPA and IMPROVE networks over the United States.
a. Aerosol optical properties—AI and AAOD
Here we compare MERRA-2 AAOD and ultraviolet AI to observations from OMI. The dataset description and analysis method used here are repeated from Buchard et al. (2015) with some modifications. OMI is a Dutch–Finnish instrument onboard the NASA EOS Aura spacecraft (July 2004–present) that measures scattered sunlight in the 270–500-nm wavelength range with a spatial resolution ranging from 13km × 24km at nadir to about 28km × 150km along its scan edges (Levelt et al. 2006). The near-UV AI, derived from the OMI UV aerosol (OMAERUV) algorithm, is a qualitative parameter useful for detecting the presence of absorbing aerosols in the atmosphere based on a spectral contrast method in the near-UV region where ozone absorption is very small (Herman et al. 1997; Torres et al. 1998, 2007). One interesting aspect of this parameter is that it is directly derived from instrument measurements and consequently is not affected by uncertainties in assumed aerosol properties. AI is well known to be sensitive to aerosol concentration, aerosol optical properties, and aerosol layer height (de Graaf and Stammes 2005; Herman et al. 1997; Hsu et al. 1999; Torres et al. 1998; Colarco et al. 2002). In addition, the OMAERUV algorithm uses OMI-measured reflectances at 354 and 388 nm to derive AOD and AAOD at 388 nm using precomputed top of the atmosphere (TOA) aerosol reflectance look-up tables (LUTs) for a set of 21 aerosol models composed of three aerosol types (dust, carbonaceous aerosols, and sulfate-based aerosols).
Buchard et al. (2015) developed a radiative transfer interface to the Vector Linearized Discrete Ordinate Radiative Transfer (VLIDORT) radiative transfer code (Spurr 2006) to simulate the UV AI from the GEOS-5 aerosol fields at the OMI footprint. Simulated AI can then be directly compared with AI derived from the OMI instrument. The simulated AI is computed as
| (1) |
where is the VLIDORT-calculated TOA radiance at 354 nm using MERRA-2 simulated aerosol concentrations, and is the TOA radiance at 354 nm without aerosols assuming the adjusted Lambertian equivalent reflectivity (LER) at 388 nm (). Additional details on the calculation of AI using the VLIDORT simulator can be found in Buchard et al. (2015).
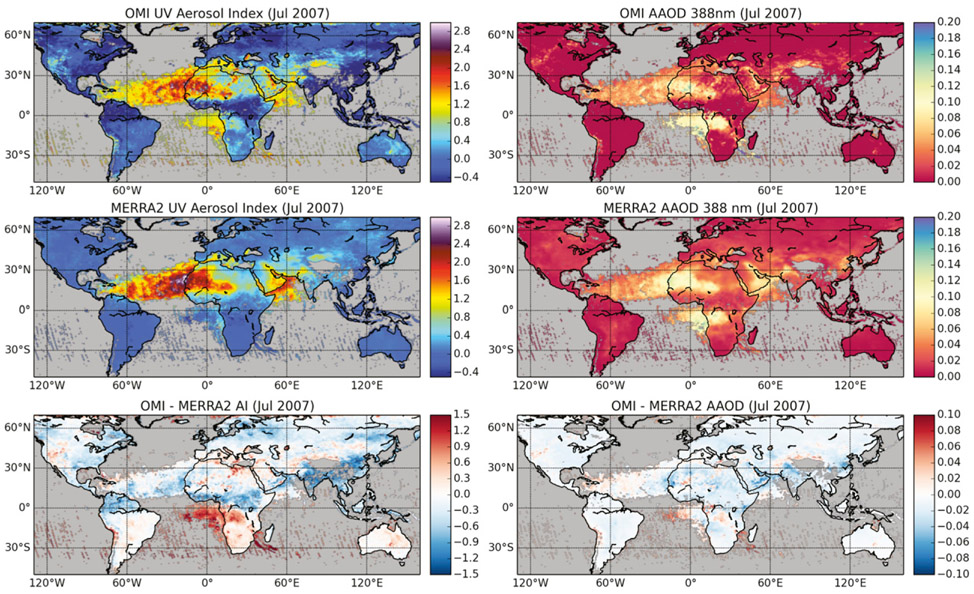
Figure 1 shows the monthly mean OMI and MERRA-2 UV AI and AAOD for July 2007. For both the AI and AAOD comparisons shown here, we use the research version of the Level-2 OMAERUV aerosol data products (Torres et al. 2013) that were used in the Buchard et al. (2015) AAOD comparison. Note that AAOD depends on the optical properties assumed at one wavelength and is proportional to aerosol mass, which is constrained during the AOD assimilation. AI, on the other hand, depends on the spectral absorption contrast between two UV wavelengths. Thus, good performance in one parameter (AAOD) does not guarantee the same performance for the other one (AI).
Fig. 1.
Monthly mean (left) OMI UV AI and (right) AAOD (top) observed and (middle) simulated for July 2007. (bottom) Difference of OMI minus MERRA-2.
Globally, MERRA-2 simulates the AI reasonably well compared with OMI. Previously, we had compared an earlier EOS-period offline AOD analysis [MERRA Aerosol Reanalysis (MERRAero); Buchard et al. 2015] to OMI AAOD and AI. In that study, our comparisons enabled us to develop improved dust optical tables that were subsequently used in MERRA-2. Also, unlike Buchard et al. (2015), MERRA-2 includes assimilation of MISR over bright desert regions as well as AERONET observations. For these reasons, compared with Buchard et al. (2015), we see better agreement between MERRA-2 and OMI AI over dusty regions [see Fig. S1 in the online supplemental material for results from Buchard et al. (2015)]. However, we still see AI biases between OMI and MERRA-2 in biomass burning regions, particularly in southern Africa. Previous analysis attributed this to the assumed spectral dependence of near-UV absorption from biomass burning aerosols (mainly OC) in the model (Buchard et al. 2015). MERRA-2 uses the same OC optical properties as this previous work. We are currently evaluating revised optical tables for biomass burning aerosol to account for “brown carbon” absorption in the UV (e.g., Hammer et al. 2016). Finally, compared with Buchard et al. (2015), the MERRA-2 388-nm AAOD shows improved agreement with OMI, particularly in parts of Asia and over the Indo-Gangetic plain in India, regions impacted by complex mixtures of both dust and anthropogenic aerosol.
b. Vertical distribution of aerosols—Backscatter and extinction profiles
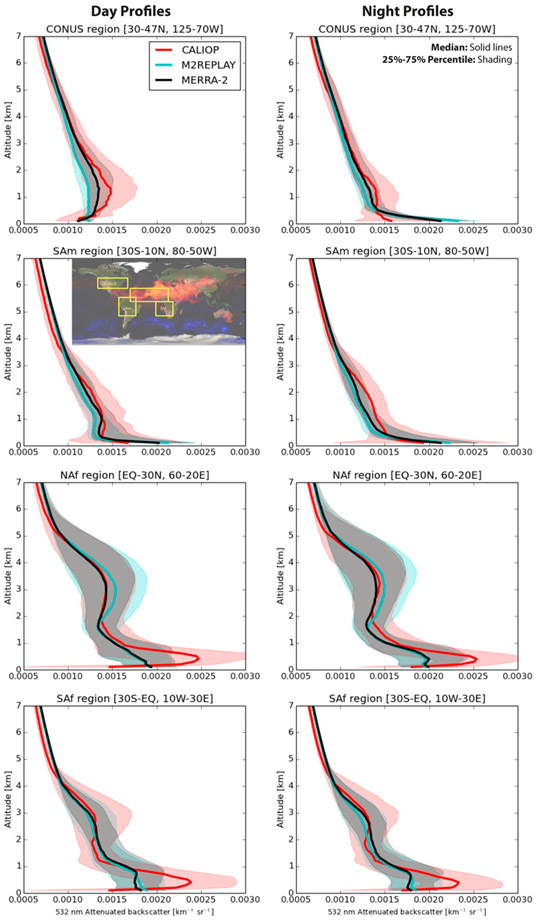
Since 2006, the CALIOP instrument, carried by CALIPSO as part of the NASA A-Train (Winker et al. 2007, 2009) has provided important global information about aerosol vertical structure. Previous work (MERRAero; Buchard et al. 2015, 2016) showed that the model and AOD assimilation produced aerosol speciation and vertical distributions that compared well to the CALIOP vertical feature mask (Colarco et al. 2014; Nowottnick et al. 2015). Figure 2 compares the vertical structure of 532-nm attenuated backscatter from MERRA-2 and M2REPLAY sampled along the CALIOP track over regions of particular interest (e.g., the dust transport region from northern Africa to the North Atlantic, biomass burning regions of southern Africa and the Amazon, and over the continental United States; see inset map for region definitions). Seasonal medians are shown separately during the day and night for the period June–August (JJA) 2008. The shaded area indicates the 25th–75th percentiles of all profiles.
Fig. 2.
Seasonal (JJA 2008) vertical profiles of CALIOP attenuated backscatter coefficient (km−1 sr−1) at 532 nm and derived from model simulations sampled on the CALIOP path and averaged over (first row) the continental United States, (second row) South America, (third row) northern Africa, and (fourth row) southern Africa. The solid lines are the median of all profiles for CALIOP (red), MERRA-2 (black), and M2REPLAY (cyan) during the (left) day and (right) night. Shaded areas represent the 25th–75th percentile of all modeled and observed profiles. The inset map provides regional definitions.
The following data description and analysis method follow Buchard et al. (2016) with minor modifications. We consider CALIOP, version 3.01, Level 1B attenuated backscatter. These observations have been cloud-cleared using the Level 2 vertical feature mask, and they were averaged to a uniform resolution (20 km horizontally, 60 m vertically). Each profile consists of (at most) an average of 120 full samples (each sample is ~⅓ km horizontal × 30 m vertical resolution). The observations here include contributions from both aerosols and gas molecules (Rayleigh scattering). CALIOP extinction profile retrievals are derived using assumed extinction-to-backscatter ratios that are unlikely to be consistent with the ratios assumed in MERRA-2 [e.g., nonspherical dust optics from Colarco et al. 2014]. While we can easily compute the aerosol-only backscatter in MERRA-2, the removal of the molecular scattering contribution from the CALIOP observed attenuated backscatter may lead to a source of error. Therefore, as in Buchard et al. (2016), here we restrict our analysis to the total (aerosol plus molecular) attenuated backscatter coefficient.
Generally, MERRA-2 tends to exhibit similar vertical structure as CALIOP over these important aerosol source regions, with maximum attenuated backscatter values at about the same height. The near-surface attenuated backscatter is underestimated in northern and southern Africa. Examining meridional profiles (not shown), an underestimation of the MERRA-2 attenuated backscatter values for sea salt type aerosols near the ocean surface is observed relative to CALIOP. This underestimation could be due to, for example, errors in aerosol mass in the lowest layers of MERRA-2 atmosphere or errors in the conversion from aerosol mass to optical properties, which includes the prescription of hygroscopic growth.
Recall that the AOD analysis is performed by means of analysis splitting (Part I, section 3 therein): having derived 2D AOD analysis increments, the 3D analysis increments of aerosol mass concentration are then computed using an ensemble formulation for the background error covariance. This calculation is performed using the LDE methodology under the assumption that ensemble perturbations represent misplacements of the aerosol plumes. Consequently, changes in mass may not be applied uniformly to the aerosol types in the central grid box, which, through the LDE methodology, is influenced by neighboring gridbox properties such as speciation and vertical distribution. Here we show that although we assimilate 2D AOD in MERRA-2, the aerosol assimilation system (AOD analysis 1 LDE methodology) tends to improve the vertical distribution of MERRA-2 aerosols, which are generally closer to the observation profiles than the M2REPLAY control simulation. This improvement is seen more readily during daylight hours, when it is possible to assimilate AOD observations (i.e., passive satellite sensors and ground-based sunphotometers can only measure AOD during the day).
Next, following the analysis method first described in Buchard et al. (2016), we compare MERRA-2 to HSRL measurements deployed during the NASA Deriving Information on Surface Conditions from Column and Vertically Resolved Observations Relevant to Air Quality (DISCOVER-AQ; https://www.nasa.gov/mission_pages/discover-aq/) and Studies of Emissions and Atmospheric Composition, Clouds, and Climate Coupling by Regional Surveys (SEAC4RS; http://www.nasa.gov/mission_pages/seac4rs) field campaigns. These aircraft campaigns sampled aerosol properties with in situ and remote sensing instruments over large regions of the United States (Baltimore–Washington, D.C. in July 2011; San Joaquin Valley, California, in January–February 2013; and the southeastern United States and Houston, Texas, in August–September 2013).
HSRL measures vertical profiles of aerosol extinction (systematic error <0.01 km−1), backscatter, and depolarization at 532 nm, without involving any additional aerosol measurements or requiring assumptions about aerosol type (Hair et al. 2008). During the campaigns considered, three different instruments that share similar measurement techniques and analysis algorithms were used (HSRL-1, HSRL-2, and the Differential Absorption Lidar or DIAL/HSRL). While HSRL-1 and HRSL-2 only have a nadir view of the atmosphere, DIAL/HSRL retrieves aerosol profiles above and below the aircraft.
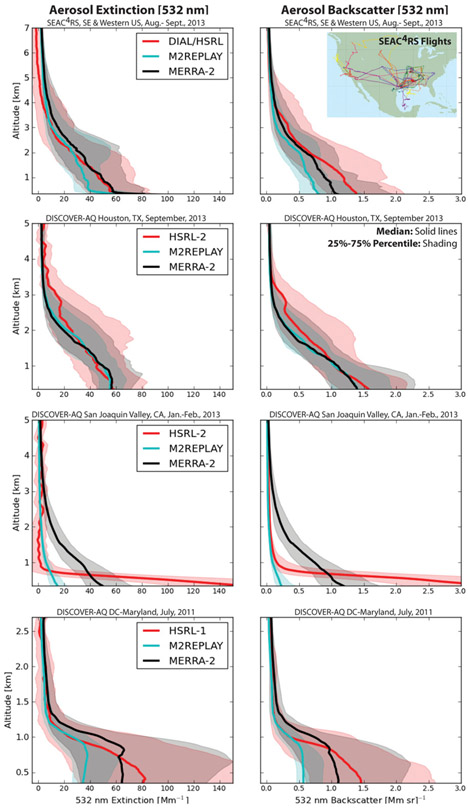
Figure 3 compares the campaign median extinction and backscatter profiles from the various phases of the DISCOVER-AQ and SEAC4RS campaigns to MERRA-2 profiles collocated along the aircraft trajectories. In general, given the variability of the profiles encountered (shading) and the model resolution, MERRA-2 shows good agreement with the observed vertical profiles of extinction and backscatter over the continental United States. Over Houston MERRA-2 is missing HSRL-detected aerosol layers above the boundary layer that are likely due to long-range smoke transport from the northwestern United States. Recall that in MERRA-2 biomass burning emissions are deposited in the boundary layer without consideration of local buoyancy enhancement by fire heat fluxes (e.g., Freitas et al. 2007), a feature that could explain this deficiency in vertical structure (e.g., Colarco et al. 2004). During SEAC4RS, however, MERRA-2 backscatter and extinction generally agree well with observations near fire sources and above the boundary layer (see section 4c).
Fig. 3.
Vertical profiles of (left) extinction and (right) backscatter coefficients measured by HSRL instruments and derived from the MERRA-2 and M2REPLAY simulations sampled on the HSRL flight path during U.S. aircraft-based field campaigns. (first row) SEAC4RS (southeastern and western United States, August–September 2013), (second row) DISCOVER-AQ Houston (August–September 2013), (third row) DISCOVER-AQ California (San Joaquin Valley, January–February 2013), and (fourth row) DISCOVER-AQ Baltimore–Washington, DC (July 2011). The solid red, black, and cyan lines are the median of all profiles for HSRL, MERRA-2, and M2REPLAY, respectively. Shaded areas are the 25th–75th percentile of all modeled and observed profiles.
The largest disagreement between HSRL and MERRA-2 is over the San Joaquin Valley region of California (Fig. 3, third row). HSRL detects a shallow aerosol layer near the surface with strong increases in surface aerosol extinction and backscatter not seen in MERRA-2. Possible explanations for this model low bias include an unrealistic representation of the boundary layer and/or a low bias in aerosol surface emissions [e.g., not including nitrate aerosols in the model or underestimating OC emissions during the winter; see Buchard et al. (2016) and section 3c herein]. As seen with CALIOP comparisons, the aerosol assimilation system generally tends to bring MERRA-2 profiles closer to the observations than the control simulation (M2REPLAY) profiles.
c. Surface mass—PM2.5 over the United States
Fine aerosols near the surface with diameters less than 2.5 μm, known as PM2.5, negatively impact both air quality and human health (e.g., Pope et al. 2009; Pope and Dockery 2013). Air quality monitoring networks exist in various regions over the globe, but they offer sparse geographical and temporal coverage. The use of data assimilation systems as an integrator of observations and models can potentially provide better spatio-temporal forecasts of PM2.5 for use by the air quality scientific community.
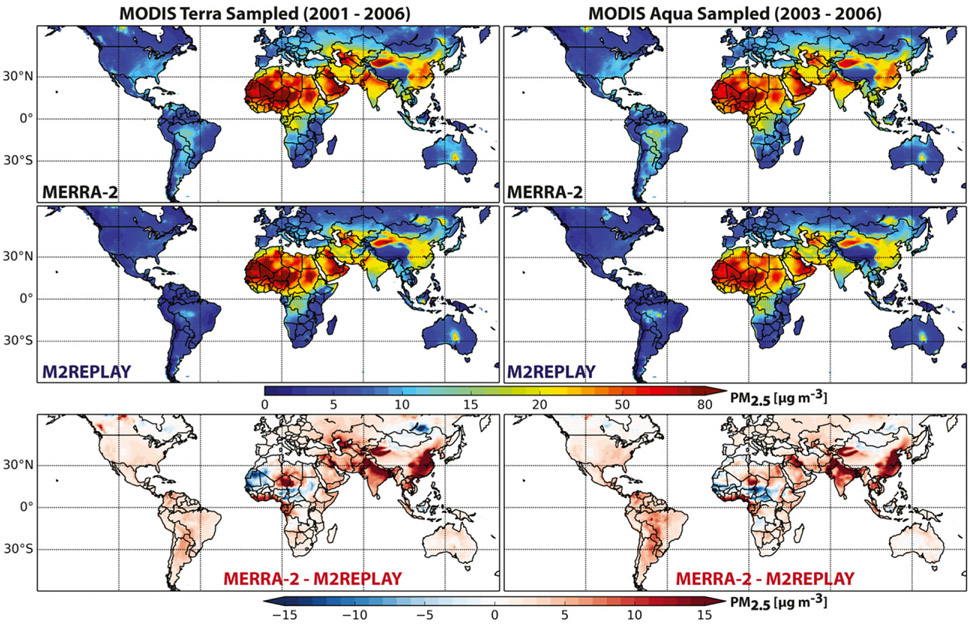
Here we first qualitatively examine the global MERRA-2 surface aerosol concentrations compared with van Donkelaar et al. (2010), who provide a long-term average of satellite-derived PM2.5. They combined observed AOD from MODIS and MISR with aerosol simulations from the GEOS-Chem chemical transport model to estimate PM2.5 on a global scale. Figure 4 shows global maps of MERRA-2 and M2REPLAY surface PM2.5 sampled at MODIS Terra and Aqua overpass locations, as well as the differences between MERRA-2 and M2REPLAY for the periods 2001–06 and 2003–06, respectively. Compared with M2REPLAY, which does not include AOD assimilation (section 2b), MERRA-2 is in closer agreement with the observation-based estimate of van Donkelaar et al. (2010, their Fig. 4). Relative to M2REPLAY, biases with van Donkelaar et al. (2010) are reduced for MERRA-2 in the Western Hemisphere (e.g., over the southeast United States and over biomass burning regions in South America), in Asia, and in Europe. However, compared with van Donkelaar et al. (2010), MERRA-2 PM2.5 appears to be overestimated over arid regions and underestimated over China. This is consistent with Randles et al. (2016, their Fig. 4.14), who show an underestimation of MERRA-2 sulfate surface concentrations relative to observations from the Acid Deposition Monitoring Network in East Asia (EANET; EANET 2001 2006).
Fig. 4.
Global map of simulated total surface PM2.5 (μg m−3) from (top) MERRA-2 and (middle) M2REPLAY where both simulations were collocated with MODIS (left) Terra and (right) Aqua orbits for 2001–06 and 2003–06, respectively. (bottom) Difference of MERRA-2 minus M2REPLAY.
Next, we perform a more detailed analysis as in Buchard et al. (2016) using surface PM2.5 data collected from the EPA and IMPROVE networks over the United States. The data description and analysis methods used to compare our modeled PM2.5 with observations were originally presented in Buchard et al. (2016); the text that follows is derived from that work with minor modifications. The U.S. EPA collects observations of surface PM2.5 using a filter-based method on an integrated 24-h basis and also measures surface aerosol speciation as part of their Air Quality System (AQS) and Chemical Speciation Network (CSN), respectively. Both of these networks tend to be located in suburban or urban locations primarily in the eastern part of the United States (Malm et al. 1994, 2011). PM2.5 daily speciation measurements are also available from more than 150 mostly remote or rural locations as part of the IMPROVE network operated by the National Park Service and other federal agencies (Malm et al. 1994; Hand et al. 2011). From these IMPROVE individual component measurements (dust, sea salt, black and organic carbon, ammonium sulfate, and nitrate), we are able to calculate the reconstructed fine mass (RCFM) defined in Buchard et al. [2016, their Eq. (2)]. For this study, MERRA-2 PM2.5 has been sampled at EPA-AQS (EPA parameter 88101) and IMPROVE observation locations and times.
We calculate daily averages (in observation local time) using hourly output from MERRA-2. We restrict our analysis to observations from suburban and rural sites because PM2.5 concentrations in urban areas are generally not representative of gridbox mean values (i.e., they tend to be higher and less uniform than suburban and rural sites). We also use a statistical quality control method, the adaptive buddy check of Dee et al. (2001), to further remove in situ observations that are unrepresentative of gridbox mean conditions. We refer to Buchard et al. (2016) for additional details about each observation network and the calculation of the RCFM from model aerosol components.
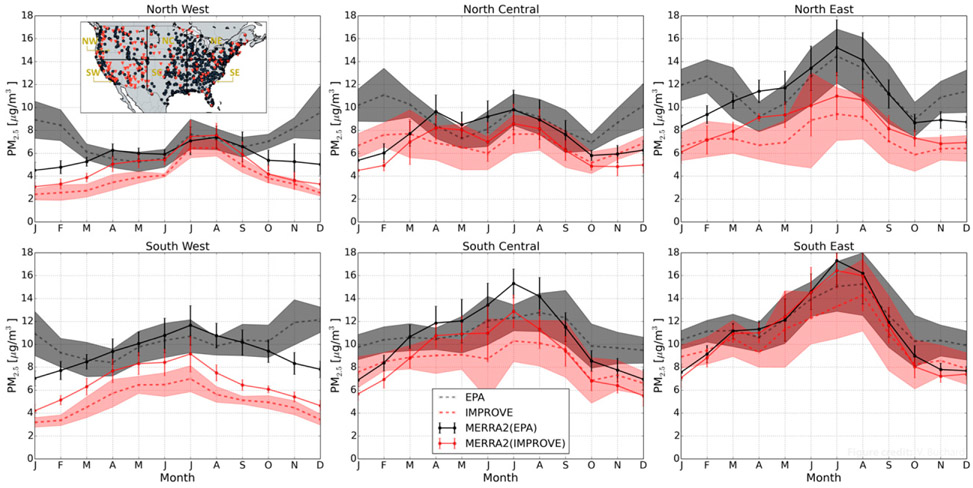
Figure 5 compares the monthly-mean MERRA-2 PM2.5 with observations from the EPA-AQS and IMPROVE networks over several regions of the United States (defined in the inset map). Overall, MERRA-2 PM2.5 compares well with observations. MERRA-2 PM2.5 is similar to results from our previous offline AOD reanalysis (MERRAero; Buchard et al. 2016, and Fig. S2 herein), although MERRA-2 has higher PM2.5 in the eastern United States in summer. MERRA-2 PM2.5 is in better agreement with rural IMPROVE observations compared with more suburban EPA-AQS observations. The largest biases between MERRA-2 and EPA-AQS are found in the winter over the northwest and northeast regions. As was shown in Buchard et al. (2016), these biases stem from the lack of nitrate aerosols in GOCART and an underestimation of OC emissions sources in suburban areas [see Randles et al. (2016), their Fig. 4.13, for comparisons of aerosol speciation].
Fig. 5.
Monthly and regional variations of surface PM2.5 (μg m−3) from both EPA-AQS (gray dashed) and IMPROVE (red dashed) networks compared with MERRA-2 PM2.5 sampled at IMPROVE sites (red solid) and EPA sites (black solid) located in the U.S. northwestern (NW), north-central (NC), northeastern (NE), southwestern (SW), south-central (SC), and southeastern (SE) regions over the period 2003–12. Vertical bars are the standard deviations of monthly values calculated from years 2003 to 2012 for the model; shaded area is the same for the observations. The encompassed map shows the location of EPA-AQS (black) and IMPROVE (red) stations and the dividing black lines indicate the six regions considered.
The comparison of MERRA-2 ammonium sulfate, BC, and OC to the observations is similar to the results in Buchard et al. (2016). However, MERRA-2 shows a larger overestimation of dust and especially sea salt, regardless of the network. The springtime overestimate in dust is likely due to excessive local emissions and transport of Asian dust. Two things contribute to the overestimation of sea salt PM2.5: 1) there are errant emissions of sea salt over several lakes including the Great Lakes due to an issue in the lake-masking algorithm (Part I, Fig. 1 therein) and 2) sea salt aerosol intrusions occur in some coastal regions (Randles et al. 2016). Furthermore, any penetration of sea salt into coastal regions can be exacerbated by the assimilation if forecasted AOD is lower than observed. However, while these issues have consequences for surface PM in some locations (e.g., Randles et al. 2016, their Fig. 4.22, and this study), they have minimal impact on the MERRA-2 assimilated AOD fields (e.g., Part I, Figs. 7 and 8 therein).
4. Case studies
Previously we have examined the performance of MERRA-2 aerosol properties and distributions using various independent observational datasets on global and regional scales. Here we focus our analysis on four major aerosol events. We have shown in section 3 herein and in Part I that the AOD assimilation generally has a positive impact on the simulation of aerosols in MERRA-2 compared with both observations and M2REPLAY. However, the case studies presented next point out that AOD assimilation can also negatively impact some or all aerosol properties for a given time and place. Since diagnosing such biases is not always possible (e.g., due to computational resource limitations), it is crucial to consider available observations in addition to the analyzed aerosol fields when studying aerosol events. Within the context of these case studies, we demonstrate both model skill as well as important caveats to consider when using MERRA-2 aerosol products that are less constrained by the AOD assimilation.
a. Volcanic eruption: Mount Pinatubo eruption in June 1991
The Stratospheric Aerosol and Gas Experiment (SAGE) II instrument (Mauldin et al. 1985) provides observations of aerosol properties in the stratosphere. It continuously measured aerosol extinction profiles at four wavelengths from October 1984 to August 2005. In this study, we use a reconstructed version of SAGE II monthly extinction profiles and stratospheric AOD observations at 525 nm (Thomason and Peter 2006; L. Thomason 2016, unpublished manuscript) to evaluate the MERRA-2 stratospheric aerosol properties during the Mount Pinatubo eruption. This dataset is a monthly-mean reconstruction from a combination of SAGE II and Cryogenic Limb Array Etalon Spectrometer (CLAES; Mergenthaler et al. 1995) observations. Because SAGE II was a limb instrument that observed the same latitude approximately twice a month, we have subsampled MERRA-2 extinction profiles using SAGE II instrument overpass times (where available) prior to making monthly averages. Where the Thomason and Peter (2006) dataset (also L. Thomason 2016, unpublished manuscript) uses CLAES observations (because SAGE II observations were otherwise unavailable), we have filled out our model data with a strict monthly mean of MERRA-2 extinction profiles without sampling because CLAES overpass times were not available. Thus, we note the caveat that this comparison is more qualitative than quantitative due to these important sampling differences.
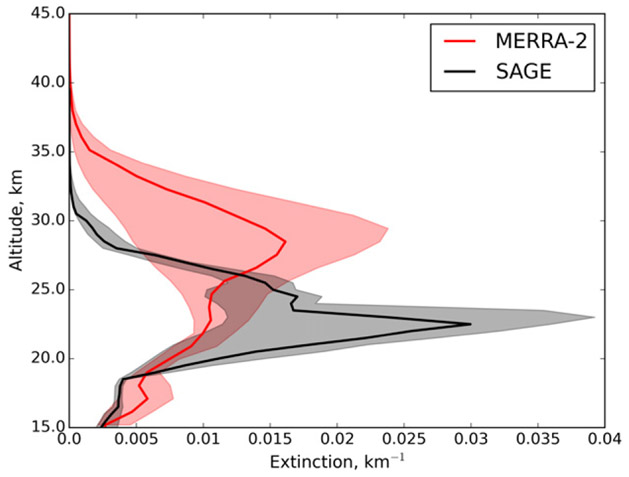
Figure 6 shows seasonal median of the vertical distribution of extinction from SAGE II and MERRA-2 at 525 nm averaged over the tropics (20°N–20°S) for the period from June to December 1991, the 6-month period following the 15 June 1991 eruption of Mt. Pinatubo in the Philippines; shading indicates the 25th–75th percentiles of all profiles for that period. Clearly, the MERRA-2 maximum extinction value appears to be too high in altitude compared with SAGE. This is likely due to the model’s injection of SO2 up to 30 km into the stratosphere, as indicated by the AeroCom eruptive volcanic emissions database (Diehl et al. 2012). More recent estimates suggest a smaller SO2 injection amount and lower altitude of injection (Carn et al. 2016). The peak stratospheric extinction in MERRA-2 is less than the peak extinction in the SAGE-II observations. However, integrating the extinction over the stratospheric column, we note that the MERRA-2 stratospheric AOD exceeds the observed stratospheric AOD.
Fig. 6.
Vertical profile of SAGE II (black) and MERRA-2 (red) aerosol extinction averaged over the tropics (20°S–20°N) after the Mount Pinatubo eruption from July to December 1991. The solid lines are the median and shaded areas represent between the 25th and 75th percentiles of all modeled and observed profiles.
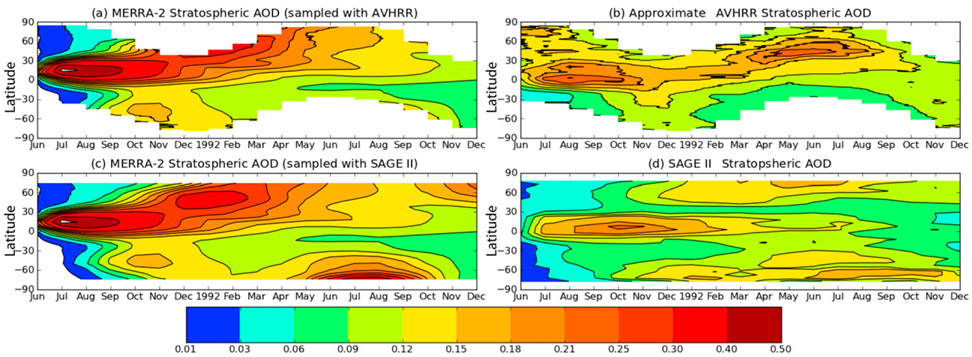
Figure 7 (bottom row) compares the zonal-mean stratospheric AOD to the reconstructed SAGE II AOD at 525 nm. We again subsample model extinction using SAGE II overpass times. Note that stratospheric AOD is not separately archived in MERRA-2; we calculate it by integrating each aerosol extinction profile above the model-diagnosed tropopause level. We also compare the zonal-mean MERRA-2 stratospheric AOD sampled with AVHRR observation times to an estimate of stratospheric AOD based on the AVHRR AOD anomaly after Pinatubo (Fig. 7, top row). To construct this anomaly, as in Aquila et al. (2012), we subtract out a 7-yr climatology of total column AOD unaffected by major volcanic eruptions from AVHRR observed AOD after Pinatubo. Note that Fig. 7 uses the same neural net retrieval AVHRR observations as used in the assimilation.
Fig. 7.
Comparison of stratospheric AOD from MERRA-2 and available observational reconstructions. (a) MERRA-2 AOD (monthly mean) computed for the portion of the atmospheric column above the model tropopause and where AVHRR observations are available. (b) AVHRR AOD anomaly computed by subtracting from the post-Pinatubo AVHRR AOD a 7-yr climatology of AVHRR AOD less affected by major volcanic eruptions (climatology computed for 1986–90 plus 1995–96 AVHRR AOD), (c) MERRA-2 AOD computed for the portion of the atmospheric column above the model troposphere and where SAGE II extinction profiles were available. (d) Reconstructed SAGE II stratospheric AOD from Thomason and Peter (2006) and L. Thomason (2016, unpublished manuscript).
In both comparisons shown in Fig. 7, MERRA-2 stratospheric AOD is too high compared with available observations. This overestimation is due to 1) the increased stratospheric lifetime associated with an injection of SO2 that is too high (work in progress suggests a maximum injection altitude of ~22 km) and 2) the treatment of the volcanic aerosol as tropospheric-sized particles. MERRA-2 carries a single sulfate tracer and thus assumes that all sulfate aerosols have the same dry size distribution and hygroscopic growth properties. For this tracer, we are using an effective radius that is more appropriate for nonvolcanic tropospheric aerosols (Aquila et al. 2012). Thus, in the assimilation for the amount of injected SO2, we overestimate stratospheric sulfate aerosol AOD because smaller particles are more efficient at scattering light. The model does show the plume traveling toward both hemispheres as observed; however, the volcanic plume spreads too quickly from the tropics to the polar regions whereas SAGE and AVHRR indicate that the plume was confined in the tropics for a longer period of time than simulated. This is likely due to the distribution of SO2 up to 30 km into the stratosphere (Fig. 6). Note that the increased AOD at very high latitudes (>60° latitude) in boreal summer is 1) not impacted by the AVHRR assimilation since no data exist at these latitudes and 2) is due to having highly hygroscopic sulfate particles in a very high (>80%) relative humidity environment.
It is important to note that, because of AOD data assimilation, the eruptions of Pinatubo and El Chichón had consequences not only on MERRA-2 sulfate AOD but also on the AOD of other species, especially dust and sea salt (Part I). As shown previously, MERRA-2 over-estimates stratospheric sulfate aerosol AOD after Pinatubo, and, compared with available observations, does not match the shape of the observed aerosol extinction profile. When the assimilation tries to reduce the total (stratospheric 1 tropospheric) AOD to minimize differences with assimilated observations, it applies negative AOD increments to all species, at all levels—not just stratospheric sulfate aerosols (Part I, Fig. 5a therein). The scaling of the entire extinction profile to lower levels (and hence lower AOD) causes an apparent decrease in aerosol species found closer to the surface (e.g., dust and sea salt) after the El Chichón and Pinatubo eruptions. This decrease in extinction below the stratosphere is an artifact of the assimilation process and the parameterization of volcanic aerosols (i.e., emissions injection height and amount, assumed particle size; Part I). Such behavior of the aerosol assimilation system stresses the importance of refining the model forecast of major volcanic events before performing any type of aerosol data assimilation.
b. Saharan dust event and transport
Desert dust is one of the main contributors to the global aerosol burden (Textor et al. 2006), and dust has a large impact on Earth’s radiative budget because it absorbs and scatters both solar and thermal radiation (Balkanski et al. 2007; Colarco et al. 2014). Additionally, deposition of desert dust into the ocean is an important source of iron and therefore influences phytoplankton growth rates (i.e., atmospheric carbon dioxide uptake in ocean) and biosphere–climate interactions (Mahowald et al. 2009; Tagliabue et al. 2009).
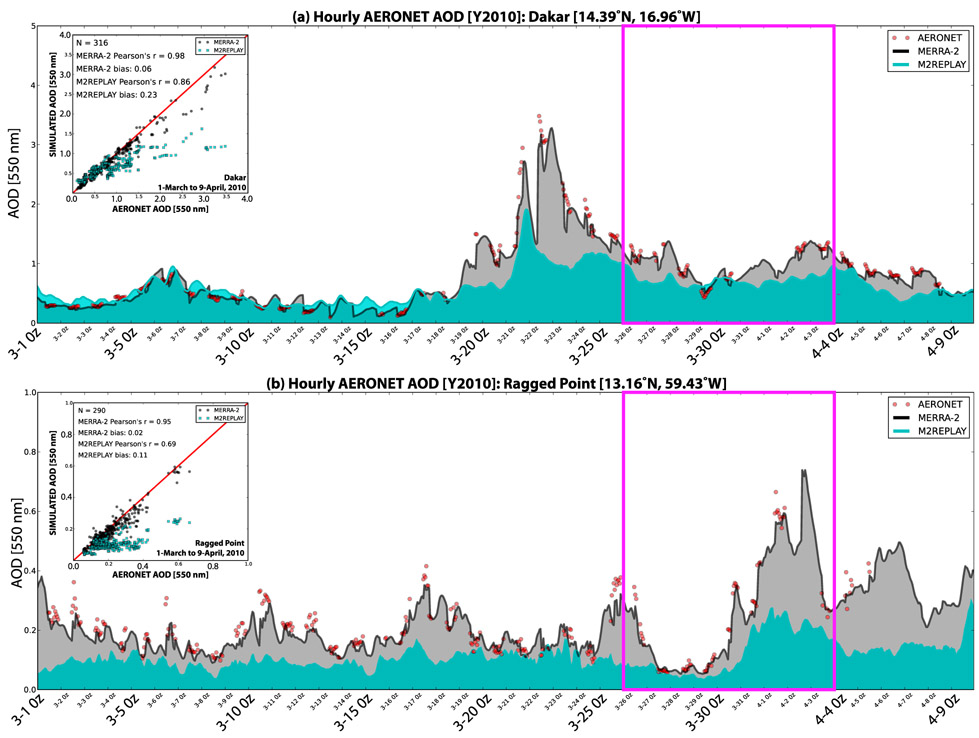
North African deserts are the largest source of dust emissions. Much of this dust gets transported to the west across the Atlantic Ocean, reaching the Caribbean (Prospero and Nees 1986; Prospero and Lamb 2003; Chiapello et al. 2005), the southern United States, and South America at times (Prospero et al. 2010; Yu et al. 2013). Figure S4 shows an illustration of MERRA-2 trans-Atlantic dust transport between the end of March 2010 and early April 2010. To quantitatively illustrate differences between MERRA-2 and M2REPLAY, we evaluate the model simulated AOD at 550 nm with ground-based AERONET measurements (Holben et al. 1998; Level 2) at two stations, Dakar (14.39°N, 16.96°W) near the North African dust sources and Ragged Point in Barbados (13.16°N, 59.43°W), in Fig. 8. Of course, these data were assimilated in MERRA-2, but comparing and contrasting to the control simulation (M2REPLAY) indicates the impact of the assimilation on the AOD and dust transport across the Atlantic. These time series of hourly AOD illustrate that M2REPLAY generally tends to underestimate AERONET AOD, except at Dakar near to the dust sources before the major dust event. MERRA-2 constrained AOD, as expected, is generally better able to capture the observed values at both stations both prior to and during the event.
Fig. 8.
Time series of hourly AOD for the March–April 2010 dust event as observed by AERONET (red dots) and simulated by MERRA-2 (black) and M2REPLAY (cyan) (top) near the North African dust source (Dakar) and (bottom) across the Atlantic at Barbados (Ragged Point). The pink square highlights the time period shown in the illustration of the dust event (Fig. S4). The inset plots show the statistical relationship between collocated observations and the two simulations (see supplemental material for larger versions of the insets).
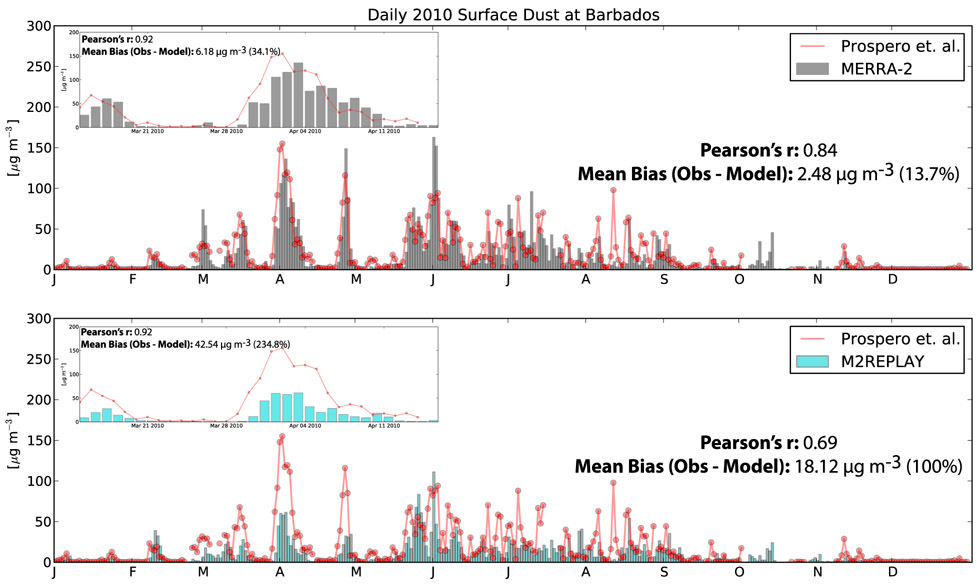
Finally we examine modeled daily-mean dust surface concentration using observations collected at Barbados station (Prospero and Nees 1986; Prospero and Lamb 2003) for the whole year 2010 (Fig. 9). The observations show a clear annual cycle in dust transport from northern Africa to the Caribbean, with a winter minimum, a pronounced summer maximum, and a secondary maximum in the spring. Both MERRA-2 and M2REPLAY show a high degree of correlation with the observed surface mass concentration (r ≥ 0.69 for the entire year and r ≥ 0.92 for the April dust storm shown in the inset plots). However, MERRA-2 is better at capturing the high values of dust mass measured at the surface that are missed by the M2REPLAY with a reduced mean bias (observation — model), particularly during the spring event. Combining the results of this case study with our analysis of vertical profiles from CALIPSO off the northern coast of Africa (Fig. 2), we conclude that the aerosol assimilation methodology (2D analysis combined with LDE methodology) has an overall positive impact on the representation of dust aerosol distribution and transport from the Sahara to the Caribbean. Additionally a climatology of monthly-mean dust surface concentration at the Barbados station for the period 1984–2009 (see Randles et al. 2016, their Fig. 4.16 and Fig. S5) shows that the long-term dust surface concentration seasonal cycle is well simulated in MERRA-2 compared to observations.
Fig. 9.
Time series of observed (red) daily surface dust (μg m−3) at Barbados in 2010. Simulated daily surface dust from (top) MERRA-2 (black bars) and (bottom) M2REPLAY (cyan bars) is also shown, with statistics given in each panel. Inset plots zoom in on the March–April 2010 dust event (see supplemental material for larger versions of the inset).
c. The Rim Fire of summer 2013 in California
The Rim Fire of the summer of 2013 affected the central Sierra Nevada and was one of the largest wild-fires in California’s history (Peterson et al. 2015). Instruments deployed during the SEAC4RS campaign described in section 3 were able to take measurements of the Rim Fire’s smoke plume on 26 and 27 August, providing us with an opportunity to examine the ability of MERRA-2 and M2REPLAY to reproduce this large biomass burning event.
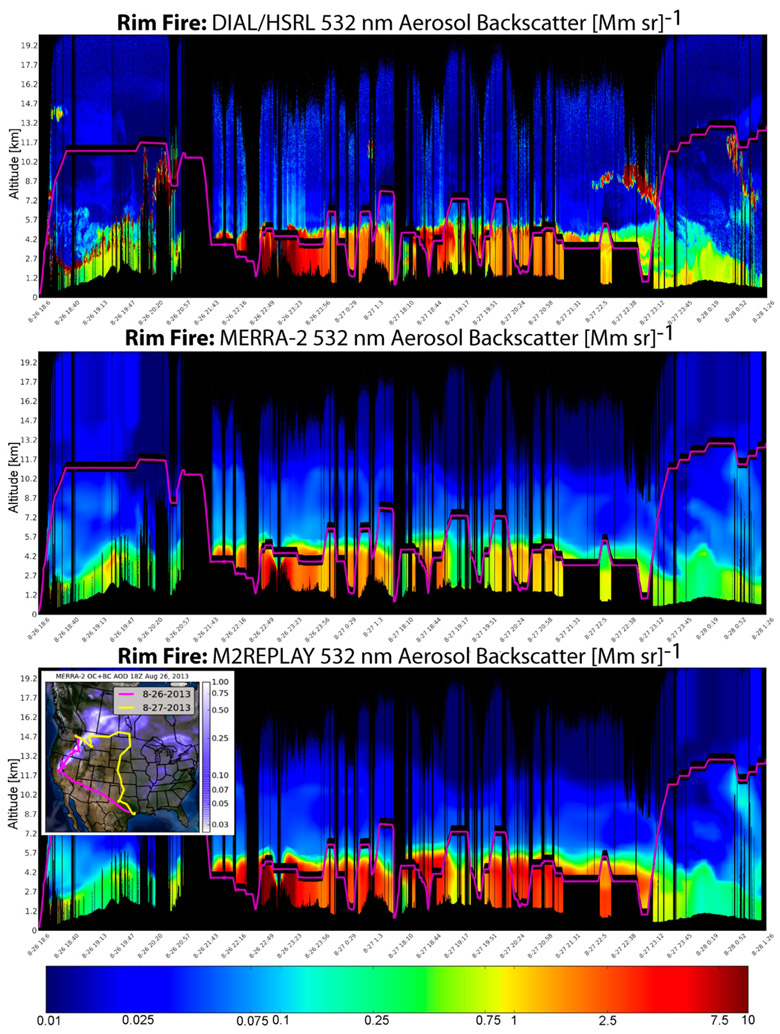
Figure 10 shows the time series of MERRA-2 and M2REPLAY vertical distribution of aerosol backscatter coefficient at 532 nm compared with the DIAL/HSRL measurements onboard the NASA DC-8 aircraft on 26 and 27 August. Both simulations have been sampled in space and time along the aircraft flight path (shown on the inset map). The DIAL/HSRL measurements show that the smoke particles are well mixed in a layer from the surface extending up to ~5 km, with the highest backscatter near the fire emission source. Examining the model simulations, both MERRA-2 and M2REPLAY are able to reproduce the smoke plume from about 5 km down to the surface. Near the Rim Fire, M2REPLAY backscatter is more consistent with the DIAL/HSRL measurements, exhibiting a strong backscatter, while MERRA-2 appears generally weaker. This suggests that the QFED biomass burning emissions and the meteorological state from the model (e.g., wind and boundary layer height) provided good initial conditions in the forecast model near the fire emission source. The assimilation applied a negative increment because the assimilated observations of AOD were lower than the forecast AOD in this particular model grid box. In contrast, farther away from the fire source, MERRA-2 exhibits improved backscatter relative to the DIAL/HSRL measurements compared with M2REPLAY, which is generally too strong away from the biomass burning source.
Fig. 10.
Curtain plots of aerosol backscatter coefficient from the SEAC4RS Rim Fire flights (26 and 27 Aug 2013). (top) Observations at 532 nm from the DIAL/HSRL instrument aboard the NASA DC8, with pink lines indicating the altitude of the aircraft. Aerosol backscatter simulated by (middle) MERRA-2 and (bottom) M2REPLAY, where both simulations have been sampled along the flight tracks shown in the inset map.
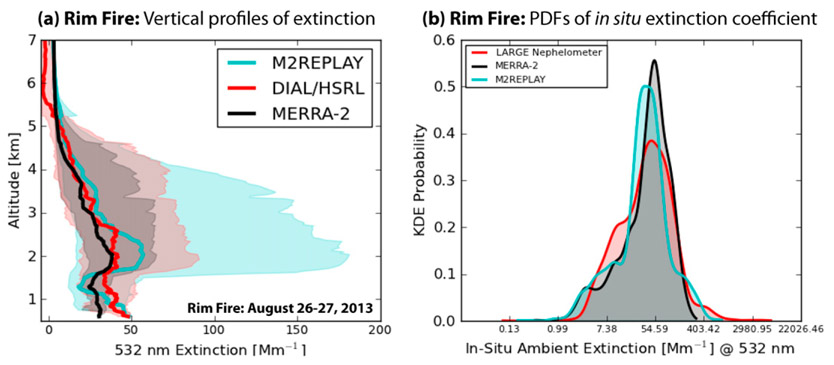
Figure 11a compares the DIAL/HRSL median extinction profile to the corresponding model-derived median extinction profiles during the Rim Fire. Considering all profiles of extinction on these two flight days, MERRA-2 demonstrates an improvement compared with M2REPLAY since the MERRA-2 vertical distribution of extinction is generally closer to the DIAL/HSRL measurements. Additionally, MERRA-2 exhibits a net reduction in the variability between the 25th and 75th percentiles of all profiles compared with M2REPLAY, and this variability more closely resembles the observed profile variability. We also compare MERRA-2 extinction to in situ aircraft measurements by first sampling the model along the flight path and then at the flight altitude. Figure 11b shows the probability density function (PDF) of in situ ambient 532-nm extinction measured with a nephelometer from the Langley Aerosol Research Group (LARGE) (Ziemba et al. 2016) aboard the NASA DC-8 aircraft compared with the cosampled model-derived extinction during the Rim Fire flights. Note that the x axis in this figure is logarithmically spaced. Both simulations under- and overestimate the extinction at the lowest and highest tails of the distributions, respectively. However, the peak of the distribution from MERRA-2 is better aligned with the peak in the observed distribution, though the former is less probable. Overall, AOD assimilation improves the regional-scale character of the Rim Fire, although it tends to degrade the forecast simulation closest to the source.
Fig. 11.
Comparison of observations from the SEAC4RS Rim Fire Flights (26–27 Aug 2013). (a) Profiles of 532-nm aerosol extinction observed by the DIAL/HSRL instrument (red) and simulated by MERRA-2 (black) and M2REPLAY (cyan). Lines are the median of all profiles, with the 25th–75th percentile of all profiles represented by the shading. (b) PDFs of in situ ambient 532-nm extinction measured with a nephelometer aboard the NASA DC8 during the Rim Fire flights (red) compared with MERRA-2 (black) and M2REPLAY (cyan). Note the model here has been sampled along the flight tracks and at the same altitude as the aircraft.
d. Pollution event over China in January 2013
In January 2013 China experienced an extreme degradation in air quality. Several haze episodes were observed with a pronounced peak occurring between 11 and 13 January (Sun et al. 2014; Zheng et al. 2015). Sun et al. (2014) and Zheng et al. (2015) investigated the sources and formation of this haze pollution over Beijing and suggested that the chemical evolution of aerosol species during the various haze episodes was most likely associated with stagnant meteorological conditions, coal combustion, secondary aerosol production, and regional transport. Primarily, their studies demonstrated that sulfate aerosol was the species that increased the most because of rapid aqueous-phase production associated with high humidity conditions. A large increase of nitrate was also observed over this region. Additionally, several studies (Ji et al. 2014; Zheng et al. 2015) reported values of surface PM2.5 greater than 800 μg m−3 for Beijing during this heavy pollution episode.
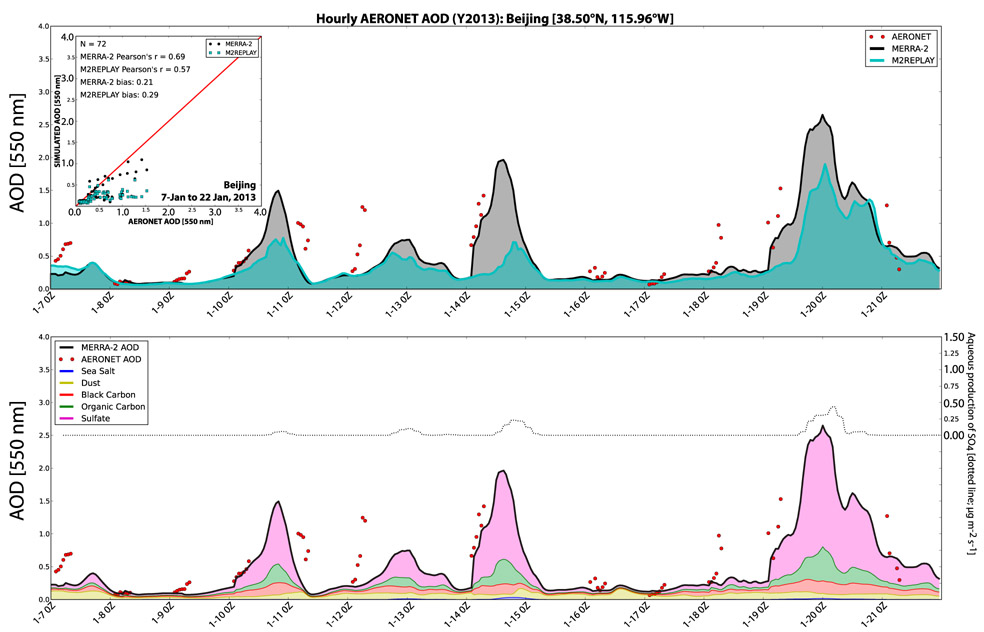
Figure 12 (top) presents hourly, model-estimated AOD compared with AERONET measurements at 550 nm at the Beijing station (38.50°N, 115.96°W) between 7 and 22 January. We can see that MERRA-2 and the control simulation (M2REPLAY) show higher AOD during pollution episodes. However, MERRA-2 has a slightly better correlation coefficient and a lower bias value relative to AERONET compared with M2REPLAY and seems to better capture some of the biggest events observed by AERONET, although not all of them. AOD speciation estimated by MERRA-2 (color coded, bottom), and the aqueous phase production of sulfate (right axis, bottom) are also shown in Fig. 12. Here we see that in MERRA-2 sulfate is the dominant species during the haze events, and this is correlated with aqueous production from SO2 oxidation.
Fig. 12.
(top) Time series of hourly AOD for the January 2013 Beijing pollution event as observed by AERONET (red dots) and simulated by MERRA-2 (black) and M2REPLAY (cyan). The inset plot shows the statistical relationship between collocated observations and the two simulations (supplemental material shows larger versions of the inset). (bottom) MERRA-2 AOD (black line) and contributions from individual aerosol species (shaded regions). AERONET observations are repeated (red dots). The dotted line (associated with right axis) shows the aqueous production of sulfate aerosol, which coincides with the peaks in simulated AOD.
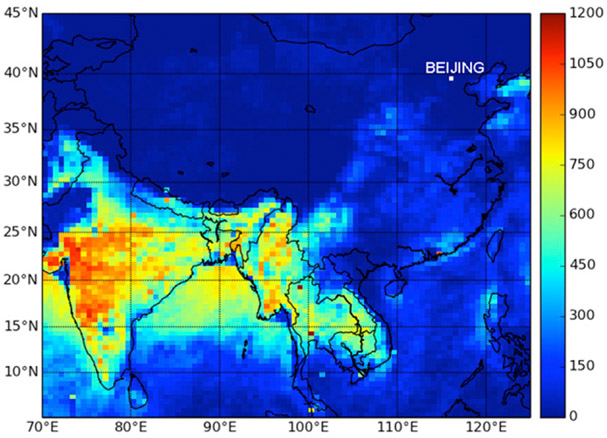
Although we assimilate AOD from AERONET, it is not the only data source in the region, and MERRA-2 still underestimates AOD during some events. This underestimation may be a consequence of several combined factors. For example, during this period, a relatively small number of AOD observations were available for assimilation in MERRA-2 (see Fig. 13), likely due to cloud contamination. As a result, the assimilation drew more toward the GEOS-5 model, which itself may have too weak emissions and mistimed aqueous production. Recall that in MERRA-2 anthropogenic emissions vary on a yearly basis, and emissions databases do not extend to 2013 (e.g., 2006 and 2008 are terminal years for anthropogenic OC/BC and SO2 databases, respectively; Part I). Additionally, GOCART in MERRA-2 has no treatment for nitrate particles, and we use monthly climatologies of oxidants calculated offline. With a paucity of data to assimilate during this event, we also find that MERRA-2 was unable to capture the extreme high values of PM2.5 reported for this event (not shown). In summary, this case study demonstrates that the skill of MERRA-2 to simulate aerosol distributions and properties depends both on the availability of observations for the assimilation and on the skill of the underlying forecast model, including its atmospheric state, physical parameterizations, and initial boundary conditions (e.g., emissions).
Fig. 13.
Number of total AOD observations assimilated in MERRA-2 during January 2013. Observations are included from all sensors in the aerosol observing system during this period (MODIS Terra, MODIS Aqua, AERONET, and MISR). Note the relative paucity of observations over China compared to, for example, over northwestern India.
5. Summary and conclusions
MERRA-2 assimilates bias-corrected AVHRR and MODIS AOD, MISR AOD over bright surfaces, and AERONET AOD, concurrently with a meteorological assimilation to produce time series of 3D gridded aerosol fields for the period 1980 onward. While assimilated AOD observations do not constrain aerosol speciation, absorption properties, or aerosol vertical structure, the data assimilation system does produce diagnostics of these unconstrained quantities. Complementing Part I, this study uses mostly independent (nonassimilated) observations to validate MERRA-2 aerosol diagnostics and examines major aerosol events as case studies to illustrate the skills and deficiencies of the MERRA-2 aerosol reanalysis.
The accuracy of MERRA-2 aerosol diagnostics depends not only on the quality of AOD observed and the data assimilation algorithm, but also on the quality of the background or forecast model. This implies the need to accurately represent aerosols in the forecast model prior to performing an analysis. In our study, we use a reference control experiment (M2REPLAY) to assess the differences between the forward model and the reanalysis aerosol fields in order to better understand the impacts of the assimilation.
Following prior work using our previous offline aerosol reanalysis (MERRAero; Buchard et al. 2015), we first demonstrate that MERRA-2 derived AAOD and simulated UV AI compare well with observations from OMI. As in Buchard et al. (2015), AI is biased low over southern Africa because the GOCART aerosol module does not currently consider the strong spectral variation of absorption in the near UV associated with brown carbon (Buchard et al. 2015). The vertical structure of aerosol optical properties in MERRA-2 generally shows good agreement compared to both CALIOP and aircraft observations. The use of local displacement ensembles (LDEs) to characterize plume replacements means that the vertical structure of the aerosol fields is not always simply a result of scaling the forecast fields, but rather represents an optimal weighting of nearest neighbor grid boxes that best minimize the needed AOD increment. Our comparisons with M2REPLAY show that these plume replacements generally improve the representation of aerosol optical properties in the vertical compared to observations.
Generally, on a global scale, when compared with M2REPLAY, the aerosol assimilation system leads to better simulated surface small particulate mass (PM2.5) relative to a satellite-based climatology from van Donkelaar et al. (2010). More detailed comparisons of MERRA-2 PM2.5 against ground-based observations over the United States show results quite similar to that of our previous offline AOD reanalysis (e.g., MERRAero; Buchard et al. 2016). MERRA-2 surface PM2.5 shows better agreement with observations located in more rural areas since urban and suburban areas will be influenced by high, localized emissions that are not representative of the gridbox mean estimated by MERRA-2. However, the assimilation had a limited impact on correcting systematic biases in the GEOS-5 model. Discrepancies in total PM2.5 in the western United States in the winter arise due to the lack of nitrate in GOCART and too-low emissions of organic carbon. Additionally, surface sea salt aerosol is overestimated in the northeastern United States (due to erroneous lake masking) and in some coastal regions (due to weak wet deposition and coastal intrusion).
The 1991 Mt. Pinatubo eruption analysis demonstrates that the injection altitude of the eruption was too high in MERRA-2, leading to longer stratospheric lifetime and quicker transport of the plume from the tropics to the poles. Further, MERRA-2 treats all sulfate aerosols as having the same extinction coefficient and thus the same assumed size distribution. Smaller particles are optically more efficient at scattering light compared with larger particles. For the amount of SO2 injected by the Pinatubo eruption (20 Tg), this assumption led to an overestimate of AOD and a negative AOD increment. The negative increment is applied to all aerosol tracers. This results in a marked decrease in the AOD of nonsulfate aerosol directly after the eruption. These decreases are an artifact of the negative AOD increment, and care must be taken when examining the speciated AOD time series after major volcanic eruptions. Current work is focusing on more accurate forward modeling of large stratovolcanic eruptions in order to minimize the application of large negative AOD increments.
The strong Saharan dust event that occurred in April 2010 shows that the aerosol assimilation played an important role for the long-range transport of dust from the northern African deserts over the Atlantic to the Caribbean. Relative to observations, MERRA-2 AOD as well as MERRA-2 surface dust concentrations were improved compared with M2REPLAY both close to the dust sources and far downwind of the dust emissions near Barbados.
The Rim Fire in California provided an opportunity to study the ability of MERRA-2 and M2REPLAY to simulate aerosol optical properties during a large biomass burning event. While M2REPLAY better simulated the aerosol optical properties close to the fire emission source, MERRA-2 tends to agree better with aircraft observations farther away from the smoke source. It is likely that the MODIS FRP-based QFED daily emissions provided good initial conditions in the forward model. However, the MERRA-2 AOD increment in the grid box near the emissions source was impacted by observations both inside and outside of the plume. The applied increment in this grid box was negative, and in this particular case the AOD assimilation degrades the AOD relative to observations close to the source. Nevertheless, examining the two days of the Rim Fire plume shows that the assimilation overall statistically improves the representation of this biomass burning plume.
Finally, the extreme pollution event over China in January 2013 shows that MERRA-2 indeed simulated high AOD during some haze episodes. These simulated AOD peaks were strongly correlated with the aqueous phase production of sulfate. However, MERRA-2 does not well represent all haze episodes, including their timing and magnitude. MERRA-2 does not capture all of these events due to a combination of several factors, including inadequate anthropogenic emissions with only interannual variability, a lack of nitrate aerosols in GOCART, and a relatively small amount of observed data for the assimilation. All of these factors combined to limit the impact of the aerosol assimilation during these pollution events.
By comparing and contrasting MERRA-2 aerosols with the M2REPLAY control that lacks AOD assimilation, we have shown that AOD assimilation generally reduces the bias between simulated aerosol properties and observations. We emphasize, however, that only the total aerosol AOD is included in the aerosol data assimilation system. Care must always be taken when considering speciated aerosol properties, surface concentrations, and aerosol vertical distributions since assimilated AOD has no information content regarding these properties and can potentially decrease the model performance for a given aerosol species, a given atmospheric level, or a particular aerosol event. Nevertheless, MERRA-2 represents a large step forward toward an Integrated Earth System Analysis (IESA) system. Future work will focus on improving the forecast simulation of aerosols to minimize needed analysis increments. We will also be incorporating observations from additional space- and ground-based sensors from an ever-expanding aerosol observing network to help to further constrain the aerosol assimilation, in terms of both the total number of observations and the information content of observations (e.g., vertical structure from space-based active sensors).
Supplementary Material
Acknowledgments.
MERRA-2 is an official product of the Global Modeling and Assimilation Office at NASA GSFC, supported by NASA’s Modeling, Analysis, and Prediction (MAP) program. Resources supporting this work were provided by the NASA High-End Computing (HEC) Program through the NASA Center for Climate Simulation (NCCS) at the Goddard Space Flight Center. The authors would like to acknowledge our colleagues at the Global Modeling and Assimilation Office who produced MERRA-2 and all the persons from the NASA OMI, MODIS, CALIOP instrument teams, and the AERONET network for making available the aerosol products used in this study. We also thank all SEAC4RS and DISCOVER-AQ PIs, participants, and funding organizations that made these aircraft field experiments possible. Finally we thank the three reviewers who provided useful feedback that helped to improve this manuscript.
REFERENCES
- Aquila V, Oman LD, Stolarski RS, Colarco PR, and Newman PA, 2012: Dispersion of the volcanic sulfate cloud from a Mount Pinatubo–like eruption. J. Geophys. Res, 117, D06216, doi: 10.1029/2011JD016968. [DOI] [Google Scholar]
- Balkanski Y, Schulz M, Claquin T, and Guibert S, 2007: Reevaluation of mineral aerosol radiative forcings suggests a better agreement with satellite and AERONET data. Atmos. Chem. Phys, 7, 81–95, doi: 10.5194/acp-7-81-2007. [DOI] [Google Scholar]
- Benedetti A, and Coauthors, 2009: Aerosol analysis and forecast in the European Centre for Medium-Range Weather Forecasts Integrated Forecast System: 2. Data assimilation. J. Geophys. Res, 114, D13205, doi: 10.1029/2008JD011115. [DOI] [Google Scholar]
- Buchard V, and Coauthors, 2014: Evaluation of GEOS-5 sulfur dioxide simulations during the Frostburg, MD 2010 field campaign. Atmos. Chem. Phys, 14, 1929–1941, doi: 10.5194/acp-14-1929-2014. [DOI] [Google Scholar]
- —, and Coauthors, 2015: Using the OMI aerosol index and absorption aerosol optical depth to evaluate the NASA MERRA aerosol reanalysis. Atmos. Chem. Phys, 15, 5743–5760, doi: 10.5194/acp-15-5743-2015. [DOI] [Google Scholar]
- —, and Coauthors, 2016: Evaluation of the surface PM2.5 in version 1 of the NASA MERRA aerosol reanalysis over the United States. Atmos. Environ, 125, 100–111, doi: 10.1016/j.atmosenv.2015.11.004. [DOI] [Google Scholar]
- Carn SA, Clarisse L, and Prata AJ, 2016: Multi-decadal satellite measurements of global volcanic degassing. J. Volcanol. Geotherm. Res, 311, 99–134, doi: 10.1016/j.jvolgeores.2016.01.002. [DOI] [Google Scholar]
- Chen D, Liu Z, Schwartz C, Lin H-C, Cetola J, Gu Y, and Xue L, 2014: The impact of aerosol optical depth assimilation on aerosol forecasts and radiative effects during a wild fire event over the United States. Geosci. Model Dev, 7, 2709–2715, doi: 10.5194/gmd-7-2709-2014. [DOI] [Google Scholar]
- Chiapello I, Moulin C, and Prospero JM, 2005: Understanding the long-term variability of African dust transport across the Atlantic as recorded in both Barbados surface concentrations and large-scale Total Ozone Mapping Spectrometer (TOMS) optical thickness. J. Geophys. Res, 110, D18S10, doi: 10.1029/2004JD005132. [DOI] [Google Scholar]
- Chin M, and Coauthors, 2002: Tropospheric aerosol optical thickness from the GOCART model and comparisons with satellite and sun photometer measurements. J. Atmos. Sci, 59, 461–483, doi:. [DOI] [Google Scholar]
- Colarco PR, Toon OB, Torres O, and Rasch PJ, 2002: Determining the UV imaginary index of refraction of Saharan dust particles from Total Ozone Mapping Spectrometer data using a three-dimensional model of dust transport. J. Geophys. Res, 107, 4289, doi: 10.1029/2001JD000903. [DOI] [Google Scholar]
- Schoeberl M, Doddridge B, Marufu L, Torres O, and Welton E, 2004: Transport of smoke from Canadian forest fires to the surface near Washington, DC: Injection height, entrainment, and optical properties. J. Geophys. Res, 109, D06203, doi: 10.1029/2003JD004248. [DOI] [Google Scholar]
- da Silva A, Chin M, and Diehl T, 2010: Online simulations of global aerosol distributions in the NASA GEOS-4 model and comparisons to satellite and ground-based aerosol optical depth. J. Geophys. Res, 115, D14207, doi: 10.1029/2009JD012820. [DOI] [Google Scholar]
- Nowottnick EP, Randles CA, Yi B, Yang P, Kim K-M, Smith JA, and Bardeen CG, 2014: Impact of radiatively interactive dust aerosols in the NASA GEOS-5 climate model: Sensitivity to dust particle shape and refractive index. J. Geophys. Res. Atmos, 119, 753–786, doi: 10.1002/2013JD020046. [DOI] [Google Scholar]
- Darmenov AS, and da Silva A, 2015: The Quick Fire Emissions Dataset (QFED)—Documentation of versions 2.1, 2.2 and 2.4. Technical Report Series on Global Modeling and Data Assimilation, NASA//TM-2015-104606, Vol. 38, 212 pp. [Available online at https://gmao.gsfc.nasa.gov/pubs/docs/Darmenov796.pdf.] [Google Scholar]
- Dee DP, Rukhovets L, Todling R, Da Silva AM, and Larson JW, 2001: An adaptive buddy check for observational quality control. Quart. J. Roy. Meteor. Soc, 127, 2451–2471, doi: 10.1002/qj.49712757714. [DOI] [Google Scholar]
- de Graaf M, and Stammes P, 2005: SCIAMACHY Absorbing Aerosol Index—Calibration issues and global results from 2002–2004. Atmos. Chem. Phys, 5, 2385–2394, doi: 10.5194/acp-5-2385-2005. [DOI] [Google Scholar]
- Diehl T, Heil A, Chin M, Pan X, Streets D, Schultz M, and Kinne S, 2012: Anthropogenic, biomass burning, and volcanic emissions of black carbon, organic carbon, and SO2 from 1980 to 2010 for hindcast model experiments. Atmos. Chem. Phys. Discuss, 12, 24895–24954, doi: 10.5194/acpd-12-24895-2012. [DOI] [Google Scholar]
- Duncan BN, Martin RV, Staudt AC, Yevich R, and Logan JA, 2003: Interannual and seasonal variability of biomass burning emissions constrained by satellite observations. J. Geophys. Res, 108, 4040, doi: 10.1029/2002JD002378. [DOI] [Google Scholar]
- EANET, 2001: Quality Assurance/Quality Control (QA/QC) program for the air concentration monitoring in East Asia. Acid Deposition Monitoring Network in East Asia, 25 pp. [Available online at http://www.eanet.cc/product/qaqc/qaqcair.pdf.] [Google Scholar]
- —, 2006: Data report on the acid deposition in the East Asian region 2005. Acid Deposition Monitoring Network in East Asia, 255 pp. [Available online at www.eanet.asia/product/datarep/.] [Google Scholar]
- Freitas SR, and Coauthors, 2007: Including the sub-grid scale plume rise of vegetation fires in low resolution atmospheric transport models. Atmos. Chem. Phys, 7, 3385–3398, doi: 10.5194/acp-7-3385-2007. [DOI] [Google Scholar]
- Gelaro R, and Coauthors, 2017: The Modern-Era Retrospective Analysis for Research and Applications, version 2 (MERRA-2). J. Climate, 30, 5419–5454, doi: 10.1175/JCLI-D-16-0758.1. [DOI] [PMC free article] [PubMed] [Google Scholar]
- Hair JW, and Coauthors, 2008: Airborne high spectral resolution lidar for profiling aerosol optical properties. Appl. Opt, 47, 6734–6752, doi: 10.1364/AO.47.006734. [DOI] [PubMed] [Google Scholar]
- Hammer MS, Martin RV, van Donkelaar A, Buchard V, Torres O, Ridley DA, and Spurr RJD, 2016: Interpreting the ultraviolet aerosol index observed with the OMI satellite instrument to understand absorption by organic aerosols: Implications for atmospheric oxidation and direct radiative effects. Atmos. Chem. Phys, 16, 2507–2523, doi: 10.5194/acp-16-2507-2016. [DOI] [Google Scholar]
- Hand J, and Coauthors, 2011: Spatial and seasonal patterns and temporal variability of haze and its constituents in the United States: Report V June 2011 Cooperative Institute for Research in the Atmosphere, Colorado State University, 507 pp. [Available online at http://vista.cira.colostate.edu/Improve/spatial-and-seasonal-patterns-and-temporal-variability-of-haze-and-its-constituents-in-the-united-states-report-v-june-2011/.] [Google Scholar]
- Herman J, Bhartia P, Torres O, Hsu C, Seftor C, and Celarier E, 1997: Global distribution of UV-absorbing aerosols from Nimbus 7/TOMS data. J. Geophys. Res, 102, 16911–16922, doi: 10.1029/96JD03680. [DOI] [Google Scholar]
- Hess M, Koepke P, and Schult I, 1998: Optical properties of aerosols and clouds: The software package OPAC. Bull. Amer. Meteor. Soc, 79, 831–844, doi:. [DOI] [Google Scholar]
- Holben B, and Coauthors, 1998: AERONET—A federated instrument network and data archive for aerosol characterization. Remote Sens. Environ, 66, 1–16, doi: 10.1016/S0034-4257(98)00031-5. [DOI] [Google Scholar]
- Hsu NC, and Coauthors, 1999: Comparisons of the TOMS aerosol index with sun-photometer aerosol optical thickness: Results and applications. J. Geophys. Res, 104, 6269–6279, doi: 10.1029/1998JD200086. [DOI] [Google Scholar]
- Ji D, and Coauthors, 2014: The heaviest particulate air-pollution episodes occurred in northern China in January, 2013: Insights gained from observation. Atmos. Environ, 92, 546–556, doi: 10.1016/j.atmosenv.2014.04.048. [DOI] [Google Scholar]
- Kinne S, and Coauthors, 2006: An AeroCom initial assessment—Optical properties in aerosol component modules of global models. Atmos. Chem. Phys, 6, 1815–1834, doi: 10.5194/acp-6-1815-2006. [DOI] [Google Scholar]
- Kleist DT, Parrish DF, Derber JC, Treadon R, Wu W-S, and Lord S, 2009: Introduction of the GSI into the NCEP Global Data Assimilation System. Wea. Forecasting, 24, 1691–1705, doi: 10.1175/2009WAF2222201.1. [DOI] [Google Scholar]
- Levelt PF, Hilsenrath E, Leppelmeier GW, van den Oord GH, Bhartia PK, Tamminen J, de Haan JF, and Veefkind JP, 2006: Science objectives of the Ozone Monitoring Instrument. IEEE Trans. Geosci. Remote Sens, 44, 1199–1208, doi: 10.1109/TGRS.2006.872336. [DOI] [Google Scholar]
- Li Z, Zang Z, Li QB, Chao Y, Chen D, Ye Z, Liu Y, and Liou KN, 2013: A three-dimensional variational data assimilation system for multiple aerosol species with WRF-Chem and an application to PM2.5 prediction. Atmos. Chem. Phys, 13, 4265–4278, doi: 10.5194/acp-13-4265-2013. [DOI] [Google Scholar]
- Lynch P, and Coauthors, 2016: An 11-year global gridded aerosol optical thickness reanalysis (v1.0) for atmospheric and climate sciences. Geosci. Model Dev, 9, 1489–1522, doi: 10.5194/gmd-9-1489-2016. [DOI] [Google Scholar]
- Mahowald NM, and Coauthors, 2009: Atmospheric iron deposition: Global distribution, variability, and human perturbations. Annu. Rev. Mar. Sci, 1, 245–278, doi: 10.1146/annurev.marine.010908.163727. [DOI] [PubMed] [Google Scholar]
- Malm WC, Sisler JF, Huffman D, Eldred RA, and Cahill TA, 1994: Spatial and seasonal trends in particle concentration and optical extinction in the United States. J. Geophys. Res, 99, 1347–1370, doi: 10.1029/93JD02916. [DOI] [Google Scholar]
- Schichtel BA, and Pitchford ML, 2011: Uncertainties in PM2.5 gravimetric and speciation measurements and what we can learn from them. J. Air Waste Manage. Assoc, 61, 1131–1149, doi: 10.1080/10473289.2011.603998. [DOI] [PubMed] [Google Scholar]
- Mauldin L, Zaun N, McCormick M Jr., Guy J, and Vaughn W, 1985: Stratospheric Aerosol and Gas Experiment II instrument: A functional description. Opt. Eng, 24, 242307, doi: 10.1117/12.7973473. [DOI] [Google Scholar]
- McHenry JN, Vukovich JM, and Hsu NC, 2015: Development and implementation of a remote-sensing and in situ data-assimilating version of CMAQ for operational PM2.5 forecasting. Part 1: MODIS aerosol optical depth (AOD) data-assimilation design and testing. J. Air Waste Manag. Assoc, 65, 1395–1412, doi: 10.1080/10962247.2015.1096862. [DOI] [PubMed] [Google Scholar]
- Meng Z, Yang P, Kattawar GW, Bi L, Liou KN, and Laszlo I, 2010: Single-scattering properties of tri-axial ellipsoidal mineral dust aerosols: A database for application to radiative transfer calculations. J. Aerosol Sci, 41, 501–512, doi: 10.1016/j.jaerosci.2010.02.008. [DOI] [Google Scholar]
- Mergenthaler J, Kumer J, and Roche A, 1995: CLAES observations of Mt. Pinatubo stratospheric aerosol. Geophys. Res. Lett, 22, 3497–3500, doi: 10.1029/95GL02787. [DOI] [Google Scholar]
- Molod AM, Takas LL, Suarez M, and Bacmeister J, 2015: Development of the GEOS-5 atmospheric general circulation model: Evolution from MERRA to MERRA-2. Geosci. Model Dev, 8, 1339–1356, doi: 10.5194/gmd-8-1339-2015. [DOI] [Google Scholar]
- Nowottnick EP, Colarco PR, Welton EJ, and da Silva A, 2015: Use of the CALIOP vertical feature mask for evaluating global aerosol models. Atmos. Meas. Tech, 8, 3647–3669, doi: 10.5194/amt-8-3647-2015. [DOI] [Google Scholar]
- Pérez C, and Coauthors, 2011: Atmospheric dust modeling from meso to global scales with the online NMMB/BSC-Dust model—Part 1: Model description, annual simulations and evaluation. Atmos. Chem. Phys, 11, 13 001–13 027, doi: 10.5194/acp-11-13001-2011. [DOI] [Google Scholar]
- Peterson DA, Hyer EJ, Campbell JR, Fromm MD, Hair JW, Butler CF, and Fenn MA, 2015: The 2013 Rim Fire: Implications for predicting extreme fire spread, pyroconvection, and smoke emissions. Bull. Amer. Meteor. Soc, 96, 229–247, doi: 10.1175/BAMS-D-14-00060.1. [DOI] [Google Scholar]
- Pope CA, and Dockery DW, 2013: Air pollution and life expectancy in China and beyond. Proc. Natl. Acad. Sci. USA, 110, 12 861–12 862, doi: 10.1073/pnas.1310925110. [DOI] [PMC free article] [PubMed] [Google Scholar]
- Ezzati M, and Dockery DW, 2009: Fine-particulate air pollution and life expectancy in the United States. N. Engl. J. Med, 360, 376–386, doi: 10.1056/NEJMsa0805646. [DOI] [PMC free article] [PubMed] [Google Scholar]
- Prospero JM, and Nees RT, 1986: Impact of the North African drought and El Niño on mineral dust in the Barbados trade winds. Nature, 320, 735–738, doi: 10.1038/320735a0. [DOI] [Google Scholar]
- —, and Lamb PJ, 2003: African droughts and dust transport to the Caribbean: Climate change implications. Science, 302, 1024–1027, doi: 10.1126/science.1089915. [DOI] [PubMed] [Google Scholar]
- Landing WM, and Schulz M, 2010: African dust deposition to Florida: Temporal and spatial variability and comparisons to models. J. Geophys. Res, 115, D13304, doi: 10.1029/2009JD012773. [DOI] [Google Scholar]
- Randerson JT, and Coauthors, 2006: The impact of boreal forest fire on climate warming. Science, 314, 1130–1132, doi: 10.1126/science.1132075. [DOI] [PubMed] [Google Scholar]
- Randles CA, and Coauthors, 2016: Aerosols in MERRA-2. Technical Report Series on Global Modeling and Data Assimilation 44, NASA Global Modeling and Assimilation Office. [Available online at https://gmao.gsfc.nasa.gov/reanalysis/MERRA-2/docs/.]
- —, and Coauthors, 2017: The MERRA-2 aerosol reanalysis, 1980 onward, Part I: System description and data assimilation evaluation. J. Climate, 30, 6823–6850, doi: 10.1175/JCLI-D-16-0609.1. [DOI] [PMC free article] [PubMed] [Google Scholar]
- Rienecker MM, and Coauthors, 2008: The GEOS-5 Data Assimilation System—Documentation of versions 5.0.1, 5.1.0, and 5.2.0. NASA/TM-2008-104606, Vol. 27, NASA Global Modeling and Assimilation Office, 101 pp. [Available online at https://gmao.gsfc.nasa.gov/pubs/docs/Rienecker369.pdf.] [Google Scholar]
- —, and Coauthors, 2011: MERRA: NASA’s Modern-Era Retrospective Analysis for Research and Applications. J. Climate, 24, 3624–3648, doi: 10.1175/JCLI-D-11-00015.1. [DOI] [PMC free article] [PubMed] [Google Scholar]
- Rubin JI, and Coauthors, 2016: Development of the Ensemble Navy Aerosol Analysis Prediction System (ENAAPS) and its application of the Data Assimilation Research Testbed (DART) in support of aerosol forecasting. Atmos. Chem. Phys, 16, 3927–3951, doi: 10.5194/acp-16-3927-2016. [DOI] [Google Scholar]
- Saide PE, Kim J, Song CH, Choi M, Cheng Y, and Carmichael GR, 2014: Assimilation of next generation geostationary aerosol optical depth retrievals to improve air quality simulations. Geophys. Res. Lett, 41, 9188–9196, doi: 10.1002/2014GL062089. [DOI] [Google Scholar]
- Schwartz CS, Liu Z, Lin H-C, and Cetola JD, 2014: Assimilating aerosol observations with a “hybrid” variational-ensemble data assimilation system. J. Geophys. Res. Atmos, 119, 4043–4069, doi: 10.1002/2013JD020937. [DOI] [Google Scholar]
- Sekiyama T, Tanaka T, Shimizu A, and Miyoshi T, 2010: Data assimilation of CALIPSO aerosol observations. Atmos. Chem. Phys, 10, 39–49, doi: 10.5194/acp-10-39-2010. [DOI] [Google Scholar]
- Spurr R, 2006: VLIDORT: A linearized pseudo-spherical vector discrete ordinate radiative transfer code for forward model and retrieval studies in multilayer multiple scattering media. J. Quant. Spectrosc, 102, 316–342, doi: 10.1016/j.jqsrt.2006.05.005. [DOI] [Google Scholar]
- Sun Y, Jiang Q, Wang Z, Fu P, Li J, Yang T, and Yin Y, 2014: Investigation of the sources and evolution processes of severe haze pollution in Beijing in January 2013. J. Geophys. Res, 119, 4380–4398, doi: 10.1002/2014JD021641. [DOI] [Google Scholar]
- Tagliabue A, Bopp L, and Aumont O, 2009: Evaluating the importance of atmospheric and sedimentary iron sources to Southern Ocean biogeochemistry. Geophys. Res. Lett, 36, L13601, doi: 10.1029/2009GL038914. [DOI] [Google Scholar]
- Tanaka TY, Orito K, Sekiyama TT, Shibata K, Chiba M, and Tanaka H, 2003: MASINGAR, a global tropospheric aerosol chemical transport model coupled with MRI/JMA98 GCM: Model description. Pap. Meteor. Geophys, 53, 119–138, doi: 10.2467/mripapers.53.119. [DOI] [Google Scholar]
- Textor C, and Coauthors, 2006: Analysis and quantification of the diversities of aerosol life cycles within AeroCom. Atmos. Chem. Phys, 6, 1777–1813, doi: 10.5194/acp-6-1777-2006. [DOI] [Google Scholar]
- Thomason LA, and Peter T, Eds., 2006: SPARC Assessment of Stratospheric Aerosol Properties (ASAP). SPARC Tech. Rep, WCRP-124, WMO/TD-No. 1295, 322 pp. [Available online at www.sparc-climate.org/publications/sparc-reports/.] [Google Scholar]
- Torres O, Bhartia P, Herman J, Ahmad Z, and Gleason J, 1998: Derivation of aerosol properties from satellite measurements of backscattered ultraviolet radiation: Theoretical basis. J. Geophys. Res, 103, 17099–17110, doi: 10.1029/98JD00900. [DOI] [Google Scholar]
- Tanskanen A, Veihelmann B, Ahn C, Braak R, Bhartia PK, Veefkind P, and Levelt P, 2007: Aerosols and surface UV products from Ozone Monitoring Instrument observations: An overview. J. Geophys. Res, 112, D24S47, doi: 10.1029/2007JD008809. [DOI] [Google Scholar]
- Ahn C, and Chen Z, 2013: Improvements to the OMI near-UV aerosol algorithm using A-Train CALIOP and AIRS observations. Atmos. Meas. Tech, 6, 3257–3270, doi: 10.5194/amt-6-3257-2013. [DOI] [Google Scholar]
- van der Werf GR, Randerson JT, Giglio L, Collatz GJ, Kasibhatla PS, and Arellano AF, 2006: Interannual variability in global biomass burning emissions from 1997 to 2004. Atmos. Chem. Phys, 6, 3423–3441, doi: 10.5194/acp-6-3423-2006. [DOI] [Google Scholar]
- van Donkelaar A, Martin RV, Brauer M, Kahn R, Levy R, Verduzco C, and Villeneuve PJ, 2010: Global estimates of ambient fine particulate matter concentrations from satellite-based aerosol optical depth: Development and application. Environ. Health Perspect, 118, 847–855, doi: 10.1289/ehp.0901623. [DOI] [PMC free article] [PubMed] [Google Scholar]
- Winker DM, Hunt WH, and McGill MJ, 2007: Initial performance assessment of CALIOP. Geophys. Res. Lett, L19803, doi: 10.1029/2007GL030135. [DOI] [Google Scholar]
- Vaughan MA, Omar A, Hu Y, Powell KA, Liu Z, Hunt WH, and Young SA, 2009: Overview of the CALIPSO mission and CALIOP data processing algorithms. J. Atmos. Oceanic Technol, 26, 2310–2323, doi: 10.1175/2009JTECHA1281.1. [DOI] [Google Scholar]
- Wu W-S, Purser RJ, and Parrish DF, 2002: Three-dimensional variational analysis with spatially inhomogeneous covariances. Mon. Wea. Rev, 130, 2905–2916, doi:. [DOI] [Google Scholar]
- Yu H, Remer LA, Kahn RA, Chin M, and Zhang Y, 2013: Satellite perspective of aerosol intercontinental transport: From qualitative tracking to quantitative characterization. Atmos. Res, 124, 73–100, doi: 10.1016/j.atmosres.2012.12.013. [DOI] [Google Scholar]
- Zhang J, Reid JS, Westphal DL, Baker NL, and Hyer EJ, 2008: A system for operational aerosol optical depth data assimilation over global oceans. J. Geophys. Res, 113, D10208, doi: 10.1029/2007JD009065. [DOI] [Google Scholar]
- Zheng B, and Coauthors, 2015: Heterogeneous chemistry: A mechanism missing in current models to explain secondary inorganic aerosol formation during the January 2013 haze episode in north China. Atmos. Chem. Phys, 15, 2031–2049, doi: 10.5194/acp-15-2031-2015. [DOI] [Google Scholar]
- Ziemba LD, and Coauthors, 2016: Airborne observations of bioaerosol over the southeast United States using a Wideband Integrated Bioaerosol Sensor (WIBS-4A). J. Geophys. Res. Atmos, 121, 8506–8524, doi: 10.1002/2015JD024669. [DOI] [Google Scholar]
Associated Data
This section collects any data citations, data availability statements, or supplementary materials included in this article.


