Abstract
Background
Head and neck squamous cell carcinoma (HNSC) is an invasive malignancy with a high worldwide mortality, despite considerable recent advancements in diagnosis and treatment. Increasing evidence indicates that the Lamin C (LAMC) gene family is associated with the progression of diverse cancers, nevertheless, this association is not well understood.
Material/Methods
A systematic study addressing the expression and prognostic value of LAMC, and the relationship between LAMC and tumor immune response in HNSC was done. Finally, we performed drug screening to identify specific drugs.
Results
Compared to normal samples, expressions of LAMC1 and LAMC2 were significantly increased in HNSC, and LAMC2 was obviously correlated with an adverse prognosis for patients. LAMC2 expression level was significantly correlated with the infiltrating levels of B cells, CD8+ T cells, CD4+ T cells, and macrophages. Moreover, LAMC2 exhibited strong correlations with diverse immune markers, immune microenvironment, and immune checkpoint molecules. Finally, candidate drugs that targeted LAMC2 were identified.
Conclusions
This study suggests that LAMC2 could serve as a new prognostic biomarker, and it could be used for efficacy of target for immune response and for drug sensitivity prediction in HNSC.
MeSH Keywords: Drug Screening Assays, Antitumor; Head and Neck Neoplasms; Immunologic Tests
Background
Head and neck squamous cell carcinoma (HNSC) is an invasive malignancy, which is the sixth most common global cancer and has an annual incidence of more than 685 000. Approximately 50% of patients die annually within the frame of 5-year survival rate [1]. Most HNSC patients have a poor prognosis because of advanced cancer when diagnosed despite considerable advancements in diagnosis and treatment in recent years [2]. With intensive studies in the area of molecular mechanisms, precision oncology has become the focus for several types of cancers [3]. However, currently used biomarkers have certain limitations in predicting HNSC prognosis [4]. Therefore, it is essential to determine effective therapeutic regimens and novel biomarkers. Laminin, mainly considered a structural protein, is the central component of subnuclear intermediate filaments and provides structural support and contact with chromatin, which plays a crucial role in the organization of DNA replication, transcription, and RNA splicing [5]. Laminin proteins are present in the extracellular matrix and cell membrane, and cancer occurs when neoplastic cells penetrate the basement membrane [6]. Lamin C (LAMC) is one major form of laminin, which is an important part of the nuclear membrane involved in development and regulation [7,8]. The LAMC gene plays an essential role in apoptosis and tissue differentiation [9]. There are 3 genes have been explored, including LAMC1, LAMC2, and LAMC3 [10]. LAMC1 is widely expressed in the basement membrane of tissue, which may contribute to cancer development and progression [11], and it is involved in substantial pathological and biological processes, including invasion and metastasis of tumor cells in tissue development [11]. LAMC2 is overexpressed in various types of cancer, and LAMC2 involvement in occurrence and development of multiple tumors has been verified [12–14]. LAMC2 overexpression in cancer cells appears to promote tumor progression [15]. An increasing number of studies suggest that the LAMC2-mediated signaling network plays an essential role in different cancers. When the basement membrane is damaged, LAMC2 is upregulated and provides a pathway for epithelial cell migration [16]. LAMC3 is similar to LAMC1, which contains structurally homologous domains and plays a different role as determined by the distinct pattern of expression. It is found in many different tissues, such as skin, eye, heart, lung, brain, retina, reproductive tract, and placenta [17,18]. Although the function of LAMC in HNSC has been extensively studied, the expression and prognostic value of LAMC, the relationship between LAMC and tumor immune infiltration, and the molecular regulatory mechanisms in HNSC are not well understood.
In this study, we conducted a systematic analysis of the expression and prognostic value of LAMC in HNSC patients. In addition, we systematically gained insight into the interaction of the LAMC2 gene with immune response. Finally, using the publicly available drug sensitivity database, we discovered candidate drugs targeting this biomarker.
Material and Methods
ONCOMINE analysis
The ONCOMINE database, a public microarray and RNA-sequence database, was used to analyze the mRNA expression level of the LAMC family in different cancers. Defining the threshold as P-value=0.0001 and fold change=2, tumor tissue was compared with the normal control for the LAMC family members.
GEPIA dataset analysis
The Gene Expression Profiling Interactive Analysis (GEPIA), a server for evaluating LAMC family mRNA expression and correlation in addition to conducting a patient survival analysis was used to obtain information from The Cancer Genome Atlas (TCGA) and the Genotype-Tissue Expression (GTEx) [19].
CBioPortal analysis
The cBioPortal for cancer genomics was applied to analyze complicated cancer genomics data and provide visualization features [20]. The HNSC dataset was selected to further analyze LAMC family members. The genomic profiles were determined by mutations, putative copy number alterations from GISTIC (Genomic Identification of Significant Targets in Cancer), mRNA expression Z scores (RNA-seq v.2 RSEM), and protein expression Z scores (RPPA).
LinkedOmics dataset
LinkedOmics, a newly developed tool, used the preprocessing and normalizing data from TCGA and Clinical Proteomic Tumor Analysis Consortium (CPTAC), which could be used to disseminate information from large-scale cancer genomics projects.
TIMER database analysis
Tumor IMmune Estimation Resource (TIMER) was used to estimate the causes of tumor immunological heterogeneity and the correlation of LAMC expression with patient prognosis. According to the TIMER algorithm for performing deconvolution calculations, we calculated immune cell components of abundance and analyzed LAMC expression and the correlation of LAMC expression with the abundance of infiltrating immune cells in HNSC patients [21,22]; thus, negative genes with tumor purity were selected through correlation analysis, enabling analysis of the relationship between tumor immune infiltration and disease sample visualization [22]. In addition, correlations were also explored between LAMC2 expression and gene biomarkers of infiltrating immune cells.
Functional enrichment analysis
Gene Ontology (GO) and the Kyoto Encyclopedia of Genes and Genomes (KEGG) pathway analysis using the cluster Profiler R package were conducted on LAMC2 and its significantly correlated genes [23]. The thresholds for analyses were determined by a P-value <0.05 indicating significantly enriched functional annotations.
Compounds therapeutic response prediction
To examine which target compounds might be useful, the Broad Institute’s Connectivity Map (CMap) was used to predict which compounds on the basis of LAMC2 and its significantly correlated genes [24].
Results
Expression levels of LAMC gene family in HNSC patients
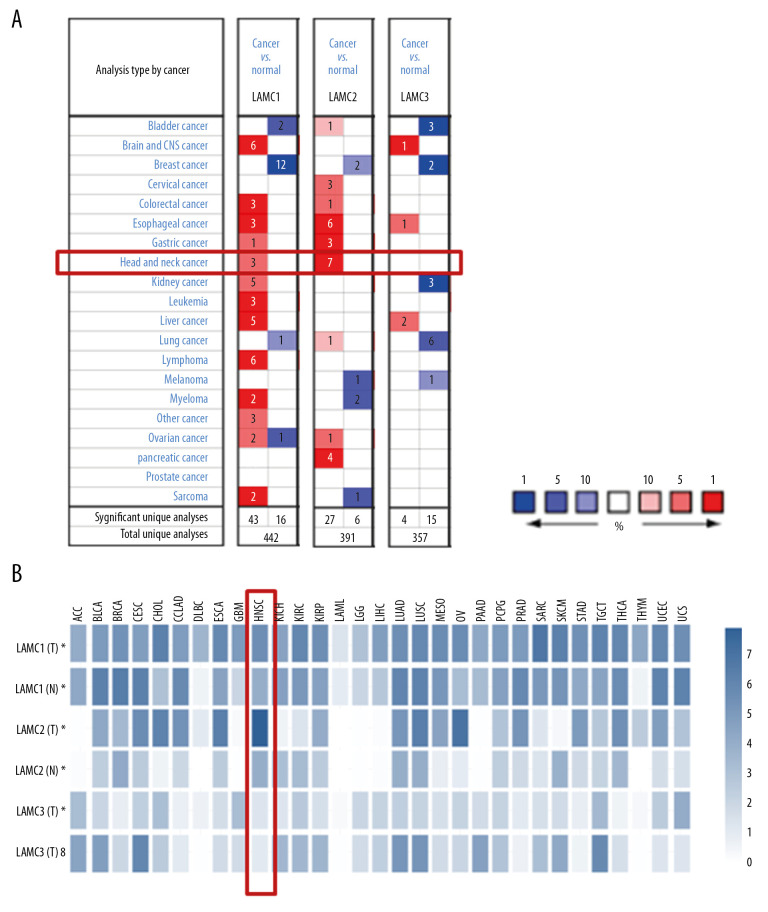
Three LAMC members have been confirmed in mammalian cells. Using the ONCOMINE database, we compared the expression levels of LAMC family members in cancers with LAMC expression levels in normal tissues (Figure 1A). In addition, we also compared the expression of LAMC family members in cancers with those in normal tissues using the GEPIA database (Figure 1B). The expression levels of LAMC1 were significantly upregulated in patients with HNSC in the 3 datasets. In the Ginos Head-Neck dataset, LAMC1 was overexpressed in HNSC versus normal tissue with a fold change of 2.008 (Table 1). In the Pyeon Multi-cancer statistics, LAMC1 was also overexpressed in carcinoma in the floor of the mouth with a fold change of 2.205 and in nasopharyngeal carcinoma with a fold change of 2.108. In the Ye Head-Neck statistics, LAMC2 was overexpressed in tongue squamous cell carcinoma with a fold change of 12.89. In the Estilo Head-Neck dataset, LAMC2 was overexpressed in tongue squamous cell carcinoma with a fold change of 13.822 and oral cavity squamous cell carcinoma with a fold change of 8.426 over normal samples based on the Peng Head-Neck dataset. The Ginos Head-Neck dataset showed that LAMC2 was overexpressed in HNSC with a fold change of 14.306. Pyeon et al. reported that LAMC2 was overexpressed in tongue carcinoma with a fold change of 5.707, and in the Talbot Lung data, higher expression of LAMC2 was found in tongue squamous cell carcinoma with a fold change of 3.961. In the He Thyroid dataset, LAMC2 was overexpressed in thyroid gland papillary carcinoma with a fold change of 2.23 (Table 1). However, according to the ONCOMINE analysis, there was no significant difference in the expression of LAMC3 between HNSC and normal tissues (Table 1).
Figure 1.
The expression levels of Lamin C (LAMC) family members in different types of cancers based on (A) ONCOMINE and (B) GEPIA databases. GEPIA – Gene Expression Profiling Interactive Analysis.
Table 1.
The significant changes of LAMCs expression in different types of head and neck cancer and normal head and neck tissue.
| Type of head and neck cancer versus normal head and neck tissue | Fold change | t-test | P-value | References | PMID | |
|---|---|---|---|---|---|---|
| LAMC1 | Head and neck squamous cell carcinoma vs. normal | 2.008 | 7.9 | 5.1E-10 | Ginos Head-Neck Statistics | 14729608 |
| Floor of the mouth carcinoma vs. normal | 2.205 | 6.068 | 4.4E-06 | Pyeon Multi-cancer Statistics | 17510386 | |
| Nasopharyngeal carcinoma vs. normal | 2.108 | 5.95 | 2E-06 | Pyeon Multi-cancer Statistics | 16912175 | |
| LAMC2 | Tongue squamous cell carcinoma vs. normal | 12.89 | 9.404 | 9.6E-11 | Ye Head-Neck Statistics | 18254958 |
| Tongue squamous cell carcinoma vs. normal | 13.822 | 9.558 | 1.4E-13 | Estilo Head-Neck Statistics | 19138406 | |
| Oral cavity squamous cell carcinoma vs. normal | 8.426 | 16.181 | 1.4E-23 | Peng Head-Neck Statistics | 21853135 | |
| Head and neck squamous cell carcinoma vs. normal | 14.306 | 12.277 | 8E-14 | Ginos Head-Neck Statistics | 14729608 | |
| Tongue carcinoma vs. normal | 5.707 | 7.861 | 1.1E-07 | Pyeon Multi-cancer Statistics | 17510386 | |
| Tongue squamous cell carcinoma vs. normal | 3.961 | 8.931 | 5E-11 | Talbot Lung Statistics | 15833835 | |
| Thyroid gland papillary carcinoma vs. normal | 2.23 | 5.173 | 5.2E-05 | He Thyroid Statistics | 16365291 | |
| LAMC3 | Nasopharyngeal carcinoma vs. normal | NA | NA | NA | NA | NA |
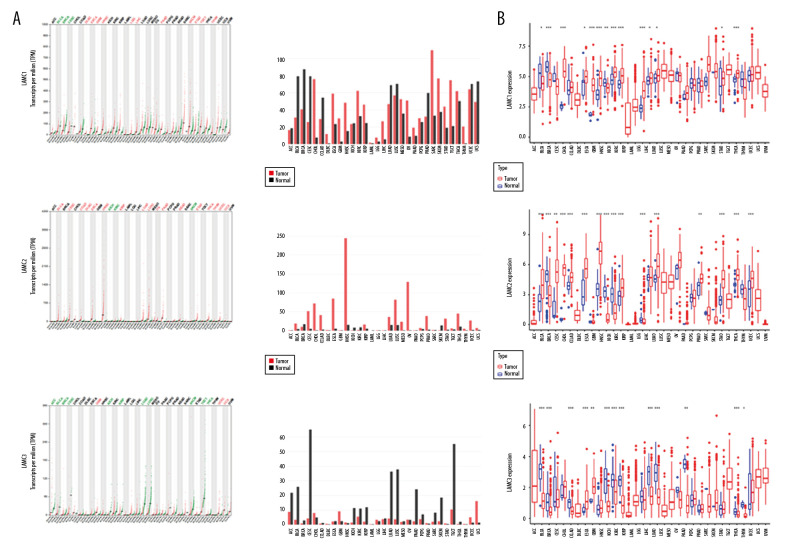
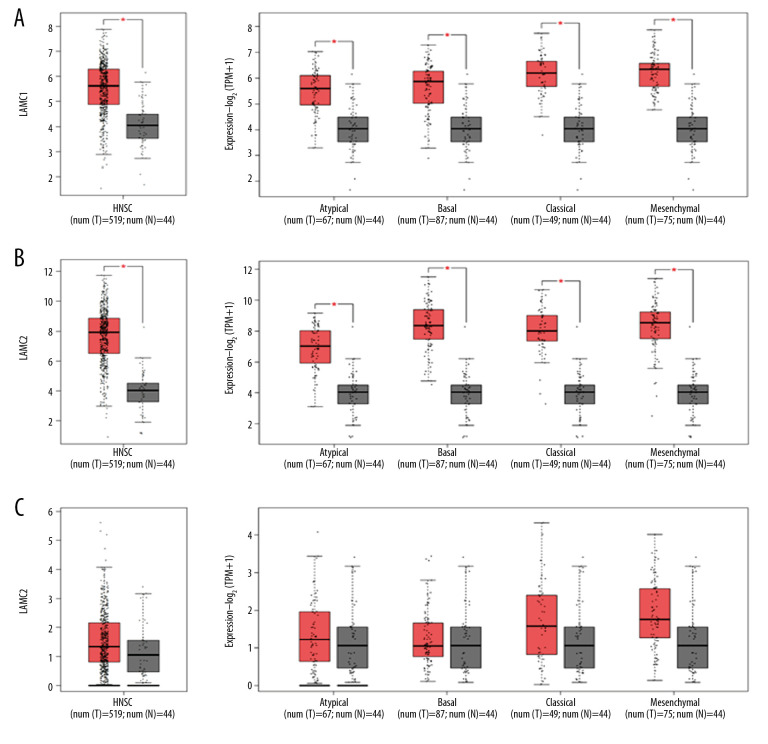
According to GEPIA and TCGA datasets, the expression levels of LAMC1 and LAMC2 were higher in HNSC patients than in normal samples; however, no significant difference in LAMC3 expression was found between HNSC patients and normal samples (Figures 2, 3). LAMCs were divided into 4 subtypes: 1) atypical; 2) basal; 3) classical; and 4) mesenchymal. Levels of the LAMC1 and C2 subtypes were expressed at a higher level in HNSC patients than in controls. However, compared to normal samples, there was no significant difference in expression levels in LAMC3 subtypes in HNSC patients (Figure 3).
Figure 2.
The expressions of LAMC1, LAMC2, and LAMC3 in pan-cancer based on (A) GEPIA and (B) TCGA databases. GEPIA – Gene Expression Profiling Interactive Analysis; TCGA – The Cancer Genome Atlas.
Figure 3.
(A–C) The Expression of LAMC1, LAMC2, and LAMC3 in HNSC patients based on the GEPIA database. HNSC – head and neck squamous cell carcinoma; GEPIA – Gene Expression Profiling Interactive Analysis.
LAMC genetic alteration and the clinicopathological parameters of patients with HNSC
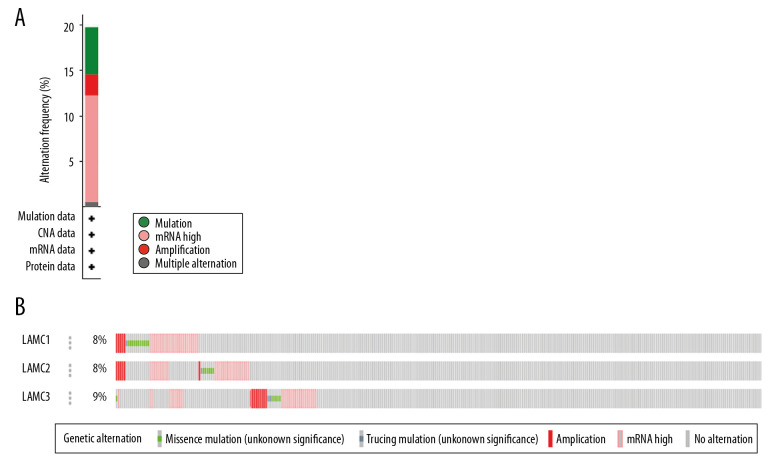
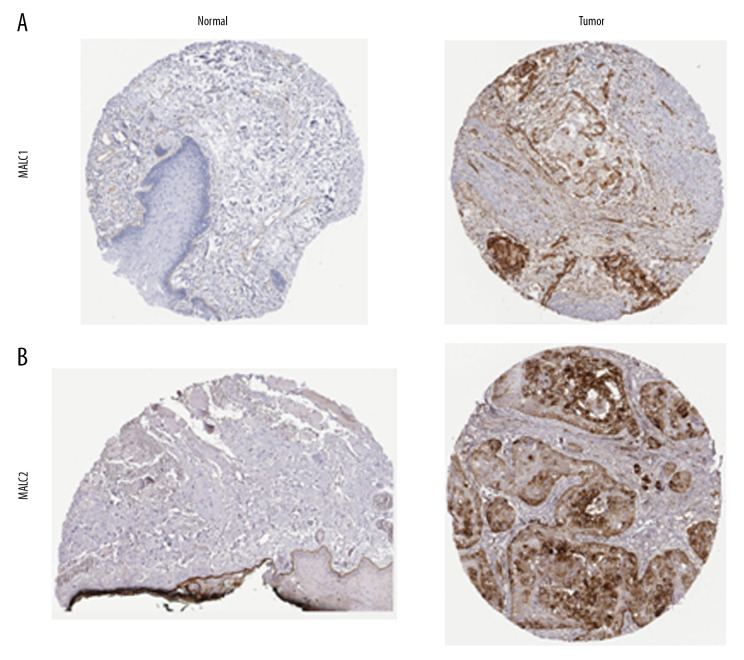
Genetic mutations of LAMC family members were analyzed for HNSC patients through the cBioPortal online tool and were altered in 522 samples of 520 patients with HNSC (20%) as shown in Figure 4A and 4B. We analyzed the LAMC gene family expressions using clinical specimens from the Human Protein Profiles to further evaluate the clinical relevance of the expression of these 3 genes [25]. LAMC1 and C2 were strongly positive in HNSC patients, relative to their expression levels in normal tissues (Figure 5A, 5B). However, no reports addressing LAMC3 were found on the website.
Figure 4.
(A, B) LAMCs mutation analysis in patients with HNSC (cBioPortal). HNSC – head and neck squamous cell carcinoma.
Figure 5.
(A, B) The expression profiles of two genes in the normal tissues and HNSC specimens. Images were taken from the Human Protein Atlas database. HNSC – head and neck squamous cell carcinoma.
Co-expressed genes of LAMC and the correlation with the mRNA expression in HNSC patients
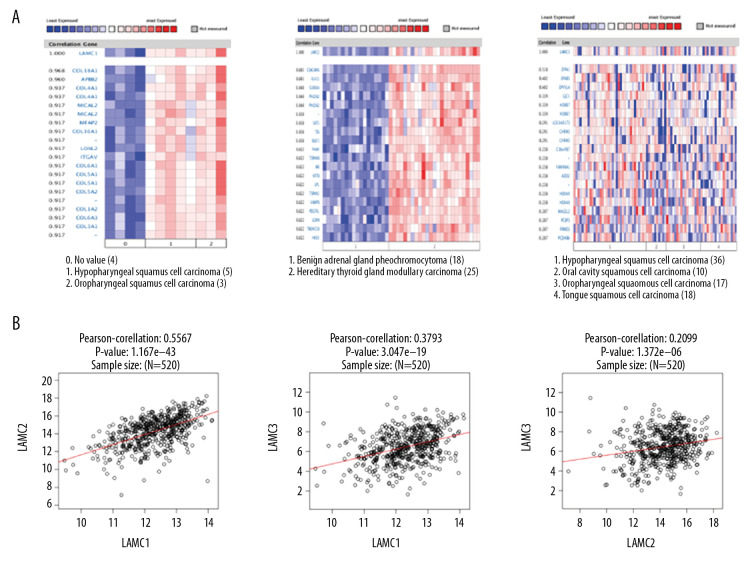
We utilized Oncomine database to analyze gene co-expression with LAMC family members. LAMC1 was analyzed in Schlingemann Head-Neck database [26], and showed positive correlation with COL18A1, APBB2, COL4A1, MICAL2, MFAP2, COL16A1, LOXL2, ITGAV, COL6A1 COL5A1, and COL5A2. Gene co-expression with LAMC2 were analyzed in the Peng Head-Neck dataset [27], and LAMC2 was shown to be positively correlated with PTHLH, TGFBI, SERPINE1, PDPN, MMP10, INHBA, PLAU, MMP1, SEMA3C, TNC, and ABL2. Gene co-expression with LAMC3 were analyzed in the Rickman Head-Neck database [28], and LAMC3 was positively correlated with ZFP41, EFNB3, DPYSL4, GJC1, HOXB7, LOC440173, CHRM3, C16orf87, FAM90A1, ADD2, and HOXA9 as shown in Figure 6A. We performed Pearson’s correlation analysis through the LinkedOmics database (Figure 6B). The results demonstrated significant and positive correlations among LAMC members.
Figure 6.
Co-expressed genes of LAMC family members, and the connection between LAMC and HNSC (ONCOMINE, LinkedOmics). (A) Co-expressed genes of LAMCs in HNSC, analyzed by ONCOMINE. (B) The connection between LAMCs and HNSC, analyzed by LinkedOmics. HNSC – head and neck squamous cell carcinoma.
Prognostic values of LAMC family members in HNSC patients
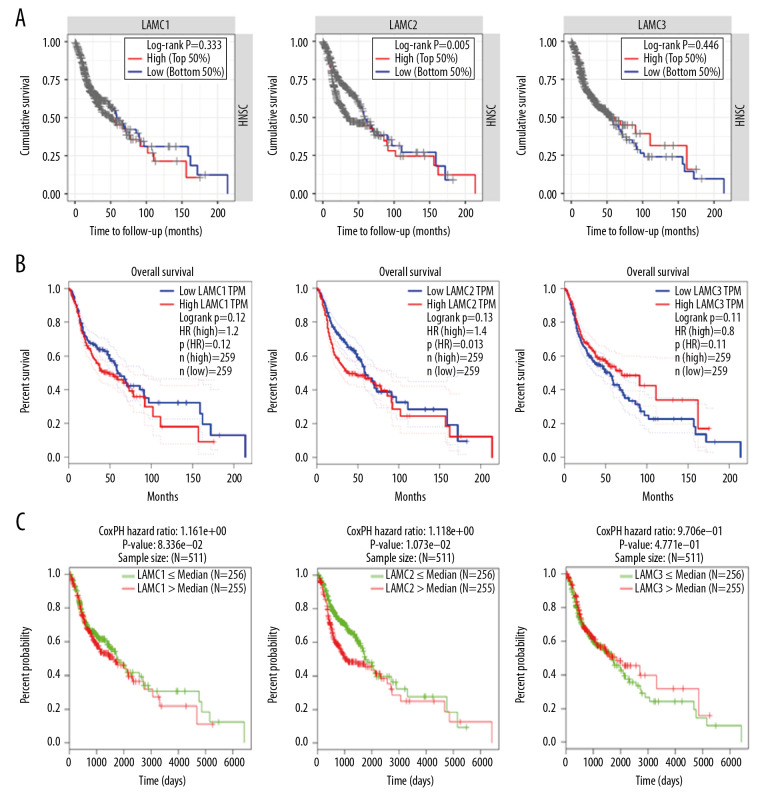
To further elucidate the prognostic value of individual LAMC member in HNSC patients, we used TIMER, LinkedOmics, and GEPIA databases to analyze overall survival (OS) of patients (Figure 7). HNSC patients with elevated levels of LAMC2 showed poor OS, and there were no differences for LAMC1 and C3 in prognostic analysis (Figure 7A–7C). These results indicated that highly expressed LAMC2 is a prognostic factor for HNSC.
Figure 7.
The prognostic value of mRNA level of LAMC family members in HNSC patients based on (A) TIMER, (B) LinkedOmics, and (C) GEPIA. HNSC – head and neck squamous cell carcinoma; TIMER – Tumor IMmune Estimation Resource; GEPIA – Gene Expression Profiling Interactive Analysis.
Correlation analysis of LAMC2 expression with immune regulatory markers
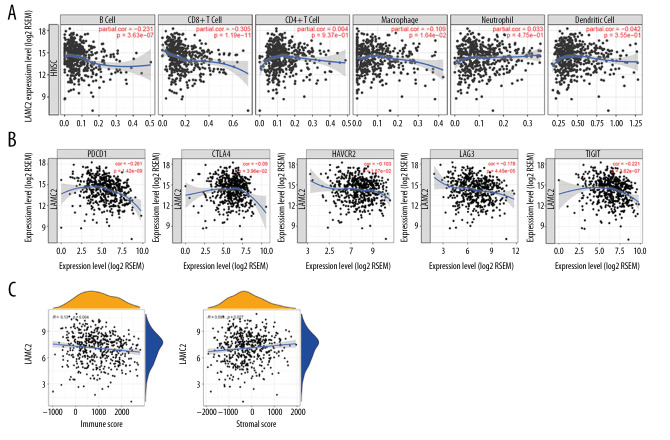
LAMC2 expression had a significant prognostic value in survival analysis. Thus, the correlation of LAMC2 expression with infiltrating immune cells and immune regulatory molecules were further analyzed. The results showed that LAMC2 expression levels had a significant correlation with infiltrating levels of B cells, CD8+T cells, and macrophages in HNSC but not with CD4+T cells, neutrophils, and dendritic cells as shown in Figure 8A. We also analyzed the associations between LAMC2 expression and immune marker genes of diverse infiltrating immune cells. We found significant correlations between LAMC2 expression and most gene markers in HNSC after adjustment by tumor purity (Table 2). Relative to immune regulatory molecules, including programmed cell death 1 (PDCD1), cytotoxic T-lymphocyte-associated protein 4 (CTLA4), hepatitis A virus cellular receptor 2 (HAVCR2), lymphocyte activating 3 (LAG3), and T-cell immune receptor with immunoglobulin and ITIM domain (TIGIT), the results showed that LAMC2 expression levels had a significant correlation with the previously described immune molecules. The expression levels of the previously described immune molecules are listed: 1) PDCD1; 2) CTLA4; 3) HAVCR2; 4) LAG3, and 5) TIGIT as shown in Figure 8B. Moreover, significant correlations were found between LAMC2 expression and tumor immune microenvironment by immune score and stromal score in HNSC (Figure 8C).
Figure 8.
Correlation of LAMC2 expression with levels of immune infiltration and the immune checkpoint molecules in HNSC patients. (A) Correlation of LAMC2 expression with the levels of immune infiltration, (B) immune checkpoint molecules, (C) immune score and stromal score. HNSC – head and neck squamous cell carcinoma.
Table 2.
Correlation analysis between LAMC2 and gene biomarkers of immune cells in HNSC (TIMER).
| Immune cells | Biomarkers | None | Purity | ||
|---|---|---|---|---|---|
| Cor | P-value | Cor | P-value | ||
| CD8+ T cell | CD8A | −0.21 | *** | −0.226 | *** |
| CD8B | −0.255 | *** | −0.271 | *** | |
| T cell (general) | CD3D | −0.213 | *** | −0.234 | *** |
| CD3E | −0.163 | *** | −0.179 | *** | |
| CD2 | −0.176 | *** | −0.193 | *** | |
| B cell | CD19 | −0.253 | *** | −0.281 | *** |
| CD79A | −0.206 | *** | −0.221 | *** | |
| Monocyte | CD86 | 0.153 | *** | 0.158 | *** |
| CD115 (CSF1R) | 0.034 | NS | 0.029 | NS | |
| TAM | CCL2 | 0.058 | NS | 0.062 | NS |
| CD68 | 0.235 | *** | 0.237 | *** | |
| IL10 | 0.198 | *** | O.202 | *** | |
| M1 Macrophage | INOS (NOS2) | −0.164 | *** | −0.15 | *** |
| IRF5 | −0.2 | *** | −0.19 | *** | |
| COX2 (PTGS2) | 0.299 | *** | 0.326 | *** | |
| Neutrophils | CD66b (CEACAM8) | −0.147 | *** | −0.125 | ** |
| CD11b (ITGAM) | −0.119 | ** | −0.117 | ** | |
| CCR7 | −0.115 | ** | −0.133 | ** | |
| Natural killer cell | KIR2DL1 | −0.05 | NS | −0.053 | NS |
| KIR2DL3 | −0.15 | *** | −0.165 | *** | |
| KIR2DL4 | −0.096 | * | −0.113 | * | |
| KIR3DL1 | −0.144 | *** | −0.166 | *** | |
| KIR3DL2 | −0.101 | * | −0.111 | * | |
| KIR3DL3 | −0.112 | * | −0.107 | * | |
| KIR2DS4 | −0.096 | * | −0.096 | * | |
| Dendritic cell | HLA-DPB1 | −0.134 | ** | −0.152 | *** |
| HLA-DQB1 | −0.085 | NS | −0.094 | * | |
| HLA-DRA | −0.066 | NS | −0.077 | NS | |
| HLA-DPA1 | −0.071 | NS | −0.081 | NS | |
| BDCA-1 (CD1C) | −0.047 | NS | −0.049 | NS | |
| BDCA-4 (NRP1) | 0.349 | *** | 0.347 | *** | |
| CD11c (ITGAX) | −0.028 | NS | −0.046 | NS | |
| Th1 | T-bet (TBX21) | −0.198 | *** | −0.211 | *** |
| STAT4 | 0.09 | * | 0.077 | NS | |
| STAT1 | 0.163 | *** | 0.146 | ** | |
| IFN-g (IFNG) | −0.184 | *** | −0.194 | *** | |
| TNF-a (TNF) | 0.288 | *** | 0.305 | *** | |
| Treg | FOXP3 | 0.031 | NS | 0.031 | NS |
| CCR8 | 0.128 | ** | 0.137 | ** | |
| STAT5B | 0.15 | *** | 0.162 | *** | |
| TGFb (TGFB1) | 0.554 | *** | 0.541 | *** | |
| T cell exhaustion | PD-1 (PDCD1) | −0.191 | *** | −0.21 | *** |
| CTLA4 | −0.04 | NS | −0.062 | NS | |
| LAG3 | −0.129 | ** | −0.143 | ** | |
| TIM-3 (HAVCR2) | −0.019 | NS | −0.028 | NS | |
| GZMB | −0.138 | ** | −0.157 | *** | |
P<0.05;
P<0.01;
P<0.001;
P>0.05.
HNSC – head and neck squamous cell carcinoma; TIMER – Tumor IMmune Estimation Resource.
Functional enrichment and pathway analysis of co-expression genes correlated with LAMC2 in HNSC
Because of the significance of LAMC2 in HNSC, we then explored co-expression genes correlated with LAMC2. The results showed that 12 142 genes (dark red dots) positively correlated with LAMC2 and 8022 genes (dark green dots) negatively correlated with LAMC2 in HNSC (Figure 9A). Besides, the top 50 significant genes positively and negatively correlated with LAMC2 in HNSC were present in Figure 9B and 9C, respectively.
Figure 9.
LAMC2 and its significantly correlated genes in HNSC (LinkedOmics). (A) The genes positively and negatively correlated with LAMC2 in HNSC. (B) Heatmaps of the top 50 genes positively correlated with LAMC2 in HNSC. (C) Heatmaps of the top 50 genes negatively correlated with LAMC2 in HNSC. HNSC – head and neck squamous cell carcinoma.
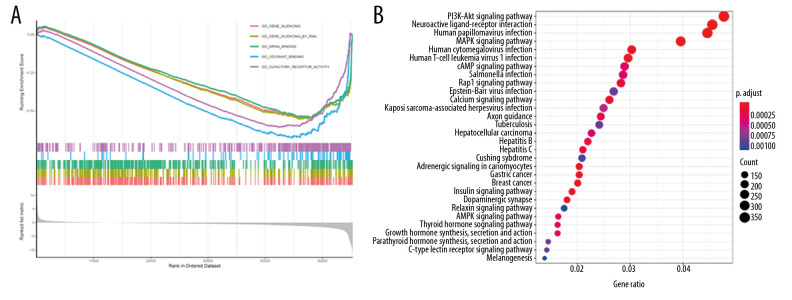
GO enrichment analysis according to GSEA analysis documented that LAMC2 and its significantly correlated genes were mainly link to gene silencing, gene silencing by RNA, and mRNA binding (Figure 10A). KEGG pathway enrichment analysis revealed that they were significantly involved in PI3K-Akt signaling pathway, neuroactive ligand-receptor interaction, and human papilloma virus infection (Figure 10B).
Figure 10.
Functional enrichment and pathway analysis of LAMC2 in HNSC. (A) GO analysis and (B) KEGG pathway analysis. HNSC – head and neck squamous cell carcinoma; GO – Gene Ontology; KEGG – Kyoto Encyclopedia of Genes and Genomes.
CMap database analysis identifies novel candidate drugs
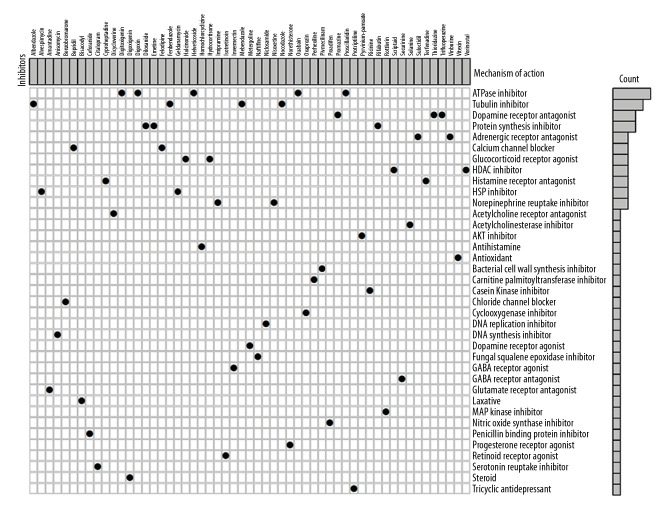
We also sought to examine potential drugs that capable of targeting LAMC2 and its significantly correlated genes in the CMap database. As consequence, CMap mode-of-action (MoA) analysis of 55 compounds indicated 37 mechanisms of action shared by the above drugs (Figure 11). According to CMap database analysis, 5 drugs (helveticoside, digoxin, proscillaridin, digitoxigenin, and ouabain) shared the MoA of ATPase inhibitor, 4 drugs (albendazole, fenbendazole, nocodazole, and mebendazole) shared the MoA of Tubulin inhibitor, 3 drugs (trifluoperazine, thioridazine, and promazine) shared the MoA of Dopamine receptor antagonist, and 3 drugs (emetine, diloxanide, and rifabutin) shared Protein synthesis inhibitor. In our study, we identified drugs targeting LAMC2 in HNSC, which might provide therapeutic targets for further analysis.
Figure 11.
CMap database analysis identifies novel candidate drugs targeting LAMC2 in HNSC. HNSC – head and neck squamous cell carcinoma; CMap – Connectivity Map.
Discussion
LAMC1 is expressed most extensively and predominantly in basement membranes [29] and is involved in several biological and pathological progression, including adhesion, invasion, and migration [30]. High expression levels of LAMC1 is associated with angiogenesis and tumor progression. LAMC1 is involved in formation of blood vessels, which provide oxygen to the tumor to accelerate its growth [31]. Moreover, LAMC1 could be involved in some signaling pathways that affect cell proliferation and migration by activating intracellular downstream effectors [29]. Some studies reported the contributions of LAMC1 expression in the aggressiveness of carcinomas, including carcinogenesis of the liver, endometrial epithelial cell carcinoma and tubal intraepithelial carcinomas, and melanoma cell migration [11]. In our study, we observed an increased expression of LAMC1 in HNSC compared to normal tissue. However, there was no significant difference in OS between the 2 previously described cell types. Future studies should aim at exploring upregulation processes/pathways involved with the LAMC1 gene, and during tumor progression, how these molecular pathways are altered to affect LAMC1 expression [32]. The detailed mechanisms of LAMC1 promoting tumor progression remain unclear.
Although the role of LAMC2 in development and prognosis of several cancers has been determined [13,33,34], further bioinformatic analyses of HNSC has yet to be performed. High expression of LAMC2 might provide a scaffold for invasion of cancer cells as a general feature of migration [16]. In recent years, as the development of immune checkpoint inhibitors (ICIs), the therapies of advanced and metastatic malignancies have significantly changed. Immunotherapy involves activation of anti-tumor immune responses to cancer cells by selectively identifying and binding immunosuppressive proteins that are expressed on tumor cells, macrophages, activation of T and B cells, and regulatory T cells, thereby altering the tumor microenvironment [35]. These responses play a crucial role in tumorigenesis and cancer progression, and metastasis [36]. The high activity of mitogen-activated protein kinase (MAPK) and phosphoinositide kinase 3/protein kinase B/mammalian target of rapamycin (PI3K/AKT/mTOR) pathways were common in advanced oral and oropharyngeal squamous cell carcinoma, and through these pathways neoplastic cells promote overexpression of LAMC2 levels [37]. MAPK was activated by various growth factors or cytokines that regulate cell survival, proliferation, apoptosis, and differentiation [38]. Some studies suggested that the inhibition of MAPK pathways contributes to enhanced host antitumor immunity [39]. Programmed cell death 1 (PD-1) was an immune checkpoint receptor that expressed on activated T and B cells and binds to PD-L1 or PD-L2 [40] and transfers a signal to T cells through the PI3K pathway to attenuate downstream signals, thus inhibiting the activation and proliferation of T cells. Tumor cells could avoid immune attack more effectively within the tumor microenvironment [41]. CTLA-4 binding to cluster of differentiation CD80/B7-1 or CD86/B7-2 on antigen-presenting cells (APCs) had a regulatory and inhibitory function that inhibits early T cell activation via this pathway [42]. The interacting function of this receptor caused downregulation of the activation of T regulatory cells and inhibited proliferation of antigen-specific immune cells in lymph nodes to evade immune detection [43]. Cancer immunotherapy has become a new effective treatment strategy [42]. In our study, elevated levels of LAMC2 was correlated with poor OS, and this elevated LAMC2 expression was significantly associated with immune infiltrating cells and immunosuppressive molecules. Overall, the expression level of LAMC2 was identified as a new prognostic biomarker and potential therapeutic target in HNSC. Then, utilizing CMap database, we identified 55 compounds that revealed 37 mechanisms of action. These observed candidate drugs might ultimately pave the way for implementation of treatments for HNSC patients.
Some evidences have pointed to a role for extensive LAMC3 expression in skin, heart, lung, brain, retina, and the reproductive tracts [17,18]. In skin, LAMC3 was expressed in the basement membrane at the dermal-epidermal junction of the nerve penetration points [17]. Some studies have demonstrated that LAMC3 mutation is linked to changes in the structure and function of the visual attention network [44], which modulates astrocyte migration and angiogenesis by modulating the activation of retinal microglia. LAMC3 was essential for retinal layered photoreceptor organization, and synaptic stability [45]. Cserhalmi-Friedman et al. [46] showed that LAMC3 could be associated with a disease known as whirler deafness (individuals present with deafness and vestibular dysfunction) and may be a valid candidate gene. In addition, Barak et al. [47] reported that LAMC3 mutations result in malformations of occipital cortical development. In our report, the expression levels of LAMC3 were slightly higher (but not significantly) in HNSC tissues than that in normal ones, and the expression of LAMC3 was not correlated with OS in HNSC patients.
Nevertheless, we should acknowledge the limitations of our study. First, our study had a potential bias due to its retrospective nature; a prospective cohort is needed to validate the results. Second, this study was completely based on public databases, and further experimental results should be evaluated through experiments such as real-time polymerase chain reactions or immunohistochemsitry. Finally, further functional studies are needed to explore the molecular functions of LAMC2 during HNSC progression.
Conclusions
In summary, our study systematically analyzes the expression and prognostic value of LAMCs in HNSC for the first time, which suggests that the increase in LAMC2 expression is correlated with immune response in HNSC and could be a potential target biomarker in HNSC oncogenesis.
Footnotes
Conflict of interest
None.
Source of support: This work was supported by grants from Sanya Medical and Health Science and Technology Innovation Project (2018YW05)
References
- 1.Ausoni S, Boscolo-Rizzo P, Singh B, et al. Targeting cellular and molecular drivers of head and neck squamous cell carcinoma: Current options and emerging perspectives. Cancer Metastasis Rev. 2016;35(3):413–26. doi: 10.1007/s10555-016-9625-1. [DOI] [PMC free article] [PubMed] [Google Scholar]
- 2.Lee K, Chang JW, Oh C, et al. HOXB5 acts as an oncogenic driver in head and neck squamous cell carcinoma via EGFR/Akt/Wnt/beta-catenin signaling axis. Eur J Surg Oncol. 2020;46(6):1066–73. doi: 10.1016/j.ejso.2019.12.009. [DOI] [PubMed] [Google Scholar]
- 3.Westbrook TC, Hagemann IS, Ley J, et al. Prospective assessment of the clinical benefit of a tailored cancer gene set built on a next-generation sequencing platform in patients with recurrent or metastatic head and neck cancer. Med Oncol. 2019;37(2):12. doi: 10.1007/s12032-019-1336-3. [DOI] [PubMed] [Google Scholar]
- 4.Sun CC, Li SJ, Hu W, et al. Comprehensive analysis of the expression and prognosis for E2Fs in human breast cancer. Mol Ther. 2019;27(6):1153–65. doi: 10.1016/j.ymthe.2019.03.019. [DOI] [PMC free article] [PubMed] [Google Scholar] [Retracted]
- 5.Cohen M, Lee KK, Wilson KL, et al. Transcriptional repression, apoptosis, human disease and the functional evolution of the nuclear lamina. Trends Biochem Sci. 2001;26(1):41–47. doi: 10.1016/s0968-0004(00)01727-8. [DOI] [PubMed] [Google Scholar]
- 6.Aumailley M, Smyth N. The role of laminins in basement membrane function. J Anat. 1998;193(Pt 1):1–21. doi: 10.1046/j.1469-7580.1998.19310001.x. [DOI] [PMC free article] [PubMed] [Google Scholar]
- 7.Gurudatta BV, Shashidhara LS, Parnaik VK. Lamin C and chromatin organization in Drosophila. J Genet. 2010;89(1):37–49. doi: 10.1007/s12041-010-0009-y. [DOI] [PubMed] [Google Scholar]
- 8.Bellaiche Y, The I, Perrimon N. Tout-velu is a Drosophila homologue of the putative tumour suppressor EXT-1 and is needed for Hh diffusion. Nature. 1998;394(6688):85–88. doi: 10.1038/27932. [DOI] [PubMed] [Google Scholar]
- 9.Schulze SR, Curio-Penny B, Li Y, et al. Molecular genetic analysis of the nested Drosophila melanogaster lamin C gene. Genetics. 2005;171(1):185–96. doi: 10.1534/genetics.105.043208. [DOI] [PMC free article] [PubMed] [Google Scholar]
- 10.Airenne T, Haakana H, Sainio K, et al. Structure of the human laminin gamma 2 chain gene (LAMC2): Alternative splicing with different tissue distribution of two transcripts. Genomics. 1996;32(1):54–64. doi: 10.1006/geno.1996.0076. [DOI] [PubMed] [Google Scholar]
- 11.Kashima H, Wu RC, Wang Y, et al. Laminin C1 expression by uterine carcinoma cells is associated with tumor progression. Gynecol Oncol. 2015;139(2):338–44. doi: 10.1016/j.ygyno.2015.08.025. [DOI] [PMC free article] [PubMed] [Google Scholar]
- 12.Hamasaki H, Koga K, Aoki M, et al. Expression of laminin 5-gamma2 chain in cutaneous squamous cell carcinoma and its role in tumour invasion. Br J Cancer. 2011;105(6):824–32. doi: 10.1038/bjc.2011.283. [DOI] [PMC free article] [PubMed] [Google Scholar]
- 13.Ii M, Yamamoto H, Taniguchi H, et al. Co-expression of laminin beta3 and gamma2 chains and epigenetic inactivation of laminin alpha3 chain in gastric cancer. Int J Oncol. 2011;39(3):593–99. doi: 10.3892/ijo.2011.1048. [DOI] [PubMed] [Google Scholar]
- 14.Shou JZ, Hu N, Takikita M, et al. Overexpression of CDC25B and LAMC2 mRNA and protein in esophageal squamous cell carcinomas and premalignant lesions in subjects from a high-risk population in China. Cancer Epidemiol Biomarkers Prev. 2008;17(6):1424–35. doi: 10.1158/1055-9965.EPI-06-0666. [DOI] [PMC free article] [PubMed] [Google Scholar]
- 15.Garg M, Braunstein G, Koeffler HP. LAMC2 as a therapeutic target for cancers. Expert Opin Ther Targets. 2014;18(9):979–82. doi: 10.1517/14728222.2014.934814. [DOI] [PubMed] [Google Scholar]
- 16.Iorio V, Troughton LD, Hamill KJ. Laminins: Roles and utility in wound repair. Adv Wound Care. 2015;4(4):250–63. doi: 10.1089/wound.2014.0533. [DOI] [PMC free article] [PubMed] [Google Scholar]
- 17.Koch M, Olson PF, Albus A, et al. Characterization and expression of the laminin gamma3 chain: A novel, non-basement membrane-associated, laminin chain. The J Cell Biol. 1999;145(3):605–18. doi: 10.1083/jcb.145.3.605. [DOI] [PMC free article] [PubMed] [Google Scholar]
- 18.Li YN, Radner S, French MM, et al. The gamma3 chain of laminin is widely but differentially expressed in murine basement membranes: expression and functional studies. Matrix Biol. 2012;31(2):120–34. doi: 10.1016/j.matbio.2011.12.002. [DOI] [PMC free article] [PubMed] [Google Scholar]
- 19.Tang Z, Li C, Kang B, et al. GEPIA: A web server for cancer and normal gene expression profiling and interactive analyses. Nucleic Acids Res. 2017;45(W1):W98–102. doi: 10.1093/nar/gkx247. [DOI] [PMC free article] [PubMed] [Google Scholar]
- 20.Gao J, Aksoy BA, Dogrusoz U, et al. Integrative analysis of complex cancer genomics and clinical profiles using the cBioPortal. Sci Signal. 2013;6(269):pl1. doi: 10.1126/scisignal.2004088. [DOI] [PMC free article] [PubMed] [Google Scholar]
- 21.Yoshihara K, Shahmoradgoli M, Martinez E, et al. Inferring tumour purity and stromal and immune cell admixture from expression data. Nat Commun. 2013;4:2612. doi: 10.1038/ncomms3612. [DOI] [PMC free article] [PubMed] [Google Scholar]
- 22.Li T, Fan J, Wang B, et al. TIMER: A web server for comprehensive analysis of tumor-infiltrating immune cells. Cancer Res. 2017;77(21):e108–10. doi: 10.1158/0008-5472.CAN-17-0307. [DOI] [PMC free article] [PubMed] [Google Scholar]
- 23.Xu F, Lin H, He P, et al. A TP53-associated gene signature for prediction of prognosis and therapeutic responses in lung squamous cell carcinoma. Oncoimmunology. 2020;9(1) doi: 10.1080/2162402X.2020.1731943. 1731943. [DOI] [PMC free article] [PubMed] [Google Scholar]
- 24.Malta TM, Sokolov A, Gentles AJ, et al. Machine learning identifies stemness features associated with oncogenic dedifferentiation. Cell. 2018;173(2):338–54. doi: 10.1016/j.cell.2018.03.034. [DOI] [PMC free article] [PubMed] [Google Scholar]
- 25.Szklarczyk D, Franceschini A, Wyder S, et al. STRING v10: Protein–protein interaction networks, integrated over the tree of life. Nucleic Acids Res. 2015;43:D447–52. doi: 10.1093/nar/gku1003. [DOI] [PMC free article] [PubMed] [Google Scholar]
- 26.Schlingemann J, Habtemichael N, Ittrich C, et al. Patient-based cross-platform comparison of oligonucleotide microarray expression profiles. Lab Invest. 2005;85(8):1024–39. doi: 10.1038/labinvest.3700293. [DOI] [PubMed] [Google Scholar]
- 27.Peng CH, Liao CT, Peng SC, et al. A novel molecular signature identified by systems genetics approach predicts prognosis in oral squamous cell carcinoma. PLoS One. 2011;6(8):e23452. doi: 10.1371/journal.pone.0023452. [DOI] [PMC free article] [PubMed] [Google Scholar]
- 28.Rickman DS, Millon R, De Reynies A, et al. Prediction of future metastasis and molecular characterization of head and neck squamous-cell carcinoma based on transcriptome and genome analysis by microarrays. Oncogene. 2008;27(51):6607–22. doi: 10.1038/onc.2008.251. [DOI] [PubMed] [Google Scholar]
- 29.Ke HL, Ke RH, Li B, et al. Association between laminin gamma1 expression and meningioma grade, recurrence, and progression-free survival. Acta Neurochir. 2013;155(1):165–71. doi: 10.1007/s00701-012-1512-0. [DOI] [PubMed] [Google Scholar]
- 30.Aumailley M. The laminin family. Cell Adh Migr. 2013;7(1):48–55. doi: 10.4161/cam.22826. [DOI] [PMC free article] [PubMed] [Google Scholar]
- 31.Ljubimova JY, Fujita M, Khazenzon NM, et al. Changes in laminin isoforms associated with brain tumor invasion and angiogenesis. Front Biosci. 2006;11:81–88. doi: 10.2741/1781. [DOI] [PMC free article] [PubMed] [Google Scholar]
- 32.Mutter GL, Monte NM, Neuberg D, et al. Emergence, involution, and progression to carcinoma of mutant clones in normal endometrial tissues. Cancer Res. 2014;74(10):2796–802. doi: 10.1158/0008-5472.CAN-14-0108. [DOI] [PMC free article] [PubMed] [Google Scholar]
- 33.Takahashi S, Hasebe T, Oda T, et al. Cytoplasmic expression of laminin gamma2 chain correlates with postoperative hepatic metastasis and poor prognosis in patients with pancreatic ductal adenocarcinoma. Cancer. 2002;94(6):1894–901. doi: 10.1002/cncr.10395. [DOI] [PubMed] [Google Scholar]
- 34.Garg M, Kanojia D, Okamoto R, et al. Laminin-5gamma-2 (LAMC2) is highly expressed in anaplastic thyroid carcinoma and is associated with tumor progression, migration, and invasion by modulating signaling of EGFR. J Clin Endocrinol Metab. 2014;99(1):E62–72. doi: 10.1210/jc.2013-2994. [DOI] [PMC free article] [PubMed] [Google Scholar]
- 35.Kruger S, Ilmer M, Kobold S, et al. Advances in cancer immunotherapy 2019 – latest trends. J Exp Clin Cancer Res. 2019;38(1):268. doi: 10.1186/s13046-019-1266-0. [DOI] [PMC free article] [PubMed] [Google Scholar]
- 36.Chang KC, Lu YC, Lin MJ, et al. Desmoplastic tumour-associated stroma versus neural tissue in central nervous system metastasis: Effects of different microenvironments on tumour growth. Histopathology. 2011;59(1):31–39. doi: 10.1111/j.1365-2559.2011.03898.x. [DOI] [PubMed] [Google Scholar]
- 37.Degen M, Natarajan E, Barron P, et al. MAPK/ERK-dependent translation factor hyperactivation and dysregulated laminin gamma2 expression in oral dysplasia and squamous cell carcinoma. Am J Pathol. 2012;180(6):2462–78. doi: 10.1016/j.ajpath.2012.02.028. [DOI] [PMC free article] [PubMed] [Google Scholar]
- 38.Wan PT, Garnett MJ, Roe SM, et al. Mechanism of activation of the RAF-ERK signaling pathway by oncogenic mutations of B-RAF. Cell. 2004;116(6):855–67. doi: 10.1016/s0092-8674(04)00215-6. [DOI] [PubMed] [Google Scholar]
- 39.Kakavand H, Wilmott JS, Menzies AM, et al. PD-L1 expression and tumor-infiltrating lymphocytes define different subsets of MAPK inhibitor-treated melanoma patients. Clin Cancer Res. 2015;21(14):3140–48. doi: 10.1158/1078-0432.CCR-14-2023. [DOI] [PubMed] [Google Scholar]
- 40.Zheng P, Zhou Z. Human cancer immunotherapy with PD-1/PD-L1 blockade. Biomark Cancer. 2015;7(Suppl 2):15–18. doi: 10.4137/BIC.S29325. [DOI] [PMC free article] [PubMed] [Google Scholar]
- 41.Yang Y. Cancer immunotherapy: Harnessing the immune system to battle cancer. J Clin Invest. 2015;125(9):3335–37. doi: 10.1172/JCI83871. [DOI] [PMC free article] [PubMed] [Google Scholar]
- 42.Walker LS, Sansom DM. Confusing signals: Recent progress in CTLA-4 biology. Trends Immunol. 2015;36(2):63–70. doi: 10.1016/j.it.2014.12.001. [DOI] [PMC free article] [PubMed] [Google Scholar]
- 43.Hargadon KM, Johnson CE, Williams CJ. Immune checkpoint blockade therapy for cancer: An overview of FDA-approved immune checkpoint inhibitors. Int Immunopharmacol. 2018;62:29–39. doi: 10.1016/j.intimp.2018.06.001. [DOI] [PubMed] [Google Scholar]
- 44.Urgen BM, Topac Y, Ustun FS, et al. Homozygous LAMC3 mutation links to structural and functional changes in visual attention networks. Neuroimage. 2019;190:242–53. doi: 10.1016/j.neuroimage.2018.03.077. [DOI] [PubMed] [Google Scholar]
- 45.Dorgau B, Felemban M, Sharpe A, et al. Laminin gamma3 plays an important role in retinal lamination, photoreceptor organisation and ganglion cell differentiation. Cell Death Dis. 2018;9(6):615. doi: 10.1038/s41419-018-0648-0. [DOI] [PMC free article] [PubMed] [Google Scholar]
- 46.Cserhalmi-Friedman PB, Olson PF, Koch M, et al. Structural analysis and mutation detection strategy for the human LAMC3 gene. Biochem Biophys Res Commun. 2001;280(1):39–44. doi: 10.1006/bbrc.2000.4086. [DOI] [PubMed] [Google Scholar]
- 47.Barak T, Kwan KY, Louvi A, et al. Recessive LAMC3 mutations cause malformations of occipital cortical development. Nat Genet. 2011;43(6):590–94. doi: 10.1038/ng.836. [DOI] [PMC free article] [PubMed] [Google Scholar]


