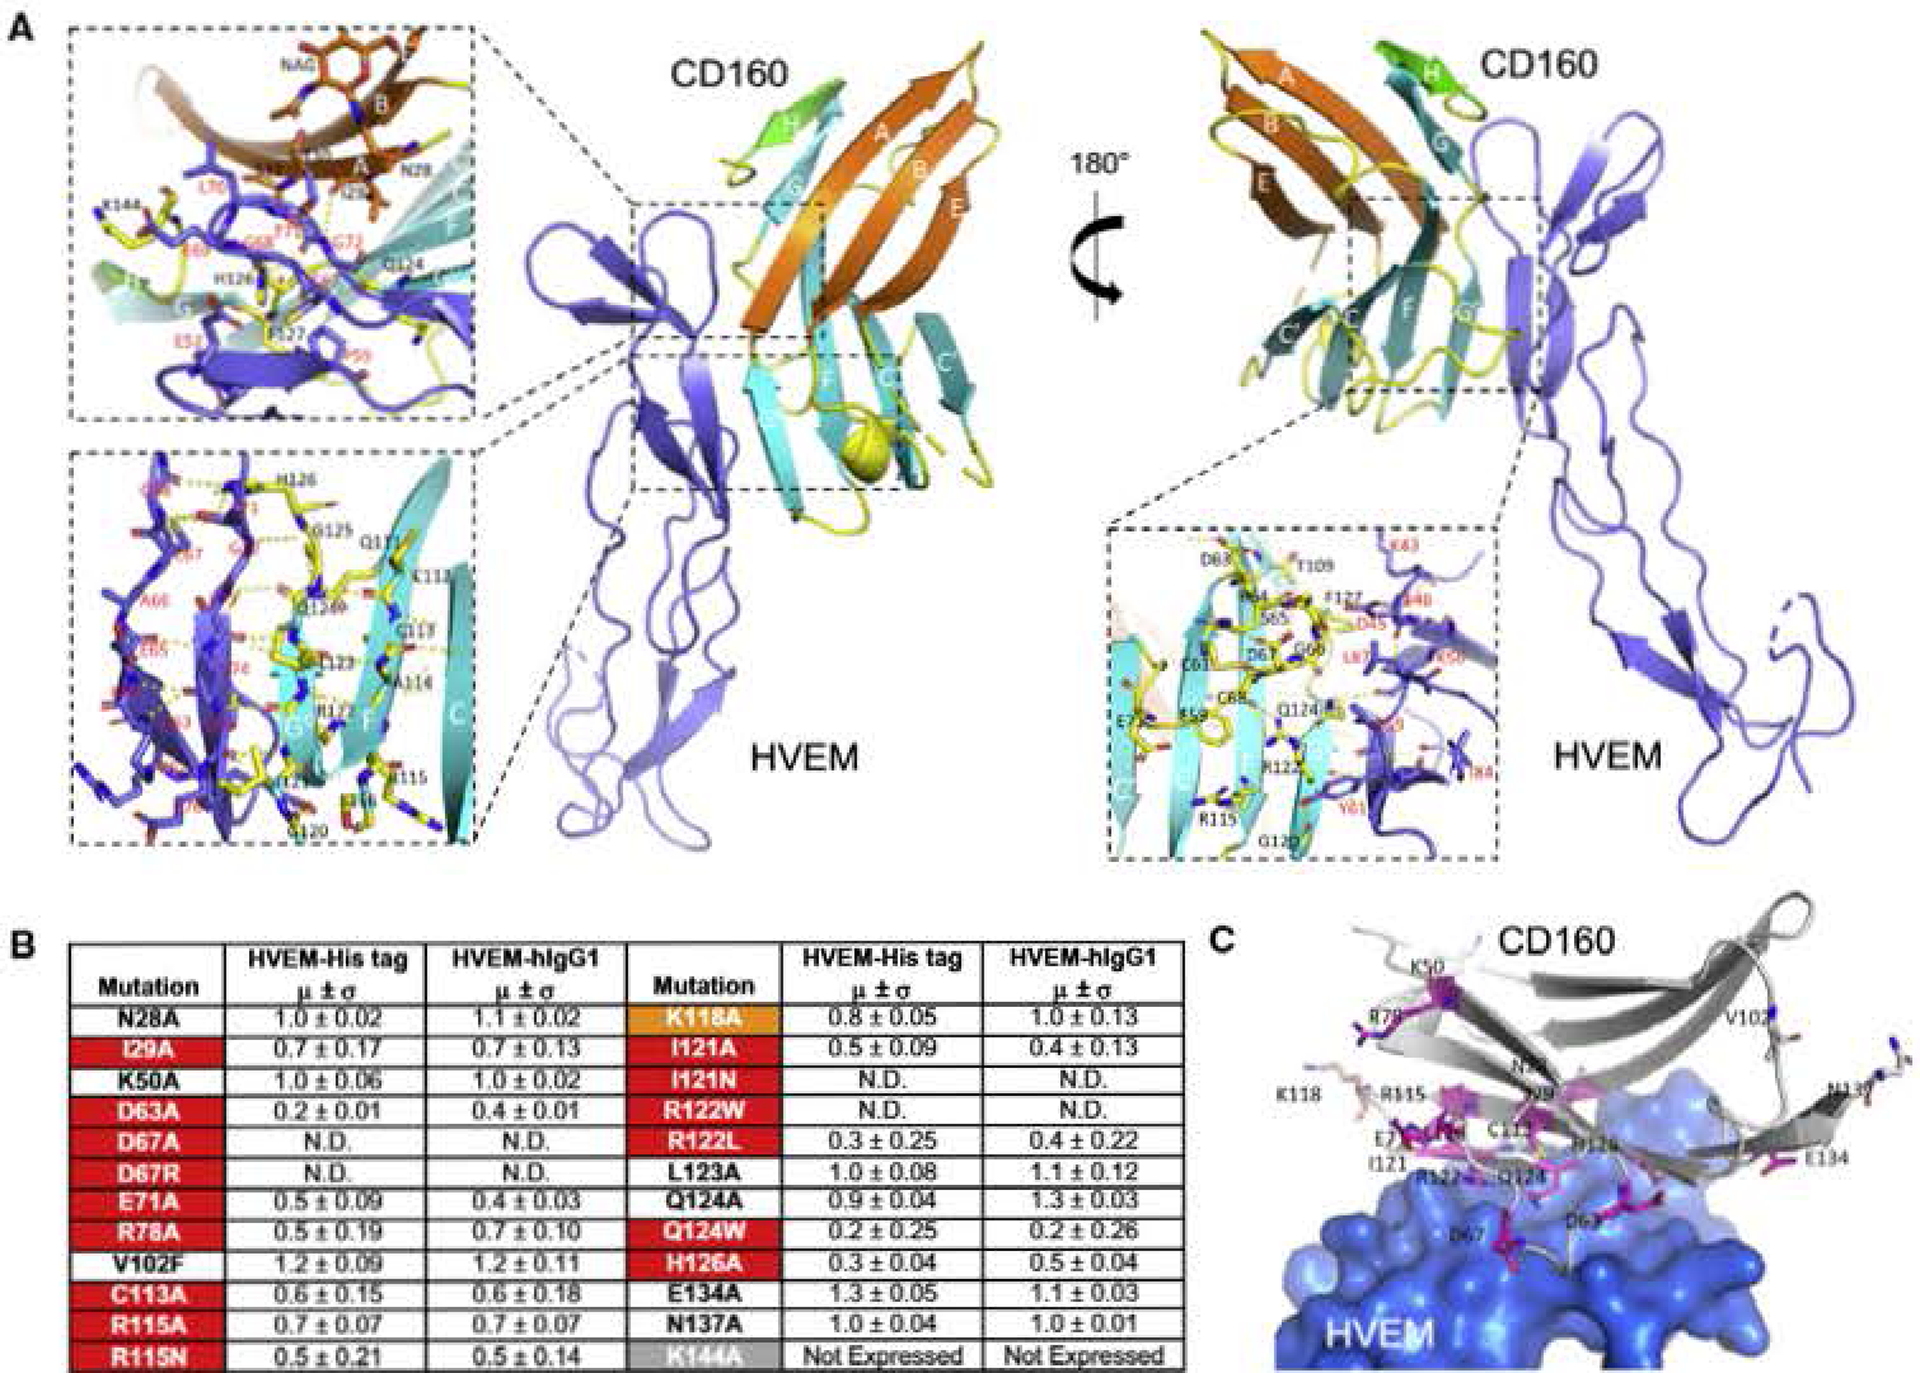
Figure 4. Binding Interface of the CD160:HVEM Complex and Epitope Mapping of CD160.

(A) Detailed map of CD16Q:HVEM interaction. The dashed box shows an expanded view of the interactions between human GDI60 and human HVEM. The top left panel emphasizes HVEM residues C67-G72 and their contacts with the A and H strands of CD160. The bottom left panel shows an expanded view of HVEM strands (T71-E7S and the adjacent R62-G68) in contact with CD160 strands (G0 strand composed of G120-G125 and the adjacent F strand composed of Q111-S116). The bottom right panel emphasizes parts of the CD160 CC′ loop (R64-D67) in direct contact with HVEM.
(B) Epitope mapping results of human CD160. The relative binding affinities are presented by the values obtained when normalized to the witd-type CD160 binding affinity of value 1 (standard deviations are results of triplicate measurements). N.D. stands for no detectable binding. The residues are categorized as sensitive residues when more than 20% binding affinity was lost, and are highlighted in red (lost in both assays) and orange (lost in only one assay).
(C) Structural representation of the CD160 epitope mapping results. The residues subjected to epitope mapping are shown as sticks. The sensitive residues with more than 20% compromised binding in both assays are colored purple and residues with more than 20% compromised binding in only one assay are colored orange. HVEM is shown as light-blue surface.
See also Figure S3.
