

 A comparative proteome analysis was conducted to identify global changes in the protein expression profiles of cadmium telluride quantum dot-exposed human bronchial epithelial BEAS-2B cells.
Abstract
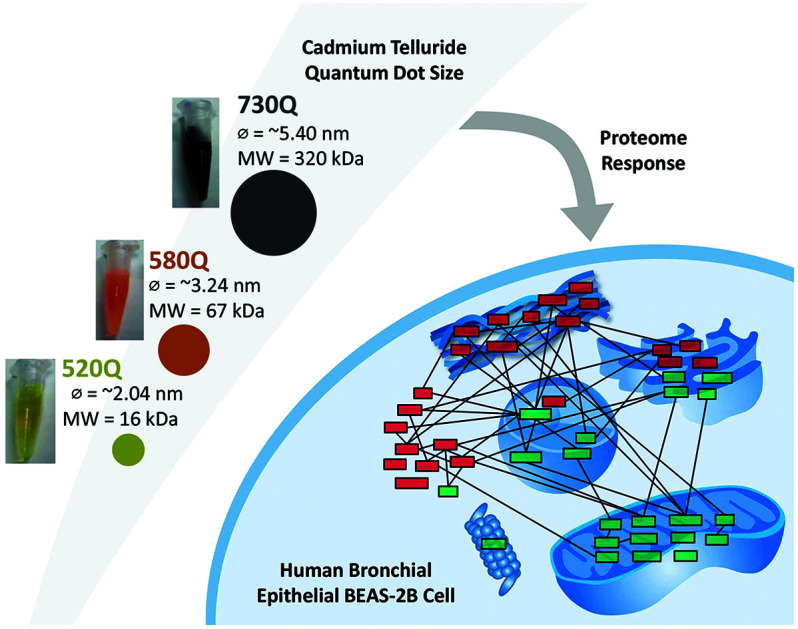
Quantum dots (QDs) are luminescent nanoparticles with superior versatility. In this regard, cadmium telluride (CdTe) QDs have been widely used for various bioimaging applications. Although these nano-Cd containing particles can be capped with shells to reduce their cytotoxicity, these shells would be gradually disintegrated after a certain period of time, thereby inevitably exerting nanotoxicity. Previously, we showed that treatment of human bronchial epithelial BEAS-2B cells with uncapped CdTe QDs (520Q, 580Q and 730Q with emission maximum at 520, 580 and 730 nm, respectively) elicited dose-dependent cytotoxicity for 520Q and 580Q (<5 nm), while 730Q (>5 nm) elicited negligible cytotoxicity. In order to gain a more global perspective on the action mechanism of these nano-Cd particles, here, we further characterized the proteome response of BEAS-2B when challenged with the above QDs. Interestingly, among the three nano-Cd particles, we observed that 520Q and 580Q treatment altered the BEAS-2B proteome significantly in a very similar magnitude while 730Q has no obvious impact at all, as compared with the untreated control. Notably, the treatment of BEAS-2B with glutathione before nano-Cd particles abrogated the induction/repression of differentially expressed proteins and prevented cell death. Taken together, our findings show that uncapped CdTe nanoparticles (520Q and 580Q) induce oxidative stress in human bronchial epithelial cells, and the similarly altered protein signatures also suggest potential mitotoxicity and common cellular and detoxification responses upon exposure of lung cells to these two QDs. On the other hand, 730Q may exert a more noticeable effect after long-term exposure, but not upon transient exposure.
Introduction
Quantum dots (QDs) are luminescent nanoparticles with superior versatility which have been widely used as QD diodes, QD displays, and in various bioimaging applications.1,2 The unique colors emitted by QDs are primarily determined by their particle sizes; as a result, a spectrum of diverse, color-emitting QDs with different particle sizes are being manufactured and used in industry and research. In general, at the biological level, although the coating of QDs with a shell/capping can reduce their nanotoxicity to living cells, yet if they are unleashed inappropriately as uncontained waste, their integrity will be gradually compromised,3 which could inevitably exert nanotoxicity to the nearby living organisms including humans upon exposure.
Although some studies already documented the cellular response to various nanoparticles, however, most of these were examined using mouse, rat, and cancer cell lines.4–7 Since QDs have the potential to be inhaled through the respiratory tract,8,9 understanding more of their effects on lung cells should enhance our knowledge of their mechanism of action to the respiratory system. However, to our knowledge, there are no published proteomic studies on the effects of cadmium telluride (CdTe) QDs on normal human lung cells. For these reasons, we resolved to use normal human bronchial epithelial BEAS-2B cells and sought to perform a proteome interrogation on this cell line treated with CdTe QDs of three particle sizes (two of them under 5 nm and the third one >5 nm in particle diameter), with the aim of identifying differentially expressed proteins in response to CdTe QDs.
By two-dimensional gel electrophoresis and mass spectrometry analyses, we showed for the very first time, the cellular response of normal human lung cells challenged with CdTe QDs. We reported the identification of 50 unique types of proteins which were altered in expression level in CdTe QD-treated cells as compared with the control. Through GO annotation and bioinformatic analysis, we concluded that CdTe QD treatment led to significant alterations of molecular chaperones, antioxidant enzymes, enzyme associated with the glutathione metabolic process, proteins involved in mitochondrial functions, as well as proteins associated with the cytoskeleton and endoplasmic reticulum. Treatment of BEAS-2B with glutathione (GSH) before nano-Cd particles countered the nano-Cd particle-induced cytotoxicity and induction/repression of differentially expressed proteins. Our findings implicate that the two nano-Cd particles under 5 nm in diameter induce oxidative stress in human bronchial epithelial cells, and the similarly altered protein signatures also suggest potential mitotoxicity and common detoxification response upon exposure of lung cells to these two QDs of different particle sizes.
Materials and methods
Reagents
Commercially synthesized green-emitting (PL-QDN-520), yellow-emitting (PL-QDN-580), and ruby-emitting (PL-QDN-730) uncapped CdTe QDs were purchased from PlasmaChem GmbH (Berlin, Germany). The physical properties of these hydrophilic nano-Cd particles have been described previously.10 Stock solutions were made by following our previously published procedures.10 The protein clean-up and silver staining kits were purchased from GE Healthcare (Uppsala, Sweden). All other reagents were purchased from GE Healthcare and Sigma-Aldrich (St Louis, MO). Primary antibodies used for immunoblot assay were purchased from GeneTex (Irvine, CA), Sangon Biotech (Shanghai, China), Santa Cruz Biotechnology (Santa Cruz, CA), and Sigma-Aldrich, with the following catalog numbers: GSTP1 (GTX112953, GeneTex); UCHL1 (GTX109637, GeneTex); PRDX1 (GTX113793, GeneTex); HSPB1 (GTX101145, GeneTex); PA2G4 (GTX103791, GeneTex); GNB2L1 (D222964, Sangon Biotech); PARK7 (D121103, Sangon Biotech); PPA1 (D154177, Sangon Biotech); RPLP0 (D221200, Sangon Biotech); NME1 (D121039, Sangon Biotech); HNRNPL (D261748, Sangon Biotech); eIF5A1 (sc-390202, Santa Cruz Biotechnology); and β-actin (A5441, Sigma-Aldrich).
Human lung cell model for nano-Cd exposure
The human bronchial epithelial BEAS-2B cell line was purchased from and authenticated by the American Type Culture Collection (ATCC) (Rockville, MD). Cells were cultured in defined LHC-9 medium and maintained as described previously.11 At approximately 75% of confluency, cells were exposed to CdTe QDs in LHC-9 medium. For countering the effects of CdTe QDs, glutathione (GSH) was added 1 h before the CdTe QDs. Cytotoxicity was measured by naphthol blue black (NBB) staining assay as described previously.10,12 The measurement of ROS generation was performed by using dihydroethidium (DHE) staining and flow cytometry as described previously.13
2-DE-MS analyses
Briefly, proteins were isolated from sham-exposed or nano-Cd-treated BEAS-2B and subjected to 2-DE analysis. Following silver staining, the stained gels were scanned using an ImageScanner III (GE Healthcare) operated by using LabScan 6.0 software. Image analysis and spot quantitation were carried out by using PDQuest software, version 8.0 (Bio-Rad). Three biological replicates were applied to each protein sample. Only spots with a change in expression ≥1.3 fold or spots that either appeared/disappeared were excised from the gels and identified by MS analysis. The procedures of our gel-based proteomic analysis were essentially the same as previously described.14
Immunoblot assay
Proteins of equal loading were resolved on appropriate SDS-polyacrylamide gel and electrotransferred onto PVDF membranes. After blocking with 5% (w/v) non-fat dry milk in PBS containing 0.05% Tween 20, the membranes were probed with various primary antibodies followed by the respective secondary antibodies. Immunoreactive bands were visualized with the enhanced chemiluminescence detection kit (GE Healthcare).
GO annotation and bioinformatic analysis
Proteins were classified from the Gene Ontology (GO) database and further annotated using the Database for Annotation, Visualization, and Integrated Discovery (DAVID). For the generation of visualized protein–protein interaction networks, proteins were grouped into different cellular organelles on the basis of where they mainly carried out their functions as described by the GO database. The interaction networks were analyzed and generated by using Cytoscape as previously described.15
Statistical analysis
Statistical analysis was performed using GraphPad Prism® 6 software (v6.02, GraphPad Software Inc.). All values are expressed as mean ± standard deviation (SD). All experiments were performed at least three times, and they showed similar trends in their results. The results from one representative experiment are shown. Two-tailed Student's t-test was used to determine significant differences between the means of analyzed data. P-Value (P) ≤ 0.05 was considered statistically significant.
Results
Proteome profiles of human bronchial epithelial BEAS-2B cells treated with CdTe QDs of three different particle sizes
Previously, we examined the cytotoxic effects of CdTe QDs in human bronchial epithelial BEAS-2B cells.10 Here, we continue to analyze the proteome profiles of these cells challenged with the three previously studied CdTe QDs of various diameters [520Q cytotoxic, 580Q cytotoxic, and 730Q non-cytotoxic]. Since the cytotoxicity of these three QDs was thoroughly examined in our prior published study,10 therefore, in this study, we only chose the final dosage of 20 μg mL–1 in the subsequent experiment here. After 2-D PAGE, gel images were digitalized and compared. Interestingly, cells challenged with CdTe QDs of <5 nm diameter [i.e., 520Q (2.04 nm) and 580Q (3.24 nm)] exhibit similar proteome profile changes as compared with the control cells. Fig. 1 depicts the silver stained gel image from cells treated with 20 μg mL–1 520Q for 24 h. In general, 57 spots were determined commonly altered upon 520Q and 580Q exposure (Fig. 2), while there was no significant difference of proteome in 730Q (5.40 nm) treatment as compared with the control (ESI Fig. S1†). Since 730Q exerts no significant proteome changes in BEAS-2B, therefore, only differential spots from 520Q and 580Q treatment were excised and subjected to trypsin digestion, MS analysis and database searching. Table 1, ESI Table S1,† and Fig. 2 summarize the identified proteins and their expression levels between the control and 20 μg mL–1 CdTe QD-treated cells. In general, there were marked alterations of molecular chaperones (such as HSPA6 and HSPB1), antioxidant enzymes (such as PRDX1, PRDX2, and PRDX6), the enzyme associated with the glutathione metabolic process (GSTP1), proteins involved in the mitochondrial metabolic process (such as ATP5H and COX5A), as well as proteins associated with the cytoskeleton (such as ANXA1 and MYL12A) and endoplasmic reticulum (such as EIF5A and ERP29). At the same time, several selected differentially expressed proteins between sham-exposed and CdTe QD-treated cells were further confirmed by immunoblot assay (ESI Fig. S2†), showing the similar trend of repression/induction, suggesting these results are in agreement with the expression levels as they appeared in 2-D gels.
Fig. 1. Analyses of cellular proteins from BEAS-2B cells dosed with CdTe QDs. A representative gel image of the cell lysate from BEAS-2B cells dosed with 20 μg mL–1 520Q for 24 h visualized by 2-D gel (12.5%) and silver staining. Differentially expressed proteins are indicated by arrows and identified by MALDI-TOF-MS. The results are representative of three independent experiments.

Fig. 2. Dot plot showing the expressions of a total of 57 spots (50 different protein types) identified by 2-DE analysis in this study. The expression for each spot is expressed in Δ volume (×10–3%) in which the expression value detected on the 520Q or 580Q treatment is subtracted by the value of the untreated control. Data were arranged from the highest expression to the lowest (left to right) based on the mean value obtained from 520Q and 580Q treatment.

Table 1. Identification of differentially expressed proteins in BEAS-2B cells treated with CdTe QDs for 24 h. Protein spots were quantified after 2-D PAGE and identified by MS and protein database matching. The up- or down-regulation of proteins as compared with the untreated control is indicated by arrows.
| Sample number | Abbreviation | Protein name | Accession no. | pI | MW (kDa) | Matched peptides | Coverage (%) | Mascot score |
| 1 | MYL12A | Myosin regulatory light chain 12A ↑ | P19105 | 4.67 | 19.8 | 7 | 40.4 | 679 |
| 2 | EIF5A | Eukaryotic translation initiation factor 5A-1 ↑ | P63241 | 5.07 | 16.8 | 5 | 25.0 | 187 |
| 3 | PRDX6 | Peroxiredoxin-6 ↑ | P30041 | 6.00 | 25.0 | 13 | 53.1 | 602 |
| 4 | HSPB1 | Heat shock protein beta-1 ↑ | P04792 | 5.98 | 22.8 | 11 | 48.3 | 1947 |
| 5 | RPLP0 | 60S acidic ribosomal protein P0 ↑ | P05388 | 5.72 | 34.3 | 19 | 60.6 | 2294 |
| 6 | PAFAH1B3 | Platelet-activating factor acetylhydrolase IB subunit gamma ↑ | Q15102 | 6.33 | 25.7 | 1 | 7.4 | 42 |
| 7 | PA2G4 | Proliferation-associated protein 2G4 ↑ | Q9UQ80 | 6.13 | 43.8 | 25 | 49.2 | 4620 |
| 8 | GSTP1 | Glutathione S-transferase P ↑ | P09211 | 5.43 | 23.4 | 12 | 61.0 | 1121 |
| 9 | PPIA | Peptidyl-prolyl cis–trans isomerase A ↑ | P62937 | 7.68 | 18.0 | 14 | 53.9 | 1608 |
| 10 | EEF1B2 | Elongation factor 1-beta ↑ | P24534 | 4.5 | 24.8 | 7 | 35.1 | 887 |
| 11 | TPT1 | Translationally controlled tumor protein ↑ | P13693 | 4.84 | 19.6 | 10 | 40.7 | 284 |
| 12 | MYL12A | Myosin regulatory light chain 12A ↑ | P19105 | 4.67 | 19.8 | 4 | 24.6 | 55 |
| 13 | GSTP1 | Glutathione S-transferase P ↑ | P09211 | 5.43 | 23.4 | 1 | 7.6 | 35 |
| 14 | ANXA1 | Annexin A1 ↑ | P04083 | 6.57 | 38.7 | 21 | 56.1 | 2062 |
| 15 | NME1 | Nucleoside diphosphate kinase A ↑ | P15531 | 5.83 | 17.1 | 10 | 53.3 | 596 |
| 16 | PARK7 | Protein/nucleic acid deglycase DJ-1 ↑ | Q99497 | 6.33 | 19.9 | 12 | 54.5 | 219 |
| 17 | PRDX1 | Peroxiredoxin-1 ↑ | Q06830 | 8.27 | 22.1 | 15 | 53.3 | 1008 |
| 18 | PPA1 | Inorganic pyrophosphatase ↑ | Q15181 | 5.54 | 32.7 | 11 | 35.3 | 368 |
| 19 | UCHL1 | Ubiquitin carboxyl-terminal hydrolase isozyme L1 ↑ | P09936 | 5.33 | 24.8 | 8 | 36.8 | 241 |
| 20 | CAPG | Macrophage-capping protein ↑ | P40121 | 5.82 | 38.5 | 9 | 20.4 | 743 |
| 21 | BLVRB | Flavin reductase (NADPH) ↑ | P30043 | 7.13 | 22.1 | 5 | 22.3 | 172 |
| 22 | PRDX2 | Peroxiredoxin-2 ↑ | P32119 | 5.66 | 21.9 | 8 | 39.9 | 494 |
| 23 | HSPA6 | Heat shock 70 kDa protein 6 ↑ | P17066 | 5.81 | 71.0 | 14 | 23.2 | 538 |
| 24 | EZR | Ezrin ↑ | P15311 | 5.94 | 69.4 | 23 | 32.9 | 1509 |
| 25 | ARHGDIA | Rho GDP-dissociation inhibitor 1 ↑ | P52565 | 5.03 | 23.2 | 9 | 31.9 | 686 |
| 26 | NUDT5 | ADP-sugar pyrophosphatase ↑ | Q9UKK9 | 4.87 | 24.3 | 8 | 35.2 | 137 |
| 27 | PFN1 | Profilin-1 ↑ | P07737 | 8.44 | 15.1 | 11 | 71.4 | 2452 |
| 28 | GNB2L1 | Guanine nucleotide-binding protein subunit beta-2-like 1 ↑ | P63244 | 7.6 | 35.1 | 13 | 39.1 | 2277 |
| 29 | PPIA | Peptidyl-prolyl cis–trans isomerase A ↑ | P62937 | 7.68 | 18.0 | 12 | 49.1 | 1197 |
| 30 | PKM | Pyruvate kinase PKM ↑ | P14618 | 7.96 | 57.9 | 13 | 26.0 | 359 |
| 31 | IMPDH2 | Inosine-5′-monophosphate dehydrogenase 2 ↓ | P12268 | 6.44 | 55.8 | 21 | 33.1 | 1746 |
| 32 | HNRNPAB | Heterogeneous nuclear ribonucleoprotein A/B ↓ | Q99729 | 8.21 | 36.2 | 7 | 17.8 | 1088 |
| 33 | DNAJB11 | DnaJ homolog subfamily B member 11 ↓ | Q9UBS4 | 5.81 | 40.5 | 5 | 17.9 | 185 |
| 34 | LAP3 | Cytosol aminopeptidase ↓ | P28838 | 8.03 | 56.2 | 13 | 28.7 | 1084 |
| 35 | MTHFD2 | Bifunctional methylenetetrahydrofolate dehydrogenase/cyclohydrolase, mitochondrial ↓ | P13995 | 8.86 | 37.9 | 5 | 15.1 | 379 |
| 36 | PSMB3 | Proteasome subunit beta type-3 ↓ | P49720 | 6.14 | 22.9 | 5 | 31.2 | 262 |
| 37 | HNRNPL | Heterogeneous nuclear ribonucleoprotein L ↓ | P14866 | 8.46 | 64.1 | 17 | 35.8 | 1542 |
| 38 | ETFB | Electron transfer flavoprotein subunit beta ↓ | P38117 | 8.25 | 27.8 | 13 | 51.4 | 642 |
| 39 | TUFM | Elongation factor Tu, mitochondrial ↓ | P49411 | 7.26 | 49.5 | 8 | 19.9 | 779 |
| 40 | HNRNPAB | Heterogeneous nuclear ribonucleoprotein A/B ↓ | Q99729 | 8.21 | 36.2 | 8 | 17.8 | 1737 |
| 41 | HNRNPL | Heterogeneous nuclear ribonucleoprotein L ↓ | P14866 | 8.46 | 64.1 | 25 | 45.2 | 3555 |
| 42 | HSD17B10 | 3-Hydroxyacyl-CoA dehydrogenase type-2 ↓ | Q99714 | 7.65 | 26.9 | 16 | 78.5 | 1576 |
| 43 | PRDX3 | Thioredoxin-dependent peroxide reductase, mitochondrial ↓ | P30048 | 7.68 | 27.7 | 7 | 25.0 | 585 |
| 44 | HADH | Hydroxyacyl-coenzyme A dehydrogenase, mitochondrial ↓ | Q16836 | 8.88 | 34.3 | 6 | 15.3 | 174 |
| 45 | PYCR1 | Pyrroline-5-carboxylate reductase 1, mitochondrial ↓ | P32322 | 7.18 | 33.4 | 2 | 7.5 | 176 |
| 46 | PRDX4 | Peroxiredoxin-4 ↓ | Q13162 | 5.86 | 30.5 | 9 | 30.3 | 540 |
| 47 | MRPL12 | 39S ribosomal protein L12, mitochondrial ↓ | P52815 | 9.05 | 21.3 | 3 | 17.7 | 82 |
| 48 | ATP5H | ATP synthase subunit d, mitochondrial ↓ | O75947 | 5.21 | 18.5 | 9 | 47.8 | 307 |
| 49 | PRDX3 | Thioredoxin-dependent peroxide reductase, mitochondrial ↓ | P30048 | 7.68 | 27.7 | 8 | 27.0 | 719 |
| 50 | ERP29 | Endoplasmic reticulum resident protein 29 ↓ | P30040 | 6.77 | 29.0 | 10 | 37.2 | 1124 |
| 51 | C1QBP | Complement component 1 Q subcomponent-binding protein, mitochondrial ↓ | Q07021 | 4.74 | 31.4 | 4 | 13.8 | 228 |
| 52 | CBX1 | Chromobox protein homolog 1 ↓ | P83916 | 4.85 | 21.4 | 10 | 34.6 | 1144 |
| 53 | GUK1 | Guanylate kinase ↓ | Q16774 | 6.11 | 21.7 | 5 | 26.9 | 98 |
| 54 | COX5A | Cytochrome c oxidase subunit 5A, mitochondrial ↓ | P20674 | 6.30 | 16.8 | 6 | 26.0 | 165 |
| 55 | MRPL12 | 39S ribosomal protein L12, mitochondrial ↓ | P52815 | 9.05 | 21.3 | 7 | 26.8 | 716 |
| 56 | HNRNPA1 | Heterogeneous nuclear ribonucleoprotein A1 ↓ | P09651 | 9.17 | 38.7 | 13 | 41.4 | 4290 |
| 57 | PPIB | Peptidyl-prolyl cis–trans isomerase B ↓ | P23284 | 9.42 | 23.7 | 16 | 54.6 | 2508 |
Protein network analysis of differentially expressed proteins upon CdTe QD exposure
By performing GO enrichment analysis using DAVID, the differentially expressed proteins upon CdTe QD exposure were found to be mostly related to the categories of mitochondrial and redox homeostasis (Fig. 3). In particular, the downregulation of mitochondrion-associated proteins, including ATP5H, C1QBP, COX5A, ETFB, HADH, HSD17B10, MRPL12, MTHFD2, PRDX3, PYCR1, and TUFM (in which ATP5H and COX5A are well-known mitochondrial proteins for the ATP biosynthetic process and respiratory electron transport, respectively), is likely to promote cell death by mitochondrial dysfunction (mitotoxicity), while the upregulation of cell adhesion and cytoskeleton-associated proteins, including ANXA1, ARHGDIA, CAPG, EZR, HSPA6, HSPB1, MYL12A, PFN1, and TPT1, is likely to play a role in promoting cell survival by remodeling of the cytoskeleton to battle against stress conditions. Moreover, several of the upregulated proteins (including GSTP1, PRDX1, PRDX2, and PRDX6) are closely related to free radical scavenging and detoxification of reactive oxygen species (ROS), suggesting that BEAS-2B cells undergo oxidative stress upon CdTe QD exposure. These results show the opposing cellular activities of protein expression in struggling for cell survival from cell death. To present the visualized image of these differentially expressed proteins, their main subcellular localization and all known protein–protein interaction networks are summarized and presented, as shown in Fig. 4.
Fig. 3. Schematic representation of the GO enrichment analysis of the identified proteins in this study. The 50 altered protein types upon CdTe QD treatment in BEAS-2B cells were examined by bioinformatic analysis using DAVID and arranged according to the –log 10(P) values. The higher the –log 10(P) value, the more likely the proteins associated with the indicated process/function. Only the GO terms with P ≤ 0.05 (i.e., with –log 10(P) value as ≥1.3) were considered significant and are shown here. The number of proteins within each GO term were also shown on the right of each bar. CC, cellular component; MF, molecular function; BP, biological process.

Fig. 4. Visualized protein–protein interaction networks of 44 selected proteins. Proteins were grouped into different cellular organelles on the basis of where they mainly carried out their functions as described by the GO database. The interaction networks were analyzed and generated by using Cytoscape as previously described.15 Proteins highlighted in red indicate up-regulated expression upon QD (520Q and 580Q) exposure whereas proteins highlighted in green indicate down-regulated expression.

Abrogation of CdTe QDs’ effect on the proteome by antioxidant glutathione
Previously, we reported that cadmium chloride (CdCl2) induced cytotoxicity through the induction of oxidative stress along with the elevation of stress protein expressions in lung epithelial cells, and the CdCl2-induced cytotoxicity can be abrogated by pretreating the cells with the antioxidant glutathione (GSH).14,16 Therefore, we tested whether GSH can also protect BEAS-2B from nano-Cd particle-induced cytotoxicity. In agreement with our hypothesis, we confirmed that CdTe QD-induced oxidative stress is indeed due to ROS generation, as 520Q/580Q treatment led to an elevated ROS level in BEAS-2B cells, but not for 730Q treatment (ESI Fig. S3†). Subsequently, the protective role of intracellular GSH in the induction of differentially expressed proteins by CdTe QDs in BEAS-2B cells was examined. Since 20 μg mL–1 CdTe QD dosage produced obvious proteome changes, this dosage was chosen. As we can see, GSH pretreatment before 520Q effectively abrogated the repression/induction of the majority of differentially expressed proteins as determined by 2-DE analysis (ESI Fig. S4†). Similar results were observed for 580Q treatment (data not shown).
Oxidative stress correlates CdTe QDs’ nanotoxicity
To further show that CdTe QD-induced cytotoxicity in BEAS-2B cells is due to oxidative stress, BEAS-2B cells were untreated or pretreated with GSH for 1 h and then exposed to 20 μg mL–1 520Q or 580Q for 24 h. NBB staining showed that treatment of GSH before 520Q or 580Q effectively abrogated CdTe QDs’ nanotoxicity. In the absence of GSH protection, massive cell death can be seen (Fig. 5), indicating the role of oxidative stress in CdTe QD-induced cytotoxicity. From the above, we concluded that nano-Cd containing particles under 5 nm in diameter likely cause oxidative stress-induced cytotoxicity and exert similar proteome changes in human lung cells.
Fig. 5. Oxidative stress correlates CdTe QDs’ nanotoxicity and can be abrogated by antioxidant glutathione (GSH). BEAS-2B cells were untreated or pretreated with GSH (10–30 mM) for 1 h and then exposed to 20 μg mL–1 (A) 520Q or (B) 580Q for 24 h. Cytotoxicity was measured by naphthol blue black (NBB) staining assay as shown on the left. The percentage of viability was expressed as 100% for sham-exposed cells. *, P ≤ 0.05 versus CdTe QD-treated cells. The corresponding BEAS-2B cell morphology was captured and is shown on the right. The results are representative of three independent experiments.

Discussion
In the last decade, although some studies already documented the cellular response to various Cd nanoparticles (such as CdTe, CdSe, and CdS),4,17,18 most of these were examined using rodent and cancer cell lines.4–7 Since QDs have the potential to be inhaled through the respiratory tract,8,9 it becomes an urgent matter for us to understand more globally of their effects on the cells of the respiratory system. In this study, we utilized the human bronchial epithelial BEAS-2B cell as a model to study the cellular biological response to Cd nanoparticles, using a gel-based proteomic approach.
As has been suggested previously by us, it is logical to assume that because of the smaller particle diameter of 520Q and 580Q (under 5 nm), they are able to enter the cell, eventually exerting nanotoxicity.10 It is quite intriguing to see 730Q, which is just slightly over 5 nm in particle diameter (5.40 nm), behave so differently as compared with 520Q/580Q. The fact that although the three CdTe QDs examined here range from 2.04 to 5.40 nm in particle diameter, the molecular size of 730Q is 320 kDa, which is 20 times and 4.8 times that of 520Q (16 kDa) and 580Q (67 kDa), respectively. We believe that the much larger size of 730Q (320 kDa) hinders it from entering the cells. This assumption can be supported by the fact that there is no significant impact on the proteome of 730Q-treated cells (ESI Fig. S1†), which may also explain why 730Q exhibits negligible cytotoxicity to BEAS-2B in this (ESI Fig. S5†) and our previous study.10 Besides, we did not exclude other factors that might also exist and contribute to the distinct biological effects of these nanoparticles, which warrants further investigation.
On the other hand, we were able to observe significant proteome changes in cells dosed with 520Q and 580Q. Treatment of BEAS-2B cells with 20 μg mL–1 CdTe QDs produced 57 spots with significant changes on 2-D gels. Interestingly, the magnitude of proteome changes with 520Q treatment is very reminiscent to that of 580Q (although 520Q being more cytotoxic than 580Q as determined by cell viability assay),10 which is contrary to our initial hypothesis that 520Q treatment should exert more pronounced proteome changes as compared with 580Q treatment. By DAVID analysis, the differentially expressed proteins after CdTe QD exposure are mostly related to the categories of mitochondrial and redox homeostasis. In particular, GSTP1, PRDX1, PRDX2, and PRDX6 are responsible for free radical scavenging and detoxification of ROS; their elevation in 520Q and 580Q treatment is indicative of lung cells undergoing oxidative stress. As a matter of fact, CdTe QD-induced cytotoxicity in BEAS-2B cells is largely due to oxidative stress, as pretreatment with GSH effectively abrogated the induction/repression of differentially expressed proteins, protecting from cell death. Although it is unclear whether CdTe QDs would directly react with the thiol groups of biomolecules inside the cells, we believe that the free Cd2+ ions leached from CdTe QDs would indirectly react with thiol-containing biomolecules (including GSH) and cause the depletion of the reduced GSH level and perturbation of intracellular redox homeostasis, thereby causing oxidative stress. Since from our data, only 520Q and 580Q cause elevation of ROS and oxidative stress-induced cytotoxicity in BEAS-2B, which can be countered by GSH pretreatment, we believe that 520Q and 580Q would likely somehow directly and/or indirectly (leaching of Cd2+ from the QDs) react with thiol groups or cause oxidative stress-induced cytotoxicity through other undiscovered mechanisms. Our data are in agreement with others which also demonstrated oxidative stress-induced cytotoxicity by nano-Cd treatment in several other cell types.4,19,20 Besides, the upregulation of cell adhesion and cytoskeleton-associated proteins (including ANXA1, ARHGDIA, CAPG, EZR, HSPA6, HSPB1, MYL12A, PFN1, and TPT1) is likely to play a role in promoting cell survival by remodeling of the lung cell cytoskeleton to battle against stress conditions.
Although it is true that some studies have already suggested that CdTe QDs target the mitochondria leading to mitochondrial dysfunction,21–23 the corresponding proteome changes are unclear. Our study showed for the first time that CdTe QD treatment leads to the downregulation of a panel of mitochondrial proteins, including ATP5H and COX5A proteins important for the ATP biosynthetic process and respiratory electron transport. During respiration the epithelial cells of the respiratory tract can readily contact the inhaled gas from the outside environment; therefore, the bronchial epithelial cells which are located at the deeper part of the lungs are especially vulnerable to toxicants that might be present in the air, e.g., CdTe QDs. The impaired expressions/functions of these mitochondrial proteins upon CdTe QD exposure would likely lead to mitotoxicity and adversely impact the lung cell physiology/function. The exact role and relationship of these target proteins (especially for those less familiar mitochondrial proteins such as C1QBP, ETFB, HADH, HSD17B10, MRPL12, MTHFD2, PYCR1, and TUFM) in the course of nano-Cd particle-induced mitotoxicity should be studied further.
In conclusion, we performed the first proteome profiling of normal human lung cells exposed to nano-Cd containing particles. Our data suggested that uncapped CdTe QDs under <5 nm in particle size likely induce oxidative stress in normal human bronchial epithelial cells, and the similarly altered protein signatures also suggest potential mitotoxicity and common detoxification response upon exposure of lung cells to these two CdTe QDs of different particle sizes (i.e., 2.04 nm for 520Q and 3.24 nm for 580Q). On the other hand, 730Q (over 5 nm) may exert a more noticeable effect after long-term exposure (as chronic exposure to 730Q has been demonstrated to promote BEAS-2B cell transformation in our previous study),10 but not upon transient exposure. Data from our study would hopefully stimulate and promote the need for further proteomic research on the uncharted effects of other nanoparticles (such as other toxic metal-containing nanoparticles) on respiratory cells, which might eventually enhance our knowledge and enable us in finding ways to antagonize their potential nanotoxicity to the human respiratory system.
Conflicts of interest
The authors report no conflict of interest.
Supplementary Material
Acknowledgments
This work was supported by the grants from the National Natural Science Foundation of China (No. 31771582 and 31271445), the Guangdong Natural Science Foundation of China (No. 2017A030313131), the Science and Technology Planning Project of Guangdong Province of China (No. 2016A020215144), the “Thousand, Hundred, and Ten” project of the Department of Education of Guangdong Province of China (No. 124), the Basic and Applied Research Major Projects of Guangdong Province of China (2017KZDXM035), the Colleges and Universities Innovation Project of Guangdong Province of China (No. 2016KTSCX041 and 2016KTSCX042), and the “Yang Fan” Project of Guangdong Province of China (Andy T. Y. Lau-2016; Yan-Ming Xu-2015). We would like to thank members of the Lau And Xu laboratory for the critical reading of this manuscript.
Footnotes
†Electronic supplementary information (ESI) available. See DOI: 10.1039/c9tx00126c
References
- Kim S., Im S. H., Kim S. W. Nanoscale. 2013;5:5205–5214. doi: 10.1039/c3nr00496a. [DOI] [PubMed] [Google Scholar]
- Massey M., Wu M., Conroy E. M., Algar W. R. Curr. Opin. Biotechnol. 2015;34:30–40. doi: 10.1016/j.copbio.2014.11.006. [DOI] [PubMed] [Google Scholar]
- Winnik F. M., Maysinger D. Acc. Chem. Res. 2013;46:672–680. doi: 10.1021/ar3000585. [DOI] [PubMed] [Google Scholar]
- Nguyen K. C., Willmore W. G., Tayabali A. F. Toxicology. 2013;306:114–123. doi: 10.1016/j.tox.2013.02.010. [DOI] [PubMed] [Google Scholar]
- Luo Y. H., Wu S. B., Wei Y. H., Chen Y. C., Tsai M. H., Ho C. C., Lin S. Y., Yang C. S., Lin P. Chem. Res. Toxicol. 2013;26:662–673. doi: 10.1021/tx300455k. [DOI] [PubMed] [Google Scholar]
- Choi A. O., Brown S. E., Szyf M., Maysinger D. J. Mol. Med. 2008;86:291–302. doi: 10.1007/s00109-007-0274-2. [DOI] [PubMed] [Google Scholar]
- Lovric J., Bazzi H. S., Cuie Y., Fortin G. R., Winnik F. M., Maysinger D. J. Mol. Med. 2005;83:377–385. doi: 10.1007/s00109-004-0629-x. [DOI] [PubMed] [Google Scholar]
- Wang F., Shu L., Wang J., Pan X., Huang R., Lin Y., Cai X. Curr. Drug Metab. 2013;14:847–856. doi: 10.2174/138920021131400106. [DOI] [PubMed] [Google Scholar]
- Scoville D. K., White C. C., Botta D., McConnachie L. A., Zadworny M. E., Schmuck S. C., Hu X., Gao X., Yu J., Dills R. L., Sheppard L., Delaney M. A., Griffith W. C., Beyer R. P., Zangar R. C., Pounds J. G., Faustman E. M., Kavanagh T. J. Toxicol. Appl. Pharmacol. 2015;289:240–250. doi: 10.1016/j.taap.2015.09.019. [DOI] [PMC free article] [PubMed] [Google Scholar]
- Zheng W., Xu Y. M., Wu D. D., Yao Y., Liang Z. L., Tan H. W., Lau A. T. Y. Biochem. Biophys. Res. Commun. 2018;495:899–903. doi: 10.1016/j.bbrc.2017.11.074. [DOI] [PubMed] [Google Scholar]
- Liang Z. L., Wu D. D., Yao Y., Yu F. Y., Yang L., Tan H. W., Hylkema M. N., Rots M. G., Xu Y. M., Lau A. T. Y. J. Appl. Toxicol. 2018;38:888–895. doi: 10.1002/jat.3597. [DOI] [PubMed] [Google Scholar]
- Chen D. J., Xu Y. M., Du J. Y., Huang D. Y., Lau A. T. Biochem. Biophys. Res. Commun. 2014;445:95–99. doi: 10.1016/j.bbrc.2014.01.146. [DOI] [PubMed] [Google Scholar]
- Xu Y. M., Wu D. D., Zheng W., Yu F. Y., Yang F., Yao Y., Zhou Y., Ching Y. P., Lau A. T. Oncotarget. 2016;7:6146–6158. doi: 10.18632/oncotarget.6738. [DOI] [PMC free article] [PubMed] [Google Scholar]
- Chen D. J., Xu Y. M., Zheng W., Huang D. Y., Wong W. Y., Tai W. C., Cho Y. Y., Lau A. T. Proteomics. 2015;15:3075–3086. doi: 10.1002/pmic.201400489. [DOI] [PubMed] [Google Scholar]
- Lau A. T. Y., Xu Y. M. J. Cell. Physiol. 2019;234:75–88. doi: 10.1002/jcp.27053. [DOI] [PubMed] [Google Scholar]
- Xu Y. M., Zhou Y., Chen D. J., Huang D. Y., Chiu J. F., Lau A. T. Y. Toxicol. Res. 2013;2:280–287. [Google Scholar]
- L'Azou B., Passagne I., Mounicou S., Tréguer-Delapierre M., Puljalté I., Szpunar J., Lobinski R., Ohayon-Courtès C. Toxicol. Res. 2014;3:32–41. [Google Scholar]
- Neibert K. D., Maysinger D. Nanotoxicology. 2012;6:249–262. doi: 10.3109/17435390.2011.572195. [DOI] [PubMed] [Google Scholar]
- Zhang T., Wang Y., Kong L., Xue Y., Tang M. Int. J. Environ. Res. Public Health. 2015;12:13435–13454. doi: 10.3390/ijerph121013435. [DOI] [PMC free article] [PubMed] [Google Scholar]
- Srivastava S., Pant A., Trivedi S., Pandey R. Environ. Toxicol. Pharmacol. 2016;42:55–62. doi: 10.1016/j.etap.2016.01.001. [DOI] [PubMed] [Google Scholar]
- Nguyen K. C., Rippstein P., Tayabali A. F., Willmore W. G. Toxicol. Sci. 2015;146:31–42. doi: 10.1093/toxsci/kfv068. [DOI] [PMC free article] [PubMed] [Google Scholar]
- Li J., Zhang Y., Xiao Q., Tian F., Liu X., Li R., Zhao G., Jiang F., Liu Y. J. Hazard. Mater. 2011;194:440–444. doi: 10.1016/j.jhazmat.2011.07.113. [DOI] [PubMed] [Google Scholar]
- Lai L., Jin J. C., Xu Z. Q., Ge Y. S., Jiang F. L., Liu Y. J. Membr. Biol. 2015;248:727–740. doi: 10.1007/s00232-015-9785-x. [DOI] [PubMed] [Google Scholar]
Associated Data
This section collects any data citations, data availability statements, or supplementary materials included in this article.