Abstract
Fast-scan cyclic voltammetry (FSCV) is widely used for in vivo detection of neurotransmitters, but identifying analytes, particularly mixtures, is difficult. Data analysis has focused on identifying dopamine from cyclic voltammograms, but it would be better to analyze all the data in the three dimensional FSCV color plot. Here, the goal was to use image analysis-based analysis of FSCV color plots for the first time, specifically the structural similarity index (SSIM), to identify rapid neurochemical events. Initially, we focused on identifying spontaneous adenosine events, as adenosine cyclic voltammograms have a primary oxidation at 1.3 V and a secondary oxidation peak that grows in over time. Using SSIM, sample FSCV color plots were compared with reference color plots, and the SSIM cutoff score was optimized to distinguish adenosine. High-pass digital filtering was also applied to remove the background drift and lower the noise, which produced a better LOD. The SSIM algorithm detected more adenosine events than a previous algorithm based on current vs time traces, with 99.5 ± 0.6% precision, 95 ± 3% recall, and 97 ± 2% F1 score (n = 15 experiments from three researchers). For selectivity, it successfully rejected signals from pH changes, histamine, and H2O2. To prove it is a broad strategy useful beyond adenosine, SSIM analysis was optimized for dopamine detection and is able to detect simultaneous events with dopamine and adenosine. Thus, SSIM is a general strategy for FSCV data analysis that uses three dimensional data to detect multiple analytes in an efficient, automated analysis.
Keywords: fast-scan cyclic voltammetry (FSCV), adenosine, dopamine, structural similarity index (SSIM), image processing, automated analysis
Graphical Abstract
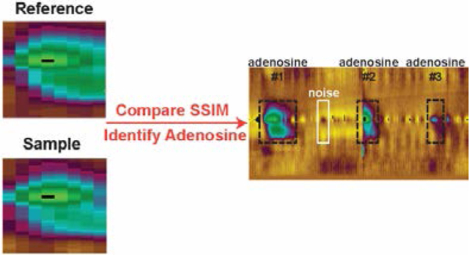
Fast-scan cyclic voltammetry (FSCV)1–3 has been adopted by neurochemists to monitor rapid dynamics of electroactive molecules in vivo such as dopamine,4–7 serotonin,8,9 adenosine,10,11 and hydrogen peroxide (H2O2)12,13 because of its fast temporal response.4,14–18 FSCV also gives a unique cyclic voltammogram (CV) for each analyte and thus has better selectivity than other electrochemical techniques such as amperometry.7,19 False color plots were invented to visualize all the current-potential-time data, including the Faradaic signals, noise, and signal drift.20 Yet, analyzing large datasets requires significant effort by humans and could be biased. Statistical techniques such as principal component regression (PCR) and partial least square regression (PLSR) have been used to discriminate neurotransmitter signals from the noise and pH shifts in FSCV data.21–24 However, these techniques analyze a single CV and fail to accurately detect and quantify neurotransmitters which have CV shapes changing within the same event.25 Using an alternative data analysis algorithm that analyzes the whole 3D data set will improve the accuracy and efficiency of the analysis.
Adenosine is a neuromodulator that regulates cell signaling, blood flow, sleep, and neurotransmission.10,11,26,27 FSCV has revealed the rapid dynamics of adenosine release in vivo, including a spontaneous mode of adenosine events that are random and hard to predict.10,14,28,29 Adenosine is difficult to detect because it undergoes at least two oxidation steps and results in two Faradaic peaks that grow on different time scales.10,30 Thus, the CV shapes within the same adenosine event are different, and this complicates the PCR analysis.14,25 In a previous study,25 we proposed an automated algorithm (“Borman Method”) to detect adenosine events by using the temporal relationship between primary and secondary peak in current-time traces. The program differentiated adenosine from other high-oxidation potential compounds such as H2O2 and histamine.12,25,31 Nevertheless, using only two current-time traces to analyze the data ignores most of the data set and is susceptible to electrical noise and background drift in continuous measurements.23,32,33 Therefore, data analysis using the full color plot would be more accurate.
An alternative solution for FSCV data analysis is to consider the 3D color plot as an image, and then apply an image processing technique to it. Because of differences in redox potential, redox kinetics, and mass transport properties, each neurotransmitter produces a unique “image” with different peak potential, peak width, and temporal characteristics in the FSCV color plot. Hence, detecting a neurotransmitter from the color plot data becomes a problem of image recognition.34 One key image recognition method is the structural similarity (SSIM) index, developed based on the human visual system, which recognizes objects from the structural variation in a perceived view.35 With the SSIM index, the similarity between a sample image and a reference image is calculated as a function of luminance, contrast, and structure.35 It outperforms other measures such as mean squared error that compare the intensity difference pixel by pixel, as the latter does not consider the whole image structure and does not tolerate a slight shift in the image.35,36 The SSIM index has been implemented to detect an object in many applications such as digit recognition,36 mammograms,37 electrocardiograms,38 and mass spectrometry imaging.34
In this work, we implemented the SSIM image analysis (termed “SSIM Method”) for the first time in electrochemistry to analyze FSCV data. We developed new software that uses the SSIM to detect transient adenosine events by comparing FSCV color plots between the sample data and reference events. A high-pass filter was applied to remove the background charging current and background drift,32 eliminating the need for background subtraction. The new software was tested by analyzing 15 datasets of spontaneous adenosine detection in rats and mice, and it resulted in 99.5 ± 0.6% precision, 95 ± 3% recall, and 97 ± 2% F1 overall score. The SSIM index effectively rejected noise and other chemical interferents. Finally, the SSIM image analysis was generalized to detect dopamine, including dopamine events that occur simultaneously with adenosine events. The combination of image analysis and signal processing enhances high accuracy, precision, and efficiency for the automated analysis of FSCV data and is promising for automated analysis of any analytical data that can be represented as images.
Experimental Section
Carbon-Fiber Microelectrodes and FSCV Instrumentation
Carbon-fiber microelectrodes (CFMEs) were prepared from T-650 carbon fibers (Cytec Engineering Materials, West Patterson, NJ) with 7-μm diameter. The fiber was insulated and sealed in a glass capillary39 to leave an exposed fiber length of 100 μm. FSCV data were collected at a ChemClamp potentiostat (Dagan, Minneapolis, MN) using a two-electrode system, including CFME working electrode and Ag/AgCl reference electrode. The FSCV waveform was −0.4 V holding potential, +1.45 V switching potential, 400 v/s scan rate, and 10 Hz repetition rate. All data were collected with HDCV Analysis (Department of Chemistry, University of North Carolina at Chapel Hill).
Chemicals and In Vitro Experiments
Adenosine, dopamine, histamine, and adenosine triphosphate (ATP) were purchased from Acros Organics (Morris Plains, NJ), and H2O2 was purchased from Macron (Center Valley, PA). Stock solutions were prepared in 0.1 M HClO4 to 10 mM concentration. The final working solutions were prepared by diluting the stock solution in the phosphate-buffered saline (PBS) containing 131.25 mM NaCl, 3.00 mM KCl, 10.0 mM NaH2PO4, 1.2 mM MgCl2, 2.0 mM Na2SO4, and 1.2 mM CaCl2 with pH adjusted to 7.4. The buffer was also adjusted to pH 7.3 by HCl or pH 7.5 by NaOH to test the effect of pH change. In vitro experiments and electrode calibration were conducted with a flow cell connected to a syringe pump (Harvard Apparatus, Holliston, MA) and a six-port loop injector with an air actuator (VIVI Valco Instruments, Houston, TX).
SSIM Calculation, Digital Filtering, and Program Implementation
SSIM calculation, digital filtering and the SSIM Method software were implemented in MATLAB 2019b (MathWorks, Inc., Natick, MA). The SSIM index SSIM(x,y) is a product of similarity between image x and y in luminance (mean intensity) l(x,y), contrast (standard deviation of intensity) c(x,y), and structure (standardized intensity) s(x,y). The mathematical definition of all three terms can be found in reference35. The overall SSIM index is (1)
| (1) |
In this work, we used α=β=γ=1. SSIM indices were computed locally for eachpotential-time pixel to obtain an SSIM matrix. Then, the matrix was element-wise multiplied with a weight matrix emphasizing specific features. The sum of all elements in the product matrix was normalized to get the final SSIM index, which ranges from 0 (no similarity) to 1 (identical image). Each transient reference and sample were normalized to its maximum current before the SSIM calculation. Digital filters were applied to the FSCV color plot for data preprocessing with the following design parameters. A high-pass, second-order Butterworth filter32 with the half-power frequency of 0.03 Hz (for background detrending) or 0.5 Hz (for noise calculation). A Savitzky-Golay filter40 was used for smoothing had a window length of 15.
There were two versions of the SSIM Method (see “Performance Evaluation: Internal Reference vs Standard Library”). The “Internal Reference” version required the input of the start time of six transient adenosine references from a user (see Supplemental Methods), and the primary peak potential to find the peak current was determined from the references. The “Standard Library” version used 15 adenosine references built in the software, and the primary peak potential was determined from the first adenosine event in the data.
Performance Evaluation and Statistics
The SSIM Method was evaluated and optimized by the recall, precision, and F1 score41 based on the number of true positives (TP), false positives (FP), and false negatives (FN) benchmarked against the Borman Method25 with secondary peak correction.42 Adenosine events not picked by the Borman Method were manually checked by human to determine if they were truly adenosine. All data are presented as the mean ± standard deviation (SD) for n number of measurements, except the adenosine event characteristics, which are presented as the mean ± standard error of the mean (SEM) computed from bootstrapping43 for 10,000 times. Statistical analyses were performed in GraphPad 8 (GraphPad Software, La Jolla, CA), and significance was defined at p < 0.05.
Results and Discussion
FSCV of Adenosine
Adenosine undergoes a two-step irreversible oxidation in FSCV (a tertiary oxidation peak for adenosine is possible but rarely observed in vivo).10,44 Fig. 1 shows FSCV of an in vivo spontaneous, transient adenosine event measured in a mouse brain. In the very first CV (time point 1), adenosine oxidation gives a peak of 5 nA at +1.35 V vs Ag/AgCl on the backward scan.10 One second later, at time point 2, the anodic peak current increased to 17 nA and a new anodic peak of 7 nA appeared at +1.2 V on the forward scan. Two seconds after the first CV (point 3), the primary peak has shrunk to 11 nA, and the secondary peak grown to 9 nA. The relationship between primary and secondary anodic peaks of adenosine is visualized by the false color plot (Fig. 1), which illustrates the secondary peak lags behind the primary peak about 0.1–0.3 s, and then stays elevated in current for longer. This time lag creates a rule to help experimenters manually identify the adenosine in vivo from the color plot,11 but the identification of adenosine using a single CV is problematic because the CV shapes within the same transient event are not always the same.
Fig. 1.
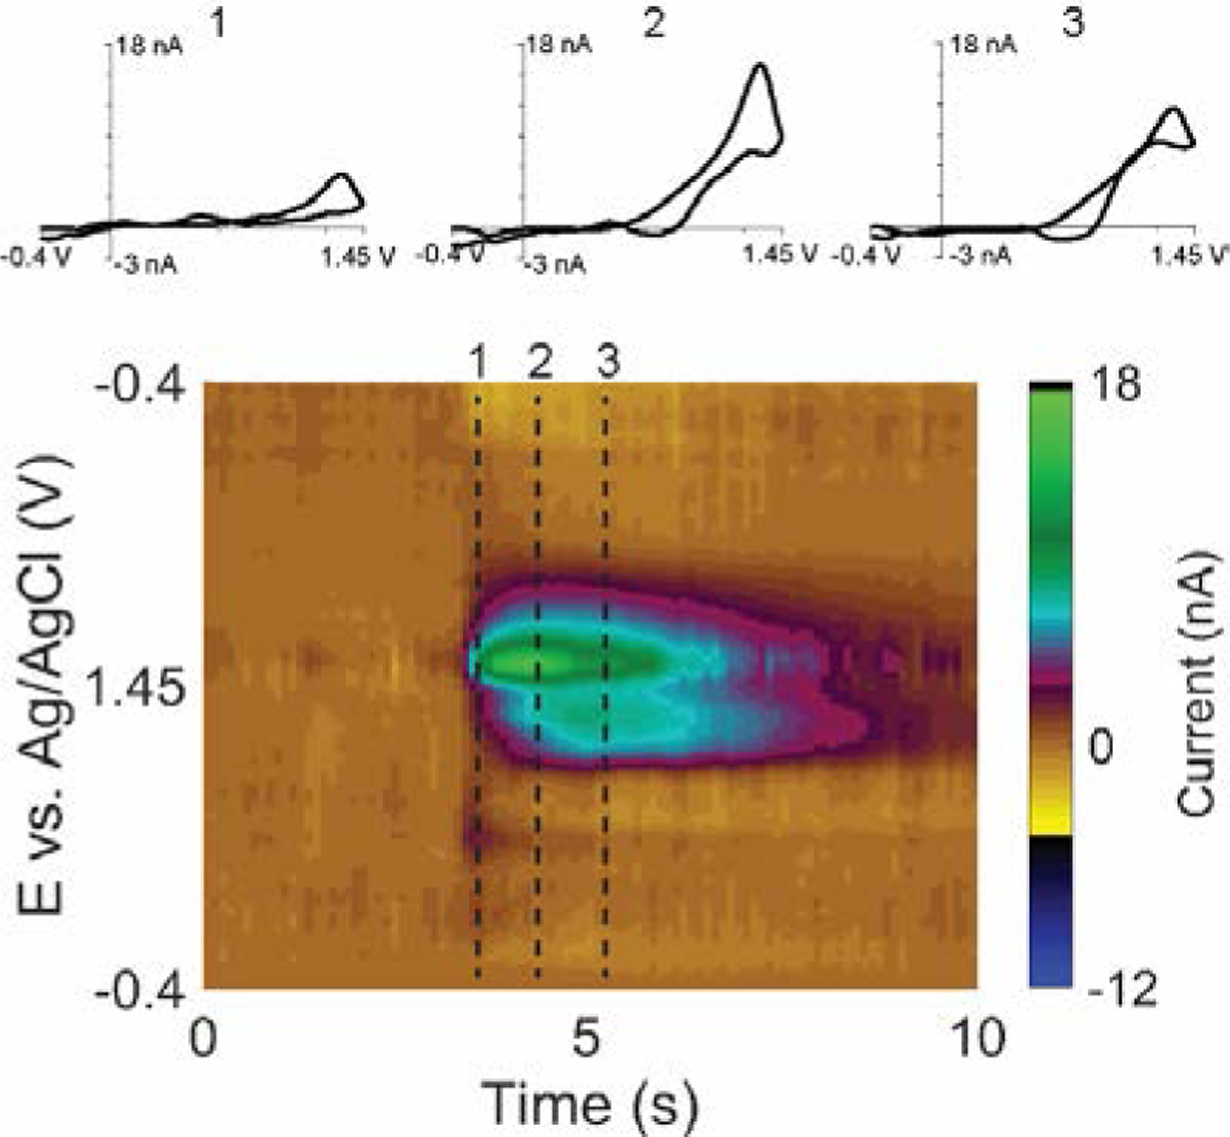
FSCV of in vivo transient adenosine event. Top: CVs of adenosine at different time point after the transient started (1) 0.1 s, (2) 1.1 s, (3) 2.1 s. Bottom: Color plot showing the transient adenosine event.
SSIM Image Analysis for Adenosine
SSIM index is the key method for our new algorithm, termed “SSIM Method”, to detect adenosine from the FSCV color plot data. SSIM index is calculated from the luminance, contrast, and structure similarity between a sample image and a reference image, with the highest index of 1 representing an identical image.35 Hence, this image analysis approach requires standard adenosine references. A weight matrix was introduced to emphasize similarity of specific regions in an image,35 and element-wise multiplication between the matrix and the local SSIM index gave the overall SSIM index. A cutoff score was set to identify the image as adenosine (vide infra).36
Fig. 2 gives examples of adenosine reference events, the weight matrix, and example data for SSIM calculation. To examine adenosine, the normalized color plots for the references and samples were compared using a 1.8-s wide data from potential +0.7 to +1.45 to +0.7 V. This window contains both adenosine anodic peaks, but the amount of data was reduced by half, which shortens the analysis time. The reference event captures the start of the adenosine event because it is important to distinguish the temporal delay between primary and secondary anodic peaks, but the time window does not always include the end of the transient event, as clearance kinetics vary more. Adenosine events vary widely in concentration and duration,14 so different reference events were chosen to span the range of concentrations and durations typically observed. Fig. 2A–C shows three normalized adenosine transient reference events with different peak currents: large (9 nA, Reference A, Fig. 2A), medium (5 nA, Reference B, Fig. 2B), and small (2 nA, Reference C, Fig. 2C). These three references have different lag times and peak durations, leading to different image structures. To improve the selectivity for adenosine, the weight matrix for SSIM calculation (Fig. 2D) has a weight of 1.5 in the primary peak region and weight of 6 in the secondary peak region (Fig. S1 explains the optimization of the weight matrix). The weight for the secondary peak region is higher to prioritize picking events with the secondary peak and therefore rejecting noise or other neurochemicals that have a peak only at the primary anodic potential. To facilitate detecting peaks directly adjacent to each other, the time window was kept narrow at 1.8-s and the weight matrix alleviates the structural difference in the case of multiple adjacent transient events; hence each event is still successfully detected.
Fig. 2.
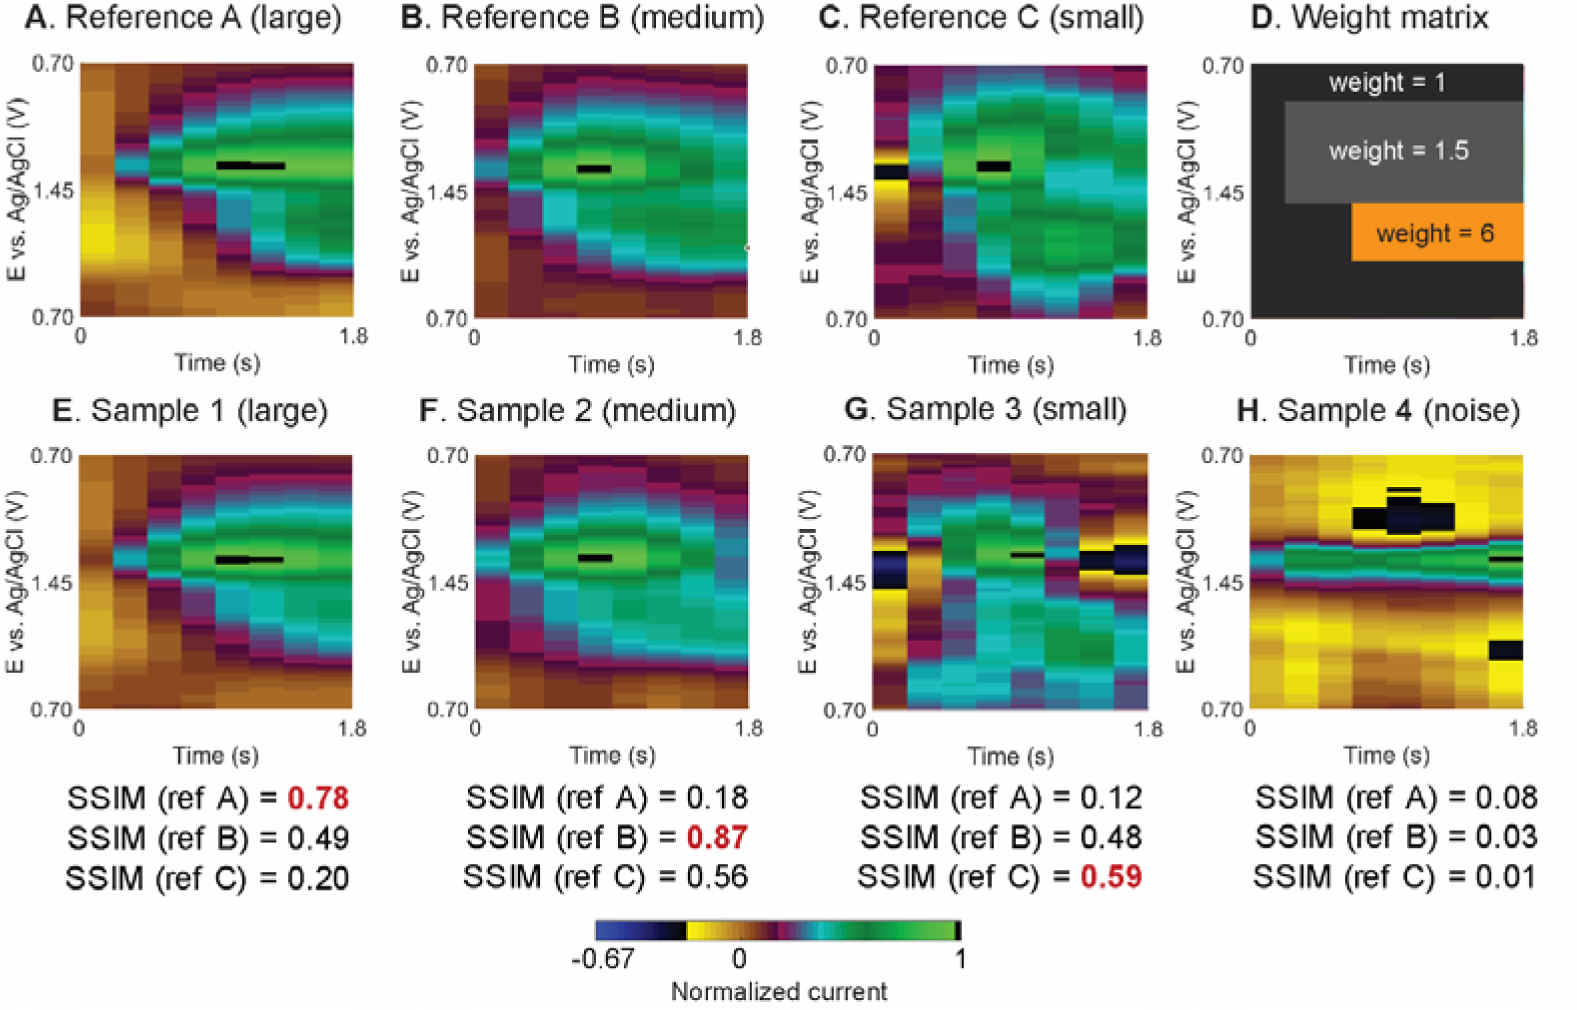
SSIM calculation between in vivo adenosine transient references and sample data. All color plots are zoomed in to the potential of interests and normalized to its maximum current to show the range of signals. False color plots of adenosine references: (A) large (peak current = 9 nA), (B) medium (5 nA), and (C) small (2 nA) adenosine events. (D) Weight matrix emphasizes the secondary peak. False color plots of tested FSCV signal with their SSIM indices respected to the three references: (E) large (13 nA), (F) medium (4 nA), (G) small (0.6 nA) adenosine signals, and (H) noise at the switching potential.
Fig. 2E–H shows four sample windows of data analyzed. For this example, the SSIM index for each sample was calculated compared to each adenosine reference (Fig. 2A–C). Sample 1 (Fig. 2E) is a large adenosine event (13 nA) with SSIM indices of 0.78, 0.49, and 0.20 for Reference A, B, and C, respectively. This adenosine has high peak current and wide peak width, similar to Reference A, so the SSIM score compared Reference A is the highest. Sample 2 (Fig. 2F) is a medium concentration event (4 nA), with lower peak current and duration and so the SSIM index is low for Reference A (0.18), but higher for Reference B (0.87), which has similar current and peak width, and also higher for Reference C (0.56) because of the similar peak shape. Sample 3 (Fig. 2G) is a small adenosine event (0.6 nA) and is the most similar to Reference C which is also small (SSIM index = 0.59). These SSIM calculations demonstrate the need to compare to many adenosine reference events with varied peak currents and durations.
There is frequent noise in FSCV color plots, particularly at the switching potential (where the background current is less stable)45 which is near the peak oxidation for adenosine. Sample 4 (Fig. 2H) is a 1.5-nA noise event near the switching potential that gives a SSIM index much lower (0.08, 0.03, and 0.01, respectively) than for the adenosine events. Our previous Borman algorithm struggled with noise near the switching potential,25 if the noise was broad and there was also noise at the secondary anodic peak potential. With SSIM, the overall structure is taken into account, and thus it is easier to reject an event as possible noise.
Digital Filtering for Background Drift Correction and Data Smoothing
One challenge for the analysis of FSCV continuous data is the background drift, which is caused by changes in pH, other ions, the electrode surface, or stability of the electronics.23,32,33,46 Fig. 3A illustrates 3 min of unsubtracted FSCV data from an in vivo experiment. Traditionally, FSCV data are analyzed from background-subtracted color plot (Fig. 3B) to visualize current changes. However, some signals are concealed by the background drift. In Fig. 3B, from 40-s onward, there is a 4–5 nA background drift, which obscures small adenosine events that have lower peak currents (boxed in Fig. 3B). Our previous Borman algorithm used incremental background subtraction, subtracting the background every 10 s before scanning for adenosine events, but the method was cumbersome because the same trace needed to be analyzed multiple times.25 Here, we adopted the method of DeWaele et al. to eliminate background drift using a high-pass Butterworth filter.32 High-pass filtering removes low frequency background drift while keeping the higher frequency events due to rapid release of neurotransmitter. In addition, we added a smoothing filter, the Savitzy-Golay filter, to remove small current fluctuations that might be wrongly recognized as a peak.40 The color plot in Fig. 3C has high pass and Savitzy-Golay filtering and the background (and drift) at all potentials was eliminated, producing cleaner data that can be directly analyzed. Fig. 3C reveals a small, 2 nA adenosine event that was hidden in the baseline drift before the filtering. An important point is that with high-pass filtering, no background subtraction is needed because the baseline background is a DC signal and thus is filtered out. Fig. S2A plots the current-time trace of the data after high-pass and Savitzky-Golay filtering to illustrate the reduction in noise and baseline detrending. Therefore, data preprocessing by digital filtering eliminates the background drift and noise, allowing more adenosine events to be detected in the FSCV continuous data.
Fig. 3.
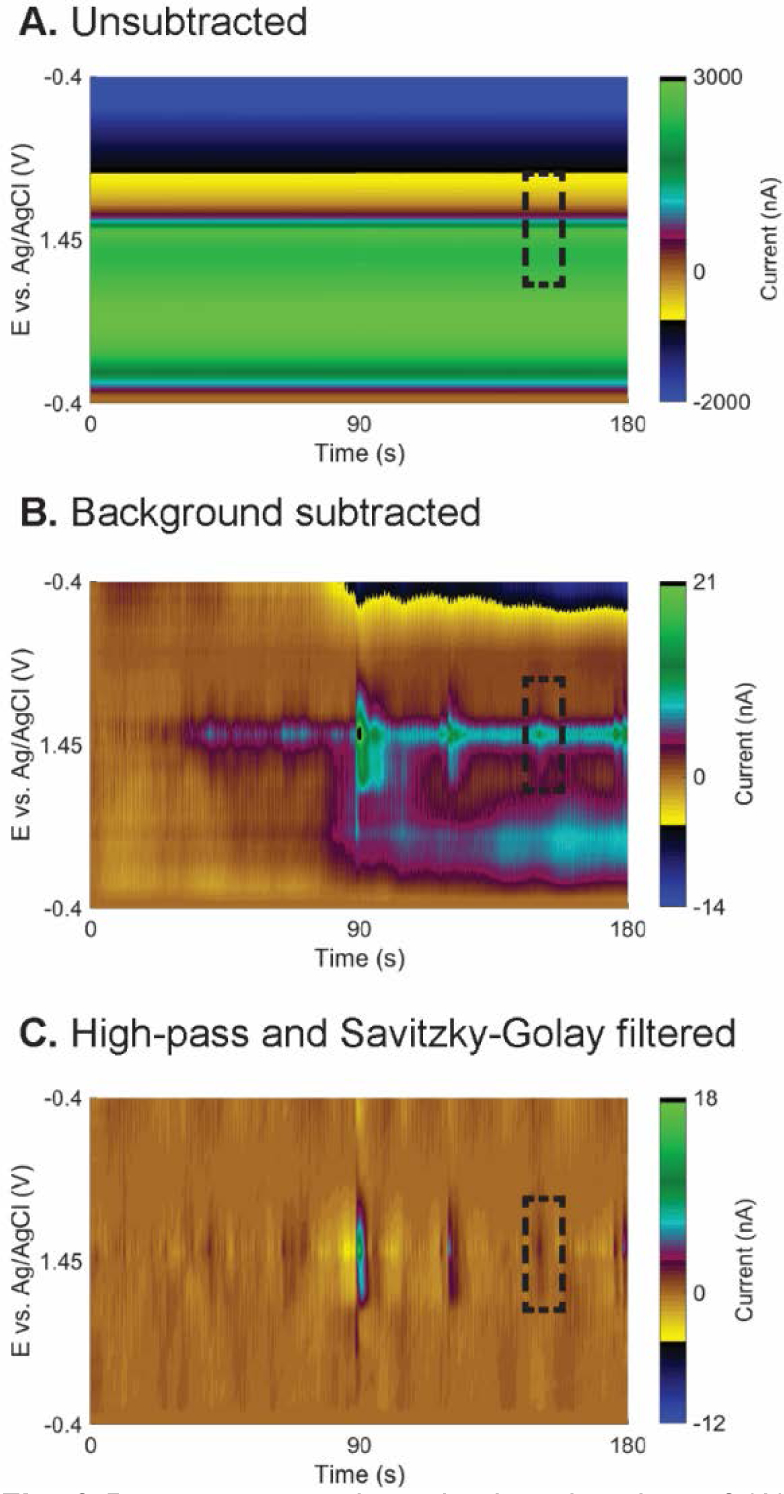
Data preprocessing. 3-min color plots of (A) unsubtracted data, (B) background-subtracted data using t = 0 s as a background, and (C) data after high-pass (0.03 Hz) and Savitzky-Golay filtering. Dashed boxes indicate one small adenosine event hidden in the background drift but observed after filtering.
The SSIM Method Algorithm and Optimization
The new algorithm was tested by analyzing 15 data sets and comparing the results with the Borman method and validation by human users. Fig. 4A summarizes the software algorithm. For each 3 min color plot, the high-pass filter and Savitzky-Golay filter is applied to the data to correct the background drift and smooth the signal. Then, the data is cut into the potential range of +0.7 to +1.45 to +0.7 V, and the pixel resolution in both time and potential axes is decreased by half to speed up the analysis. The SSIM index of each time point is calculated for a 1.8-s window on the color plot to compare the structural similarity with each reference adenosine event, and the window is incrementally shifted by 0.2 s (Example of SSIM index-time trace from different adenosine references are in Fig. S3). After obtaining the SSIM index for all data points in the file, the program records seeding times that give the SSIM index higher than the cutoff.
Fig. 4.
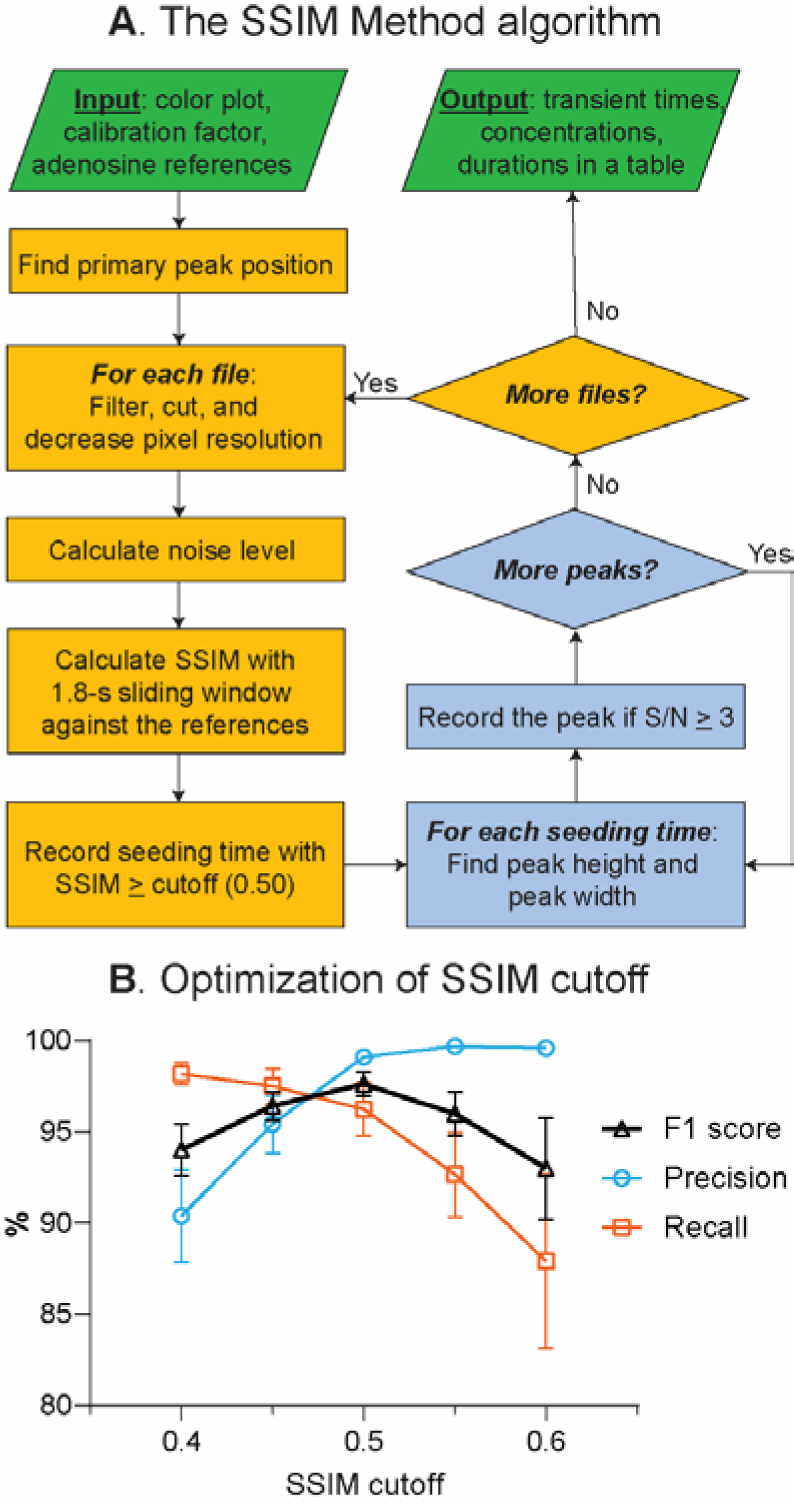
SSIM Method. (A) Algorithm for the detection and characterization of transient adenosine events. (B) Optimization of SSIM cutoff from n = 6 experiments.
Next, peak characterization is performed for each seeding time. The peak current and peak duration, defined as peak width at half-maximum, are determined at every seeding time from the primary peak current-time trace; the peak is confirmed if it has a S/N ≥ 3. The noise is one standard deviation of the current-time trace after being processed by the 0.5-Hz high-pass Butterworth filter and Savitzky-Golay filter (Fig. S2B). If two seeding times are closer together than the peak width, only one peak is counted . The output of the program is a table of adenosine peak positions (in time), peak concentrations, peak durations, and inter-event times in a spreadsheet file (Fig. S4).
The key parameter for the accuracy of the SSIM Method is the cutoff score for SSIM index, which helps balance between false negatives and false positives. To optimize the SSIM cutoff, six datasets were analyzed with different SSIM cutoffs ranging from 0.40 to 0.60, and compared with the Borman method.25 The precision, recall, and F1 scores were evaluated for each cutoff (Fig. 4B). A higher cutoff required a signal to be more similar to the references (high precision), but some noisy adenosine events were not identified (low recall). On the other hand, lower SSIM cutoff picked more events (high recall), but included broad peaks humans did not verify were adenosine (low precision). The combination of both precision and recall is an F1 score, which was maximal at the SSIM cutoff of 0.50, giving 99.1 ± 0.6% precision, 96 ± 4% recall, and 98 ± 2% F1 (n = 6). Hence, this cutoff was used for the rest of the program testing and validation.
Performance Evaluation: Internal Reference vs Standard Library
The SSIM Method was further tested with more datasets to assess the performance and robustness of the SSIM image analysis algorithm. Data from 15 in vivo experiments, 10 from rats and 5 from mice, collected by three different experimenters in four different brain regions were analyzed by both the SSIM Method and Borman Method with secondary peak correction.42 Positive events not picked by the Borman method were checked by human. The first version of the algorithm was termed “Internal Reference” because the user chooses six reference adenosine events from that animal (See Supplemental Methods, and examples shown in Fig. S5), similar to choosing a PCR training set. Because of the similarity in the experimental conditions, a signal in the analyzed data was required to match only one of the six references. Table 1 shows the precision, recall, and F1 scores from the SSIM Method with internal references. The scores were 99.5 ± 0.6% precision, 95 ± 3% recall, and 97 ± 2% F1 (n = 15). In other words, the software gave only 0.5% false positives and 5% false negatives. The scores were also better than the previous Borman method25 because the SSIM algorithm utilized all FSCV information from the color plot and the digital filtering corrected the background drift.
Table 1.
Performance of the SSIM Method
| Species | n | SSIM Method, internal reference | SSIM Method, standard library | ||||
|---|---|---|---|---|---|---|---|
| Precision | Recall | F1 score | Precision | Recall | F1 score | ||
| Rats | 10 | 99.3 ± 0.7 | 96 ± 3 | 98 ± 1 | 99 ± 2 | 95 ± 5 | 97 ± 3 |
| Mice | 5 | 99.9 ± 0.3 | 94 ± 4 | 97 ± 2 | 99.6 ± 0.7 | 89 ± 8 | 94 ± 5 |
| Total | 15 | 99.5 ± 0.6 | 95 ± 3 | 97 ± 2 | 99 ± 1 | 94 ± 7 | 96 ± 4 |
Values shown are mean ± SD.
Alternatively, the second version of the algorithm, called the “Standard Library,” uses a library of adenosine events collected from different experiments. Here, the SSIM calculation is performed between the input data and a library of 15 adenosine events (Fig. S6) collected from 12 experiments in four brain regions (caudate-putamen, prefrontal cortex, hippocampus, basolateral amygdala). More references are needed for this approach because of the greater variation between experimental conditions. With more variation and references, a signal was required to match at least two of the 15 references in order to be identified as adenosine. The SSIM Method using the standard library also yielded high performance scores: 99 ± 1% precision, 94 ± 7% recall, and 96 ± 4 % F1 (n = 15). The difference in performance between two methods were not significant (unpaired t-test, p = 0.347 for precision, p = 0.219 for recall, and p = 0.123 for F1) and the library method is easier because it does not require the user to pick references from the data set. Moreover, the library was tested with data sets from FSCV detection of adenosine in brain slice tissue. Even though the shape of adenosine CVs from brain slice data (Fig. S7) is slightly different from the in vivo library data, the algorithm still performed well with 100% precision, 93% recall, and 96% F1 (n = 52 events from two data sets). A library for brain slice data could also be made in the future.
One important feature of the SSIM Method is the short analysis time. Traditionally, the manual analysis of 4-hour experimental data took 10 to 18 h. The previous Borman Method reduced the analysis time to 40 min.25 In this newly proposed SSIM Method, the analysis time was only 20 min when using the Internal References method and 42 min when using the Standard Library method (longer because it compares the data to more references). Overall, the SSIM Method improved the accuracy and precision of finding adenosine events, while achieving reasonable analysis times.
Performance Evaluation: Adenosine Event Characteristics
Adenosine event characteristics were also compared from the SSIM Method and Borman Method with secondary peak correction.42 Table 2 shows the pooled total of the adenosine events found in the 10 rat datasets (3 caudate-putamen, 3 basolateral amygdala, 2 hippocampus, and 2 prefrontal cortex) and 5 mice datasets (2 caudate-putamen, 2 hippocampus, and 1 prefrontal cortex. Results for the separate datasets can be found in Table S1). The Borman method identified 1,470 events while the SSIM Method identified 2,826 events for the internal reference version and 2,494 for the standard library method. There was a significant main effect of the algorithm on the number of events (one-way ANOVA, p < 0.0001, n = 15), and the number of events from the SSIM Method was significantly higher than the Borman Method (Bonferroni post-test, p < 0.0001 for both internal references and standard library methods). Nevertheless, the numbers of events between two methods of the SSIM Method were not significantly different (p = 0.126), illustrating that both approaches can be used interchangeably without affecting the data analysis. More events were identified by the SSIM Method because digital filtering allowed identification adenosine events hidden by the background drift and image analysis took advantage of the unique image of adenosine to identify it from other signals and noise.
Table 2.
Results from the SSIM Method using internal references and standard library, compared to the Borman Method with secondary peak correction (Separate results for each experiment in Table S1).
| Species | n | Method | Number of events | Peak concentration (μM) | Peak duration (s) | Inter-event time (s) |
|---|---|---|---|---|---|---|
| Rats | 10 | Borman | 870 | 0.146 ± 0.005 | 1.7 ± 0.1 | 78.5 ± 4.9 |
| SSIM, internal reference | 1,807 | 0.102 ± 0.003 | 1.4 ± 0.1 | 39.2 ± 1.3 | ||
| SSIM, standard library | 1,627 | 0.106 ± 0.003 | 1.4 ± 0.1 | 43.3 ± 1.4 | ||
| Mice | 5 | Borman | 600 | 0.085 ± 0.003 | 1.6 ± 0.1 | 53.6 ± 2.7 |
| SSIM, internal reference | 1,019 | 0.067 ± 0.002 | 1.4 ± 0.1 | 31.6 ± 1.3 | ||
| SSIM, standard library | 867 | 0.069 ± 0.003 | 1.4 ± 0.1 | 37.1 ± 1.6 |
Values shown are mean ± SEM.
SEM = one standard deviation of the bootstrapped mean, resampled 10,000 times.
Table 2 also shows the average peak characteristics from both methods. The average peak concentration, peak duration, and inter-event time from the SSIM Method were lower than the Borman Method. Statistical comparisons are best done on the distributions (Fig. 5 for rats, Fig. S8 for similar data on mice) and the peak concentration distribution between the Borman and SSIM Methods were significantly different (K-S test, p < 0.0001 for both internal reference and standard library). The LOD for the Borman method is 40 nM (Fig. 5A),25 but the SSIM Method can pick events down to 15 nM (see example in Fig. S9). Thus, the lower LOD shifted the histograms and means to lower concentrations. The concentration distribution between the internal reference and standard library methods of SSIM Method was not significantly different (p = 0.305). Similarly, the peak durations were also significantly different between the Borman and SSIM Methods (Fig. 5B, 5E, 5H, and Fig. S8B, S8E, S8H, p < 0.0001 for both rats and mice datasets), but not between two versions of the SSIM Method (p = 0.624 for rats datasets and p = 0.934 for mice datasets). Smaller concentration peaks typically have smaller durations, so the duration distribution shifts left for the SSIM method. For the inter-event time (Fig. 5C, 5F, 5I, and S8C, S8F, S8I), the SSIM Method identified more events, so the inter-event times were shorter than those from the Borman Method (p < 0.0001). The SSIM Method with internal references identified slightly more adenosine events than with the standard library, so the distribution between them was significantly different (p < 0.05). SSIM Method is better at identifying smaller concentration events, which shifts the distributions.
Fig. 5.
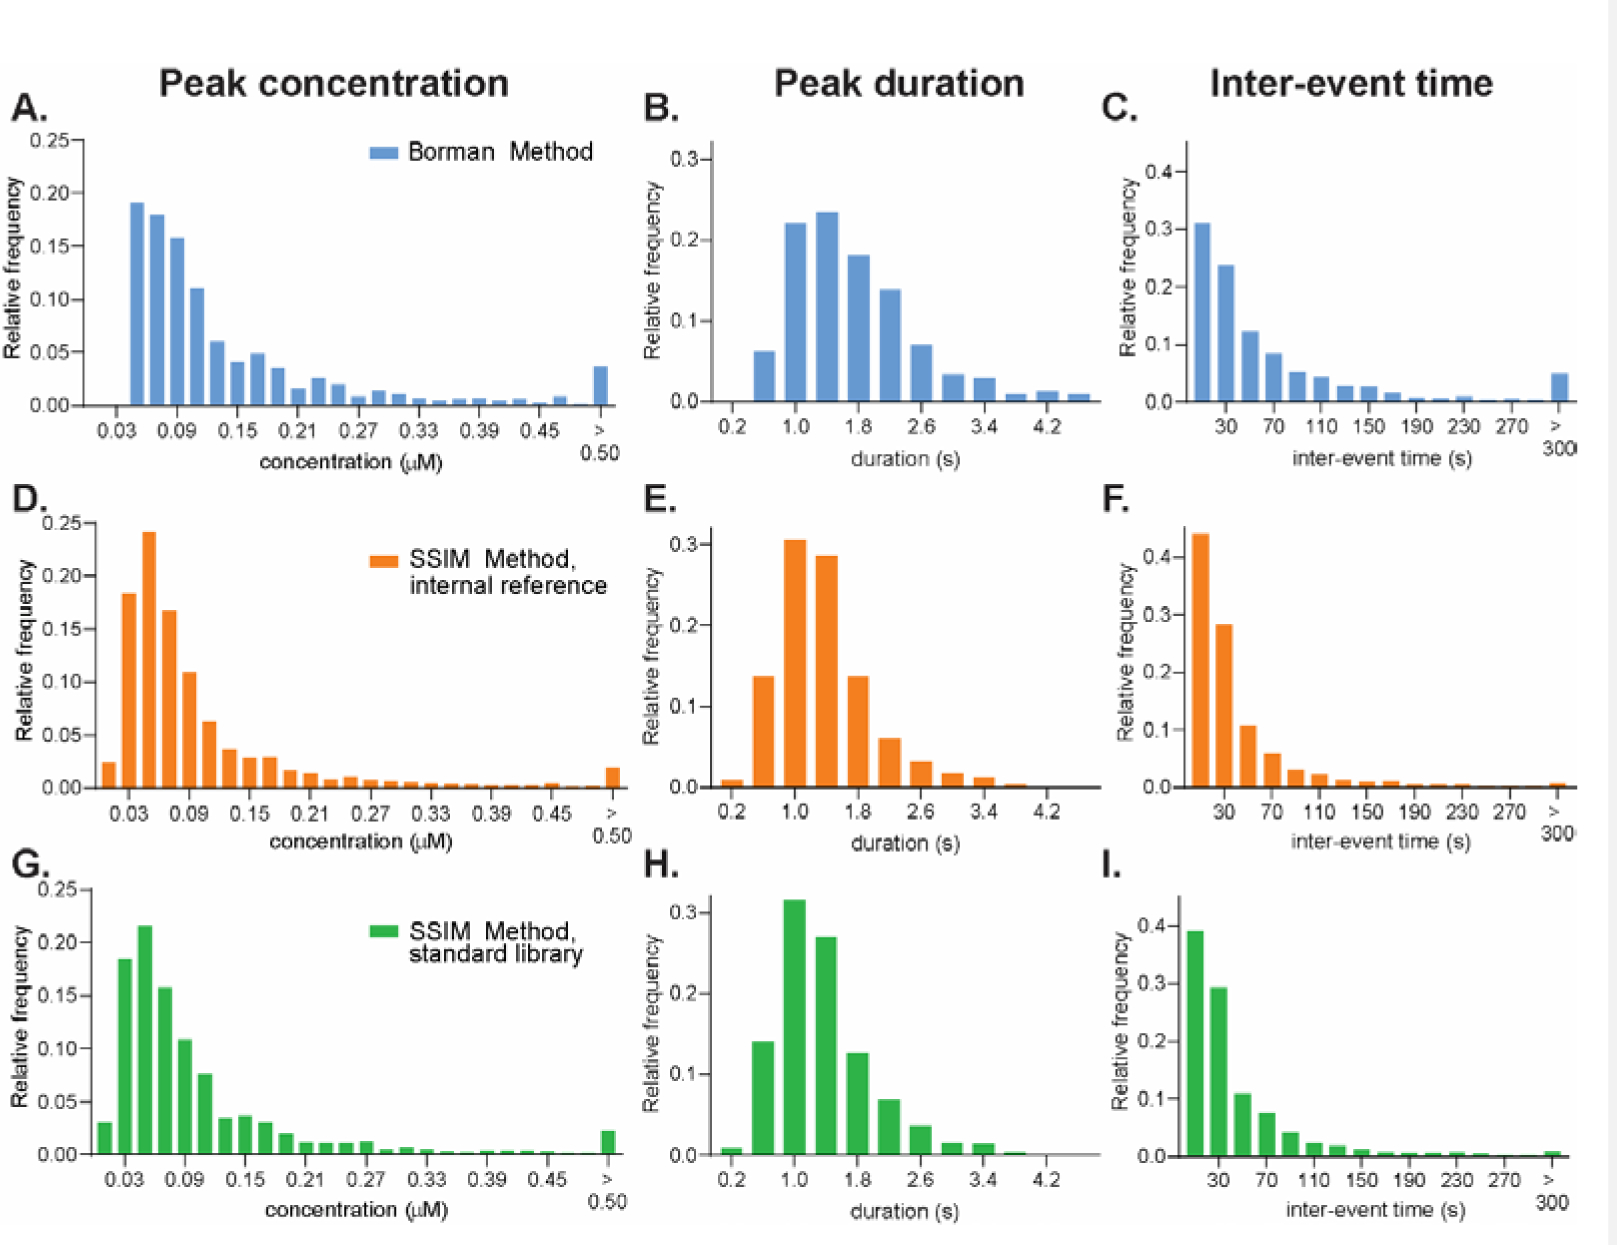
Comparison of the adenosine characteristics between the Borman and SSIM Methods. Histogram of adenosine characteristics from ten, 2-hour rat datasets. (A, D, G) peak concentration (bin width = 0.020 μM), (B, E, H) peak duration (bin width = 0.4 s) and (C, F, I) inter-event time (bin width = 20 s). (A, B, C) Borman Method with secondary peak correction (870 events), (D, E, F) SSIM Method with internal references (1,807 events), and (G, H, I) SSIM Method using standard library (1,627 events).
Testing Chemical Selectivity In Vitro
The SSIM image analysis was also tested for its robustness with other electroactive neurotransmitters and pH shifts. Fig. 6 shows example in vitro FSCV color plot of 1 μM adenosine, compared with other high-oxidation potential compounds, including 50 μM H2O2, 1 μM histamine, and 1 μM ATP. H2O2 is a reactive oxygen species important for signal transduction and has an oxidation potential of +1.2 V on the backward scan (Fig. 6B),12 but its SSIM index was low (0.14 ± 0.05, n = 15) because there is no secondary anodic peak. Histamine, a molecule which is important in immune systems and regulates sleep, also has an anodic peak at +1.2 V on the backward scan but with extra secondary, fouling, and adsorption peaks (Fig. 6C).31 These extra features altered the image and considerably decreased the index (SSIM = 0.11 ± 0.05, n = 15). On the other hand, ATP has the same redox moiety and undergoes the same oxidation mechanism as adenosine,30,47 so its color plot (Fig. 6D) was more similar to that of adenosine (Fig. 6A) and the score was moderate (SSIM = 0.52 ± 0.16). Nevertheless, given that the measured SSIM of adenosine in vivo (0.50 cutoff) is less than measured in vitro (lowest 0.80, Fig. S10) by 0.30, the SSIM index of ATP in vivo is also likely lower than the in vitro value and would not pass the cutoff. The SSIM calculation was also performed with the signal from a pH shift (Fig. 6E–F), as changing the pH and ionic environment on the electrode surface alters the background CV.23,33 SSIM scores were low for both acidic shift to pH 7.3 (Fig. 6E, SSIM = 0.08 ± 0.04) and basic shift to pH 7.5 (Fig. 6F, SSIM = 0.08 ± 0.04) because of the different image structure. In contrast, the SSIM of adenosine with pH change, or with lower concentrations, or in mixtures were all higher than 0.70 (Fig. S10). This experiment shows that the SSIM image analysis successfully detects adenosine in a slightly different environment and rejects other electroactive species with different FSCV signals. Future studies may investigate the optimization of the weight matrix for SSIM calculation to better distinguish the electroactive neurotransmitters with similar structure.
Fig. 6.
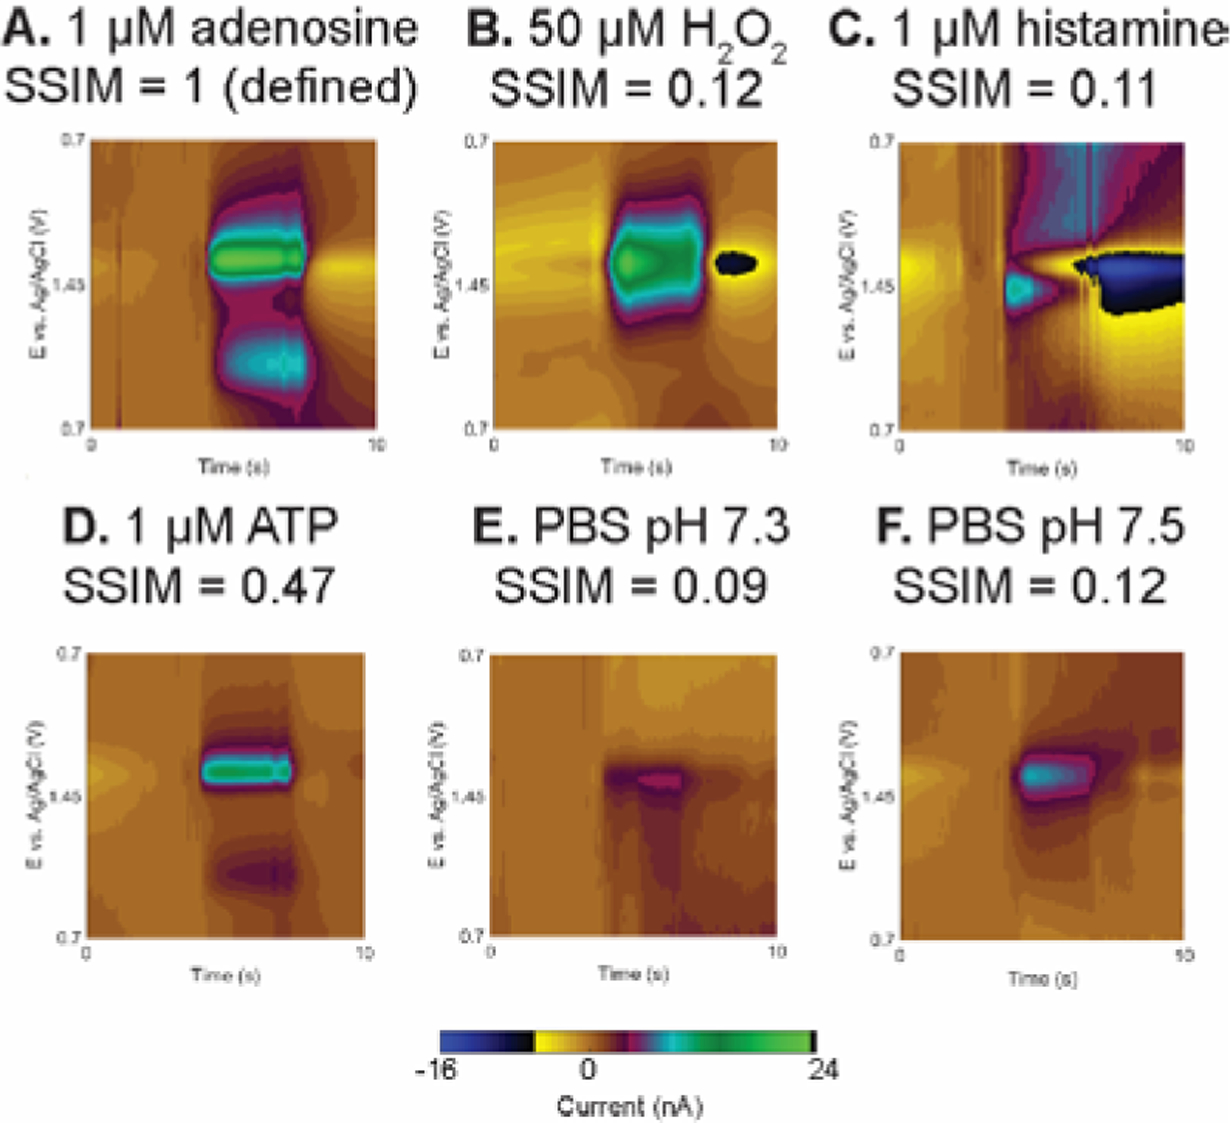
SSIM index of possible interferents. The analyzed portion of the color plot, from +0.7 to +1.45 V, with SSIM index for (A) 1 μM adenosine, (B) 50 μM H2O2, (C) 1 μM histamine, (D) 1 μM ATP, (E) PBS pH 7.3, and (F) PBS pH 7.5. Each solution was injected for 3 s followed by PBS pH 7.4 washing. All solutions were prepared in PBS pH 7.4 buffer except indicated. Each color plot was normalized, smoothed, and high pass filtered before SSIM calculation.
Generalization of SSIM Image Analysis: Co-Detection of Adenosine and Dopamine
To examine the adaptability to detect other neurochemicals, the SSIM algorithm was modified to detect dopamine, specifically detection of spontaneous co-release of adenosine and dopamine in the caudate-putamen (Example full color plot data are in Fig. S11). Adenosine acts a neuromodulator of dopamine,11,48–50 so understanding co-release is important to understand adenosine neuromodulation. Co-detection of dopamine and adenosine was performed by simply running the algorithm twice, the first round using adenosine references for adenosine detection and the second round using dopamine references for dopamine detection, since the redox reactions occur at different potentials. Thus, relative displacement in time between the two signals is not considered. Fig. 7 shows example reference images of dopamine and adenosine (Fig. 7A–B) and a weight matrix for detecting dopamine (Fig. 7C), which illustrates that different potential ranges are used for adenosine and dopamine analysis. The dopamine weight matrix has a value of one near the oxidation and reduction peaks and zero in the middle of the color plot to ignore the existence of adenosine. The SSIM calculation was performed with the events in Fig. 7D–H with a SSIM cutoff score was 0.50. Samples 5, 6, and 7 (Fig. 7D–F) have both dopamine and adenosine events with different dopamine concentrations (90, 50, and 95 nM, respectively). The SSIM indices for both samples are higher than 0.50 compared with one of the references. On the other hand, Sample 8 and 9 (Fig. 7G–H) are adenosine events without dopamine, and they have low SSIM scores and thus are rejected by the software as dopamine. Nevertheless, all samples (Fig. 7D–H) passed the SSIM cutoff for adenosine detection using the standard library in Fig. S6, illustrating that the presence of dopamine did not interfere the adenosine recognition because different potential ranges were used for the SSIM calculation. Future work can customize the analysis for other neurochemicals, but the SSIM image analysis is versatile for automated recognition of two neurochemicals from FSCV color plots.
Fig. 7.
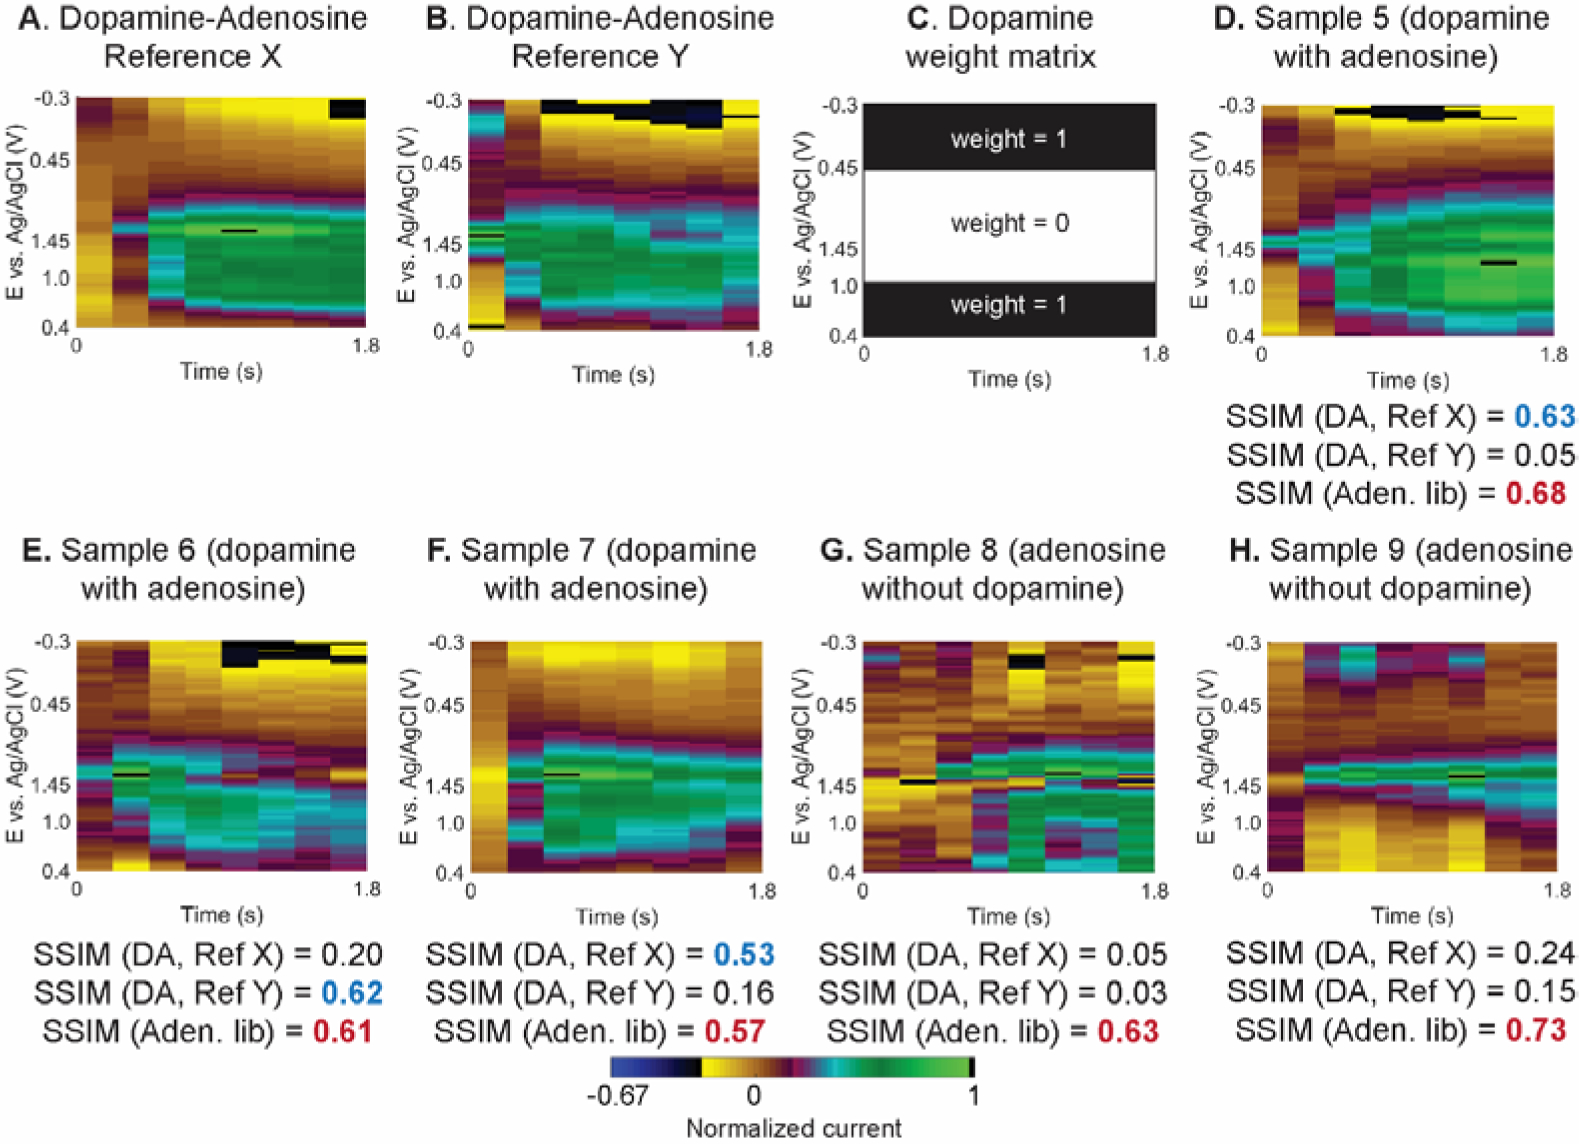
Detection of spontaneous dopamine events that were co-released with adenosine. (A-B) False color plot of two references X and Y with adenosine and dopamine present. (C) Weight matrix for dopamine that ignores adenosine signal from the calculation. (D-F) False color plots of events with dopamine and adenosine, and (G-H) adenosine without dopamine. Reported SSIM indices are for two dopamine references (DA, Ref X and Y) and the adenosine standard library (Aden. lib). The peak CVs of all data can be found in Fig. S12.
Conclusions
SSIM image analysis was utilized for the first time to design an automated algorithm to detect and neurochemical events from an FSCV color plot. We applied this SSIM analysis to adenosine first, because it has a tricky CV that changes shape over time, and thus traditional methods such as PCR fail to detect it well. The algorithm compared the image structure of sample data with adenosine references, either internally selected from the same experiment or externally built as a standard library. Combined with digital filtering to remove background drift, the SSIM algorithm identified more adenosine events than the previous algorithm, especially smaller events. The new algorithm also reduced analysis time and had better performance, less than 1% false positive and 5% false negative, because the whole current-potential-time data for adenosine was utilized instead of a single current-time trace. The algorithm was robust and rejected signals from pH shift and other chemical interferents. Finally, to show that this is a general strategy, not limited to adenosine detection, the SSIM algorithm was used to detect dopamine. SSIM successfully detects dopamine in the presence of adenosine and adenosine in the presence of dopamine, a major advancement over techniques based on CVs. In summary, SSIM is a general strategy for FSCV data analysis that uses three-dimensional data to detect multiple analytes in an efficient, automated analysis. SSIM image analysis can be applied to many other neurotransmitters, and even other types of three-dimensional data in analytical chemistry.
Supplementary Material
Acknowledgments
This research is supported by the National Institute of Health (NIH) grants R01 EB026497 and R01 MH085159.
Footnotes
Program Code
All MATLAB codes for the SSIM Method and the user manual are available at https://github.com/maxchem6/imgADanalysis.
Supporting Information
Supplemental methods include animal methods and noise level calculation, precision/recall analysis, and bootstrapping statistics. Supplemental figures include example adenosine references and samples, weight optimization, data before and after digital filtering, example SSIM-time trace, example output spreadsheet, example internal references, adenosine standard library, example brain slice tissue data, adenosine event characteristics in mice, example small adenosine event, in vitro data, and co-release of dopamine and adenosine color plots and CVs. Supplementary table includes result for separated experiment.
References
- (1).Armstrong-James M; Millar J; Kruk L Quantification of Noradrenaline Iontophoresis. Nature 1980, 288, 181–183. [DOI] [PubMed] [Google Scholar]
- (2).Venton BJ; Cao Q Fundamentals of Fast-Scan Cyclic Voltammetry for Dopamine Detection. Analyst 2020, 145, 1158–1168. [DOI] [PMC free article] [PubMed] [Google Scholar]
- (3).Puthongkham P; Venton BJ Recent Advances in Fast-Scan Cyclic Voltammetry. Analyst 2020, 145, 1087–1102. [DOI] [PMC free article] [PubMed] [Google Scholar]
- (4).Venton BJ; Wightman RM Psychoanalytical Electrochemistry: Dopamine and Behavior. Anal. Chem 2003, 75 (19), 414A–421A. [Google Scholar]
- (5).Johnson JA; Wightman RM Cyclic Voltammetric Measurements of Neurotransmitters. Electrochem. Soc. Interface 2018, 26, 53–57. [Google Scholar]
- (6).Willuhn I; Burgeno LM; Groblewski PA; Phillips PEM Excessive Cocaine Use Results from Decreased Phasic Dopamine Signaling in the Striatum. Nat. Neurosci 2014, 17 (5), 704–709. [DOI] [PMC free article] [PubMed] [Google Scholar]
- (7).Robinson DL; Hermans A; Seipel AT; Wightman RM Monitoring Rapid Chemical Communication in the Brain. Chem. Rev 2008, 108, 2554–2584. [DOI] [PMC free article] [PubMed] [Google Scholar]
- (8).Jackson BP; Dietz SM; Wightman RM Fast-Scan Cyclic Voltammetry of 5-Hydroxytryptamine. Anal. Chem 1995, 67 (6), 1115–1120. [DOI] [PubMed] [Google Scholar]
- (9).Hashemi P; Dankoski EC; Petrovic J; Keithley RB; Wightman RM Voltammetric Detection of 5-Hydroxytryptamine Release in the Rat Brain. Anal. Chem 2009, 81 (22), 9462–9471. [DOI] [PMC free article] [PubMed] [Google Scholar]
- (10).Swamy BEK; Venton BJ Subsecond Detection of Physiological Adenosine Concentrations Using Fast-Scan Cyclic Voltammetry. Anal. Chem 2007, 79 (2), 744–750. [DOI] [PubMed] [Google Scholar]
- (11).Nguyen MD; Venton BJ Fast-Scan Cyclic Voltammetry for the Characterization of Rapid Adenosine Release. Comput. Struct. Biotechnol. J 2015, 13, 47–54. [DOI] [PMC free article] [PubMed] [Google Scholar]
- (12).Sanford AL; Morton SW; Whitehouse KL; Oara HM; Lugo-Morales LZ; Roberts JG; Sombers LA Voltammetric Detection of Hydrogen Peroxide at Carbon Fiber Microelectrodes. Anal. Chem 2010, 82 (12), 5205–5210. [DOI] [PMC free article] [PubMed] [Google Scholar]
- (13).Spanos M; Gras-Najjar J; Letchworth JM; Sanford AL; Toups JV; Sombers LA Quantitation of Hydrogen Peroxide Fluctuations and Their Modulation of Dopamine Dynamics in the Rat Dorsal Striatum Using Fast-Scan Cyclic Voltammetry. ACS Chem. Neurosci 2013, 4 (5), 782–789. [DOI] [PMC free article] [PubMed] [Google Scholar]
- (14).Nguyen MD; Lee ST; Ross AE; Ryals M; Choudhry VI; Venton BJ Characterization of Spontaneous, Transient Adenosine Release in the Caudate-Putamen and Prefrontal Cortex. PLoS One 2014, 9 (1), e87165. [DOI] [PMC free article] [PubMed] [Google Scholar]
- (15).Dankoski EC; Mark Wightman R Monitoring Serotonin Signaling on a Subsecond Time Scale. Front. Integr. Neurosci 2013, 7 (MAY), 1–13. [DOI] [PMC free article] [PubMed] [Google Scholar]
- (16).Roberts JG; Sombers LA Fast-Scan Cyclic Voltammetry: Chemical Sensing in the Brain and Beyond. Anal. Chem 2018, 90 (1), 490–504. [DOI] [PMC free article] [PubMed] [Google Scholar]
- (17).Ganesana M; Lee ST; Wang Y; Venton BJ Analytical Techniques in Neuroscience: Recent Advances in Imaging, Separation, and Electrochemical Methods. Anal. Chem 2017, 89 (1), 314–341. [DOI] [PMC free article] [PubMed] [Google Scholar]
- (18).Hersey M; Berger SN; Holmes J; West A; Hashemi P Recent Developments in Carbon Sensors for At-Source Electroanalysis. Anal. Chem 2019, 91 (1), 27–43. [DOI] [PubMed] [Google Scholar]
- (19).Kile BM; Walsh PL; McElligott ZA; Bucher ES; Guillot TS; Salahpour A; Caron MG; Wightman RM Optimizing the Temporal Resolution of Fast-Scan Cyclic Voltammetry. ACS Chem. Neurosci 2012, 3 (4), 285–292. [DOI] [PMC free article] [PubMed] [Google Scholar]
- (20).Michael D; Travis ER; Wightman RM Color Images for Fast-Scan CV Measurements in Biological Systems. Anal. Chem 1998, 70 (17), 586A–592A. [DOI] [PubMed] [Google Scholar]
- (21).Heien MLAV; Johnson MA; Wightman RM Resolving Neurotransmitters Detected by Fast-Scan Cyclic Voltammetry. Anal. Chem 2004, 76 (19), 5697–5704. [DOI] [PubMed] [Google Scholar]
- (22).Keithley RB; Heien MLAV; Wightman RM Multivariate Concentration Determination Using Principal Component Regression with Residual Analysis. TrAC, Trends Anal. Chem 2009, 28 (9), 1127–1136. [DOI] [PMC free article] [PubMed] [Google Scholar]
- (23).Meunier CJ; McCarty GS; Sombers LA Drift Subtraction for FSCV Using Double-Waveform Partial-Least-Squares Regression. Anal. Chem 2019, 91, 7319–7327. [DOI] [PMC free article] [PubMed] [Google Scholar]
- (24).Bucher ES; Brooks K; Verber MD; Keithley RB; Owesson-White C; Carroll S; Takmakov P; McKinney CJ; Wightman RM Flexible Software Platform for Fast-Scan Cyclic Voltammetry Data Acquisition and Analysis. Anal. Chem 2013, 85 (21), 10344–10353. [DOI] [PMC free article] [PubMed] [Google Scholar]
- (25).Borman RP; Wang Y; Nguyen MD; Ganesana M; Lee ST; Venton BJ Automated Algorithm for Detection of Transient Adenosine Release. ACS Chem. Neurosci 2017, 8 (2), 386–393. [DOI] [PMC free article] [PubMed] [Google Scholar]
- (26).Cechova S; Venton BJ Transient Adenosine Efflux in the Rat Caudate-Putamen. J. Neurochem 2008, 105 (4), 1253–1263. [DOI] [PubMed] [Google Scholar]
- (27).Burnstock G Purinergic Signaling in the Cardiovascular System. Circ. Res 2017, 120 (1), 207–228. [DOI] [PubMed] [Google Scholar]
- (28).Ganesana M; Venton BJ Early Changes in Transient Adenosine during Cerebral Ischemia and Reperfusion Injury. PLoS One 2018, 13 (5), e0196932. [DOI] [PMC free article] [PubMed] [Google Scholar]
- (29).Lee ST; Venton BJ Regional Variations of Spontaneous, Transient Adenosine Release in Brain Slices. ACS Chem. Neurosci 2018, 9 (3), 505–513. [DOI] [PMC free article] [PubMed] [Google Scholar]
- (30).Ross AE; Venton BJ Sawhorse Waveform Voltammetry for Selective Detection of Adenosine, ATP, and Hydrogen Peroxide. Anal. Chem 2014, 86 (15), 7486–7493. [DOI] [PMC free article] [PubMed] [Google Scholar]
- (31).Puthongkham P; Lee ST; Venton BJ Mechanism of Histamine Oxidation and Electropolymerization at Carbon Electrodes. Anal. Chem 2019, 91, 8366–8373. [DOI] [PMC free article] [PubMed] [Google Scholar]
- (32).DeWaele M; Oh Y; Park C; Kang YM; Shin H; Blaha C; Bennet KE; Kim IY; Lee KH; Jang DP Baseline Drift Detrending Techniques for Fast Scan Cyclic Voltammetry. Analyst 2017, 142, 4317–4321. [DOI] [PMC free article] [PubMed] [Google Scholar]
- (33).Johnson JA; Hobbs CN; Wightman RM Removal of Differential Capacitive Interferences in Fast-Scan Cyclic Voltammetry. Anal. Chem 2017, 89 (11), 6166–6174. [DOI] [PMC free article] [PubMed] [Google Scholar]
- (34).Ekelöf M; Garrard KP; Judd R; Rosen EP; Xie DY; Kashuba ADM; Muddiman DC Evaluation of Digital Image Recognition Methods for Mass Spectrometry Imaging Data Analysis. J. Am. Soc. Mass Spectrom 2018, 29 (12), 2467–2470. [DOI] [PMC free article] [PubMed] [Google Scholar]
- (35).Wang Z; Bovik AC; Sheikh HR; Simoncelli EP Image Quality Assessment: From Error Visibility to Structural Similarity. IEEE Trans. Image Process 2004, 13 (4), 600–612. [DOI] [PubMed] [Google Scholar]
- (36).Rehman A; Gao Y; Wang J; Wang Z Image Classification Based on Complex Wavelet Structural Similarity. Signal Process. Image Commun 2013, 28 (8), 984–992. [Google Scholar]
- (37).Casti P; Mencattini A; Salmeri M; Rangayyan RM Analysis of Structural Similarity in Mammograms for Detection of Bilateral Asymmetry. IEEE Trans. Med. Imaging 2015, 34 (2), 662–671. [DOI] [PubMed] [Google Scholar]
- (38).Shahriari Y; Fidler R; Pelter MM; Bai Y; Villaroman A; Hu X Electrocardiogram Signal Quality Assessment Based on Structural Image Similarity Metric. IEEE Trans. Biomed. Eng 2018, 65 (4), 748–753. [DOI] [PMC free article] [PubMed] [Google Scholar]
- (39).Huffman ML; Venton BJ Electrochemical Properties of Different Carbon-Fiber Microelectrodes Using Fast-Scan Cyclic Voltammetry. Electroanalysis 2008, 20 (22), 2422–2428. [Google Scholar]
- (40).Savitzky A; Golay MJE Smoothing and Differentiation of Data by Simplified Least Squares Procedures. Anal. Chem 1964, 36 (8), 1627–1639. [Google Scholar]
- (41).Huang YJ; Powers R; Montelione GT Protein NMR Recall, Precision, and F-Measure Scores (RPF Scores): Structure Quality Assessment Measures Based on Information Retrieval Statistics. J. Am. Chem. Soc 2005, 127 (6), 1665–1674. [DOI] [PubMed] [Google Scholar]
- (42).Borgus JR; Puthongkham P; Venton BJ Complex Sex and Estrous Cycle Differences in Spontaneous Transient Adenosine. J. Neurochem 2020. [DOI] [PMC free article] [PubMed]
- (43).Efron B; Tibshirani RJ An Introduction to the Bootstrap, 1st ed.; Chapman & Hall, Inc.: New York, 1993. [Google Scholar]
- (44).Dryhurst G; Elving PJ Electrochemical Oxidation of Adenine: Reaction Products and Mechanisms. J. Electrochem. Soc 1968, 115 (10), 1014. [Google Scholar]
- (45).Michael DJ; Joseph JD; Kilpatrick MR; Travis ER; Wightman RM Improving Data Acquisition for Fast-Scan Cyclic Voltammetry. Anal. Chem 1999, 71 (18), 3941–3947. [DOI] [PubMed] [Google Scholar]
- (46).Takmakov P; Zachek MK; Keithley RB; Walsh PL; Donley C; McCarty GS; Wightman RM Carbon Microelectrodes with a Renewable Surface. Anal. Chem 2010, 82 (5), 2020–2028. [DOI] [PMC free article] [PubMed] [Google Scholar]
- (47).Xu Y; Venton BJ Microelectrode Sensing of Adenosine/Adenosine-5’-Triphosphate with Fast-Scan Cyclic Voltammetry. Electroanalysis 2010, 22 (11), 1167–1174. [Google Scholar]
- (48).Pajski ML; Venton BJ Adenosine Release Evoked by Short Electrical Stimulations in Striatal Brain Slices Is Primarily Activity Dependent. ACS Chem. Neurosci 2010, 1 (12), 775–787. [DOI] [PMC free article] [PubMed] [Google Scholar]
- (49).Ross AE; Venton BJ Adenosine Transiently Modulates Stimulated Dopamine Release in the Caudate-Putamen via A1 Receptors. J. Neurochem 2015, 132 (1), 51–60. [DOI] [PMC free article] [PubMed] [Google Scholar]
- (50).Quarta D; Borycz J; Solinas M; Patkar K; Hockemeyer J; Ciruela F; Lluis C; Franco R; Woods AS; Goldberg SR; et al. Adenosine Receptor-Mediated Modulation of Dopamine Release in the Nucleus Accumbens Depends on Glutamate Neurotransmission and N-Methyl-D-Aspartate Receptor Stimulation. J. Neurochem 2004, 91 (4), 873–880. [DOI] [PubMed] [Google Scholar]
Associated Data
This section collects any data citations, data availability statements, or supplementary materials included in this article.


