

Abstract
Although N-shaped fast scan cyclic voltammetry (N-FSCV) is well-established as an electroanalytical method to measure extracellular serotonin concentrations in vivo, it is in need of improvement in both sensitivity and selectivity. Based on our previous studies using fast cyclic square-wave voltammetry (FCSWV) for in vivo dopamine measurements, we have modified this technique to optimize the detection of serotonin in vivo. A series of large amplitude square-shaped potentials was superimposed onto an N-shaped waveform to provide cycling through multiple redox reactions within the N-shaped waveform to enhance the sensitivity and selectivity to serotonin measurement when combined with a two-dimensional voltammogram. N-Shaped fast cyclic square-wave voltammetry (N-FCSWV) showed significantly higher sensitivity to serotonin compared to conventional N-FSCV. In addition, N-FCSWV showed better performance than conventional N-shaped FSCV in differentiating serotonin from its major interferents, dopamine and 5-hydroxyindoleascetic acid (5-HIAA). It was also confirmed that the large amplitude of the square waveform did not influence local neuronal activity, and it could monitor electrical stimulation evoked phasic release of serotonin in the rat substantia nigra pars reticulata (SNr) before and after systemic injection of escitalopram (ESCIT, 10 mg/kg i.p.), a serotonin selective reuptake inhibitor.
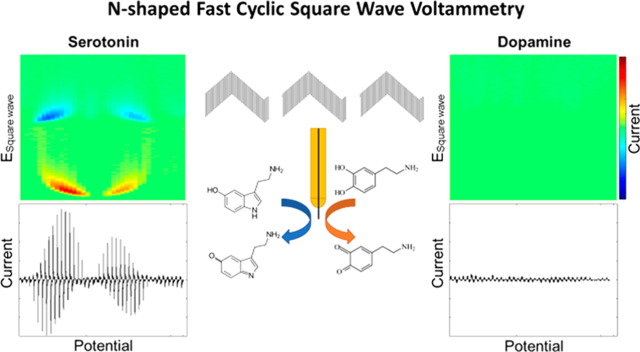
Graphical Abstract
INTRODUCTION
Serotonin is thought to be involved in numerous physiological processes underlying aggression, anxiety, appetite, impulsivity and compulsivity, mood, social behavior, and stress.1–4 In vivo microdialysis has been useful in establishing the role of serotonin in these disorders and others, but it is still constrained in both spatial and temporal measurement resolution.5,6
To achieve a greater degree of spatial and temporal measurement resolution, the electroanalytical technique called fast-scan cyclic voltammetry (FSCV) has been used for monitoring various neurotransmitters along with carbon fiber microelectrodes (CFM). FSCV is an electrochemical technique that detects changes in endogenous neurotransmitter levels rapidly enough to distinguish release and uptake events in brain tissue.7 Jackson and colleagues developed an N-shaped waveform for FSCV to specifically measure serotonin deemed N-shaped fast scan cyclic voltammetry (N-FSCV).8 The waveform starts from 0.2 V holding potential and increased up to 1.0 V and back to −0.1 V and then back to 0.2 V at a scan rate of 1000 V/s and serves to differentiate serotonin from catecholamine neurotransmitters such as dopamine. Besides modifying individual waveforms, we have previously discussed that the selectivity can be improved by paired-pulse voltammetry method, which applies two same N-shaped waveforms with a short interval.9 This waveform can recognize serotonin from other confounding factors by the differences in their adsorption properties. In addition, Nafion coated CFM were used to enhance serotonin sensitivity and repel the serotonin metabolite 5-hydroxyindoleacetic acid (5-HIAA), which is a major metabolite of serotonin in the brain, from the electrode and reduce fouling of electrode.10 In this study, we utilized a previously described method for coating polyehtylenedioxythiophen:Nafion (PEDOT:Nafion) onto the surface of CFMs, which mitigates biofouling and retains enhanced selectivity and sensitivity.11
Recently, Park and colleagues developed fast cyclic square-wave voltammetry (FCSWV) to measure the phasic change of dopamine.12 Applying a relatively large-amplitude cyclic square waveform led to a series of oxidation and reduction within a single scan resulting in higher sensitivity of dopamine. Current changes were recorded in a fast sampling rate (1 MS/s, megasamples per second) which facilitated a dynamic 2D voltammogram of FCSWV and the enriched electrochemical information gained through this method allowed dopamine measurement with increased sensitivity and selectivity compared to conventional FSCV.12,13
Here, we developed an N-shaped fast cyclic square-wave voltammetry (N-FCSWV) technique as a unique in vivo voltammetric technique for serotonin measurement where we combine large magnitude cyclic square-wave voltammetry (CSWV) with a background subtraction method based on conventional N-waveform design. N-FCSWV uses a series of large amplitude square-shaped potentials superimposed onto an N-shaped waveform to provide cycling through multiple redox reactions within the N-shaped waveform to increase sensitivity and selectivity to serotonin. We confirmed in vitro that the potential major interfering analytes dopamine and 5HIAA do not significantly contribute to the serotonin N-FCSWV signal, including 5-HIAA. Previous N-FSCV studies have measured serotonin release in the rat substantia nigra pars reticulata (SNr) upon electrical stimulation of the dorsal raphe nucleus or medial forebrain bundle (MFB).10,14,15 Hashemi et al. addressed the technical challenges associated with rat dorsal raphe nucleus (DRN) surgery and stimulation by instead electrically stimulating serotonin projections in the MFB, a more accessible anatomical location.15 They explored an alternative method of evoking serotonin release in the SNr by using well documented efferent circuitry of the DRN.16–19 In their study they were able to evoke serotonin release in the SNr by MFB electrical stimulation that resulted in retrograde activation of 5-HT fibers.15 Thus, we then applied our method in vivo to measure serotonin release in the rat SNr evoked by electrical stimulation of the rat MFB. Lastly, pharmacological confirmations of serotonin were performed with escitalopram (ESCIT), desipramine and nomifensine.
EXPERIMENTAL SECTION
Chemicals
Serotonin, dopamine, 5-HIAA, and histamine were purchased from Sigma-Aldrich (St. Louis, MO). TRIS buffer was a prepared mixture of 15 mM Trizam phosphate, 3.25 mM KCl, 140 mM NaCl, 1.2 mM CaCl2, 1.25 mM NaH2PO4, 1.2 mM MgCl2, and 2.0 mM Na2SO4 with the pH adjusted to 7.4. All chemicals for in vitro and in vivo experiments were purchased from Sigma-Aldrich (St. Louis, MO).
Fabrication of Carbon Fiber Microelectrodes
CFMs were fabricated as previously described (AS4, Hexel, Stamford, CT).20 The length of exposed carbon fiber was cut to meet approximately 50 μm in length under a stereomicroscope. All CFMs were coated with PEDOT:Nafion layer11 (Experimental details are available in the Supporting Information). The coated CFM was dried overnight at room temperature.
Data Collection and Analysis
Conventional N-FSCV was used to make a comparison with N-FCSWV.8 N-FSCV applied with a 1000 V/s scan rate and 0.2 V holding potential versus Ag/AgCl. The waveform switching potential was 1.0 V and then to −0.1 V and back to 0.2 V holding potential.
N-FSCV was performed using WINCS Harmoni with WincsWare software,21 and N-FCSWV were achieved using a data acquisition interface (NI USB-6363, specification, National Instruments) with in-house written software using LabView (National Instruments, Austin, TX) to operate on a base-station computer. A current to voltage preamplifier was used with no analog filter circuit in order to maintain the immediate current response to the square pulse in N-FCSWV. An in-house program with the NI USB-6363 interface controlled the application of the waveform and flow injection hardware. Data was stored on the base-station computer in the form of a sequence of unsigned 2-byte integers and processed by MATLAB (MathWork Inc., Natick, MA). Temporal averaging, filtering, and background currents simulation were applied during post signal processing. Unlike conventional square wave voltammetry, all data points were recorded and used to analyze including curve fitting.12 Figures and statistics (one-way, two-way ANOVA with multiple comparisons, paired t test) were created by using GraphPad Prism 5 (GraphPad Software, San Diego, CA).
Flow Injection Analysis
In vitro analysis of N-FSCV and N-FCSWV were performed using a flow injection system. A CFM was placed at the center of the acrylic chamber which connected with a flanged fluid line (BOLA, Germany) to a switching valve (Rheodyne MX series II, IDEX Health & Science, USA). The flow stream was controlled and maintained at a rate of 2 mL per minute by a syringe pump (Harvard Apparatus, Holliston, MA). During the constant injection of buffer solution, a known fixed concentration of analyte was injected as a bolus for quantification by N-FSCV and N-FCSWV.
Animal Surgeries
Adult male Sprague−Dawley rats (n = 10,250−350 g, Koatech, Korea) were housed in 12 h light/ dark cycles and were offered food and water ad libitum. Animal care and procedures complied with the National Institutes of Health guidelines and experimental procedures approved by the Hanyang University Institutional Animal Care and Use Committee. After an injection of the anesthetic urethane (1.5 g/kg i.p.), surgeries were performed using a stereotaxic frame (David Kopf Instruments, Tujunga, CA). Animal body temperature was maintained at 37 °C using a heating pad (TCAT-2, Harvard Apparatus). The MFB was targeted with a bipolar electrode (AP: −2.7 mm from bregma, ML: +1.7 mm, DV: −8.0 mm from dura) for electrical stimulation to evoke serotonin release in the SNr, and the SNr was targeted with a CFM (AP: −4.8 mm from bregma, ML: + 2.0 mm, DV: −8.5 mm from dura) for monitoring serotonin phasic changes.22 While N-FCSWV was recorded, electrical stimulation applied every 10 min to measure stimulation-evoked serotonin release. Pharmacological confirmation of serotonin was performed using ESCIT (n = 4, 10 mg/kg i.p.), nomifensine (n = 3, 20 mg/kg, i.p.), and desipramine (n = 3, 20 mg/kg, i.p.). After each drug injection, electrical stimulation-evoked serotonin release was monitored at 10 min intervals until 1 h postdrug injection.
Histological Analysis
Both recording electrode and stimulation electrode trajectories were confirmed by histological analysis in three subjects. After euthanization, the brains were removed and stored in 4% paraformaldehyde solution at 4 °C for a day. The brains were soaked in a glycerol solution for 2 days until they sank to the bottom. After they sank down, the brains were sliced into 60 μm thickness and mounted on glass slides. Brain slices were placed into xylene and rehydrated by applying decreasing concentrations of ethyl alcohol form 100% to 70%. Brain slices were stained with 1% cresyl violet solution. After staining, they were applying increasing concentrations of ethyl alcohol 25% to 100%. The brain slices were soaked into xylene and dried overnight. The brain slices were examined microscopically to determine the location of each electrode tip in the brain after cover glass mounted onto the slices.
Ca2+ Imaging
The mouse brain was extracted quickly and 300 μm thickness coronal striatal slices were arranged along with a Vibratome 1000 (The Vibratome Company, St. Louis, MO, USA). The slices were put in a submersive recording chamber which filled with temperature controlled artificial cerebrospinal fluid (aCSF) solution (28−30 °C, NaCl 125 mM, KCl 2.5 mM, CaCl2 2 mM, NaHCO3 26 mM, NaH2PO4 1.25 mM, MgCl2 1 mM, glucose 25 mM, and pH 7.4). 95% O2 and 5% CO2 was bubbled to aCSF solution. To elaborate on Ca2+ imaging process, the fluorescent Ca2+ probe (indicator) Fluo-3 AM (Enzo Life Science, Seoul, Korea) was used to measure Ca2+ responses of striatal neurons.12 Fluo-3 AM treated slices were mounted on a chamber (12 mm Chamlide AC, 500 μL total volume, Live Cell Instrument, Seoul, Korea) and put on an inverted microscope (Olympus IX70, Shinjuku, Tokyo, Japan). LED source pE-100 (CoolLED, Andover, Hampshire, UK) was used to cell stimulation at 470 nm wavelength, and emissions were noted at 535 nm wavelength. Fluorescent emissions from the brain slice were monitored every 0.5 s. The digital video microfluorometry was used to track intracellular Ca2+ levels ([Ca2+]). An intensified charge-coupled-device (CCD) camera (QIClick, QImaging, Surrey, Canada) was attached to the microscope and a computer with MetaMorph NX software (Molecular Devices, San Jose, CA, USA) used to collect and analyze the data.
RESULTS AND DISCUSSION
N-Shaped Fast Cyclic Square-Wave Voltammetry Waveform
The waveforms applied and corresponding current responses are shown in Figure 1. For the sake of consistency and conformity, the nomenclature in this study was adopted from Helfrick and Bottomley.23 The single cyclic square waveform consisted of a square wave oscillation superimposed on an N-shaped staircase waveform (Figure 1A). The waveform starts from an initial potential (EInitial) and it increases each stair step (EStaircase) until the peak potential (EPeak) and then decreases to the minimum and back to a holding potential (EHolding). The large up and down potentials (ESW) in a cycle square wave induce serotonin oxidation and reduction repetitively. N-FCSWV waveform was applied every 200 ms (5 Hz repetition frequency) at a 1 MHz sampling rate.
Figure 1.

Schematic N-FCSWV waveform and voltammogram process. (A) N-FCSWV consists of an N-shaped staircase potential ramp modified with square-shaped potential pulses. At each step, two equal height and oppositely directed potential pulses are imposed. (B) Background subtraction processing in N-FCSWV to remove capacitive background current from the whole current response. The whole voltammogram after serotonin injection was subtracted from the voltammogram before serotonin injection. The new background subtracted voltammogram obtained with multiple redox reactions of serotonin. (C) 2D voltammogram reconstruction. The voltammogram from a biphasic square wave at each step of the ramp is stacked vertically at the ramp potential and displayed with a pseudocolor map.
The schematics of the N-FCSWV waveform and its current responses are clarified in Figure 1B. In accordance with the conventional background subtraction method, the voltammogram after serotonin presence and before serotonin were subtracted.24 The N-FCSWV background subtracted waveform contained multiple redox current responses. However, the background subtraction method could not remove capacitive background current perfectly, because serotonin affects the capacitive current during its redox reaction. Following our previous method, background correction processing was carried out to further reduce the remaining capacitive current.12 In N-FCSWV, a 1.0 MHz sampling rate was utilized to apply the waveform and collect the entire current response. The background subtraction method was used to take out capacitive current from the background voltammogram. As illustrated in Figure 1B, the voltammogram after serotonin presence was subtracted from that ahead serotonin using the conventional background subtraction method. The background subtracted voltammogram containing multiple redox reactions is displayed in Figure 1B. In practice, however, limitations exsited in totally eliminating the background current (capacitive current) with this method since adding serotonin has influence over the capacitive current. To lessen the remaining capacitivie current, we adopted a background correction process used in a previous study.12 For a more straightforward N-FCSWV analysis, a 2D voltammogram display was utilized in this study. N-FCSWV waveform created with optimized parameters with EStaircase = 0.05 V, Esw = 0.4 V, EHolding = 0.2 V, EInitial = −0.1 V, and EPeak = 0.7 V. The staircase waveform was composed of 38 steps and each step duration (τ) is 0.5 ms (500 points for each step with 1 MHz sampling rate). In total, each voltammogram has 19000 data points (1 × 19000) and it was reconstructed to a 2D voltammogram by displaying each 500 points of square pulse on the y-axis and the N-shaped potential steps (38 steps) on the x-axis. Finally, the current response was displayed in false color. Figure 1C showed the current response at a 0.15 V step potential which was combined with the upward potential (0.55 V, 250 points) and the downward potential (−0.25 V, 250 points). The current responses of 500 data points were marked endways at the 0.15 V staircase potential. The 2D voltammogram had been made by this process repeatedly for each step potential. Figure 1C displayed the reconstructed 2D voltammogram.
N-FCSWV Waveform Optimization
In the N-FCSWV waveform, the waveform parameters including EStaircase, ESW, EInitial, and switching potential were optimized for measurement of serotonin with a 5 Hz repetition frequency. EHolding was fixed at 0.2 V, the same as the conventional N-shaped waveform.8 The duration of a square waveform, tau (τ), was fixed at 0.5 ms as previously defined.12 All waveform optimization experiments were conducted with 100 nM of serotonin. In the N-FCSWV waveform, EStaircase was one of the main parameters to determine the measurement sensitivity to serotonin. Conventional N-FSCV uses a waveform scan rate of 1000 V/s and enhances electrode sensitivity by outrunning side reactions such as dopamine, while the optimization of the waveform itself is used to minimize the slower adsorption processes.8 The EStaircase of N-FCSWV is the difference between one square waveform and the next square waveform which related to the total length of the waveform and functioned like the scan rate used in conventional FSCV. Therefore, EStaircase between 0.0133 and 0.075 V were tested. As shown in Figure 2A, a higher EStaircase showed significantly greater sensitivity to serotonin, when compared with a lower EStaircase (n = 5 electrodes, one-way ANOVA with Tukey’s multiple comparison test, p < 0.0001, DF = 44, MS = 2816, F =40.20). There was no significant difference between 0.05 and 0.075 V EStaircase (n = 5 electrodes, one-way ANOVA with Tukey’s multiple comparison test).
Figure 2.

Serotonin 1 δM response during waveform parameter optimization. (A) Optimizing EStaircase (0.0133 V − 0.075 V). Voltammograms for EStaircase = 0.0133 V and EStaircase = 0.05 V are shown (inset). As EStaircase increases, serotonin sensitivity increased significantly, except 0.05 and 0.075 V (n = 5 electrodes, one-way ANOVA with Tukey’s multiple comparison test). (B) Optimizing Esw. Square pulse amplitude. Voltammograms for Esw = 0.1 and 0.4 V are shown (inset). As Esw increases, serotonin sensitivity increased significantly, except between 0.3 and 0.4 V (n = 5 electrodes, one-way ANOVA with Tukey’s multiple comparison test). (C) Optimizing initial voltage. Initial voltage is where the waveform starts (−0.2 V − 0.1 V). Voltammograms indicated a deficit pattern (EInitial = 0.1 V, inset, left) and intact pattern (EInitial = −0.1 V, inset, right). There were no significant differences of serotonin sensitivity between various EInitial (n = 5 electrodes, one-way ANOVA with Tukey’s multiple comparison test). (D) Optimizing switching potential (1.0 V − 1.5 V). Switching potential is a peak potential where the forward sweep changes to a backward sweep. As switching potential increased, serotonin sensitivity decreased except between 1.0 and 1.1 V and did not significantly affect serotonin sensitivity (n = 5 electrodes, one-way ANOVA with Tukey’s multiple comparison test).
To obtain higher sensitivity while retaining as many square waveforms as possible for the resolution of a 2D voltammogram, we chose 0.05 V for the optimized EStaircase value for the N-FCSWV waveform. As illustrated in Figure 2B, serotonin oxidation peak current showed significantly higher response to serotonin at ESW = 0.4 V than ESW = 0.1 V and thus greater sensitivity. Large-amplitude upward and downward square pulses resulted in both serotonin oxidation and reduction. When a ESW = 0.4 V square wave was put on a −0.1 V EInitial, the first square wave starts from 0.3 V upward potential (250 μs) to −0.5 V downward potential (250 μs). The amplitude of the redox reaction of serotonin was almost identical, which means serotonin was oxidized during the upward potential and most of it reduced back to serotonin immediately during the downward potential due to the short diffusion time between the upward and downward potentials. This series of oxidation and reduction happened when the amplitude of Esw included the serotonin oxidation and reduction potential within a single square pulse. There was no significant difference between ESW = 0.3 V and ESW = 0.4 V (n = 5, one-way ANOVA with Tukey’s multiple comparison test). However, higher ESW lead to a significantly higher serotonin response to N-FCSWV (Figure 2B, n = 5, one-way ANOVA with Tukey’s multiple comparison test, p < 0.0001, DF = 44, MS = 2937, F = 132.9).
The conventional FSCV waveform starts with a holding potential at 0.2 V. The N-FCSWV waveform can be modified to maximize serotonin oxidation and reduction pattern. EInitial affects the initial part of oxidation current and it should start lower than serotonin’s initial oxidation potential. In N-FCSWV, there was no significant difference in serotonin oxidation responses with various EInitial settings (Figure 2C, n = 5 electrodes, one-way ANOVA with Tukey’s multiple comparison test, p = 0.5864, DF = 44, MS = 21.52, F = 0.6513). Comparing EInitial = −0.1 and 0.1 V, a voltammogram with 0.1 V EInitial showed a deficit in redox reaction where serotonin redox starts and ends (Figure 2C inset, left). However, EInitial = −0.1 V showed intact serotonin redox reactions (Figure 2C inset, right). Thus, to maintain a serotonin redox pattern and its sensitivity an EInitial= −0.1 V was chosen.
In N-FCSWV, the switching potential is calculated by the ESW added on to the EPeak value.12 EPeak from 0.6 to 1.1 V when ESW is set to 0.4 V were tested. The serotonin oxidation response decreased as the switching potential step up to 1.5 V (Figure 2D, n = 5, one-way ANOVA with Tukey’s multiple comparison test, p < 0.0001, DF = 66, MS = 3251, F = 222.0). There was no significant difference between switching potential 1.0 and 1.1 V (n = 5, one-way ANOVA with Tukey’s multiple comparison test). EPeak= 1.1 V was chosen in order to keep the distance between two redox patterns in both the forward and reverse sweep. The final N-FCSWV parameters for measuring serotonin were determined as ESW = 0.4 V, EHolding = 0.2 V, EInitial = −0.1 V, EPeak = 0.6 V, EStaircase = 0.05 V, and τ = 0.5 ms with 5 Hz repetition frequency. A single N-FCSWV scan duration was 19.5 ms.
N-FCSWV Sensitivity and Selectivity
To examine the sensitivity of N-FCSWV, N-FCSWV and N-FSCV responses were collected and compared at serotonin concentrations ranging from 50 nM to 500 nM. N-FCSWV showed notably higher serotonin current responses than N-FSCV at all serotonin concentrations tested as displayed in Figure 3. This significant increase in sensitivity, 12.61 pC/100 nM of serotonin, is likely as a result of the series of redox chain reactions in the N-FCSWV waveform which the Esw covers oxidation and reduction potentials of the serotonin within a single square pulse as described previously.13 The N-FCSWV limit of detection for serotonin was calibrated with the kernel method as previously described.13 The detection limit of N-FCSWV was 2 ± 1 nM, while the detection limit of N-FSCV for serotonin was 5 ± 2 nM (n = 5 electrodes for both N-FCSWV and N-FSCV). In addition, both N-FCSWV and NFSCV recorded responses of serotonin in solution showed a linear current-concentration plot (R2 = 0.9906 for N-FCSWV and R2 = 0.9775 for N-FSCV).
Figure 3.

Comparison of sensitivity to serotonin using N-FSCV and N-FCSWV. Conventional N-shaped waveform was used for N-FSCV. N-FCSWV showed significantly higher sensitivity compared to conventional N-FSCV (n = 5 electrodes, paired t test, p = 0.0246 (50 nM), p = 0.0104 (100 nM), p = 0.0163 (200 nM), p = 0.0131 (500 nM)).
With conventional N-FSCV, serotonin specific waveform parameters eliminate the dopamine redox signal.8 However, the major in vivo metabolite of serotonin, 5-HIAA, produces a redox current response at a similar potential. Thus, a combination of serotonin, dopamine, and 5-HIAA concentrations was used in a flow cell to assess the selectivity of N-FCSWV to serotonin. With N-FCSWV, serotonin (100 nM) showed identical oxidation and reduction patterns in the 2D voltammogram plot (Figure 4A). With respect to 5-HIAA, the signal was significantly smaller compared to serotonin (17% of the amplitude of serotonin) despite being 10-fold higher in concentration (1 μM) to serotonin (Figure 4B). In addition, the dopamine (100 nM) redox signal was entirely absent, as has been shown using N-FSCV (Figure 4C).
Figure 4.

Selectivity of N-FCSWV. 2D pseudo color plot (top panel) and voltammogram (bottom panel) for (A) 100 nM serotonin, (B) 1 δM 5HIAA, and (C) 100 nM dopamine.
A concentration calibration plot of a combination of these analytes clearly demonstrates the sensitivity and selectivity of N-FCSWV to serotonin. As shown in Figure 5, the blue squares correspond to the mean response values measured with 5-HIAA added to the serotonin solution. Responses recorded for a solution of serotonin only yielded a statistical significance of linear trend (orange circles, n = 4 electrodes, R2 = 0.9737) up to 500 nM. When both serotonin and 5-HIAA at a 10-fold higher concentration were present in solution, there were no significant signal differences compared to serotonin alone (n = 4 electrodes, multiple t test using the Holm-Sidak method, p = 0.9227 for 25 nM, p = 0.7983 for 50 nM, p = 0.7157 for 100 nM, p = 0.3648 for 200 nM, and p = 0.5686 for 500 nM), and still the responses yielded a statistical significance of linear trend (Figure 5, blue squares, n = 4 electrodes, R2=0.9850). This implies that the major interference of serotonin, 5-HIAA, is unlikely and would not impact the signal.
Figure 5.

Serotonin selectivity curve. Red squares represent serotonin responses to different concentrations. Blue squares represent the addition of 5-HIAA to the serotonin solution with 5-HIAA being 10-fold higher in concentration compared to serotonin (25 nM, 50 nM, 100 nM, 200 nM, 500 nM for serotonin and 250 nM, 500 nM, 1 δM, 2 δM, 5 δM for 5-HIAA), and there were no significant differences among mixtures (n = 4 electrodes, multiple t test).
Quantification of Phasic Serotonin Release in Vivo by N-FCSWV
Prior to in vivo experiments, Ca2+ imaging in a brain slice was conducted to test whether local neuronal activity (Figure S1, Supporting Information) could be affected by the N-FCSWV waveform. Compared to chemical (KCl 50 mM) and electrical (200 μA, 2 ms, biphasic, 90 Hz, 2 s) stimulation evoked neuronal activity, the N-FCSWV waveform alone did not affect neurons around the local recorded area in spite of their relatively large magnitude. To test the capacity of N-FCSWV in measuring serotonin in vivo, phasic changes in serotonin release in the rat SNr as a result of short electrical stimulation of the MFB (60 Hz, biphasic, 350 μA, 5 s stimulation, 2 ms per phase) were recorded. Figure 6A demonstrates the representative 2D voltammogram of the serotonin oxidation and reduction pattern immediately after the electrical stimulation. For the confirmation of the recorded signal corresponding to changes in serotonin extracellular concentrations, ESCIT was injected to systemically hinder the reuptake of serotonin. ESCIT administration led to an increase in the 2D voltammogram display of serotonin taken at the peak effect of ESCIT, compared to the response recorded prior to ESCIT treatment (Figure 6A left and right panels, respectively). The time versus serotonin level changes of preand post-treatment were displayed in Figure 6B left (representative concentration versus time in Figure S2). Also, there was significant delay to serotonin clearance (t1/2) compared to pre- and post-ESCIT treatment (Figure 6B right, p = 0.049, paired t test). Previous study has reported in mice a similar MFB-stimulated response following ESCIT adminis- tration.14
Figure 6.

Serotonin release in the rat SNr evoked by electrical stimulation of the rat MFB. (A) Representative 2D voltammogram of evoked serotonin release before (left, control) and 30 min after ESCIT administration (right). (B) (left) MFB stimulation-evoked serotonin concentration changes versus time before and 30 min after ESCIT treatment (n = 4 rats, vertical lines of each point represent ± SEM, black bar on time axis indicates electrical stimulation). (right) Serotonin clearance (t1/2) of control and 30 min after ESCIT administration. There was significant delay to t1/2 (p = 0.049, paired t test).
To confirm the serotonin selectivity of the response in vivo, the dopamine selective reuptake inhibitor nomifensine (20 mg/kg, i.p.), and the norepinephrine selective reuptake inhibitor desipramine (20 mg/kg, i.p.) were administrated and responses were recorded to compare before and after treatments (n = 3 for each, Figure S3, Supporting Information). Each of these agents failed to alter or augment MFB stimulation-evoked responses recorded in the SNr.
The temporal change of the N-FCSWV 2D voltammogram before and 30 min after ESCIT treatment is demonstrated in the video clip in the Supporting Information. Compared to beaker measurements of serotonin, the in vivo serotonin color plot revealed additional features. Previous study has reported that electrical stimulation-evoked serotonin and histamine occur simultaneously in the same coordinates used in the present study.15 In vitro beaker tests were performed to record histamine responses using N-FCSWV (Figure S4, Supporting Information). At the end of each experiment after euthanization, target site confirmation was conducted with standard histological methods. The histological analysis showed that both CFM electrodes and electrical stimulation electrodes were accurately implanted into the SNr and MFB (n = 3, Figure S5, Supporting Information).
CONCLUSION
In this study, N-FCSWV is introduced as a unique voltammetric technique for in vivo serotonin measurements by coupled large-amplitude CSWV with a background subtraction method based on conventional N-waveform design. Square waves with a large magnitude potential caused a series of oxidations and reductions within a single square wave pulse that led to increased sensitivity to serotonin compared to conventional N-FSCV.8
Supplementary Material
ACKNOWLEDGMENTS
The authors would like to thank Jeongeun Sim for experimental assistance. This research was supported by the NIH 1U01NS090455-01 award, by the NIH R01NS112176 award, and by the National Research Foundation of Korea (NRF) grant funded by the Korea government (MSIT) (No. NRF-2017R1A2B2006896).
Footnotes
The authors declare no competing financial interest.
ASSOCIATED CONTENT
Supporting Information
The Supporting Information is available free of charge at https://pubs.acs.org/doi/10.1021/acs.analchem.9b03164.
Physiological effects of N-FCSWV, concentration versus time trace, pharmacological confirmation in vivo, histamine response to N-FCSWV, and electrode location confirmation (PDF)
Representative video showing electrical stimulation-evoked in vivo serotonin level changes before and after ESCIT treatment (MP4)
REFERENCES
- (1).Nikolaus S; Müller H-W; Hautzel H Rev. Neurosci 2016, 27, 27. [DOI] [PubMed] [Google Scholar]
- (2).Owens MJ; Nemeroff CB Clinical Chemistry 1994, 40 (2), 288–295. [PubMed] [Google Scholar]
- (3).Abi-Dargham A; Laruelle M; Aghajanian GK; Charney D; Krystal J J. Neuropsychiatry Clin. Neurosci 1997, 9 (1), 1–17. [DOI] [PubMed] [Google Scholar]
- (4).Young SN; Leyton M Pharmacol., Biochem. Behav 2002, 71 (4), 857–65. [DOI] [PubMed] [Google Scholar]
- (5).Justice JB J. Neurosci. Methods 1993, 48 (3), 263–276. [DOI] [PubMed] [Google Scholar]
- (6).Stenken JA Anal. Chim. Acta 1999, 379 (3), 337–358. [Google Scholar]
- (7).Dankoski E; Wightman R Monitoring serotonin signaling on a subsecond time scale. Front. Integr. Neurosci 2013, 7 (44), DOI: 10.3389/fnint.2013.00044 [DOI] [PMC free article] [PubMed] [Google Scholar]
- (8).Jackson BP; Dietz SM; Wightman RM Anal. Chem 1995, 67 (6), 1115–20. [DOI] [PubMed] [Google Scholar]
- (9).Kim SY; Oh YB; Shin HJ; Kim DH; Kim IY; Bennet K; Lee KH; Jang DP Biomedical Engineering Letters 2013, 3 (2), 102–108. [Google Scholar]
- (10).Hashemi P; Dankoski EC; Petrovic J; Keithley RB; Wightman RM Anal. Chem 2009, 81 (22), 9462–71. [DOI] [PMC free article] [PubMed] [Google Scholar]
- (11).Vreeland RF; Atcherley CW; Russell WS; Xie JY; Lu D; Laude ND; Porreca F; Heien ML Anal. Chem 2015, 87 (5), 2600–2607. [DOI] [PMC free article] [PubMed] [Google Scholar]
- (12).Park C; Oh Y; Shin H; Kim J; Kang Y; Sim J; Cho HU; Lee HK; Jung SJ; Blaha CD; Bennet KE; Heien ML; Lee KH; Kim IY; Jang DP Anal. Chem 2018, 90 (22), 13348–13355. [DOI] [PubMed] [Google Scholar]
- (13).Oh Y; Heien ML; Park C; Kang YM; Kim J; Boschen SL; Shin H; Cho HU; Blaha CD; Bennet KE; Lee HK; Jung SJ; Kim IY; Lee KH; Jang DP Biosens. Bioelectron 2018, 121, 174–182. [DOI] [PMC free article] [PubMed] [Google Scholar]
- (14).Wood KM; Hashemi P ACS Chem. Neurosci 2013, 4 (5), 715–720. [DOI] [PMC free article] [PubMed] [Google Scholar]
- (15).Hashemi P; Dankoski EC; Wood KM; Ambrose RE; Wightman RM J. Neurochem 2011, 118, 749. [DOI] [PMC free article] [PubMed] [Google Scholar]
- (16).Azmitia EC; Segal M J. Comp. Neurol 1978, 179, 641. [DOI] [PubMed] [Google Scholar]
- (17).Moore RY; Halaris AE; Jones BE J. Comp. Neurol 1978, 180, 417. [DOI] [PubMed] [Google Scholar]
- (18).Parent A; Descarries L; Beaudet A Neuroscience 1981, 6 (2), 115–38. [DOI] [PubMed] [Google Scholar]
- (19).Imai H; Steindler DA; Kitai ST J. Comp. Neurol 1986, 243 (3), 363–80. [DOI] [PubMed] [Google Scholar]
- (20).Oh Y; Park C; Kim DH; Shin H; Kang YM; DeWaele M; Lee J; Min HK; Blaha CD; Bennet KE; Kim IY; Lee KH; Jang DP Anal. Chem 2016, 88 (22), 10962–10970. [DOI] [PubMed] [Google Scholar]
- (21).Lee KH; Lujan JL; Trevathan JK; Ross EK; Bartoletta JJ; Park HO; Paek SB; Nicolai EN; Lee JH; Min H-K; Kimble CJ; Blaha CD; Bennet KE Sci. Rep 2017, 7, 46675. [DOI] [PMC free article] [PubMed] [Google Scholar]
- (22).Paxinos G; Watson C The rat brain in stereotaxic coordinates, 6th ed.; Academic Press/Elsevier: Amsterdam, Boston, 2007. [Google Scholar]
- (23).Helfrick JC; Bottomley LA Anal. Chem 2009, 81 (21), 9041. [DOI] [PubMed] [Google Scholar]
- (24).Howell JO; Kuhr WG; Ensman RE; Mark Wightman RJ Electroanal. Chem. Interfacial Electrochem 1986, 209 (1), 77–90. [Google Scholar]
Associated Data
This section collects any data citations, data availability statements, or supplementary materials included in this article.