

Abstract
Background:
In acquired aplastic anemia, the immune system destroys hematopoietic cells, leading to pancytopenia. Patients respond to immunosuppressive therapy but about 15 per cent develop myelodysplastic syndromes (MDS) and acute myeloid leukemia (AML), usually many months to years after diagnosis.
Methods:
Next generation sequencing and array-based karyotyping were performed using 668 blood samples from 439 aplastic anemia patients; serial samples were analyzed in 82.
Results:
Somatic mutations in myeloid malignancy candidate genes were present in 1/3 of patients, in a limited number of genes and at low initial variant allele frequency. Clonal hematopoiesis was detected in 47% of patients, most frequently as acquired mutations. Mutation prevalence increased with age and mutations had an age-related signature. DNMT3A- and ASXL1-mutated clones tended to increase in size over time; BCOR/BCORL1 and PIGA-mutated clones decreased or remained stable. Mutations in PIGA and BCOR/BCORL1 correlated with better response to immunosuppressive therapy and better overall and progression-free survival; mutations in a subset of genes including DNMT3A and ASXL1 associated with worse outcomes. However, complex patterns of clonal dynamics were compatible with improvement after therapy and long survival in individual cases.
Conclusions:
Clonal hematopoiesis was prevalent in aplastic anemia. Some mutations were related to clinical outcomes. A highly biased set of mutations is evidence of Darwinian selection in the failed bone marrow environment. The pattern of somatic clones in individual patients over time was variable and frequently unpredictable.
Acquired aplastic anemia is caused by immune-mediated destruction of hematopoietic stem/progenitor cells1. Bone marrow transplantation is curative and patients also may respond to immunosuppressive therapy2,3. With improved survival, the late development of myelodysplastic syndromes (MDS) and/or acute myeloid leukemia (AML) has been noted in some patients and termed “clonal evolution”4. While historically used to describe the development of malignancy in the setting of an immune disease, “clonal evolution” is a misnomer, as there is evidence of clonal hematopoiesis in aplastic anemia in patients who do not develop MDS or AML. CD34+ cells and early progenitors are uniformly reduced in aplastic anemia5, and small numbers of stem cell clones were inferred from X-chromosome skewing6. In about half of aplastic anemia patients, there is evidence of a second disease, paroxysmal nocturnal hemoglobinuria (PNH)1, which results from expansion of somatically mutated hematopoietic stem cells. Cytogenetic abnormalities have been described in aplastic anemia without MDS7,8, as has uniparental disomy of the 6p arm (6pUPD)9. However, the origin, importance, and dynamics over time of clonal hematopoiesis in aplastic anemia, and its relationship to the development of MDS/AML, have not been defined. Patients with aplastic anemia offer the opportunity to examine clonality before the development of malignancy and thus of early events in at least one form of leukemogenesis.
We used samples from three institutions specializing in bone marrow failure to perform targeted deep sequencing of genes implicated in MDS/AML, with correlation of clonal populations of mutated cells to clinical outcomes. In selected cases, we then utilized whole exome sequencing to characterize hematopoietic clonal architecture in patients over time.
METHODS
PATIENTS
We enrolled 439 patients with aplastic anemia from three bone marrow failure centers: the National Institutes of Health (NIH,N=256), Cleveland Clinic (N=24), and Kanazawa University (N=159) (Tables S1, S2). Blood, marrow, and buccal samples were collected with informed consent according to protocols approved by Institutional Review Boards (Fig. S1). Germline DNA was available for patients from the NIH and Cleveland from CD3-positive T cells, and for 22 Japanese patients from buccal smears. Criteria for diagnosis, disease severity, response to immunosuppressive therapy, and relapse have been described2. For the NIH cohort, per protocol, clonal evolution was defined as identification of a chromosomal abnormality by metaphase karyotyping or presence of frank morphologic dysplasia and/or increase in CD34+ cells on marrow examination.
DNA SEQUENCING AND SINGLE NUCELOTIDE POLYMORPHISM (SNP)-ARRAY
Methods of whole exome/targeted sequencing and SNP-array karyotyping were reported10-12 (Supplementary Appendix). The panel of 106 genes for targeted sequencing included most of the genes known to be mutated in myeloid malignancies, and PIGA (Table S3). Mean depth for targeted and whole exome sequencing was 1,248× and 112×, respectively (Table S4). Somatic mutations were detected using a threshold of 0.07 or 0.02 (targeted sequencing) for variant allele frequency and were individually validated using deep sequencing of PCR-amplified targets (with assessment of specific variant reads in healthy controls whenever possible).
STATISTICS
We assessed associations between gene mutations and clinical outcomes by the statistical machine learning methods Random Survival Forests (RSF)13 and Penalized Variable Selection (PVS)14 methods. Multiple logistic regression and Cox Proportional Hazards models were used to evaluate mutations in gene sets and competing risk factors (Supplementary Appendix). Full details of the statistical analysis are provided in the Methods section in the Supplementary Appendix.
RESULTS
TARGETED SEQUENCING AND SNP-ARRAY KARYOTYPING
Targeted sequencing of a panel of genes recurrently mutated in MDS and AML was performed using blood from all 439 aplastic anemia patients. Overall, 249 somatic mutations were detected among 156 patients (36%), of whom 56 had multiple mutations (range 1–7; Fig. S2A). Most frequently mutated were BCOR/BCORL1 (9.2%), PIGA (7.5%), DNMT3A (8.4%), and ASXL1 (6.2%), which together accounted for over 77% of all mutation-positive patients. The overall mutation rate and the predominant mutations were similar between the US and Japan cohorts (Figs. 1, S2A, Table S5). Except for PIGA and BCOR/BCORL1 mutations, both the presence and the number of mutations per patient positively correlated with age (both P<0.001; Fig. 1B). Multi-lineage involvement of mutations was confirmed in six evaluable patients by amplicon sequencing of genomic DNA from flow-sorted fractions of hematopoietic stem cells, common myeloid progenitors and myeloid erythroid progenitors, although as expected, cell numbers in these fractions were reduced (Fig. S3, Table S6). Samples in the NIH cohort were collected at 6 months after immunosuppressive therapy; diagnostic samples were available for 45 NIH patients carrying 79 mutations, for which amplicon sequencing confirmed that the majority of mutations (58/79) were present at diagnosis at a variant allele frequency much lower than at 6 months after treatment (P<0.001; Fig. 1C). There was no significant difference in the relative frequency of mutated genes at diagnosis and at 6 months after treatment (Fig. S2B), indicating that these mutations were present before treatment.
Figure 1. Somatic Mutations Identified by Targeted Sequencing.
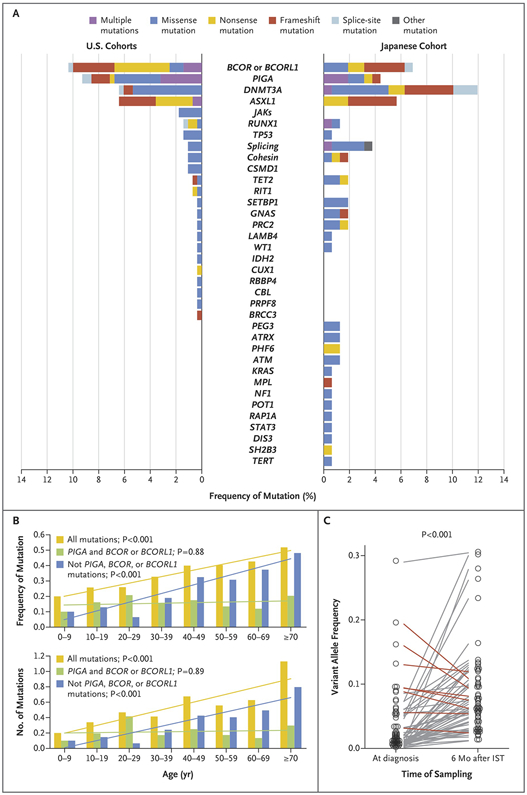
(A) Frequency of mutated genes and type of mutations in each gene identified in US (NIH + Cleveland-CLV) and Japanese (JPN) cohorts. (B) Frequency (upper panel) and mean number (lower panel) of mutations in different age groups are presented for indicated sets of mutations with corresponding regression lines. (C) Variant allele frequency of mutations detected at time of diagnosis and 6 months post-therapy in the NIH cohort. Mutations with higher allele frequency at diagnosis than at 6 months post-IST are shown with red lines, whereas the rest are depicted in grey lines.
As has been reported9, the most prevalent abnormality in SNP-array karyotyping was 6pUPD, present in 13% of patients in each cohort (Fig. S4). Copy number variations were detected in 18 out of 417 samples analyzed, including −7 (N=7), del(13q) (N=2), and others (N=15; Fig. S4).
Candidate gene mutations in aplastic anemia recapitulated those in MDS/AML in positional distribution and strong bias to nonsense, frameshift, and splice site changes (Fig. S5A)15-19 Mean allelic burden of mutations in aplastic anemia (9.3%) was lower than in MDS (30.4%; Fig. S5B, C)20. While DNMT3A and ASXL1 were frequent in aplastic anemia and in MDS/AML, we observed overrepresentation of PIGA and BCOR/BCORL1 mutations and underrepresentation of mutations in TET2, splicing factor genes, JAK2, RUNX1, and TP53 in aplastic anemia compared to MDS, suggesting discrete mechanisms of clonal selections in aplastic anemia.
Some patients carried multiple mutations in the same genes, including PIGA, BCOR, DNMT3A, ASXL1, RUNX1 and ZRSR2. Twenty-two mutations were in X chromosome genes in 11 male patients and, therefore, likely to be within independent subclones (Fig. S5D), a fact that was explicitly demonstrated for 2 patients carrying 2 BCOR and 3 PIGA mutations using single-colony sequencing (Table S7).
CLINCAL CORRELATIONS
The effect of gene mutations on clinical outcomes was assessed first in the NIH cohort, in whom samples were uniformly collected 6 months post-treatment and all patients had severe aplastic anemia. There was no apparent relationship between the presence of mutations and response to immunosuppressive therapy (P=0.28; Fig. S6A), but when assessed individually, BCOR/BCORL1 mutations favored a good response to immunosuppressive therapy (P=0.013; Fig. S6B). Logistic regression using multiple variables previously reported to correlate with response to treatment at 6 months21 showed that BCOR/BCORL1 remained independently associated with response (Table S8).
Similarly, overall survival and evolution to MDS/AML and progression-free survival were not significantly different when all patients with somatic mutations were compared with patients without mutations (Fig. S7A). We next assessed associations between gene mutations and clinical outcomes by machine learning methods. Both RSF and PVS algorithms identified patients with better and worse responses to immunosuppressive therapy (PIGA and BCOR/BCORL1 versus ASXL1, DNMT3A, TP53, RUNX1, JAK2, JAK3, and CSMD1, Fig. 2A); better and worse overall survival (PIGA and BCOR/BCORL1 versus ASXL1, DNMT3A, TP53, RUNX1, and CSMD1; Fig. 2B) and progression-free survival (PIGA and BCOR/BCORL1 versus ASXL1, DNMT3A, RUNX1, JAK2, and JAK3), in comparison to patients without these mutations (“unmutated” group; Fig. 2C). Analysis of the Japanese cohort using the same gene set confirmed their relationship to lower overall survival in severe aplastic anemia (Fig. S7B). Patients with “mixed” mutations – both “favorable” (PIGA or BCOR/BCORL1) and any other mutated gene – were excluded from these analyses, but stratification in models was enhanced if these patients were grouped with the favorable gene set for response to therapy and overall survival (see below) and with unfavorable genes for progression-free survival (data not shown).
Figure 2. Clinical Correlations with Somatic Mutations.

Gene set enrichment analysis using a PVS algorithm identified sets of genes that associate with good and poor response to immunosuppressive therapy (panel A), OS (panel B), and PFS (panel C) in the NIH cohort. (A) Inferior response to immunosuppressive therapy in a group of patients with “unfavorable” mutations (DNMT3A, ASXL1, TP53, RUNX1, JAK2, JAK3, or CSMD1) and a superior response with “favorable” mutations (PIGA or BCOR/BCORL1) compared to an “unmutated” group (P=0.029 by chi-square test). The width of each column represents the number of patients in each group and the response to immunosuppressive therapy is color-coded, with non-response shown in red, partial response in green, and complete response in blue. (B) Kaplan-Meier overall survival is compared among three groups: “favorable” mutations in PIGA or BCOR/BCORL1 (blue), “unmutated” (in green), and patients with “unfavorable” mutations in DNMT3A ASXL1, TP53, RUNX1, or CSMD1 (red). (C) Kaplan-Meier progression-free survival compares patients with “favourable” mutations in PIGA, or BCOR/BCORL1 (in green), “unmutated” cases (blue), and patients with “unfavorable” DNMT3A, ASXL1, RUNX1, JAK2, or JAK3 mutations (red). (D) Kaplan-Meier overall survival in patients younger than 60 years is compared among three groups: “favorable” mutations in PIGA or BCOR/BCORL1 (blue), “unmutated” (in green), and patients with “unfavorable” mutations in DNMT3A ASXL1, TP53, RUNX1, or CSMD1 (red). Statistical comparisons among groups used log-rank tests and p values are shown on the graphs. The “unmutated” group of patients included patients with other candidate gene mutations that did not cluster in gene set enrichment analysis with either favourable or unfavorable groups (results were similar when unmutated patients—no candidate gene mutations detected—were used as the reference group). Thirteen patients with “mixed” mutations were excluded from the gene set enrichment analysis.
As age correlated with the presence of mutations and is a known risk factor for poor overall survival in aplastic anemia22, a Cox proportional hazards model was used to determine if mutations were independent risk factors (Table 1): “favorable” somatic mutations (grouped based on PVS algorithm) associated with good overall survival (Model 1), and “unfavorable” mutations, older age, male sex, and lower initial reticulocytes associated with poor overall survival (Model 2). Overall survival in younger patients was particularly influenced by the presence of “unfavorable” mutations (Figs. 2D and S8).
Table 1.
Risk Factors Associated with Overall Survival
| Model 1 | Model 2 | |||
|---|---|---|---|---|
| Hazard Ratio | p value | Hazard Ratio | p value | |
| Age (>60 years) | 2.72 (1.51-4.90) | <0.001 | 2.50 (1.41-4.43) | 0.0018 |
| Sex (male) | 2.30 (1.27-4.17) | 0.0062 | 2.27 (1.25-4.10) | 0.0069 |
| Somatic mutations | ||||
| “Favorable” | 0.27 (0.09-0.78) | 0.016 | -------- | -------- |
| “Unmutated” | 0.56 (0.29-1.09) | 0.088 | -------- | -------- |
| “Mixed” | 0.23 (0.05-1.05) | 0.058 | -------- | -------- |
| “Combined” | -------- | -------- | 0.48 (0.25-0.91) | 0.024 |
| Blood counts at diagnosis | ||||
| Reticulocytes | 0.43 (0.22-0.84) | 0.014 | 0.47 (0.25-0.88) | 0.019 |
| Neutrophils | 0.67 (0.26-1.72) | 0.418 | 0.67 (0.26-1.75) | 0.412 |
| Lymphocytes | 1.63 (0.89-2.97) | 0.110 | 1.46 (0.83-2.60) | 0.192 |
| Platelets | 1.18 (0.57-2.46) | 0.657 | 1.34 (0.65-2.79) | 0.429 |
Risk factors were assessed in a Multivariate Cox Proportional Hazard Model. Hazard ratios and 95% confidence intervals (shown in parenthesis) were derived for each variable. Reference (baseline) groups for categorical variables were: age ≤60 years, sex = female, and “unfavorable” mutations. Blood counts at the time of diagnosis were treated as continuous variables after log10 transformation. P-values for each variable were obtained by likelihood ratio tests. In Model 1, individual gene sets (“favorable”, “unmutated” and “mixed” mutations) each were compared separately to the “unfavorable” gene set as a reference. In Model 2, all other gene sets were combined for comparison to the “unfavorable” gene set. Somatic mutation categories were derived using a PVS algorithm, as described in the text, for favorable (PIGA and BCOR/BCORL1), unfavorable mutations (ASXL1, DNMT3A, TP53, RUNX1, and CSMD1), and “unmutated” cases (none of these mutations or no mutations); thirteen patients had mixed mutations.
CHRONOLOGY OF CLONE ARCHITECTURE IN APLASTIC ANEMIA
We used whole exome sequencing to define clonal hematopoiesis over time. Comprehensive detection of coding sequence mutations was achieved in 135 samples from 52 patients, including serially collected samples in 28 individuals (Table S9). Sample selection was biased for patients with known mutations in targeted genes, as the analysis was intended to depict clonal architecture preceding clinical evolution to MDS/AML. In total, 275 somatic mutation events in 25 patients (48.1%) were detected and validated by amplicon sequencing. Of the 52 patients studied, acquired mutations in exomes of genes of unknown significance defined hematopoietic cell clones in another five patients (Fig. S9A).
Combining all platforms, clonal hematopoiesis was documented in 85% of the 52 samples (Table S10). The mean number of non-synonymous mutations per sample was 1.21 (1.83 including synonymous mutations; Fig. S9A) and significantly increased with age (Fig. S9B). Mutations were prominently biased to age-related C to T transition at CpG dinucleotides, true as well of those detected by targeted sequencing (Fig. S9C); transitions also accumulate in the healthy aged (Fig. S10)23-25. Excepting genes included in targeted sequencing, only four very large genes (ITGA1, HDLBP, AKAP9, and MUC16) harbored recurrent mutations. The presence of multiple subclones, inferred from significantly different variant allele frequency values of distinct mutations in targeted sequencing at 6 months post-therapy, was confirmed by detection of additional new mutations by whole exome sequencing.
More detailed analysis of clonal evolution was obtained by sequencing of serial samples spanning years in 35 patients. In most patients, clonal hematopoiesis originated from a minor clone already present at the time of diagnosis. However, their subsequent temporal course was highly variable. In some cases, clones containing mutations were stable over years (median 5 years; 2−10), generally with persistent cytopenias (Fig. S11). In others (Figs. 3A-C, S12), a large hematopoietic stem cell clone gradually dominated the blood compartment, and new subclones were observed preceding MDS/AML (Fig. S13). In NIH075, in whom mutations were fully explored over 12 years, clonal hematopoiesis was shaped by multiple rounds of acquisition of new mutations and clonal selection with progression of thrombocytopenia after initial response to immunosuppressive therapy (Fig. 3C); the original clone characterized by an OR51A4 mutation gave rise to several independent clones carrying ASXL1, EHD2, or coexisting TET2/BCOR mutations (Table S7), some of which appeared and declined, with ultimate emergence of new subclones within the compartment carrying the ASXL1 mutation (Fig. 3D). NIH075 had persistent thrombocytopenia, which was responsive to cyclosporine; on serial marrow samples, megakaryocytes were decreased in number but there was no apparent dysplasia, increased blasts, or cytogenetic abnormalities. In other patients, a dominant clone was compatible with normal or near normal blood counts (NIH044 and NIH169). Nevertheless, DNMT3A, ASXL1, RUNX1, U2AF1-mutated clones tended to continue to expand in size over time, whereas PIGA and BCOR/BCORL1 clones were stable or decreased (Figs. 4, S14).
Figure 3. Temporal Profile of Mutations Detected by WES.

(A-C) Representative secular analysis of somatic mutations and the relationship with peripheral blood counts and response to immunosuppressive therapy. Each case represents blood counts (upper panel) and variant allele frequency of mutations identified by whole exome sequencing (lower panel). Treatment received is shown at the bottom of each panel (CsA = cyclosporine and h/rATG = horse/rabbit antithymocyte globulin). Asterisks indicate the samples not subjected to whole exome sequencing. (D) Chronological history of clonal evolution from the onset to the last follow-up in NIH075. Each mutated gene is depicted in the representative cells. Vertical axis indicates the absolute volume of the clones. Representative mutations in each clone are also presented.
Figure 4. Temporal Profile of Common Mutations in the NIH Cohort.

Variant allele frequency of mutations in frequently affected genes such as (A) BCOR/BCORL1, (B) PIGA, (C) DNMT3A, (D) ASXL1, are plotted for all relevant mutations. Each line indicates the time course of VAFs for an individual mutation and response at 6 months was used to identify complete responders (CR-blue), partial responders (PR-green), and non-responders (NR-red) to immunosuppressive therapy.
DISCUSSION
Through targeted deep sequencing, SNP-array karyotyping, and whole exome sequencing, we delineated a full registry of genetic alterations in aplastic anemia and describe their dynamics over long clinical courses. Combining all assays that we employed, about half of the aplastic anemia patients studied had evidence of expanded hematopoietic cell clones, and about a third had acquired mutations in MDS/AML candidate genes. These results have implications for marrow failure, early events in leukemogenesis, and in normal aging.
Clonal hematopoiesis in aplastic anemia most frequently was manifest as somatic mutations in a very few common driver genes for MDS/AML: DNMT3A, ASXL1, and BCOR/BCORL1 genes. Our findings are consistent with recent studies26-28 that also reported recurrent mutations in a similar spectrum of genes by candidate gene targeted sequencing. In the first publication, mutations were described as rare, but of 39 patients reported, there were two with low variant allele frequency mutations in ASXL1 and one with a DNMT3A mutation26. In two series27,28, in which samples were obtained at various times from diagnosis, mutations in ASXL1, DNMT3A, and BCOR were prevalent in 19% of patients seen at King’s College Hospital (samples obtained relatively late after diagnosis); infrequently in a German survey of 38 patients, in which MDS mutations were found in two (mutations with low variant allele frequency were excluded). Our larger data set, with more consistent collection of samples at specified time points over the course of disease, analysed by whole exome and deep sequencing and confirmation of putative mutations by multiple methods, and the consistency of findings among three cohorts defines a spectrum of genomic abnormalities in aplastic anemia. Results from all research groups concerning the specific genes mutated and their low variant allele frequency in aplastic anemia raise important questions of disease classification, pathophysiology, and clinical practice.
First, despite substantial overlap in recurrently mutated genes between aplastic anemia and MDS, these mutations were generally found in small subpopulations, mostly at <10% variant allele frequencies, at least at 6 months post-therapy, and usually years are required before clones achieve dominance. Different sets of mutations show distinct behavior and clinical effect; BCOR/BCORL1 and PIGA mutant clones tended to disappear or remain small in size, associated with better response to immunosuppressive therapy, and predicted favorable outcomes. In contrast, clones carrying mutations in DNMT3A, ASXL1, and a few other genes, were more likely to increase in size over time, and these mutations, dominated by DNMT3A and ASXL1, as a group associated with poorer response to immunosuppressive therapy, inferior overall survival, and progression to MDS/AML. Thus, in these cases, clonal hematopoiesis may represent the earliest stages of leukemogenesis visualized by deep sequencing before evident neoplastic expansion. Pre-leukemic clones in de novo AML also frequently harbor DNMT3A mutations29,30. The presence of monosomy 7 at 6 months post-therapy also predicted poor overall survival and progression to MDS (Fig. S15).
Second, our results show parallels between bone marrow failure and normal aging of the hematopoietic compartment. The characteristic mutation signature and correlation of mutations to patient age suggested age-related, spontaneous conversion of methylated cytosine (mC) to thymidine at mCpG sites31 as a major source of nucleotide alterations in aplastic anemia32. Similar C to T conversion mutations accumulate in hematopoietic progenitors in healthy individuals (Fig. S11)23-25. Age-related clonal hematopoiesis as detected by SNP-array karyotyping33,34 and exome sequencing24,25,35 was detected in 1–3% of patients with non-hematological malignancies and in healthy individuals, showed strong correlation with age, and associated with a higher risk of developing of subsequent hematological malignancies24,25,33-36. Mutations generally appeared at low variant allele frequency, were predominantly C to T conversions, and involved common mutational targets in myeloid malignancies24,25,33-36, suggesting similar origin and clonal selection of mutations to those in aplastic anemia. The incidence of clonal hematopoiesis was much higher in aplastic anemia patients, and BCOR/BCORL1 and PIGA mutations were overrepresented, whereas TET2 and JAK2 were infrequently mutated, suggesting that distinct mechanisms of clonal selection operate in the aplastic marrow environment. Nevertheless, acquisition of specific mutations (detected by candidate gene sequencing), an increased mutation burden in dominant clones by whole exome sequencing, and accelerated telomere attrition preceding development of MDS/AML37 suggest a common mechanism that links genome aging in marrow failure and in the healthy elderly.
Third, specific mutations seem to have functional relevance. Although observations in mice demonstrate dominance of DNMT3A, ASXL1 and other mutations38,39, the exact mechanism of clonal selection of these mutations in aplastic anemia is unclear. Cells containing DNMT3A or ASXL1 mutations may preferentially self-renew rather than differentiate in response to extrinsic signals, especially abundant in marrow failure. We speculate that clones containing mutated genes that are present in aging bone marrow are selected in marrow failure; the lower prevalence of such clones in healthy elderly compared to aplastic anemia may be due to insensitivity of deep sequencing for very small populations of abnormal cells (as flow cytometry is far more sensitive than is PIGA sequencing to detect small PNH clones). That clones containing DNMT3A or ASXL1 mutations might initiate a pathogenic immune response would seem unlikely given the inverse correlation of their presence and response to immunosuppressive therapy. In contrast, the striking overrepresentation of BCOR/BCORL1 and PIGA mutations as well as frequent 6pUPD involving specific HLA classes9 suggest a mechanism of protection of mutated cells from immune-mediated destruction by pathogenic T cells40,41. Stratification in our models was enhanced if patients who had a mixed pattern of both favorable and unfavorable mutations were grouped in the favorable gene set for early outcomes (response to therapy, overall survival) and with unfavorable genes for later progression-free survival, consistent with the dynamics of their clonal behavior over time and presumed functionality.
Finally, despite the association of particular gene mutations observed early in the course of disease and response to therapy and survival, it should be underscored that the complex dynamics of clonal hematopoiesis are highly variable and not necessarily determinative. Monosomy 7 can develop in the absence of candidate gene mutations in aplastic anemia patients37, and virtually monoclonal hematopoiesis, including multiple unfavorable mutations, can be present in patients who respond to immunosuppressive therapy, maintain good blood counts, and have prolonged survival. Close monitoring of clonal hematopoiesis by both deep sequencing and SNP-array will need to be combined with clinical evaluation for prognosis and to guide management of patients with aplastic anemia.
Supplementary Material
Acknowledgments:
This research was supported by the Intramural Research Program of the National Heart, Lung, and Blood Institute and by Grants-in-Aid from the Ministry of Health, Labor and Welfare of Japan and KAKENHI (22134006, 23249052, 26253060 and 26221308) and by the Japan Society for the Promotion of Science (JSPS) through the Funding Program for World-Leading Innovative Research and Development on Science and Technology (FIRST Program) and a grant from the AA & MDS International Foundation, a research grant from the Scott Hamilton CARES initiative. We thank Xingmin Feng, Andre LaRochelle, and Christopher Hourigan for their careful reading of the manuscript and S. Wong, Y. Mori, M. Nakamura, and H. Higashi for technical assistance.
Footnotes
Disclosure:
Disclosure forms provided by the authors are available with the full text of this article at NEJM.org.
Sequencing data accession code:
Sequencing and genotype data have been deposited in the European Genome-phenome Archive (EGA) under accession EGAS00001001153.
References
- 1.Young NS, Calado RT, Scheinberg P. Current concepts in the pathophysiology and treatment of aplastic anemia. Blood 2006;108:2509–19. [DOI] [PMC free article] [PubMed] [Google Scholar]
- 2.Scheinberg P, Young NS. How I treat acquired aplastic anemia. Blood 2012;120:1185–96. [DOI] [PMC free article] [PubMed] [Google Scholar]
- 3.Scheinberg P, Nunez O, Weinstein B, et al. Horse versus rabbit antithymocyte globulin in acquired aplastic anemia. The New England journal of medicine 2011;365:430–8. [DOI] [PMC free article] [PubMed] [Google Scholar]
- 4.Socie G, Rosenfeld S, Frickhofen N, Gluckman E, Tichelli A. Late clonal diseases of treated aplastic anemia. Seminars in hematology 2000;37:91–101. [PubMed] [Google Scholar]
- 5.Maciejewski JP, Selleri C, Sato T, Anderson S, Young NS. A severe and consistent deficit in marrow and circulating primitive hematopoietic cells (long-term culture-initiating cells) in acquired aplastic anemia. Blood 1996;88:1983–91. [PubMed] [Google Scholar]
- 6.Mortazavi Y, Chopra R, Gordon-Smith EC, Rutherford TR. Clonal patterns of X-chromosome inactivation in female patients with aplastic anaemia studies using a novel reverse transcription polymerase chain reaction method. Eur J Haematol 2000;64:385–95. [DOI] [PubMed] [Google Scholar]
- 7.Afable MG 2nd, Wlodarski M, Makishima H, et al. SNP array-based karyotyping: differences and similarities between aplastic anemia and hypocellular myelodysplastic syndromes. Blood 2011;117:6876–84. [DOI] [PMC free article] [PubMed] [Google Scholar]
- 8.Mikhailova N, Sessarego M, Fugazza G, et al. Cytogenetic abnormalities in patients with severe aplastic anemia. Haematologica 1996;81:418–22. [PubMed] [Google Scholar]
- 9.Katagiri T, Sato-Otsubo A, Kashiwase K, et al. Frequent loss of HLA alleles associated with copy number-neutral 6pLOH in acquired aplastic anemia. Blood 2011;118:6601–9. [DOI] [PubMed] [Google Scholar]
- 10.Yoshida K, Sanada M, Shiraishi Y, et al. Frequent pathway mutations of splicing machinery in myelodysplasia. Nature 2011;478:64–9. [DOI] [PubMed] [Google Scholar]
- 11.Nannya Y, Sanada M, Nakazaki K, et al. A robust algorithm for copy number detection using high-density oligonucleotide single nucleotide polymorphism genotyping arrays. Cancer research 2005;65:6071–9. [DOI] [PubMed] [Google Scholar]
- 12.Yamamoto G, Nannya Y, Kato M, et al. Highly sensitive method for genomewide detection of allelic composition in nonpaired, primary tumor specimens by use of affymetrix single-nucleotide-polymorphism genotyping microarrays. American journal of human genetics 2007;81:114–26. [DOI] [PMC free article] [PubMed] [Google Scholar]
- 13.Ishwaran H, Kogalur UB, Blackstone EH, Lauer MS. Random Survival Forests. Ann Appl Stat 2008;2:841–60. [Google Scholar]
- 14.Simon N, Friedman J, Hastie T, Tibshirani R. Regularization Paths for Cox’s Proportional Hazards Model via Coordinate Descent. J Stat Softw 2011;39:1–13. [DOI] [PMC free article] [PubMed] [Google Scholar]
- 15.Ley TJ, Ding L, Walter MJ, et al. DNMT3A mutations in acute myeloid leukemia. The New England journal of medicine 2010;363:2424–33. [DOI] [PMC free article] [PubMed] [Google Scholar]
- 16.Gelsi-Boyer V, Trouplin V, Adelaide J, et al. Mutations of polycomb-associated gene ASXL1 in myelodysplastic syndromes and chronic myelomonocytic leukaemia. Br J Haematol 2009;145:788–800. [DOI] [PubMed] [Google Scholar]
- 17.Damm F, Chesnais V, Nagata Y, et al. BCOR and BCORL1 mutations in myelodysplastic syndromes and related disorders. Blood 2013;122:3169–77. [DOI] [PubMed] [Google Scholar]
- 18.Mortazavi Y, Merk B, McIntosh J, et al. The spectrum of PIG-A gene mutations in aplastic anemia/paroxysmal nocturnal hemoglobinuria (AA/PNH): a high incidence of multiple mutations and evidence of a mutational hot spot. Blood 2003;101:2833–41. [DOI] [PubMed] [Google Scholar]
- 19.Nafa K, Bessler M, Castro-Malaspina H, Jhanwar S, Luzzatto L. The spectrum of somatic mutations in the PIG-A gene in paroxysmal nocturnal hemoglobinuria includes large deletions and small duplications. Blood cells, molecules & diseases 1998;24:370–84. [DOI] [PubMed] [Google Scholar]
- 20.Haferlach T, Nagata Y, Grossmann V, et al. Landscape of genetic lesions in 944 patients with myelodysplastic syndromes. Leukemia 2014;28:241–7. [DOI] [PMC free article] [PubMed] [Google Scholar]
- 21.Scheinberg P, Wu CO, Nunez O, Young NS. Predicting response to immunosuppressive therapy and survival in severe aplastic anaemia. Br J Haematol 2009;144:206–16. [DOI] [PMC free article] [PubMed] [Google Scholar]
- 22.Scheinberg P, Cooper JN, Sloand EM, Wu CO, Calado RT, Young NS. Association of telomere length of peripheral blood leukocytes with hematopoietic relapse, malignant transformation, and survival in severe aplastic anemia. JAMA 2010;304:1358–64. [DOI] [PMC free article] [PubMed] [Google Scholar]
- 23.Welch JS, Ley TJ, Link DC, et al. The origin and evolution of mutations in acute myeloid leukemia. Cell 2012;150:264–78. [DOI] [PMC free article] [PubMed] [Google Scholar]
- 24.Jaiswal S, Fontanillas P, Flannick J, et al. Age-related clonal hematopoiesis associated with adverse outcomes. The New England journal of medicine 2014;371:2488–98. [DOI] [PMC free article] [PubMed] [Google Scholar]
- 25.Genovese G, Kahler AK, Handsaker RE, et al. Clonal hematopoiesis and blood-cancer risk inferred from blood DNA sequence. The New England journal of medicine 2014;371:2477–87. [DOI] [PMC free article] [PubMed] [Google Scholar]
- 26.Lane AA, Odejide O, Kopp N, et al. Low frequency clonal mutations recoverable by deep sequencing in patients with aplastic anemia. Leukemia 2013;27:968–71. [DOI] [PMC free article] [PubMed] [Google Scholar]
- 27.Kulasekararaj AG, Jiang J, Smith AE, et al. Somatic mutations identify a sub-group of aplastic anemia patients that progress to myelodysplastic syndrome. Blood 2014. [DOI] [PMC free article] [PubMed] [Google Scholar]
- 28.Heuser M, Schlarmann C, Dobbernack V, et al. Genetic characterization of acquired aplastic anemia by targeted sequencing. Haematologica 2014;99:e165–7. [DOI] [PMC free article] [PubMed] [Google Scholar]
- 29.Shlush LI, Zandi S, Mitchell A, et al. Identification of pre-leukaemic haematopoietic stem cells in acute leukaemia. Nature 2014;506:328–33. [DOI] [PMC free article] [PubMed] [Google Scholar]
- 30.Yasuda T, Ueno T, Fukumura K, et al. Leukemic evolution of donor-derived cells harboring IDH2 and DNMT3A mutations after allogeneic stem cell transplantation. Leukemia 2014;28:426–8. [DOI] [PubMed] [Google Scholar]
- 31.Lander ES, Linton LM, Birren B, et al. Initial sequencing and analysis of the human genome. Nature 2001;409:860–921. [DOI] [PubMed] [Google Scholar]
- 32.Alexandrov LB, Nik-Zainal S, Wedge DC, et al. Signatures of mutational processes in human cancer. Nature 2013;500:415–21. [DOI] [PMC free article] [PubMed] [Google Scholar]
- 33.Jacobs KB, Yeager M, Zhou W, et al. Detectable clonal mosaicism and its relationship to aging and cancer. Nature genetics 2012;44:651–8. [DOI] [PMC free article] [PubMed] [Google Scholar]
- 34.Laurie CC, Laurie CA, Rice K, et al. Detectable clonal mosaicism from birth to old age and its relationship to cancer. Nature genetics 2012;44:642–50. [DOI] [PMC free article] [PubMed] [Google Scholar]
- 35.Xie M, Lu C, Wang J, et al. Age-related mutations associated with clonal hematopoietic expansion and malignancies. Nature medicine 2014;20:1472–8. [DOI] [PMC free article] [PubMed] [Google Scholar]
- 36.Busque L, Patel JP, Figueroa ME, et al. Recurrent somatic TET2 mutations in normal elderly individuals with clonal hematopoiesis. Nature genetics 2012;44:1179–81. [DOI] [PMC free article] [PubMed] [Google Scholar]
- 37.Dumitriu B, Feng X, Townsley DM, et al. Telomere attrition and candidate gene mutations preceding monosomy 7 in aplastic anemia. Blood 2015;125:706–9. [DOI] [PMC free article] [PubMed] [Google Scholar]
- 38.Challen GA, Sun D, Jeong M, et al. Dnmt3a is essential for hematopoietic stem cell differentiation. Nature genetics 2012;44:23–31. [DOI] [PMC free article] [PubMed] [Google Scholar]
- 39.Abdel-Wahab O, Gao J, Adli M, et al. Deletion of Asxl1 results in myelodysplasia and severe developmental defects in vivo. The Journal of experimental medicine 2013;210:2641–59. [DOI] [PMC free article] [PubMed] [Google Scholar]
- 40.Murakami Y, Kosaka H, Maeda Y, et al. Inefficient response of T lymphocytes to glycosylphosphatidylinositol anchor-negative cells: implications for paroxysmal nocturnal hemoglobinuria. Blood 2002;100:4116–22. [DOI] [PubMed] [Google Scholar]
- 41.Gargiulo L, Papaioannou M, Sica M, et al. Glycosylphosphatidylinositol-specific, CD1d-restricted T cells in paroxysmal nocturnal hemoglobinuria. Blood 2013;121:2753–61. [DOI] [PubMed] [Google Scholar]
Associated Data
This section collects any data citations, data availability statements, or supplementary materials included in this article.