

Abstract
In the past 30 years, dengue has undergone dramatic changes in China every year. This study explores the epidemiological trend of dengue in China during this period to identify high-risk seasons, regions, ages, susceptible populations, and provide information for dengue prevention and control activities.
Dengue data from 1990 to 2019 were derived from the Public Health Science Data Center, Web of Science, China National Knowledge Infrastructure, PubMed, and Centers for Disease Control and Prevention of the corresponding province. GraphPad Prism 7 was conducted to generate disease evolution maps, occupational heat maps, and monthly heat maps of dengue cases and deaths in mainland China and Guangdong Province. Excel 2016 was used to create a cyclone map of age and gender distribution. Powerpoint 2016 was performed to create geographic maps.
From 1990 to 2019, the annual number of dengue cases showed an increasing trend and reaching a peak in 2014, with 46,864 dengue cases (incidence rate: 3.4582/100,000), mainly contributed by Guangdong Province (45,189 cases, accounting for 96.43%). Dengue pandemics occurred every 4 to 6 years. The prevalence of dengue fever was Autumn, which was generally prevalent from June to December and reached its peak from September to November. The provinces reporting dengue cases each year have expanded from the southeastern coastal region to the southwest, central, northeast, and northwest regions, and the provinces with a high incidence were Guangdong, Guangxi, Yunnan, Fujian, and Zhejiang. People aged 25 to 44 years were more susceptible to dengue virus infection. And most of them were male patients. Dengue mainly occurs in the following groups: students, business service staffs, workers, farmers, retired staffs, housewives, and the unemployed. Four provinces reported deaths from dengue, namely Guangdong Province, Zhejiang Province, Henan Province, and Hunan Province.
The dengue fever epidemic occurred every 4 to 6 years, mostly in autumn. The endemic areas were Guangdong, Guangxi, Yunnan, Fujian, and Zhejiang provinces. People aged 25 to 44 years, men, students, business service staffs, workers, farmers, retired staffs, housewives, and the unemployed were more susceptible to dengue fever. These findings help to develop targeted public health prevention and control measures.
Keywords: China, dengue, epidemiology, incidence, mortality rate
1. Introduction
Dengue is a mosquito-borne viral infection that has increased 30-fold in the past 50 years due to large-scale migration of the population, the lack of adequate vaccines and effective drugs,[1] and is expected to affect 390 million people worldwide each year, of which 96 million suffers manifest apparently.[2] It is estimated that 2.5 billion to 4 billion people live in countries or regions where dengue virus transmission, and over 70% of high-risk populations live in the Asia-Pacific region, making this region the epicenter of the global dengue epidemic.[3] In addition, due to climate change, international trade, tourism, urban congestion, and vector control failures, the spread of dengue is global.[4,5] This has caused a large economic burden on society and individuals around the world. It is estimated that the average annual total cost of dengue worldwide is estimated at $8.9 billion [95% confidence interval (95% CI): $3.7 billion–$19.7 billion], with inpatients spending about $70.10 per case (95% CI: $66.66–$74.63) and outpatients spending $51.16 per case (95% CI: $49.80–$53.71).[6] The average cost of dengue in the Americas is $2.1 billion per year, compared with $950 million in Southeast Asia, which exceeds the cost of other viral diseases.[7,8]
The terrain of China is high in the west and low in the west. The coastline of the eastern and southern continents exceeds 18 400 kilometers. East China is plains and hills, with an area of more than 2 million square kilometers and an elevation of less than 1000 meters. The southern part of the “Qinling-Huaihe” has a subtropical tropical climate, with an average annual temperature of more than 15°C, and a daily average temperature of more than 20°C in summer and autumn.[9] In recent years, dengue cases have increased dramatically in many provinces of mainland China, and many epidemics have occurred in some provinces, such as Fujian, Guangxi, Hainan, and Yunnan provinces.[10] These provinces are distributed in the southeast, with high temperature, abundant rainfall, and busy trade exchanges with neighboring southeast Asian countries.[11] According to 2014 epidemiological data in Guangzhou, the outbreak of dengue fever is also positively correlated with land type, daytime land surface temperature, nighttime land surface temperature, population density, and Gross Domestic Product (GDP) (correlation coefficients were 0.48, 0.61, 0.70, 0.71, and 0.21, respectively).[12] In response to the outbreak of dengue, on September 1, 1989, dengue became a disease that should be regularly reported in China, which helped to reduce the huge economic burden of the national economy, the health care sector, and people's lives.[13,14] However, due to the uneven development of different regions, diverse climate characteristics, and differences in medical and health conditions, there are some differences in the epidemiological characteristics of dengue in different provinces in China.[15] In this study, we describe the scale and distribution of dengue in mainland China according to the notifiable reporting data, focusing on the time and geographical patterns from 1990 to 2019, comparing the seasonal and monthly distribution of dengue between Guangdong Province and mainland China, and analyzing the age, gender, and occupational distribution of dengue during the period from 2010 to 2017, to identify high-risk areas, months, and populations to help prevent and control dengue.
2. Materials and methods
The dengue epidemiological data from 1990 to 2017 were supported by the Public Health Science Data Sharing Center of the National Population and Health Science Data Sharing Service Platform. The dengue epidemiological data for 2018 to 2019 were derived from publicly published databases, such as Web of Science, China National Knowledge Infrastructure, and PubMed.
2.1. Data sources
Dengue fever has become a statutorily notifiable epidemic in China since September 1, 1989. In this study, the dengue epidemiological data from 1990 to 2017 were derived from the Public Health Science Data Center (http://www.phsciencedata.cn/Share/), covering the number, incidence rate, death, and mortality rate of dengue in 22 provinces, 4 municipalities, and 5 autonomous regions of mainland China. The data were proofread according to the “National Legal Infectious Disease Epidemic Situation” issued by the Chinese Center for Disease Control and Prevention (http://www.nhfpc.gov.cn/jkj/s3578/new_list.shtml). The missing data for some provinces in 2018 to 2019 were derived from studies published by Web of Science (http://apps.webofknowledge.com/), China National Knowledge Infrastructure (http://kns.cnki.net), PubMed (https://www.ncbi.nlm.nih.gov/pubmed/), and were verified by the Centers for Disease Control and Prevention of the corresponding province. Data on age, gender, and occupation distribution of dengue from 2010 to 2017 were obtained from the Public Health Science Data Center. Altitude of provinces in China was retrieved from the 360 personal libraries (http://www.360doc.com/content/17/0211/22/193203_628331100.shtml). Besides, we retrieved the mean annual temperature of China from OSGeo China Center (https://www.osgeo.cn/map/m0401).
2.2. Case definitions
Dengue cases were diagnosed according to the unified diagnostic criteria issued by the National Health Commission of the People's Republic of China, including clinically diagnosed and laboratory confirmed cases, which experienced 4 versions during different periods from 1990 to 2019.[15–18] Possible cases are diagnosed by experienced doctors based on epidemiological exposure and clinical manifestations of the case.[16–19] Confirmed cases are clinically diagnosed cases and the relevant laboratory results, such as enzymelinkedimmunosorbentassay, NS1 antigen or polymerase chain reaction, and etc, are detected by the local public health institutes.[16–19] In the notifiable disease database, the included dengue cases did not report their disease severity and distinguish possible or confirmed cases.
2.3. Data analysis
Dengue cases from January 1, 1990, to December 30, 2019, were included in the analysis. The crude incidence rate was estimated as the number of possible and confirmed cases divided by the number of people at the end of each year issued by the National Bureau of Statistics of China. GraphPad Prism 7 was used to generate disease evolution maps and heat maps to show epidemiological changes and occupational distribution of dengue. To compare the number of cases and deaths of dengue per month in mainland China and Guangdong Province, we also used GraphPad Prism 7 to create heat maps. Excel 2016 was used to create a cyclone map to clarify the age and gender distribution of the disease. To distinguish the spatial distribution of disease, we used Powerpoint 2016 to create geographic maps.
3. Results
3.1. Annual epidemiological changes
Annual distribution of dengue cases in mainland China from 1990 to 2019 is shown in Fig. 1. As shown in Fig. 1A, dengue fever has been reported in mainland China every year since 1990, with an epidemic every 4 to 6 years. The number of annual dengue cases increased overall between 1990 and 2019, but there were some fluctuations. The period could be divided into the 3 time intervals: the first interval ran from 1990 to 1995, the second interval ran from 1996 to 2012, and the third interval ran from 2013 to 2019. The period from 1990 to 1995 was a steady development period, with annual dengue cases from 2 to 6836, and the incidence increased from 0.0002/100,000 (0.0002 case per one million residents) to 0.5772/100,000. The second period from 1996 to 2012 was a relatively stable period, with approximately 400 cases of dengue each year. During this period, the number of cases of dengue was high in 1999, 2002, and 2006, with more than 1000 cases per year, and the highest incidence rate was 0.1504/100,000. The period from 2013 to 2019 was a rapid development period. In 2013, there were 4663 dengue cases, which increased to 46,864 cases in 2014, and remained more than 2000 cases per year thereafter. The incidence rate also increased from 0.3444/100,000 to 3.4582/100,000, and remained above 0.14/100,000.
Figure 1.
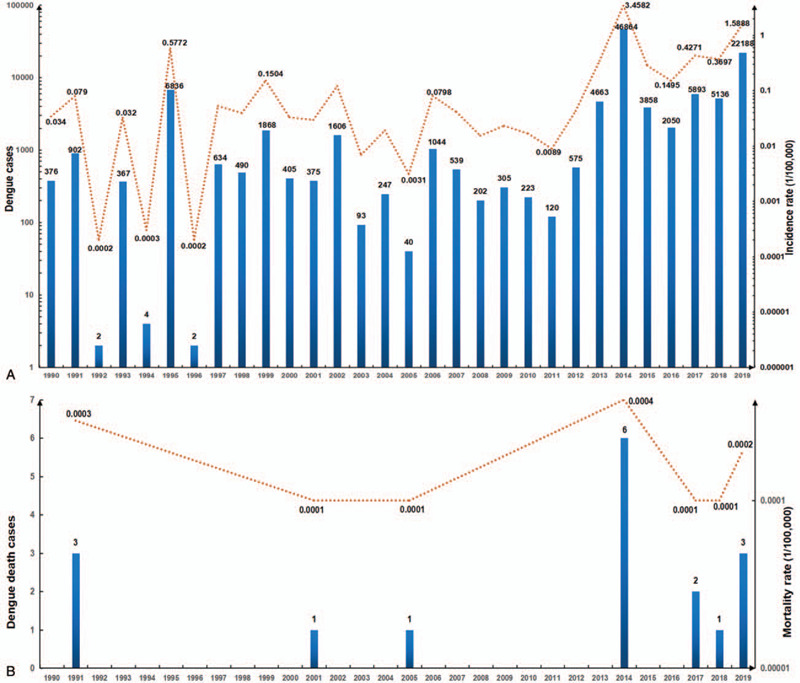
Annual distribution of dengue cases in mainland China from 1990 to 2019. (A. Annual dengue cases and incidence rate; B. Annual dengue death cases and mortality rate.).
As shown in Fig. 1B, there were few deaths due to dengue in 1990 to 2019, which occurred in 1991, 2001, 2005, 2014, 2017, 2018, and 2019. However, the time interval between dengue deaths was shortened, indicating that the possibility of death from dengue fever was increasing. The number of deaths reached the highest in 2014, with 6 deaths and a death rate of 0.0004/100,000.
3.2. Geographic distribution of dengue cases
The spatial and temporal distribution of dengue cases in mainland China from 1990 to 2019 is shown in Fig. 2 . From 1990 to 2000, dengue cases were mainly reported in the southeastern coastal areas and southwestern regions, involving 1 to 5 provinces, mainly in the southeastern coastal areas of Guangdong Province. From 2001 to 2007, the provinces reporting dengue cases each year expanded further from the southeastern coastal areas to the southwestern, central, and northeastern regions, involving 5 to 14 provinces per year, and the scope gradually increased. From 2008 to 2019, provinces reporting dengue cases each year rapidly expanded to the northwest regions, involving 16 to 27 provinces, municipalities, or autonomous regions, suggesting that dengue swept most of mainland China. From 1990 to 2019, only the Tibet Autonomous Region did not report dengue cases.
Figure 2.
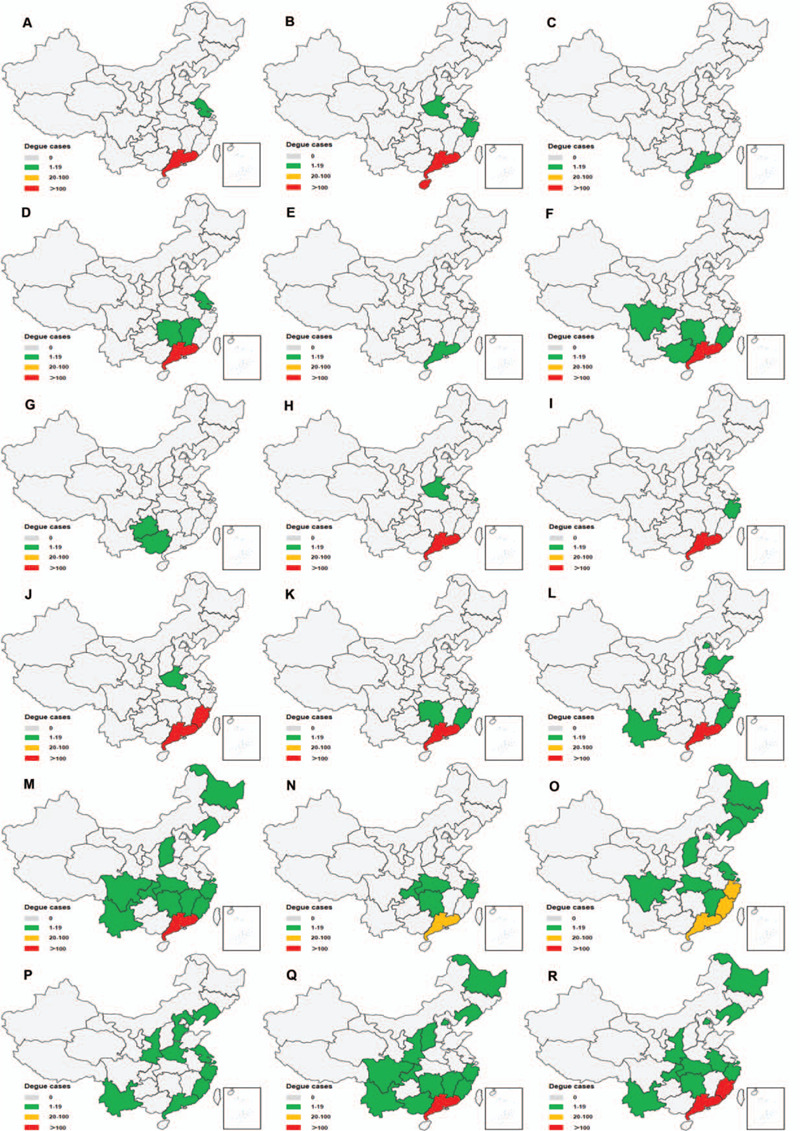
The spatial and temporal distribution of dengue cases in mainland China from 1990 to 2019. (A. 1990; B. 1991; C. 1992; D. 1993; E. 1994; F. 1995; G. 1996; H. 1997; I. 1998; J. 1999; K. 2000; L. 2001; M. 2002; N. 2003; O. 2004; P. 2005; Q. 2006; R.2007; S. 2008; T. 2009; U. 2010; V. 2011; W. 2012; X. 2013; Y. 2014; Z. 2015; AA. 2016; AB. 2017; AC. 2018; AD. 2019; AE. Altitude of provinces in China; AF. Mean annual temperature of China).
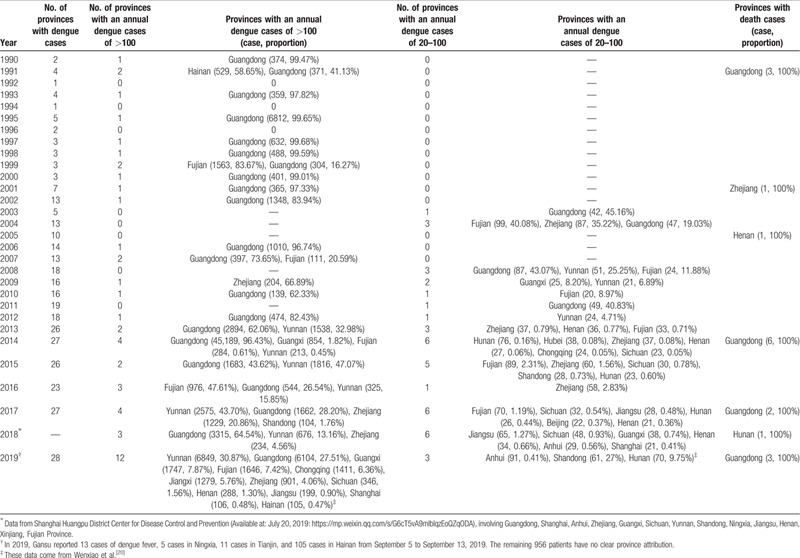
Geographic distribution of dengue cases in mainland China from 1990 to 2019 is represented in Table 1.[20] According to Fig. 2 and Table 1, the number of provinces with dengue cases in mainland China from 1990 to 2019 showed a rapid upward trend. From 1990 to 2012, the provinces with an annual dengue cases of >100 were mainly distributed in the southeast coast, with no more than 2 provinces, and the province with the most occurrences is Guangdong. In 2013 to 2019, the number of provinces with an annual dengue cases of >100 increased rapidly, mainly in the southeast coast, southwest and central regions, involving Guangdong Province, Guangxi Zhuang Autonomous Region, Yunnan Province, Fujian Province, Zhejiang Province, Shandong Province, Chongqing Province, Jiangxi Province, Sichuan Province, Henan Province, Jiangsu Province, Shanghai City, and Hainan Province. In particular, Guangdong Province, Guangxi Zhuang Autonomous Region, Yunnan Province, Fujian Province, Zhejiang Province showed a high incidence trend. In 1990 to 2002 and 2005 to 2007, there were no provinces with 20 to 100 cases of dengue per year. In 2003, Guangdong Province was the first province with annual dengue cases of 20 to 100, which located in the southeast coast. In 2004, it was extended to surrounding provinces, covering Fujian, Zhejiang, and Guangdong Provinces. The provinces with 20 to 100 cases of dengue cases in 2008 to 2012 were distributed in the southeast and southwest regions, involving Guangdong Province, Fujian Province, and Yunnan Province. The number of provinces with an annual dengue cases of 20 to 100 increased in 2013 to 2019, involving up to 6 provinces, mainly in the southeast, central, and southwest regions.
Table 1.
Geographic distribution of dengue cases in mainland China from 1990 to 2019.
3.3. Geographic distribution of dengue death
Geographic distribution of dengue deaths in mainland China from 1990 to 2019 is represented in Fig. 3. According to Fig. 3 and Table 1, a total of 4 provinces reported deaths from dengue, namely Guangdong Province, Zhejiang Province, Henan Province, and Hunan Province. Guangdong Province reported a total of 11 deaths from dengue, which occurred in 1991 (3 deaths), 2014 (6 deaths), 2017 (2 deaths), and 2019 (3 deaths). In 2001, 2005, and 2018, Zhejiang Province, Henan Province, and Hunan Province, respectively, experienced 1 death of dengue. This is almost consistent with the peak incidence of dengue fever.
Figure 2 (Continued).
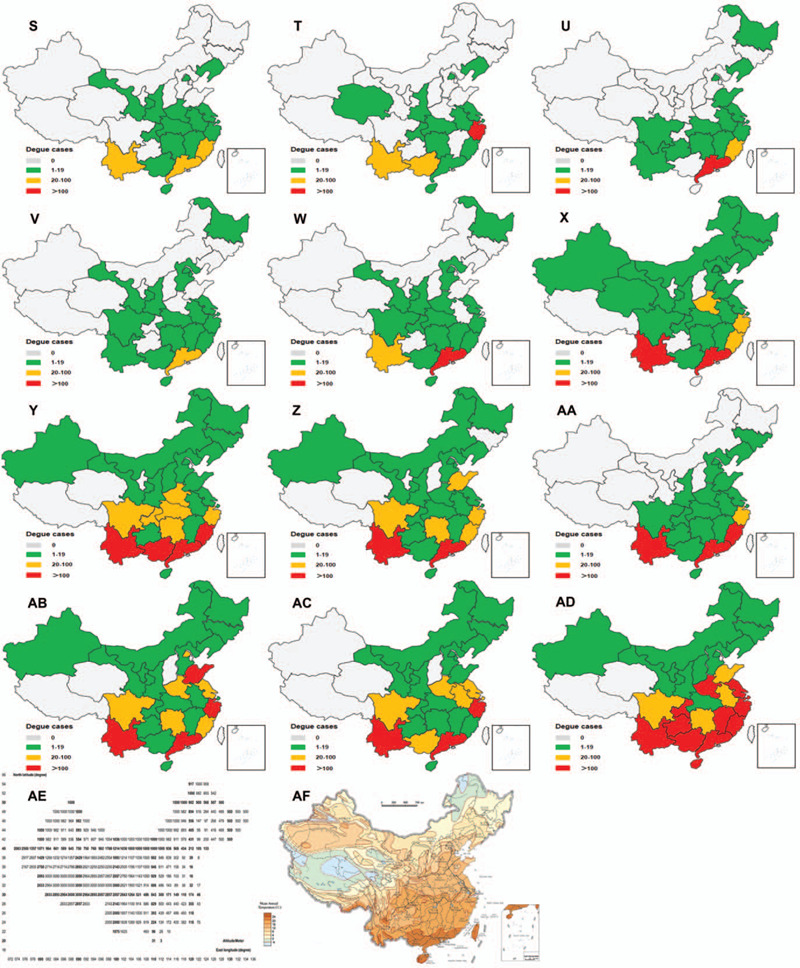
The spatial and temporal distribution of dengue cases in mainland China from 1990 to 2019. (A. 1990; B. 1991; C. 1992; D. 1993; E. 1994; F. 1995; G. 1996; H. 1997; I. 1998; J. 1999; K. 2000; L. 2001; M. 2002; N. 2003; O. 2004; P. 2005; Q. 2006; R.2007; S. 2008; T. 2009; U. 2010; V. 2011; W. 2012; X. 2013; Y. 2014; Z. 2015; AA. 2016; AB. 2017; AC. 2018; AD. 2019; AE. Altitude of provinces in China; AF. Mean annual temperature of China).
3.4. Seasonal and monthly distribution of dengue cases in mainland China and Guangdong province
In order to compare the number of cases and deaths of dengue per season and per month in mainland China and Guangdong Province from 1990 to 2019, we produced heat maps for visual analysis, as shown in Fig. 4. Summer and Autumn were found to be the season of large-scale epidemic of dengue fever in mainland China and Guangdong Province, especially Autumn (Fig. 4A and 4B). Further analysis of the monthly distribution of dengue fever revealed that the prevalence of dengue fever was from June to December each year, and reached its peak from September to November (Fig. 4C). This phenomenon appeared once in 1995, and was more obvious from 2011 to 2019. Before 2010, there were few reports of dengue in China from January to May and December. After 2011, this phenomenon was replaced by many cases of dengue every month throughout the year. Guangdong Province has similar morbidity characteristics. The period from August to November was a high incidence of dengue in Guangdong Province, especially in September and October (Fig. 4D). This phenomenon was particularly evident in 2014, indicating that Guangdong Province was the major contributor of dengue cases in mainland China. Moreover, the annual dengue epidemic has gradually increased from January to October and has gradually declined from November to December. In terms of monthly distribution of dengue deaths (Fig. 4E and 4F), the overall trend of Guangdong Province was highly consistent with that of mainland China, mainly in September and October, indicating that Guangdong Province was the major contributor of dengue deaths in mainland China.
Figure 3.
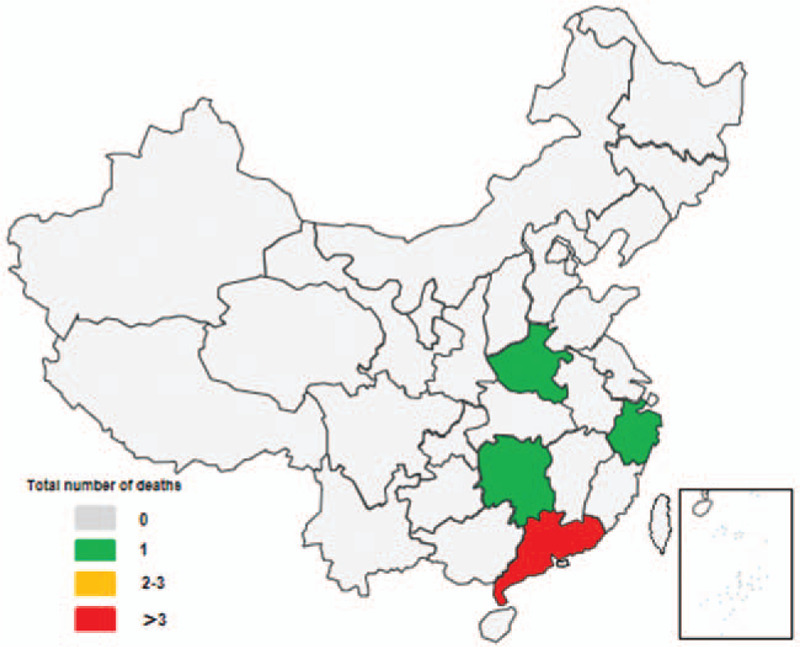
Geographic distribution of dengue deaths in mainland China from 1990 to 2019.
3.5. Age, gender and occupational distribution of dengue
The age, gender, and occupational distribution of dengue cases in mainland China from 2010 to 2017 are shown in Fig. 5. As shown in Fig. 5A, from 0 to 30 years old, dengue cases showed an increasing trend with age, and more male patients than female patients. From 30 to 100 years old, dengue cases show a decreasing trend with age, and more women than men, except for those aged 30 to 34 years. Young people aged 25 to 29 years have the highest number of dengue per year (male: 489.38, female: 455.00), followed by young people aged 30 to 34 years (male: 446.63, female: 412.25), the third was people aged 40 to 44 years (male: 383.25, female: 383.75). As shown in Fig. 5B, dengue mainly occurs in the following groups: students, business service staffs, workers, farmers, retired staffs, housewives, and the unemployed, especially in 2013 to 2017.
Figure 4.
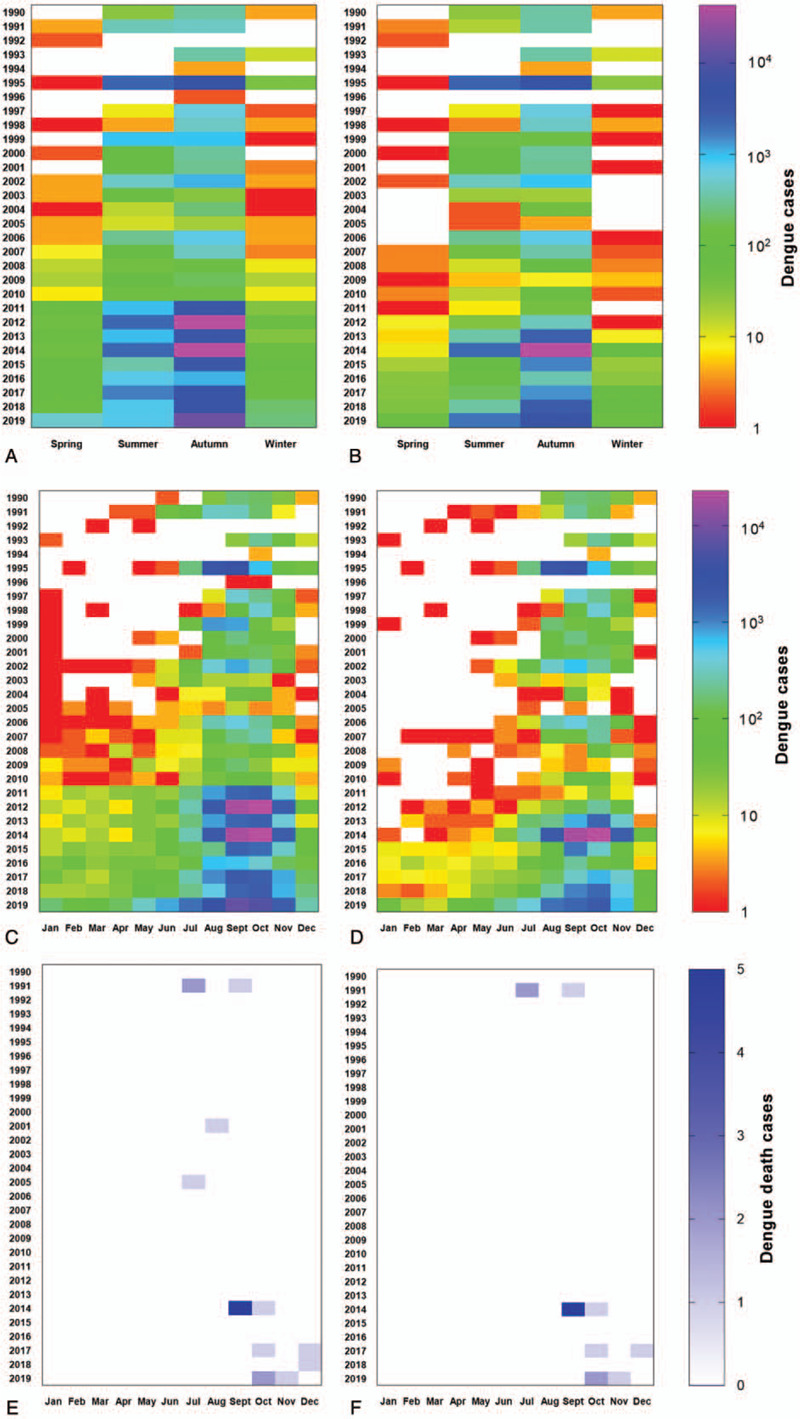
Seasonal and monthly distribution of dengue cases in mainland China and Guangdong Province from 1990 to 2019. (A. Seasonal distribution of dengue cases in mainland China: winter was from December to February, spring was from March to May, summer was from June to August, autumn was from September to November; B. Seasonal distribution of dengue cases in Guangdong Province; C. Monthly distribution of dengue cases in mainland China; D. Monthly distribution of dengue cases in Guangdong Province; E. Number of dengue deaths in mainland China; F. Number of dengue deaths in Guangdong Province.).
Figure 5.
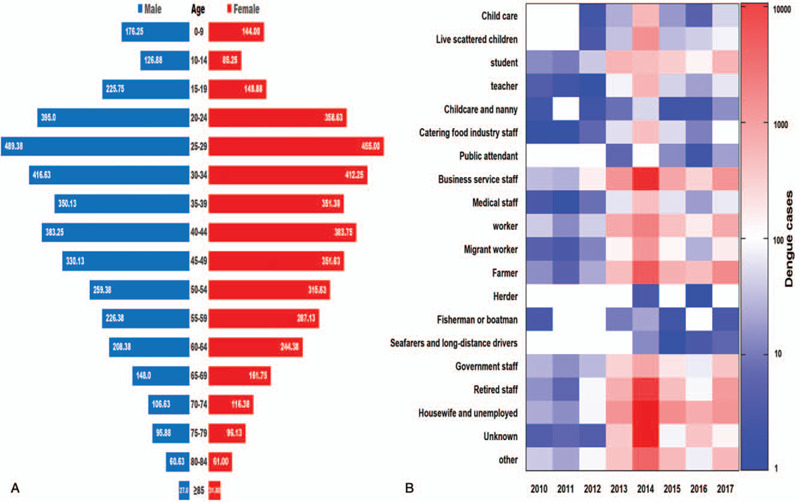
Age, gender, and occupational distribution of dengue cases in mainland China from 2010 to 2017 (A. Age and gender distribution of annual average dengue cases; B. Occupational distribution of dengue cases).
4. Discussion
4.1. Overall incidence of dengue
From 1990 to 2019, the annual number of dengue cases showed an increasing trend. Since 2013, the annual number of dengue cases has been more than 2000, with the incidence rate above 0.14/100,000. However, it has been found that the reported cases of dengue fever in China were much lower than many other countries in the world. For example, the World Health Organization reported 187,333 cases of dengue fever in Southeast Asia in 2010, compared with 223 cases (0.12%) in China.[8] Besides, the number of cases of dengue fever in China was significantly lower than that in the same latitude of the American countries or Africa areas, where an average of over 100,000 cases were reported per year.[21] In this study, we also found that dengue fever cases reported in mainland China reached a peak in 2014, with a total of 46,864 cases (incidence rate: 3.4582/100,000), which mainly contributed by Guangdong Province (45,189 cases, accounting for 96.43%). Cheng et al[22] found that the interaction of climate, intervention, and imported cases was the determining factor for the 2014 dengue epidemic in Guangzhou, Guangdong Province, which contributed 80.2% of dengue cases in mainland China. Li Geng[1] sequenced the envelope (E) gene sequences of 17 viral strains isolated from serum samples from 168 dengue patients in Guangzhou, and found that 6 genotype I were from Thailand, 2 genotype I were from Malaya Peninsula, and 9 genotype I were from Malaysia. Lai et al[13] also believes that the increase in the number of reported dengue cases between 1990 and 2014 may be due to changes in diagnostic criteria and case definitions, which introduces more sensitive and rapid laboratory tests. At the same time, we observed that the epidemic season for dengue fever was autumn. This seasonal pattern was different from Latin America, such as Brazil, which was mainly prevalent in summer. Previous studies have found that this is due to the high temperature and heavy rainfall in summer in Brazil, and the different intensity of vector control activities.[23] In terms of months, June to December was the main period for dengue outbreaks in mainland China, and reached its peak from September to November. Previous studies have reported that the prevalence of dengue was closely related to temperature.[11] When the temperature was between 25°C and 28°C, the risk of dengue transmission was the highest.[11] From September to November, the temperature in many provinces in mainland China was still above 18°C, which may was the threshold that mosquitoes cannot transmit the virus. A recent study on the relationship between dengue cases and meteorological factors in Cali, Colombia, also found a strong correlation between dengue cases and the minimum temperature threshold of 18.0°C.[24] Similarly, Chuan et al[25] analyzed the cases of dengue fever in Guangzhou from 2006 to 2014 and found that 18.25°C was the threshold between the current month's minimum temperature and the incidence of dengue fever. Sun et al[10] observed that the outbreak of dengue between September and November was due to almost all indigenous cases occurring during this period. In addition, our study shows that the overall trend of Guangdong Province was highly consistent with that of mainland China. Li et al[26] conducted a sensitivity analysis and found that delayed mosquito control, continued importation, the spread of asymptomatic dengue infection, and abnormally high precipitation made Guangdong Province a major contributor to dengue in the mainland Chinese.
4.2. Geographic distribution of dengue
From 1990 to 2019, the provinces reporting dengue cases each year expanded from the southeastern coastal region to the southwest, central, northeast, and northwest regions, and the number of provinces increased each year. This result was similar to previous studies.[27] Ning[28] believes that with the warming of the climate, the distribution area of the media was expands, which leads to the expansion of the distribution area of dengue. At the same time, the prevalence of dengue was caused by the general susceptibility of people in the expanded areas and the insufficient awareness of public protection. In addition, the prevalence of dengue is positively correlated with the average minimum temperature, average precipitation, average sunshine time, GDP, and population density.[28] Guzman and Harris[3] found that a large proportion of dengue cases in southeast coastal areas were imported from countries in southeast Asia, Africa, the Americas, and Oceania. Wu et al[29] observed that the high incidence of dengue in the southwestern region was caused by trade and free marriage with a large number of foreigners. Our study also found that a total of 4 provinces reported deaths from dengue, namely Guangdong Province, Zhejiang Province, Henan Province, and Hunan Province. Among them, Guangdong Province reported the largest number of deaths in 2014, with 6 cases. This is lower than the number of 296 dengue deaths in 1988, due to the inclusion of dengue as a statutory reporting disease since 1989.[30]
4.3. Age, gender, and occupational distribution of dengue
In our study, people aged 25 to 44 years were more susceptible to dengue virus infection. And most of them were male patients, especially in 25 to 34 years age group. This phenomenon was similar to India, where male patients and people between 20 and 39 years old are more susceptible to dengue fever.[31] Previous studies have found that the reason for this phenomenon may be that male patients aged 25 to 34 years often travel abroad or engage in large-scale commercial and trade activities.[12] Besides, dengue mainly occurs in the following groups: students, business service staffs, workers, farmers, retired staffs, housewives, and the unemployed. Wu et al[29] attributed this phenomenon to the fact that most young men were engaged in business trade. Our results differ from Qinlong Jing's study, probably because he/she only screened cases of dengue that were not reported before 2014 in seven communities in Guangzhou, China.[32] Students are susceptible to dengue due to group learning, outdoor activities, and insufficient immune system.[33] In addition, it may be that Aedes albopictus tends to exist in small water containers around the home, while people living at home wear casually and have more skin contact, so housewives and the unemployed also suffer from a high proportion of dengue.[33]
5. Limitations
There are some limitations that cannot be ignored in this study. First, the data used came from passive public health surveillance. We were unable to obtain unreported and asymptomatic cases. Because asymptomatic infections have not been discovered and reported, the actual number of dengue fever is greater than the reported number, our study may underestimate the burden of dengue fever. Second, we were unable to obtain age, occupation, and gender data on dengue deaths. Third, Chinese Center for Disease Control and Prevention has not released data on the age, gender, and occupation of dengue fever from 2018 to 2019. Therefore, we only analyzed the data from 2010 to 2017.
6. Conclusion
The dengue fever epidemic occurs every 4 to 6 years, mostly in autumn. The endemic areas were Guangdong, Guangxi, Yunnan, Fujian, and Zhejiang provinces. People aged 25 to 44 years or men were more susceptible to dengue fever. At the same time, students, business service staffs, workers, farmers, retired staffs, housewives, and the unemployed people need to be reminded to protect themselves. The temporal and geographic evolution, outbreak seasons, and susceptible populations of dengue fever from 1990 to 2019 revealed by this study will help to develop targeted public health prevention and control measures.
Acknowledgments
We sincerely thank the Public Health Science Data Center Sharing Center of the National Population and Health Science Data Sharing Service Platform and Chinese Center for Disease Control and Prevention for providing us with dengue epidemiological data.
Author contributions
Conceptualization: Haixiong Lin, Xiaotong Wang, Zige Li.
Data curation: Haixiong Lin, Xiaotong Wang, Kangju Li, Chunni Lin, Huijun Yang.
Formal analysis: Haixiong Lin, Xiaotong Wang, Zige Li, Weiqin Yang.
Methodology: Haixiong Lin, Xiaotong Wang.
Project administration: Xiaopeng Ye.
Supervision: Xiaopeng Ye.
Validation: Xiaotong Wang.
Writing – original draft: Haixiong Lin, Xiaotong Wang, Zige Li.
Writing – review & editing: Haixiong Lin, Xiaotong Wang, Zige Li, Kangju Li, Chunni Lin, Huijun Yang, Weiqin Yang, Xiaopeng Ye.
All authors contributed constructive comments on the paper.
Footnotes
Abbreviations: GDP = Gross Domestic Product, No. = number, 95% CI = 95% confidence interval.
How to cite this article: Lin H, Wang X, Li Z, Li K, Lin C, Yang H, Yang W, Ye X. Epidemiological characteristics of dengue in mainland China from 1990 to 2019: A descriptive analysis. Medicine. 2020;99:36(e21982).
Haixiong Lin and Xiaotong Wang, These authors contributed equally to this work.
This work was supported, in part, by International Program for Postgraduates, Guangzhou University of Chinese Medicine (2019), Excellent Doctoral Dissertation Incubation Grant of Guangzhou University of Chinese Medicine (GZYXB2020-18), Excellent Doctoral Dissertation Incubation Grant of First Clinical School of Guangzhou University of Chinese Medicine (YB201902).
All data are available from the corresponding author upon reasonable request.
The authors have no competing interests to declare.
No human or animal samples were involved in the study, ethical approval is not required.
The datasets generated during and/or analyzed during the current study are available from the corresponding author on reasonable request.
References
- [1].Li G, Pan P, He Q, et al. Molecular epidemiology demonstrates that imported and local strains circulated during the 2014 dengue outbreak in Guangzhou, China. Virol Sin 2017;32:63–72.. [DOI] [PMC free article] [PubMed] [Google Scholar]
- [2].Bhatt S, Gething PW, Brady OJ, et al. The global distribution and burden of dengue. Nature 2013;496:504–7.. [DOI] [PMC free article] [PubMed] [Google Scholar]
- [3].Guzman MG, Harris E. Dengue. Lancet 2015;385:453–65.. [DOI] [PubMed] [Google Scholar]
- [4].Simmons CP, Farrar JJ, Nguyen VVC, et al. Current concepts dengue. New Engl J Med 2012;366:1423–32.. [DOI] [PubMed] [Google Scholar]
- [5].Hales S, de Wet N, Maindonald J, et al. Potential effect of population and climate changes on global distribution of dengue fever: an empirical model. Lancet 2002;360:830–4.. [DOI] [PubMed] [Google Scholar]
- [6].Shepard DS, Undurraga EA, Halasa YA, et al. The global economic burden of dengue: a systematic analysis. Lancet Infect Dis 2016;16:935–41.. [DOI] [PubMed] [Google Scholar]
- [7].Shepard DS, Coudeville L, Halasa YA, et al. Economic impact of dengue illness in the Americas. Am J Trop Med Hyg 2011;84:200–7.. [DOI] [PMC free article] [PubMed] [Google Scholar]
- [8].Shepard DS, Undurraga EA, Halasa YA. Economic and disease burden of dengue in Southeast Asia. PLoS Negl Trop Dis 2013;7:e2055. [DOI] [PMC free article] [PubMed] [Google Scholar]
- [9].Fan J, Gao J. Geography. 2016;Beijing: People's Education Press, 21-42. [Google Scholar]
- [10].Sun J, Lu L, Wu H, et al. Epidemiological trends of dengue in mainland China, 2005-2015. Int J Infect Dis 2017;57:86–91.. [DOI] [PubMed] [Google Scholar]
- [11].Zhang Q, Chen Y, Fu Y, et al. Epidemiology of dengue and the effect of seasonal climate variation on its dynamics: a spatio-temporal descriptive analysis in the Chao-Shan area on China's southeastern coast. BMJ Open 2019;9:e24197. [DOI] [PMC free article] [PubMed] [Google Scholar]
- [12].Yue Y, Sun J, Liu X, et al. Spatial analysis of dengue fever and exploration of its environmental and socio-economic risk factors using ordinary least squares: a case study in five districts of Guangzhou City, China, 2014. Int J Infect Dis 2018;75:39–48.. [DOI] [PubMed] [Google Scholar]
- [13].Lai S, Huang Z, Zhou H, et al. The changing epidemiology of dengue in China, 1990-2014: a descriptive analysis of 25 years of nationwide surveillance data. BMC Med 2015;13:100. [DOI] [PMC free article] [PubMed] [Google Scholar]
- [14].Suaya JA, Shepard DS, Siqueira JB, et al. Cost of dengue cases in eight countries in the Americas and Asia: a prospective study. Am J Trop Med Hyg 2009;80:846–55.. [PubMed] [Google Scholar]
- [15].Li C, Lu Y, Liu J, et al. Climate change and dengue fever transmission in China: evidences and challenges. Sci Total Environ 2018;622:493–501.. [DOI] [PubMed] [Google Scholar]
- [16].National Health Commission of the People's Republic of China. Diagnosis for dengue fever (WS 216—2018). National Health Commission of the People's Republic of China. WS 216—2018. Beijing, China: People's Medical Publishing House; 2018:1–24. Available at: http://www.nhc.gov.cn/wjw/s9491/201803/d524df26df28453eada8371dc3565818.shtml, accessed May 26, 2020. [Google Scholar]
- [17].Ministry of Health of the People's Republic of China. Diagnostic Criteria for Dengue Fever (WS 216-2008). Ministry of Health of the People's Republic of China. Beijing: People's Medical Publishing House; 2008:1–17. [Google Scholar]
- [18].Ministry of Health of the People's Republic of China. Diagnostic Criteria and Principle of Management of Dengue Fever (WS 216-2001). Ministry of Health of the People's Republic of China. Beijing: Standards Press of China; 2001:1-12. [Google Scholar]
- [19].Ministry of Health of the People's Republic of China. Guidelines for Diagnosis, Treatment, Prevention and Control for Dengue Fever. Beijing: Ministry of Health of the People's Republic of China; 1988. [Google Scholar]
- [20].Tu Wenxiao, Mu Di, Liu Fengfeng, et al. Risk assessment of public health emergencies concerned in the mainland of China, June 2019. Dis Surv 2019; 34:484–484. [Google Scholar]
- [21].World Health Organization. Dengue Control: Epidemiology. 2016. Available at: https://www.who.int/denguecontrol/epidemiology/en, accessed June 13, 2020. [Google Scholar]
- [22].Cheng Q, Jing Q, Spear RC, et al. The interplay of climate, intervention and imported cases as determinants of the 2014 dengue outbreak in Guangzhou. Plos Neglect Trop D 2017;11:e5701. [DOI] [PMC free article] [PubMed] [Google Scholar]
- [23].MacCormack-Gelles B, Lima Neto AS, Sousa GS, et al. Epidemiological characteristics and determinants of dengue transmission during epidemic and non-epidemic years in Fortaleza, Brazil: 2011–2015. Plos Neglect Trop D 2018;12:e000699012. [DOI] [PMC free article] [PubMed] [Google Scholar]
- [24].Eastin MD, Delmelle E, Casas I, et al. Intra- and interseasonal autoregressive prediction of dengue outbreaks using local weather and regional climate for a tropical environment in Colombia. Am J Trop Med Hyg 2014;91:598–610.. [DOI] [PMC free article] [PubMed] [Google Scholar]
- [25].Shen JC, Luo L, Li L, et al. The impacts of mosquito density and meteorological factors on dengue fever epidemics in Guangzhou, China, 2006-2014: a time-series analysis. Biomed Environ Sci 2015;28:321–9.. [DOI] [PubMed] [Google Scholar]
- [26].Li M, Sun G, Yakob L, et al. The driving force for 2014 dengue outbreak in Guangdong, China. PLoS One 2016;11:e016621111. [DOI] [PMC free article] [PubMed] [Google Scholar]
- [27].Yue Y, Liu X, Xu M, et al. Epidemiological dynamics of dengue fever in mainland China, 2014–2018. Int J Infect Dis 2019;86:82–93.. [DOI] [PubMed] [Google Scholar]
- [28].Ning W. Spatial and temporal distribution characteristics and risk mapping of dengue fever in China from 2004 to 2013 [Master Thesis]. Beijing: Chinese Center for Disease Control and Prevention; 2015:1-72. [Google Scholar]
- [29].Wu Y, Wang L, Chen L, et al. Epidemiologic characteristics of dengue fever in foreigner population in China, 2005–2017. Dis Surv 2019;34:839–43.. [Google Scholar]
- [30].Zhao Y. Epidemiology Investigation of Dengue Fever and Pathological Mechanism Research of Severe Dengue [PhD thesis]. Beijing: Peking Union Medical College; 2016:1–129. [Google Scholar]
- [31].Murhekar M, Joshua V, Kanagasabai K, et al. Epidemiology of dengue fever in India, based on laboratory surveillance data, 2014–2017. Int J Infect Dis 2019;84:S10–4.. [DOI] [PubMed] [Google Scholar]
- [32].Jing Q, Li Y, Liu J, et al. Dengue underestimation in Guangzhou, China: evidence of seroprevalence in communities with no reported cases before a large outbreak in 2014. Open Forum Infect Di 2019;6: UNSP ofz256. [DOI] [PMC free article] [PubMed] [Google Scholar]
- [33].Zhang H. Spatial-temporal Analysis on the Distribution of Dengue Fever and Their Association with Climate and Mosquito Density Factors in China, 2011-2015 [Master Thesis]. Beijing: Chinese Academy of Military Sciences; 2017: 1–53. [Google Scholar]