

Abstract
Spermatogenesis associated serine rich 2 (SPATS2) has been reported to be dysregulated in few types of cancer; however, no reports have investigated SPATS2 in liver cancer. The aim of the present study was to investigate SPATS2 expression in liver cancer and to analyze its association with the prognosis of liver cancer patients.
We examined the differential expression of SPATS2 in liver cancer by exploring The Cancer Genome Atlas (TCGA) database. The diagnostic efficiency of SPATS2 was obtained by Receiver Operating Characteristic (ROC) curve. The Chi-Squared test was used to assess clinical relevance. Survival analysis and Cox regression model were used to detect the effect of SPATS2 on the survival of liver cancer patients. Gene Set Enrichment Analysis (GSEA) was used to identify signaling pathways related to SPATS2 expression.
SPATS2 is highly expressed in liver cancer (P < 2.2e-16) and has the high diagnostic ability (AUC = 0.964). Survival analysis showed that patients with high SPATS2 expression have an apparently shorter overall survival (OS, P < .0001) and relapse-free survival (RFS, P < .0001). Cox regression analysis showed that high SPATS2 expression might be an independent risk factor for liver cancer (OS, HR = 2.41, P = .000; RFS, HR = 1.90, P < .001). GSEA analysis identified 3 signaling pathways (Mitotic spindle, G2 M checkpoint, E2F targets) that were enriched in the presence of high SPATS2 expression.
SPATS2 expression could be a novel diagnostic and prognostic biomarker in liver cancer.
Keywords: diagnosis, liver cancer, prognosis, SPATS2
1. Introduction
Liver cancer is the sixth most common malignant tumor in the world.[1] Epidemiological data show that there are more than 780,000 new cases of liver cancer worldwide every year, which makes liver cancer become the second most common-seen cancerous death.[2,3] Although great progress has been made in the treatment of liver cancer in recent years, the prognosis remain poor.[4,5] Therefore, a reliable prognostic marker is needed to improve the liver cancer patients’ prognosis.
Spermatogenesis associated serine rich 2 (SPATS2) most expressed in adult testis and slightly expressed in liver and other tissues. Previous studies have found that SPATS2 is involved in sperm development, and subsequently found that it promotes the progression of prostate cancer.[6] However, the role of SPATS2 in liver cancer is unknown, it is necessary to explore the role of SPATS2 in liver cancer.
In this study, we tested the SPATS2 mRNA expression difference in liver cancer by exploring TCGA database. ROC curve was drawn to evaluate the diagnostic value. The Chi-Squared test was used to evaluate the clinical correlation. Survival analysis and Cox regression model were executed to identify the effect of SPATS2 on liver cancer patients’ survival rate. GSEA was used to identify signaling pathways related to SPATS2 expression
2. Materials and methods
2.1. Data source
We obtained the currently available clinical as well as the RNAseq data of 50 normal and 373 liver cancer tissues form TCGA databases (https://cancergenome.nih.gov/). The gene-level was estimated as log2(x+1) transformed RSEM normalized count. The HCCDB dataset (http://lifeome.net/database/hccdb/download.html) was used for validation. No ethical conflict is needed because all the data in this study are from public database and available for research.
2.2. Statistical analysis
We used R (version 3.5.3)[7] for statistical analysis. Ggplot2 package was used to plot the boxplot.[8] The ROC curve drawn by pROC package evaluated the capability of diagnosis as well as setting the optimal cutoff value to separate high SPATS2 expression group from the low SPATS2 expression group accordingly.[9] Besides, the Chi-Squared test was used to evaluate the possible correlation between clinical features and the SPATS2 expression. Then we used a survival package to plot survival curves and performed a logarithmic rank test.[10] The univariate Cox model and multivariate Cox model were used to clarify the prognostic role of SPATS2 independently from other clinical features.[11]
2.3. Gene set enrichment analysis (GSEA)
GSEA determines whether an a priori defined set of genes has statistically significant differences in expression under 2 different biological conditions.[12,13] This analysis, performed using GSEA software 3.0 from the Broad Institute, was used for analysis of RNAseq data from TCGA-LIHC. The gene set of “h.all.v6.2.symbols.gmt”, which summarizes and represents specific, well-defined biological states or processes, was downloaded from the Molecular Signatures Database (http://software.broadinstitute.org/gsea/msigdb/index.jsp). The normalized enrichment score (NES) was determined by analysis of 1000 permutations. A gene set was considered significantly enriched when the P value was less than .05 and the false discovery rate (FDR) was less than .25.
2.4. Ethical approval
Ethics committee approval was not necessary because all clinical data used in this study were obtained from a public database and are available for research.
3. Results
3.1. Patient characteristic
The SPATS2 expression and clinical features including age, stage, new type, histologic grade, longest dimension, subdivision, sample type, lymphatic invasion, hepatitis virus, vital status, and SPATS2 expression were shown in Table 1.
Table 1.
Clinical characteristics of the liver cancer patients.

3.2. Differential expression of SPATS2 in liver cancer
Boxplots showed that SPATS2 expression was high in liver cancer compared with which in normal liver tissues (P < 2.2e-16, Fig. 1), which was also validated by HCCDB dataset (Fig. 1). In addition, SPATS2 was also expressed differently in different groups of stage (P = .00051), vital status (P = .013), age (P = .049), gender (P = .021), T classification (P = .00029), and histologic grade (P = 4.5e−10).
Figure 1.

SPATS2 expression in liver cancer. SPATS2 expression between normal tissues and liver cancer, stages, histologic grade, TNM classification, age, gender, vital status. SPATS2 expression in liver cancer validated by HCCDB datasets.
3.3. The diagnostic capability of SPATS2
According to the performance of the ROC curve, we found the area under curve (AUC) was 0.964, which represents the high diagnostic ability. In addition, we reached the same results by analyzing the subgroups of different stages (AUC: stage I was 0.957, stage II was 0.976, stage III was 0.979, stage IV was 0.872; Fig. 2).
Figure 2.
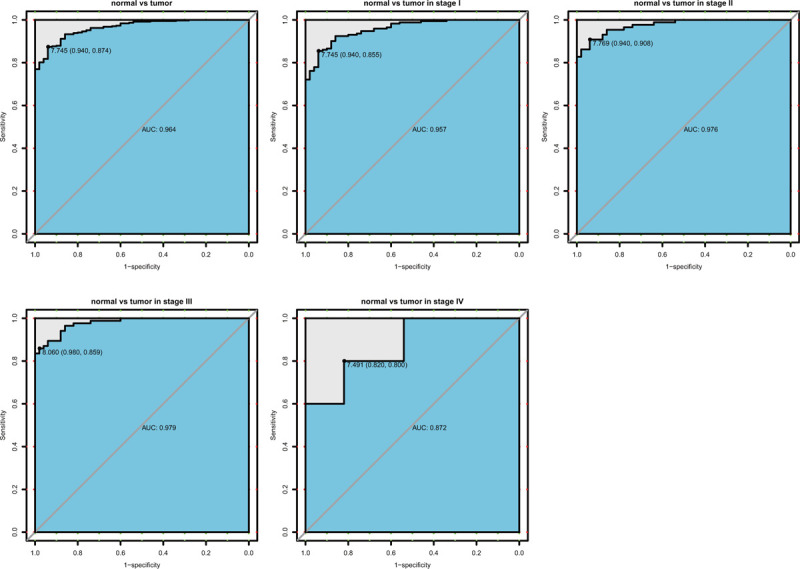
Diagnosis value of SPATS2. The ROC curve of normal tissues and liver cancer, and subgroup analysis of stage I, II, III, IV.
3.4. Relationship between SPATS2 expression and clinical features of liver cancer
As show in Table 2, the expression of SPATS2 was strongly associated with age (P = .024), vital status (P = .001), stage (P = .002), T classification (P = .002) and histologic grade (P = .000) of liver cancer patients.
Table 2.
Relationship between the clinical features and SPATS2 expression in liver cancer patients.

3.5. High SPATS2 expression is related to liver cancer patients’ poor overall survival
As shown in Figure 3, patients with higher SPATS2 expression had particularly shorter OS (P < .0001), which was validated by HCCDB datasets (Fig. 3) and consistent with results of subgroup analysis, especially in stage I/II (P = .03), stage III/IV (P < .001), stage G1/G2 (P < .0001), stage G3/G4 (P = .0054), male (P < .0001), female (P = .0047), younger (P < .0001), older (P = 1e−04), hepatitis virus positive (P = .013), and hepatitis virus negative (P < .0001). Cox model and Multivariate Cox model suggested that high SPATS2 expression was an independent risk factor for the OS of liver cancer (HR = 2.47, P < .001, Table 3).
Figure 3.

Survival curves of OS in liver cancer. Kaplan–Meier curves of liver cancer patients OS in all tumors, histologic grade G1/G2, G3/G4, clinical stage I/II, III/IV, male, female, younger, and older. Survival curves of OS grouped by SPATS2 in liver cancer validated by HCCDB datasets.
Table 3.
Univariate analysis and multivariate analysis of liver cancer patients overall survival.

3.6. High SPATS2 expression is related to liver cancer patients poor relapse-free survival
As shown in Figure 4, patients with higher SPATS2 expression had particularly shorter RFS (P < .0001), which was consistent with results of subgroup analysis, especially in stage I/II (P = .016), stage III/IV (P = .037), stage G1/G2 (P = .00014), stage G3/G4 (P = .016), male (P = .00014), female (P = .048), younger (P < .0036), older (P = .0028), and hepatitis virus negative (P < .0001). Univariate Cox model and Multivariate Cox model suggested that high SPATS2 expression was an independent risk factor for the RFS of liver cancer (HR = 1.92, P < .001, Table 4).
Figure 4.

Survival curves of RFS in liver cancer. Kaplan–Meier curves of liver cancer patients RFS in all tumors, histologic grade G1/G2, G3/G4, clinical stage I/II, III/IV, male, female, younger, and older.
Table 4.
Univariate analysis and multivariate analysis of liver cancer patients’ recurrence-free survival.

3.7. GSEA identifies SPATS2-related signaling pathway
We compared the data sets for low and high SPATS2 expression using GSEA to identify signaling pathways activated during liver cancer. The results indicated significant differences (FDR < 0.25, NOM P value < .05) in the enrichment of the MSigDB collection (h.all.v6.2.symbols.gmt; Table 5). We selected the most significantly enriched signaling pathways based on normalized enrichment score (NES) (Fig. 5, Table 5). The results indicated the data set with high SPATS2 expression was enriched in Mitotic spindle, G2 M checkpoint, E2F targets.
Table 5.
Gene set enrichment analysis (GSEA) of signaling pathways activated during liver cancer.

Figure 5.

Gene set enrichment analysis (GSEA) of signaling pathways activated during liver cancer. The high SPATS2 expression phenotype had enrichment of Mitotic spindle, G2 M checkpoint, E2F targets.
4. Discussion
At present, liver cancer can be treated in various ways, such as hepatectomy, liver transplantation, ablation, interventional therapy, radiotherapy, drug therapy, and biological immunity. However, the prognosis of patients is still poor. Therefore, it is urgent to find novel markers to predict the prognosis of liver cancer.[14] Many researches have been working to find out the prognostic maker of liver cancer, and aim to guide clinicians to evaluate the prognosis of liver cancer patients recently.[15–22] In this research, we found that SPATS2 expression could be a novel diagnostic and prognostic biomarker in liver cancer.
The gene SPATS2 was firstly found to encode a polypeptide containing 545 amino acid residues in mouse testis, which is involved in sperm growth and development.[23] Subsequently, the researchers found that SPATS2 was also expressed in 25 human tissues.[24] Recent studies have found that SPATS2 is highly expressed in squamous cell carcinoma but lowly expressed in non-lepidic AD.[25] In this study, we found that SPATS2 was highly expressed in liver cancer compared with normal liver tissue. This may be due to the organization specificity. In addition, SPATS2 can induce the transcription of SNHG5, promoting the survival of colon cancer cells.[26] Meanwhile, we found that the SPATS2 expression gradually increased in the stage, histologic stage and T classification, indicating that SPATS2 might promote the progress of liver cancer through helping cancer cell survival. Importantly, SPATS2 was highly expressed in the deceased than it in the survivors, so further survival analysis is necessary.
The survival of cancer cells is the main cause of cancer recurrence. Previous studies have found that SPATS2 removes H3K27me3 histone markers and promotes the survival of prostate cancer.[6] Interestingly, patients with high SPATS2 expression have a significantly shorter OS and RFS in liver cancer. Subgroup analysis also found the prognostic significance in the stage I/II, stage III/IV, G1/G2, G3/G4, male, female, younger, and older. This suggests that SPATS2 plays an important prognostic role in the whole process of liver cancer development. Consistent with these findings, we found that high SPATS2 could predict poor prognosis in liver cancer, which may involve in Mitotic spindle, G2 M checkpoint, E2F targets.
To our knowledge, this is the first study to examine the prognostic value of SPATS2 expression in liver cancer. Together with other studies about the functions of SPATS2, we have contributed to a better understanding of the role of SPATS2, as well as great possibility of accurately predicting the prognosis of liver cancer. However, the sample size is limited in this study. In the future, more samples need to be involved to validate the prognostic role of SPATS2 in liver cancer.
5. Conclusion
In conclusion, we mainly focused on the diagnostic and prognostic value of SPATS2 in patients with liver cancer. SPATS2 expression could be a novel diagnostic and prognostic biomarker in liver cancer
Acknowledgments
The results shown here are partly based upon data generated by the TCGA Research Network: https://www.cancer.gov/tcga.
Author contributions
Conceptualization: Xinying Wang.
Data curation: Jin Xing.
Formal analysis: Yijun Tian.
Investigation: Yijun Tian, Wu Ji.
Methodology: Jin Xing.
Project administration: Yijun Tian.
Resources: Yijun Tian.
Software: Jin Xing.
Validation: Yijun Tian, Wu Ji.
Visualization: Jin Xing.
Writing – original draft: Jin Xing.
Writing – review & editing: Xinying Wang.
Footnotes
Abbreviations: AUC = area under curve, FDR = false discovery rate, GSEA = Gene Set Enrichment Analysis, NES = normalized enrichment score, OS = overall survival, RFS = relapse-free survival, ROC = Receiver Operating Characteristic, SPATS2 = Spermatogenesis associated serine rich 2, TCGA = The Cancer Genome Atlas.
How to cite this article: Xing J, Tian Y, Ji W, Wang X. Comprehensive evaluation of SPATS2 expression and its prognostic potential in liver cancer. Medicine. 2020;99:9(e19230).
This study was partially supported by Science and Technology of Jilin Province Health and Family Planning Commission Project 2018Q009(XJ).
The authors declare that they have no conflict of interest.
References
- [1].Bray F, Ferlay J, Soerjomataram I, et al. Global cancer statistics 2018: GLOBOCAN estimates of incidence and mortality worldwide for 36 cancers in 185 countries. CA Cancer J Clin 2018;68:394–424. [DOI] [PubMed] [Google Scholar]
- [2].Ferlay J, Soerjomataram I, Dikshit R, et al. Cancer incidence and mortality worldwide: sources, methods and major patterns in GLOBOCAN 2012. Int J Cancer 2015;136:E359–386. [DOI] [PubMed] [Google Scholar]
- [3].Llovet JM, Zucman-Rossi J, Pikarsky E, et al. Hepatocellular carcinoma. Nat Rev Dis Primers 2016;2:16018. [DOI] [PubMed] [Google Scholar]
- [4].Tovoli F, Negrini G, Benevento F, et al. Systemic treatments for hepatocellular carcinoma: challenges and future perspectives. Hepat Oncol 2018;5:HE01. [DOI] [PMC free article] [PubMed] [Google Scholar]
- [5].Ikeda K. Recent advances in medical management of hepatocellular carcinoma. Hepatol Res 2019;49:14–32. [DOI] [PubMed] [Google Scholar]
- [6].Ngollo M, Lebert A, Daures M, et al. Global analysis of H3K27me3 as an epigenetic marker in prostate cancer progression. BMC cancer 2017;17:261. [DOI] [PMC free article] [PubMed] [Google Scholar]
- [7].Team RDCJC. R. A language and environment for statistical computing. R Foundation for Statistical Computing, Vienna, Austria 2009;14:12–21. [Google Scholar]
- [8].Wickham H. Ggplot2:elegant graphics for data analysis. J R Stat Soc 2011;174:245–6. [Google Scholar]
- [9].Robin X, Turck N, Hainard A, et al. pROC: an open-source package for R and S+ to analyze and compare ROC curves. BMC Bioinformatics 2011;12:77. [DOI] [PMC free article] [PubMed] [Google Scholar]
- [10]. Therneau TM, April. A Package for Survival Analysis in S. 1994. [Google Scholar]
- [11].Therneau TM, Grambsch PM. Modeling Survival Data: Extending the Cox Model. New York: Springer; 2000. [Google Scholar]
- [12].Mootha VK, Lindgren CM, Eriksson KF, et al. PGC-1alpha-responsive genes involved in oxidative phosphorylation are coordinately downregulated in human diabetes. Nat Genet 2003;34:267–73. [DOI] [PubMed] [Google Scholar]
- [13].Subramanian A, Tamayo P, Mootha VK, et al. Gene set enrichment analysis: a knowledge-based approach for interpreting genome-wide expression profiles. Proc Natl Acad Sci USA 2005;102:15545–50. [DOI] [PMC free article] [PubMed] [Google Scholar]
- [14].Guo W, Tan HY, Wang N, et al. Deciphering hepatocellular carcinoma through metabolomics: from biomarker discovery to therapy evaluation. Cancer Manag Res 2018;10:715–34. [DOI] [PMC free article] [PubMed] [Google Scholar]
- [15].Jiao Y, Fu Z, Li Y, et al. High EIF2B5 mRNA expression and its prognostic significance in liver cancer: a study based on the TCGA and GEO database. Cancer Manag Res 2018;10:6003–14. [DOI] [PMC free article] [PubMed] [Google Scholar]
- [16].Jiao Y, Li Y, Lu Z, et al. High trophinin-associated protein expression is an independent predictor of poor survival in liver cancer. Dig Dis Sci 2019;64:137–43. [DOI] [PubMed] [Google Scholar]
- [17].Jiao Y, Fu Z, Li Y, et al. Aberrant FAM64A mRNA expression is an independent predictor of poor survival in pancreatic cancer. PloS One 2019;14:e0211291. [DOI] [PMC free article] [PubMed] [Google Scholar]
- [18].Jiao Y, Li Y, Jiang P, et al. PGM5: a novel diagnostic and prognostic biomarker for liver cancer. PeerJ 2019;7:e7070. [DOI] [PMC free article] [PubMed] [Google Scholar]
- [19].Jiao Y, Li Y, Liu S, et al. ITGA3 serves as a diagnostic and prognostic biomarker for pancreatic cancer. Onco Targets Ther 2019;12:4141–52. [DOI] [PMC free article] [PubMed] [Google Scholar]
- [20].Li Y, Jiao Y, Fu Z, et al. High miR-454-3p expression predicts poor prognosis in hepatocellular carcinoma. Cancer Manag Res 2019;11:2795–802. [DOI] [PMC free article] [PubMed] [Google Scholar]
- [21].Jiao Y, Li Y, Fu Z, et al. OGDHL expression as a prognostic Biomarker for liver cancer patients. Dis Markers 2019;2019:9. [DOI] [PMC free article] [PubMed] [Google Scholar]
- [22].Hou L, Zhang X, Jiao Y, et al. ATP binding cassette subfamily B member 9 (ABCB9) is a prognostic indicator of overall survival in ovarian cancer. Medicine (Baltimore) 2019;98:e15698. [DOI] [PMC free article] [PubMed] [Google Scholar]
- [23].Senoo M, Hoshino S, Mochida N, et al. Identification of a novel protein p59(scr), which is expressed at specific stages of mouse spermatogenesis. Biochem Biophys Res Commun 2002;292:992–8. [DOI] [PubMed] [Google Scholar]
- [24].Seki K, Koshi R, Sugano N, et al. Microarray analysis of bisphenol A-induced changes in gene expression in human oral epithelial cells. Acta biochimica et biophysica Sinica 2007;39:879–84. [DOI] [PubMed] [Google Scholar]
- [25].Takamochi K, Ohmiya H, Itoh M, et al. Novel biomarkers that assist in accurate discrimination of squamous cell carcinoma from adenocarcinoma of the lung. BMC Cancer 2016;16:760. [DOI] [PMC free article] [PubMed] [Google Scholar]
- [26].Damas ND, Marcatti M, Come C, et al. SNHG5 promotes colorectal cancer cell survival by counteracting STAU1-mediated mRNA destabilization. Nat Commun 2016;7:13875. [DOI] [PMC free article] [PubMed] [Google Scholar]