The C-type lectin layilin has been observed in several human cancers, but its function on immune cells is unknown. This study demonstrates that layilin is highly expressed on clonally expanded CD8+ T cells in human melanoma and augments integrin-mediated cellular adhesion to enhance antitumor immunity.
Abstract
Tumor-infiltrating CD8+ T cells mediate antitumor immune responses. However, the mechanisms by which T cells remain poised to kill cancer cells despite expressing high levels of inhibitory receptors are unknown. Here, we report that layilin, a C-type lectin domain–containing membrane glycoprotein, is selectively expressed on highly activated, clonally expanded, but phenotypically exhausted CD8+ T cells in human melanoma. Lineage-specific deletion of layilin on murine CD8+ T cells reduced their accumulation in tumors and increased tumor growth in vivo. Congruently, gene editing of LAYN in human CD8+ T cells reduced direct tumor cell killing ex vivo. On a molecular level, layilin colocalized with integrin αLβ2 (LFA-1) on T cells, and cross-linking layilin promoted the activated state of this integrin. Accordingly, LAYN deletion resulted in attenuated LFA-1–dependent cellular adhesion. Collectively, our results identify layilin as part of a molecular pathway in which exhausted or “dysfunctional” CD8+ T cells enhance cellular adhesiveness to maintain their cytotoxic potential.
Introduction
Blocking inhibitory receptors, such as PD-1 and CTLA-4, has revolutionized cancer therapy, leading to clinically durable reductions in tumor burden in multiple human cancers (Wei et al., 2018). We have previously demonstrated that the relative abundance of PD-1hiCTLA-4hi CD8+ T cells infiltrating human metastatic melanoma tumors strongly correlates with clinical response to anti-PD-1 therapy (Daud et al., 2016; Loo et al., 2017). This suggests that both the quantity and quality of CD8+ T cells present in the tumor microenvironment play a major role in determining whether a robust immune response will be generated against the tumor upon initiating immunotherapy. While the molecular pathways regulating inhibitory receptor expression and tumor-infiltrating lymphocyte (TIL) dysfunction are being actively investigated, less is known about the molecular pathways involved in maintaining the effector functions of these cells (Scott et al., 2019; Khan et al., 2019; Alfei et al., 2019).
T cell accumulation in tumors is a highly regulated multistep process. In addition to promoting a locally immunosuppressive environment that contributes to T cell dysfunction, some tumors actively exclude T cell entry (Peranzoni et al., 2018; Mariathasan et al., 2018). Such exclusion produces an immune cell–poor profile correlating with reduced clinical responses to immunotherapy (Kather et al., 2018; Melero et al., 2014). Successful accumulation of T cells in tumors is dependent on expression of several cellular adhesion pathways, including integrins such as αeβ7 and αLβ2 (LFA-1; Park et al., 2019; Dirkx et al., 2003; Harjunpää et al., 2019). The relative level of expression and activation state of these molecules on T cells mediates adhesion to, and movement within, the tumor microenvironment through direct interaction with ligands on tumor cells, stromal cells, and other immune cells (Park et al., 2019; Anikeeva et al., 2005; Franciszkiewicz et al., 2013; Hammer et al., 2019). Furthermore, LFA-1 directly contributes to the ability of T cells to kill tumor cells by facilitating formation of T cell–tumor cell immune synapses (Anikeeva et al., 2005; Franciszkiewicz et al., 2013). LFA-1 itself is constitutively expressed on the cell surface in a low-affinity confirmation that demonstrates poor binding to its ligand, ICAM-1 (Abram and Lowell, 2009; Sun et al., 2019). However, upon stimulation, this integrin is induced to undergo a conformational change that dramatically increases ligand affinity (Walling and Kim, 2018). Thus, the overall adhesive capacity of TILs is intricately linked with their ability to kill tumor cells. It is currently unknown how these processes are regulated in the tumor microenvironment.
The clinical significance of PD-1hiCTLA-4hi CD8+ TIL abundance in predicting response to anti-PD-1 therapy prompted us to explore the fundamental biology of these cells. To this end, we employed a human discovery-to-mouse in vivo functional studies-to-human ex vivo biochemical approach. Whole-transcriptome profiling of PD-1hiCTLA-4hi CD8+ TILs from human metastatic melanoma samples identified LAYN, which codes for the C-type lectin domain–containing membrane glycoprotein layilin, as one of the most highly enriched genes among phenotypically exhausted yet clonally expanded TILs. In vivo functional experiments in rodent tumor models revealed that layilin facilitates CD8+ T cell–mediated antitumor immunity. Mechanistically, we found that layilin interacted with LFA-1 to enhance the activation of this integrin. Our findings provide a molecular rationale for how TILs maintain their ability to accumulate in tumors and kill malignant cells despite being in a relatively exhausted and dysfunctional state.
Results
A subset of highly activated TILs in human melanoma express layilin
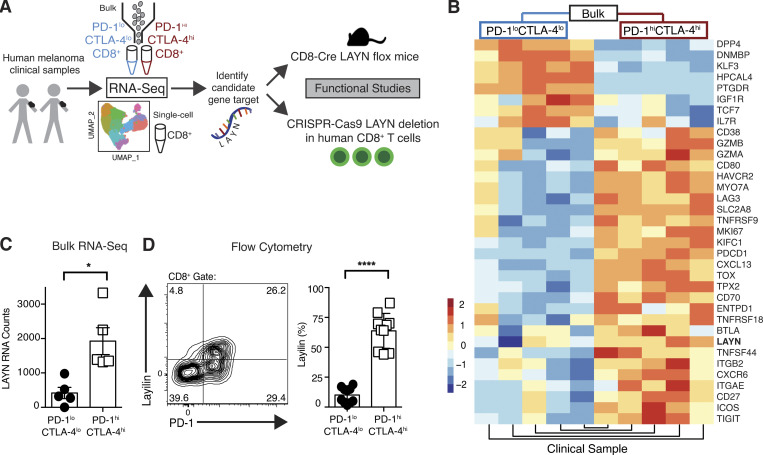
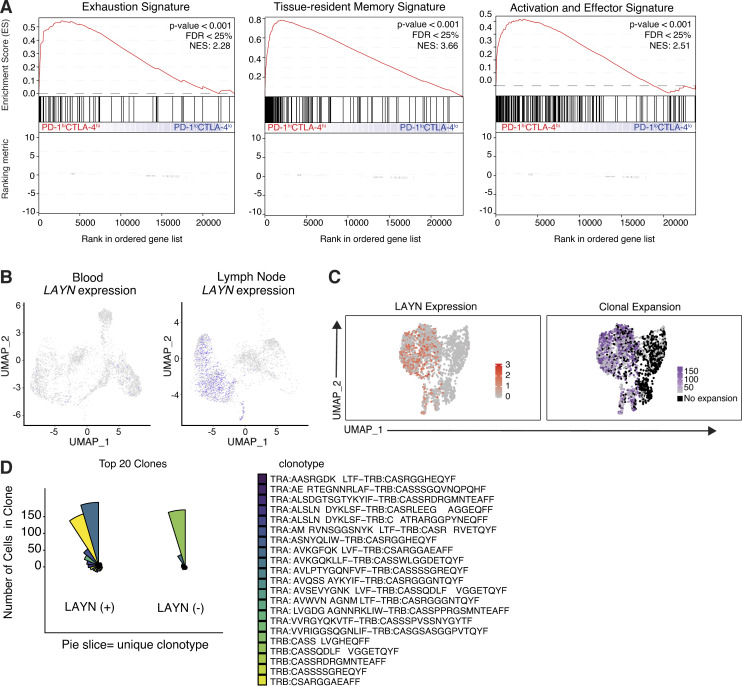
To understand the fundamental biology of PD-1hiCTLA-4hi CD8+ TILs, we used an FACS strategy to isolate these cells from eight melanoma patients and performed either bulk or single-cell whole transcriptome RNA sequencing (RNA-seq; Fig. S1, Fig. 1 A, and Table S1). As expected, PD-1hiCTLA-4hi cells were enriched for expression of immune checkpoint receptors, activation markers, and tissue-resident memory genes (Fig. S2 A). Differential expression analysis revealed the gene LAYN to be highly expressed in the PD-1hiCTLA-4hi TIL subset (Fig. 1, B and C). LAYN codes for layilin, a C-type lectin domain containing cell surface glycoprotein (Borowsky and Hynes, 1998; Bono et al., 2001). Flow cytometric quantification of layilin validated its preferential expression on the cell surface of PD-1hiCTLA-4hi TILs in human metastatic melanoma (Fig. 1 D). Recent transcriptional profiling studies have reported high expression of this gene in TILs from several human cancers (De Simone et al., 2016; Zheng et al., 2017; Guo et al., 2018; Thommen et al., 2018; Savas et al., 2018); however, the function and physiological significance of layilin expression on lymphocytes is currently unknown.
Figure S1.
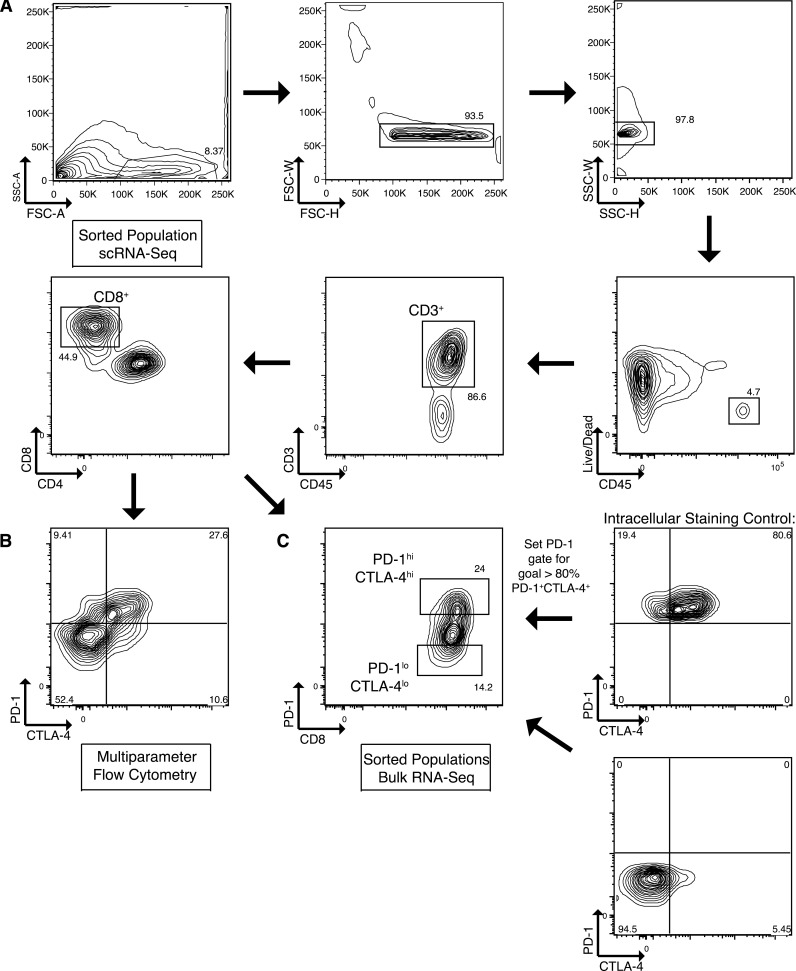
Flow cytometric gating and sorting strategy. (A) Gating strategy for isolation of CD8+ TILs (live CD45+ CD3+ CD8+). (B) Representative flow cytometric plot to quantify CTLA-4 and PD-1 expression on CD8+ TILs. (C) Sorting strategy demonstrating how an intracellular staining control including CTLA-4 was used to set the PD-1 gate so that >80% of the sorted PD-1hiCTLA-4hi population expressed high levels of both markers. FSC-A, forward scatter area; FSC-H, forward scatter height; FSC-W, forward scatter width; SSC-A, side scatter area; SSC-H, side scatter height; SSC-W, side scatter width.
Figure 1.
Layilin is highly expressed on CD8+PD-1hiCTLA-4hi TILs in human metastatic melanoma. (A) Schematic of the project design and approach. (B) Heatmap from bulk RNA-seq comparing highest differentially expressed genes between sort-purified PD-1hiCTLA-4hi and PD-1loCTLA-4lo CD8+ TILs. (C) Quantification of LAYN RNA counts from bulk RNA-seq; n = 5 patients. (D) Representative flow cytometric plot and quantification of cell surface layilin protein expression of PD-1hiCTLA-4hi versus PD-1loCTLA-4lo CD8+ TILs from 10 human melanoma samples. Each symbol represents an individual patient; mean and SEM are shown. Statistical significance was determined by paired two-tailed t tests. *, P< 0.05; ****, P< 0.001.
Figure S2.
Comparative scRNA-seq analysis of human melanoma CD8+ TIL subsets. (A) Gene set enrichment analysis showing enrichment of exhaustion, tissue-resident memory, and activation and effector function signatures genes within the ranked gene expression of PD-1hiCTLA-4hi compared with PD-1loCLTA-4lo CD8+ TILs from human melanoma (n = 5). NES, normalized enrichment score. (B) Matched tissue scRNA-seq of CD8+ T cells isolated from patient K-411. (C) UMAP plots generated from scRNA-seq and scTCR-seq demonstrating LAYN expression and clone size from K-409 primary tumor. Clones are defined as sets of cells with perfect matches for all called TCR α and β chains from single-cell TCR data. (D) Coxcomb plots showing the 20 most expanded LAYN+ and LAYN− clones in K-409 primary tumor. Each pie slice represents a unique CD8+ T cell clonotype, and pie slice height is proportional to clone size. FDR, false discovery rate.
Highly activated, clonally expanded CD8+ TILs preferentially express layilin
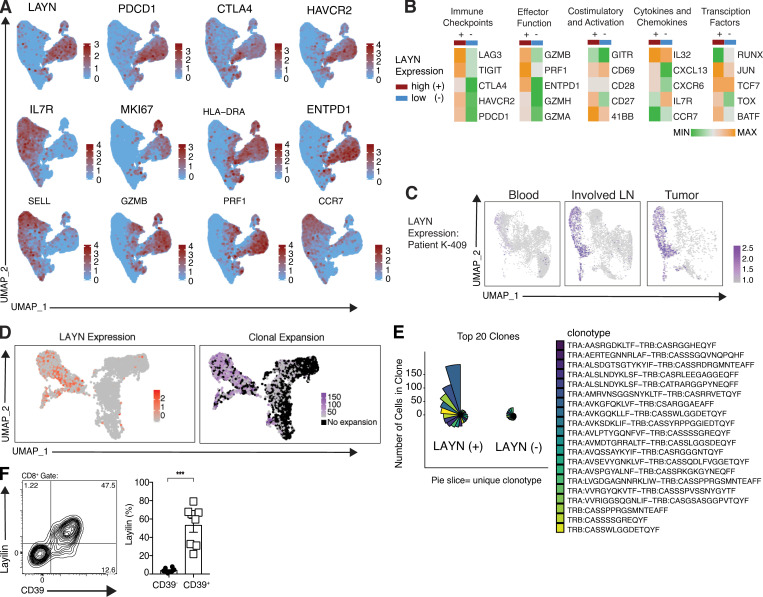
To begin to understand how layilin expressing TILs differ from other TILs in human cancer, we performed single-cell RNA-seq (scRNA-seq) on 20,018 CD3+CD8+ T cells freshly isolated from metastatic melanoma tumors. Unbiased clustering was performed and clusters were visualized with Uniform Manifold Approximation and Project (UMAP) dimensional reduction. LAYN closely overlapped with inhibitory receptors, activation and effector molecules, and tissue-resident memory genes (Fig. 2, A and B). In contrast, LAYN-expressing cells were distinct from IL-7R–, L-selectin (SELL)–, and CCR7-expressing cells, further suggesting a tissue-resident phenotype. To determine if LAYN-expressing TILs are primarily found in tumors, we performed scRNA-seq on CD8+ T cells isolated from the peripheral blood, involved LN, and primary tumor in a patient with stage III melanoma. LAYN was highly expressed in both the tumor and involved LN but nearly absent in peripheral blood (Fig. 2 C and Fig. S2 B). TCR sequence analysis revealed that LAYN expression in both primary tumor and involved LNs closely overlapped with expanded CD8+ T cell clones (Fig. 2 D and Fig. S2 C). Notably, the top 20 expanded clonotypes (which represented the majority of all cells sequenced) were primarily found in the LAYN-expressing cells (Fig. 2 E and Fig. S2 D). Additionally, the presence of the extracellular ATPase CD39, which identifies TILs recognizing tumor antigens, closely correlated with layilin expression (Yost et al., 2019; Simoni et al., 2018; Duhen et al., 2018; Fig. 2 F). Taken together, these results suggest that layilin is selectively expressed on a clonally expanded, and likely tumor-specific, subset of tumor-resident CD8+ T cells in human melanoma.
Figure 2.
Layilin expression is enriched on highly activated, clonally expanded CD8+ TILs. (A) Feature plots of scRNA-seq; n = 20,018 cells from four human melanoma samples. (B) Heatmaps comparing selected differentially expressed genes in LAYN-positive (+) and LAYN-negative (−) cells from scRNA-seq analysis. (C) scRNA-seq analysis of LAYN expression in peripheral blood, metastatic LNs (involved LN), and primary tumor from patient K-409. (D) UMAP plots generated from scRNA-seq and scTCR-seq demonstrating LAYN expression and clone size from K-409–involved LN. Clones are defined as sets of cells with perfect matches for all called TCR α and β chains from single-cell TCR data. (E) Coxcomb plots showing the 20 most expanded LAYN+ and LAYN− clones in K-409 involved LN. Each pie slice represents a unique CD8+ T cell clonotype, and pie slice height is proportional to clone size. (F) Representative flow cytometric plot and quantification of cell surface layilin and CD39 protein expression of CD8+ TILs from eight human melanoma samples. Each symbol represents an individual patient; mean and SEM are shown. Statistical significance was determined by paired two-tailed t tests. *, P < 0.05; ***, P < 0.01; ****, P < 0.001.
Layilin augments CD8+ T cell–mediated antitumor immunity
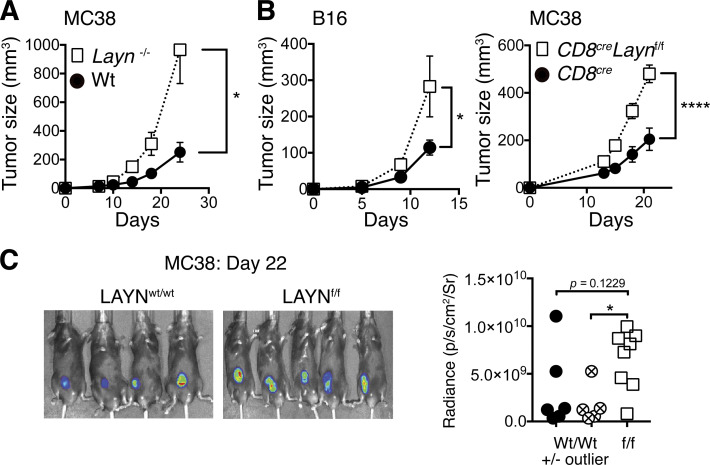
To directly determine the functional role of layilin on CD8+ T cell–mediated antitumor immunity, we generated a germline Layn knockout mouse strain as well a strain in which Layn could be conditionally deleted in specific cell types (i.e., Laynflox/flow mice). Flox sequences were inserted to flank exon 4 of the layilin gene using CRISPR-Cas9 technology (Cong et al., 2013). This results in complete deletion of exon 4, corresponding to the C-type lectin domain of LAYN, when crossed to mice expressing Cre recombinase in specific cell lineages (Borowsky and Hynes, 1998; Fig. S3 A). To elucidate the function of layilin on TILs, we transplanted the MC38 adenocarcinoma into Layn−/− or wild-type control mice and measured the kinetics of tumor growth. Interestingly, layilin-deficient animals demonstrated increased tumor growth (Fig. 3 A). To determine if layilin-expressing CD8+ TILs play a role in limiting tumor growth, we specifically deleted Layn in CD8+ T cells by crossing Laynf/f mice to a CD8cre (E8Icre) strain where Cre-recombinase activity is not active during thymic development and therefore absent in CD4+ T cells (Zou et al., 2001; Fig. S3 A). At steady state, these mice exhibited normal CD8 frequencies across multiple organs (Fig. S3 B). CD8creLaynf/f mice were used in two separate tumor models. We transplanted either the B16-F10 melanoma or MC38 cell lines into CD8creLaynwt/wt or CD8creLaynf/f mice and quantified layilin expression and tumor growth kinetics (Fig. 3, B and C). CD8+ T cells purified from MC38 tumors growing in CD8creLaynwt/wt hosts had increased expression of layilin at the mRNA and protein levels when compared with their splenic counterparts, and layilin expression was absent in CD8creLaynf/f animals (Fig. S3, C and D). In both tumor models, layilin deletion on CD8+ T cells resulted in enhanced tumor growth (Fig. 3, B and C). Adoptive transfer of T cells from either CD8creLaynf/f or CD8creLaynwt/wt animals into B16.F10-bearing Rag2−/− hosts recapitulated this response (Fig. S3 E). Taken together, these results suggest that layilin expression is increased on murine CD8+ T cells in the tumor microenvironment and that expression of this protein on TILs results in reduced tumor growth.
Figure S3.
Layilin expressed on mouse CD8+ T cells protects against tumor growth. (A) Schematic depiction of our strategy to generate conditional Layn knockout mice specific to CD8+ cells. (B) CD8+ T cell frequencies in CD8creLaynf/f mice were compared with littermate wild-type counterparts across several tissues. Symbols represent individual mice. (C) Quantitative PCR analysis was performed on CD8+TCRβ+ T cells isolated by FACS from MC38 tumors or spleens. Each symbol corresponds to an individual mouse. Data are representative of two independent experiments. (D) CD8+TCRβ+ T cells isolated by FACS from MC38 tumors and spleens were analyzed by Western blot. (E) Rag−/− mice were simultaneously challenged with B16.F10 melanoma cells and i.v. injected with 5 × 10⁶ purified T cells from either CD8creLaynf/f or CD8creLaynwt/wt donors. CD8+ and CD4+ T cells were coinjected at a 2:1 ratio. n = 6 animals per group. (F) 3 wk following MC38 engraftment and T cell adoptive transfer into Rag−/− hosts, tumor-infiltrating T cells were analyzed by flow cytometry. Data are representative of two independent experiments; paired symbols represent single tumors from individual mice, and error bars are standard deviation. Statistical significance was determined by two-way ANOVA (E). *, P < 0.05.
Figure 3.
Layilin augments CD8+ TIL-mediated antitumor immunity. (A) Layn−/− or wild-type animals were injected subcutaneously with the MC38 tumor cell line and tumor growth quantified by caliper measurements. Symbols and error bars represent mean and SEM at each time point; n = 7 per group. Data are representative of two independent experiments. (B) CD8creLaynf/f and CD8creLaynwt/wt mice were injected subcutaneously with B16.F10 or MC38 tumor cell lines. Symbols and error bars represent mean and SEM at each time point; n = 6–10 per group. Data are representative of three independent experiments. (C) Representative images and quantification of in vivo luciferin bioluminescence imaging taken of mice bearing MC38-LUC2 tumors. Symbols correspond to individual mice. Statistical significance was determined by two-way ANOVA (A and B) or unpaired two-tailed t tests (C). *, P < 0.05; ****, P < 0.0001.
Layilin promotes CD8+ T cell accumulation in tumors
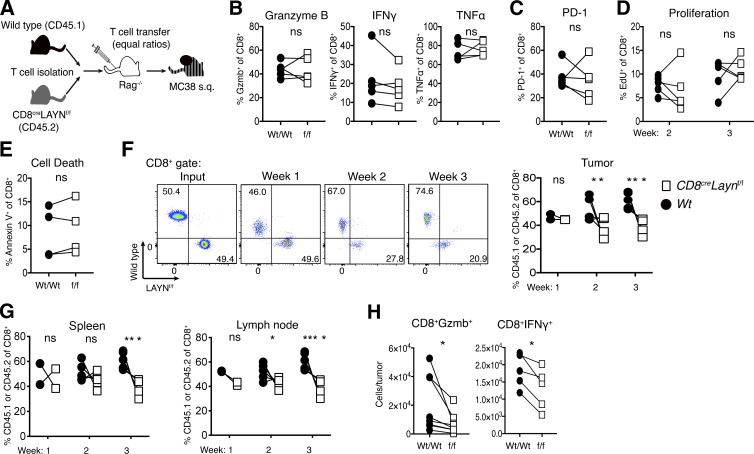
We next set out to determine the cellular and molecular mechanisms by which layilin expression on CD8+ T cells attenuates tumor growth. To do so, we used a competitive adoptive transfer approach. LN-derived CD8+ T cells from wild-type CD45.1+ and CD8creLaynf/f CD45.2+ mice were purified and transferred at 1:1 ratios into immunodeficient Rag2−/− hosts (Fig. 4 A). Subsequently, mice were transplanted with MC38 cells, and we quantitatively phenotyped CD8+ TILs by flow cytometry 2 and 3 wk later. Paired comparison of wild-type and layilin-deficient CD8+ TILs revealed no cell-intrinsic differences in granzyme B, IFN-γ, or TNF-α expression (Fig. 4 B). Similarly, PD-1 expression, proliferative capacity, and cell death were unchanged between layilin-deficient and control TILs (Fig. 4, C–E). In these experiments, there was a marked reduction in the accumulation of layilin-deficient CD8+ T cells first in the tumor and then in secondary lymphoid organs (Fig. 4, F and G). This difference was not observed between coinjected CD4+ T cells from wild-type and CD8creLaynf/f mice (Fig. S3 F). Increased accumulation of wild-type TILs resulted in a significant enrichment in the number of granzyme B– and IFN-γ–producing CD8+ T cells in tumors when compared with layilin-deficient TILs (Fig. 4 F). Taken together, these results suggest that layilin does not significantly influence activation, proliferation, or cytokine expression in CD8+ TILs but instead predominantly enhances their overall persistence and accumulation in tumors.
Figure 4.
Expression of layilin promotes the accumulation of cytotoxic CD8+ T cells in tumors. (A) Competitive adoptive transfer tumor model to elucidate layilin activity on TILs in vivo. (B–H) 2 and 3 wk following MC38 engraftment and T cell adoptive transfer into Rag−/− hosts, tumor-infiltrating and peripheral T cells were analyzed by flow cytometry. Data are representative of two independent experiments; paired symbols represent individual mice. Statistical significance was determined by unpaired two-tailed t test (D–G); *, P < 0.05; **, P < 0.01; ***, P < 0.001; ****, P < 0.0001. ns, not significant.
Layilin expression on CD8+ T cells enhances tumor cell killing
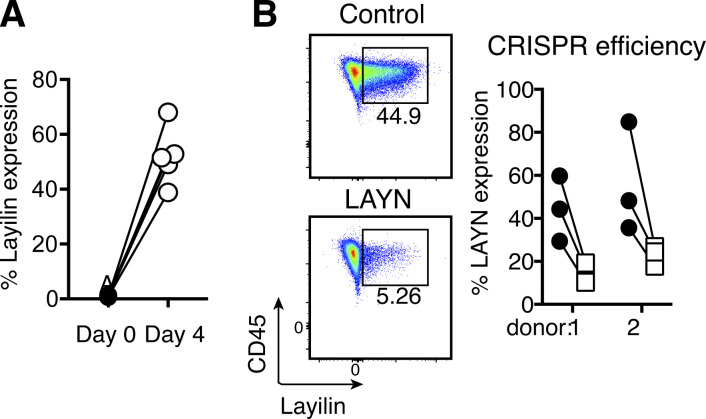
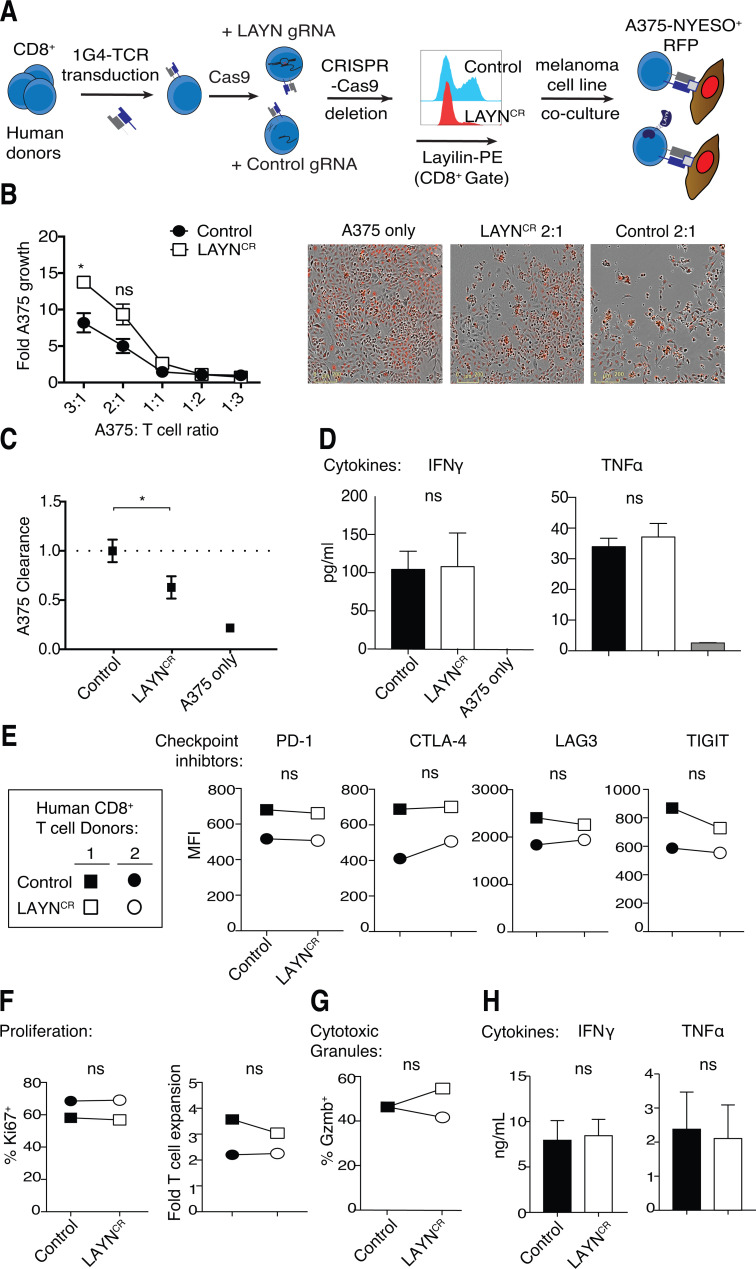
To validate and expand on our results in mice, we established a CRISPR-Cas9 gene editing approach to disrupt LAYN in primary human CD8+ T cells. Following purification from peripheral blood of healthy donors, CD8+ T cells were activated with anti-CD3/CD28 stimulation. Flow cytometric quantification of layilin protein expression revealed negligible levels on freshly isolated naive CD8+ T cells at baseline. However, 4 d after activation, ∼50% of these cells expressed appreciable levels of layilin on the cell surface (Fig. S4 A). Electroporative delivery of Cas9 preloaded with single guide RNA (gRNA; Schumann et al., 2015; Roth et al., 2018) targeting the LAYN gene significantly reduced layilin protein expression when compared with nontargeted control gRNA (Fig. 5 A and Fig. S4 B). To test whether layilin expression on CD8+ T cells plays a role in direct tumor cell killing, we used a well-established ex vivo antigen-specific tumor cytolytic model (Fig. 5 A; Shifrut et al., 2018). Purified CD8+ T cells were transduced to express the 1G4 TCR specific for the NY-ESO tumor antigen, and LAYN was subsequently deleted in these cells using our CRISPR-Cas9 approach (LAYNCR). We then cocultured these cells, or cells electroporated with a control gRNA, with A375-NY-ESO+ melanoma cancer cells and quantified A375 cell accumulation over 5 d. Consistent with our mouse experiments, layilin-deficient human CD8+ T cells were significantly less effective at killing tumor cells, especially at higher target to T cell ratios (Fig. 5, B and C). These results suggest that, in addition to promoting accumulation in tumors, layilin expression on CD8+ T cells plays a direct role in tumor cell killing.
Figure S4.
Layilin expression and gene editing in human CD8+ T cells. (A) Layilin expression on CD8+ T cells enriched from human donor peripheral blood samples and cultured 4 d in the presence of anti-CD3/CD28 activation. Symbol pairs correspond to individual donors. (B) Efficiency of CRISPR-Cas9 deletion of LAYN.
Figure 5.
Layilin enhances human CD8+ T cell cytotoxicity without affecting cellular proliferation, cytokine production or inhibitory receptor expression. (A) Schematic outlining our strategy for CRISPR-Cas9 electroporation-mediated LAYN deletion and introduction of the 1G4 TCR to human CD8+ T cells. Representative flow cytometric plot of layilin protein expression between LAYN guide treated and nontargeted guide (Control) is shown. (B and C) Quantification and representative images of A375 growth and clearance when cocultured with CRISPR control or LAYN deleted 1G4+ T cells. Data are a composite from two donors and representative of three independent experiments; mean and SEM are shown, and scale bars indicate 200 µm. (D) A375 melanoma-T cell coculture supernatants were collected on day 5 and measured for IFN-γ and TNF-α secretion by multiplex ELISA. Data are representative of two independent experiments; mean and SD are shown. (E–H) Human CD8+ T cells activated with anti-CD3/CD28 were electroporated with Cas9 preloaded with control or LAYN targeting gRNA, cultured for 4 d, and analyzed by flow cytometry for surface receptor expression (E), proliferation (F), intracellular granzyme B (G), and IFN-γ and TNF-α secretion (H). Data are representative of three experiments; mean and SD are shown for D. Statistical significance was determined by two-way ANOVA. *, P < 0.05. ns, not significant.
To discern how layilin expression affects the function of CD8+ T cells, we first examined cytokines in the supernatants of the tumor/antigen-specific T cell cocultures (1G4-TCR+ CD8+ T cells with A375-NY-ESO+ melanoma cells). This analysis revealed similar levels of IFNγ and TNFα between control and LAYNCR cultures (Fig. 5 D). We next comprehensively phenotyped LAYNCR cells activated by anti-CD3/CD28 stimulation. When compared with control CD8+ T cells treated with nontargeted gRNA, no discernable differences were observed in the expression of the inhibitory receptors PD-1, CTLA-4, LAG3, and TIGIT (Fig. 5 E). Furthermore, there was no difference in T cell proliferation, as measured by Ki67 expression and cumulative T cell expansion (Fig. 5 F). Expression of the cytolytic protease granzyme B remained unchanged (Fig. 5 G). In agreement with our tumor coculture experiments, there was no difference in the secretion of effector cytokines IFN-γ and TNF-α between layilin-deleted and control cells (Fig. 5 H). Consistent with our in vivo studies in mice, these results indicate that layilin expression on CD8+ T cells does not influence proinflammatory cytokine secretion, cytolytic protein expression, cellular proliferation, or inhibitory receptor expression in vitro.
Layilin interacts with LFA-1 to promote integrin activation and cellular adhesion
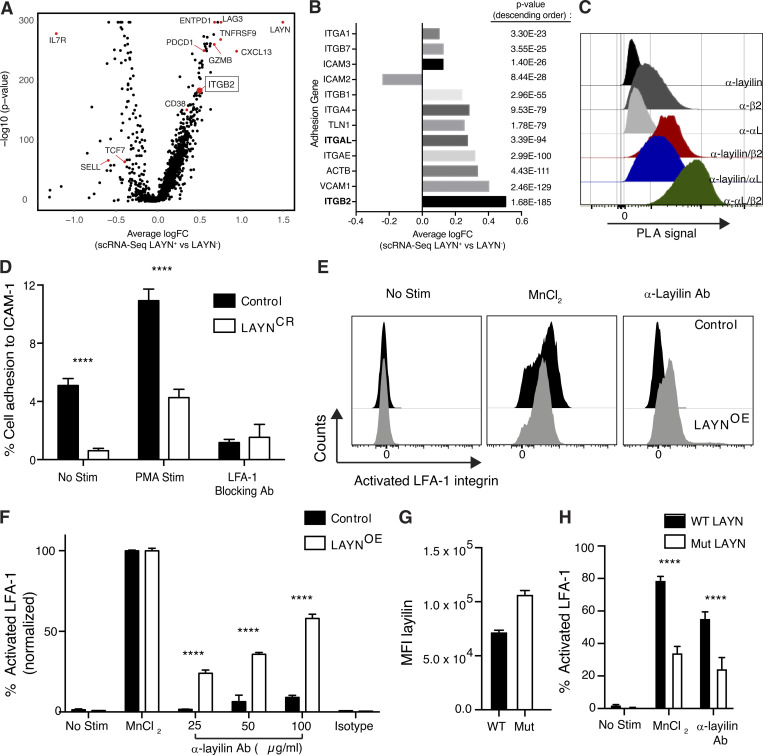
We found that layilin expression increases CD8+ TIL accumulation in vivo (Fig. 4) and the ability of these cells to kill tumor cells ex vivo (Fig. 5). Interestingly, the intracellular domain of layilin has been shown to bind talin, an adapter protein that links integrins to the cytoskeleton and is instrumental in mediating cell–cell contacts in lymphocytes (Borowsky and Hynes, 1998; Wegener et al., 2008; Abram and Lowell, 2009; Zhang and Wang, 2012). In addition, early studies using cultured cell lines suggest that layilin may play a role in forming focal adhesions to the extracellular matrix (Borowsky and Hynes, 1998; Bono et al., 2001). Thus, we hypothesized that layilin enhances TIL accumulation in tumors and tumor cell killing by forming more stable cellular adhesion events between CD8+ TILs and tumor cells. In addition, because layilin has a defined talin-binding domain (Borowsky and Hynes, 1998; Wegener et al., 2008), we further postulated that it may be mediating its effects through modulation of talin-binding integrins. To begin to test this hypothesis, we analyzed our scRNA-seq data to determine if genes involved in cellular adhesion were differentially expressed between LAYN+ and LAYN− TILs isolated from patients with metastatic melanoma. Among genes enriched in LAYN+ TILs, ITGB2, which codes for integrin β2, separated out as one of the most differentially expressed genes (Fig. 6, A and B). While multiple integrin genes, including ITGB2’s binding partner, ITGAL, were significantly enriched in LAYN+ TILs, ITGB2 had the highest log fold change (P value of 1.68 × 10−185; Fig. 6 B).
Figure 6.
Layilin enhances LFA-1 activation to promote cellular adhesion. (A) scRNA-seq analysis comparing differentially expressed genes in LAYN+ and LAYN− in CD8+ melanoma TILs. (B) Comparison of differentially expressed genes coding for adhesion molecules between LAYN+ and LAYN− cells. (C) Proximity ligation assay (PLA) on activated primary human CD8+ T cells. Representative of three experiments. (D) Static adhesion assay comparing LAYN-deleted and control primary human CD8+ T cells adhering to ICAM-1–coated plates under the following conditions: no stimulation, PMA stimulation, and with addition of an LFA-1–specific blocking antibody. Data are representative of three independent experiments; mean and SEM are shown. (E and F) Quantification and representative flow cytometric plots of the percentage of activated integrin LFA-1 (as detected by clone m24) between control and LAYN-overexpressing Jurkat cells under the following conditions: no stimulation, MnCl2 stimulation, dose–response of addition of an anti-layilin cross-linking antibody (25, 50, and 100 µg/ml), and with addition of a isotype (100 µg/ml) control for the layilin antibody. Data are representative of two independent experiments and normalized to MnCl2-positive control; mean and SEM are shown. (G and H) Flow cytometric quantification of layilin and m24 levels following addition of MnCl2 or 50 ug/ml anti-layilin. Data are representative of two independent; mean and SEM shown. Statistical significance determined by two-way ANOVA. ****, P < 0.0001. MFI, mean fluorescence intensity.
Integrins β2 and αL form the functional heterodimer, LFA-1, that is of critical importance in immune synapse formation and adhesion of cytotoxic T cells during killing of target cells (Anikeeva et al., 2005; Franciszkiewicz et al., 2013; Hammer et al., 2019). To determine if layilin is in close proximity and could potentially interact with LFA-1, we performed a flow cytometric–based proximity ligation assay. In this experiment, a productive fluorescent signal is only observed if individual cell surface proteins are colocalized within 40 nm (Söderberg et al., 2006). Antibodies against αL, β2, or layilin alone generated minimal fluorescent signal. However, the combination of anti-layilin with anti-β2 or anti-αL generated a marked increase in fluorescence intensity, albeit of lower signal than a positive control probing anti-β2 and anti-αL together (Fig. 6 C). These data suggest that layilin colocalizes with LFA-1 on the surface of CD8+ T cells. Given this close association, we functionally tested whether layilin could influence LFA-1 activity in a static adhesion assay. Control and LAYNCR CD8+ T cells were plated on ICAM-1 (the natural ligand for LFA-1)–coated plates, and the number of cells remaining after centrifugal washing was quantified. Both in the presence and absence of T cell activation with PMA, LAYNCR cells displayed significantly reduced adhesion (Fig. 6 D). Importantly, addition of LFA-1 blocking antibody abrogated all ICAM-1 binding, confirming that layilin-mediated enhancement of cell adhesion in this assay was dependent on LFA-1.
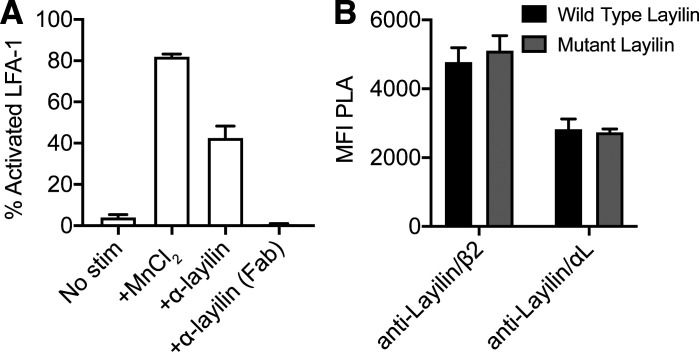
In the steady state, the LFA-1 integrin assumes a “closed” low-affinity confirmation, and intracellular signaling or extracellular interactions induce a transformation to the “open” high-affinity form (Abram and Lowell, 2009; Sun et al., 2019). This conformational change is a critical step in how LFA-1 mediates ligand binding and increased cell adhesion in multiple contexts, including CD8+ T cell–mediated killing of target cells (Anikeeva et al., 2005; Franciszkiewicz et al., 2013). Thus, we interrogated whether the mechanism by which layilin enhances LFA-1–dependent adhesion is by enhancing the activation state of this integrin. To this end, we transduced a human T cell line (i.e., Jurkat cells) with LAYN and quantified the activated open state of LFA-1 by flow cytometry. We used the m24 antibody that specifically recognizes the activated conformation of LFA-1 (Chen et al., 2010). While expression of layilin only minimally increased levels of activated LFA-1, a pronounced dose-dependent increase in LFA-1 activation was observed upon addition of a cross-linking anti-layilin monoclonal antibody (Fig. S5 A and Fig. 6, E and F). To determine if talin contributes to layilin’s ability to augment LFA-1 activation, we generated a Jurkat line transduced to express a layilin mutant with an absent talin-binding domain. Proximity ligation assays revealed no difference in layilin localization with β2 and αL between Jurkats expressing wild-type or mutant layilin lacking the intracellular talin-binding domain (Fig. S5 B). However, despite higher surface abundance of mutant layilin (Fig. 6 G), cells expressing this form of the protein were significantly deficient in their ability to activate LFA-1 in response to either manganese stimulation or layilin cross-linking (Fig. 6 H). Taken together, these data suggest that engaging layilin on T cells enhances LFA-1 activation to augment cell-to-cell adhesion via a talin-dependent mechanism.
Figure S5.
Human layilin can be cross-linked and does not require the talin for localization with LFA-1. (A) LFA-1 activation following addition of full-length anti-layilin or a derivative antigen-binding fragment (Fab). (B) Proximity ligation assay signal intensity of layilin with LFA-1 on Jurkat cells expressing either wild-type human layilin or layilin mutated to truncate the talin-binding domain. Data are representative of two independent experiments; mean and SEM are shown.
Discussion
The success of inhibitory receptor blockade raises fundamental questions as to the mechanisms regulating immune interactions in the tumor microenvironment. The observation that the relative abundance of presumably “dysfunctional” PD-1hiCTL4hi CD8+ TILs is predicative of clinical response to anti-PD-1 therapy suggest that these cells are actively maintained within tumors, retain cytotoxic potential, and are reinvigorated upon blockade of the PD-1 pathway (Im et al., 2016; Loo et al., 2017; Daud et al., 2016; Huang et al., 2019). An expanding literature has sought to profile immune cells infiltrating human cancers using RNA-seq approaches. While these studies detail the transcriptional events leading to the appearance of “dysfunctional” TILs, less is known about the function of the molecular pathways enriched in these cells and whether they promote or attenuate antitumor immunity. These types of investigations are critical in determining the most optimal pathways to target for therapeutic benefit.
Recent reports have identified the gene LAYN to be preferentially expressed in TILs isolated from several human cancers (De Simone et al., 2016; Zheng et al., 2017; Guo et al., 2018; Thommen et al., 2018). However, studies interrogating the function of this molecule on immune cells are limited. The only functional data examining the role of layilin on lymphocytes reported to date used an in vitro overexpression approach. A single set of experiments showed that layilin reduced the ability of CD8+ T cells to secrete IFN-γ (Zheng et al., 2017). These findings are inconsistent with the results of our studies and may be secondary to the different experimental approaches used. We employed in vivo and ex vivo genetic deletion approaches in both mouse and human systems, as well as a pharmacologic approach to cross-link layilin. In addition, we provide evidence for the molecular mechanism of how layilin enhances cellular adhesion. Overexpression of specific genes in vitro can result in supraphysiologic levels of cell surface protein that can induce aberrant receptor clustering (Bugaj et al., 2015; Jiang et al., 1999). Thus, it is possible that enhanced adhesion in cells expressing very high levels of layilin resulted in increased engagement of inhibitory receptor–ligand interactions in the in vitro T cell activation assay previously reported, culminating in the observed overall reduction in IFN-γ secretion.
We provide transcriptional and protein level evidence that layilin is highly expressed on a tumor-specific and clonally expanded subset of PD-1hiCTL4hi CD8+ T cells infiltrating human metastatic melanoma (Fig. 1 and Fig. 2). Coexpression of both activating and inhibitory pathways in these cells suggests that they remain poised for productive antitumor immune responses in the face of being negatively regulated in the tumor microenvironment. Our data support a role for layilin in facilitating the effector capability of cytotoxic T cells. We propose a model whereby layilin is selectively expressed on CD8+ T cells after they receive TCR engagement in peripheral tissues such as occurs in tumors and during autoimmune disease. Expression of layilin occurs after TCR stimulation, as this protein is minimally expressed on resting naive CD8+ T cells in peripheral blood and on CD8+ tissue resident memory cells in human skin (Fig. 2 C and Fig. S4 A; data not shown). Thus, layilin most likely plays a role in the effector function of these cells, as opposed to initial activation. While, layilin augments the tumor-killing capacity of CD8+ T cells, our data do not rule out similar regulation in other immune cells, such as dendritic cells and natural killer cells, as it possible that the Cre recombinase used in our studies is active in CD8+ subsets of these cells.
One of the major functions of CD8+ T cells is to kill target cells expressing their cognate antigen. Our data indicate that layilin enhances the ability of activated CD8+ T cells to survey their tissue environment and directly adhere to and kill tumor cells (Fig. 3 and Fig. 4). Layilin mediates these effects, at least in part, by enhancing the activation of LFA-1 to facilitate LFA-1–mediated cell–cell adhesion (Fig. 6). Both layilin and β2-integrin have talin-binding domains in their intracellular tails (Borowsky and Hynes, 1998; Wegener et al., 2008; Abram and Lowell, 2009). Our analysis of cells expressing layilin with a talin-binding domain mutation suggests that this interaction is dispensable for the localization of layilin and LFA-1 but contributes to layilin’s augmentation of integrin activation. Loss of layilin’s talin-binding domain reduced LFA-1 activation in response to manganese supplementation, suggesting a role for layilin in facilitating talin-mediated “outside-in” signaling events. While our data define a role for layilin in modulating the activation state of LFA-1, other talin-binding molecules may also be regulated by layilin. Our RNA-seq analysis on LAYN+ TILs (Fig. 6 B) revealed that ITGB2 is the most up-regulated gene; however, several other adhesion molecules, including ITGAE, ITGA4, and ITGB7, are also transcriptionally elevated in this subset. Moreover, the finding that talin is part of the molecular mechanism involved in layilin activity indicates that other talin-binding adhesion molecules, including other β-integrins, could be potential targets. Thus, it is possible that layilin regulates multiple adhesion molecules in addition to LFA-1. Further studies are required to fully resolve the biochemical complex contributing to these interactions as well as determine if layilin influences the activation of other talin-binding proteins expressed on activated CD8+ T cells.
The role of layilin in mediating the effector function of highly activated and clonally expanded CD8+ T cells in tumors makes it a potentially attractive target for therapeutic augmentation in cancer. The enhanced tissue-homing and cellular adhesion properties imparted by layilin could be harnessed in adoptive cell therapies where an important goal is to improve the targeting efficiency of engineered (TCR or chimeric antigen receptor) T cells. Overexpression of layilin in these cells may improve their interaction with the tumor. Further studies are required to discern whether this pathway is expressed in tissue-infiltrating CD8+ T cells in autoimmune and/or chronic inflammatory diseases. In addition, the functional consequence of layilin expression on other tissue-infiltrating T cell subsets, such as regulatory T cells remains to be determined.
Material and methods
Clinical samples
Studies using human melanoma specimens were approved by the University of California, San Francisco (UCSF) Committee on Human Research (CC138510) and the Institutional Review Board of UCSF (protocol 13–12246). All patients provided written informed consent before biopsy.
Mice
Rag2−/− and Ptprca (CD45.1) animals were purchased from The Jackson Laboratory, while the E8ICre (Zou et al., 2001) strain was a gift from Dr. Shomyseh Sanjabi (UCSF, San Francisco, CA). Germline Layn−/− and Laynf/f mice were created using a CRISPR-Cas9 approach (Cong et al., 2013). gRNAs were designed to introduce either a premature stop codon into exon 4 (Layn−/−) or a complete exon 4 deletion and delivered with Cas9 into C57BL/6 embryos. Founder pups were backcrossed to wild-type C57BL/6 mice. All animal experiments were performed on littermate age- and gender-matched 8- to 20-wk-old mice maintained through routine breeding at the UCSF School of Medicine in a specific pathogen–free facility. Experimental procedures were approved by the Institutional Animal Care and Use Committee and performed in accordance with guidelines established by the Laboratory Animal Resource Center at UCSF. MC38-LUC2 and B16.F10 cell lines were provided by Dr. Jeffrey Bluestone (UCSF, San Francisco, CA) and verified to be mycoplasma free. 105 B16.F10 or 5 × 10⁵ MC38 cells were injected subcutaneously. Tumor growth was measured either manually with calipers or bioluminescent in vivo imaging, as indicated. Tumor volume was calculated according to the formula V = (W2 × L)/2 (Faustino-Rocha et al., 2013). For adoptive transfer experiments, 2.5 × 10⁵ CD4+ and 7.5 × 10⁵ CD8+ T cells from CD8CreLAYNf/f were coinjected intravenously with equal ratios of wild-type Ptprca T cells 2 d before tumor challenge.
Tissue digestion and cell preparation
All human melanoma tumor samples were digested and prepared into single-cell suspensions as previously reported (Daud et al., 2016; Loo et al., 2017). Single-cell suspensions of mouse tumors were obtained by finely mincing tissues and digesting in a buffer cocktail containing collagenase XI, DNase, and hyaluronidase in complete RPMI for 45 min in a 37°C incubator shaker at 225 rpm. Tissue samples were then vortexed and strained through a 100-µm filter and the resulting flow through washed and pelleted for flow cytometric analysis.
Flow cytometry and cell sorting
Single-cell suspensions prepared as described above were stained with Ghost 510 Viability dye (Tonbo Biosciences) in PBS. Cells were stained for surface markers in PBS with 2% FCS. For intracellular staining, cells were fixed and permeabilized with the Foxp3/Transcription Factor Staining Buffer Set (eBioscience). For multiparameter flow cytometry, samples were run on a LSRFortessa analyzer (355-nm, 405-nm, 488-nm, 532-nm, 561-nm, 640-nm laser configuration; BD Biosciences) in the UCSF flow cytometry core and collected using FACS Diva software (BD Biosciences). Compensation was performed using UltraComp eBeads as single color controls (Thermo Fisher Scientific). Data were analyzed using FlowJo software (Tree Star).
TIL populations were sorted for RNA-seq using a FACSaria Fusion sorter (BD Biosciences). Intracellular staining controls included CTLA-4, and the PD-1 sorting gates were set based upon the CTLA-4 control gates so that >80% of sorted PD-1hiCTLA-4hi TILs had high levels of both markers (Fig. S1). Viable CD45+CD3+CD8+ TILs were sorted for scRNA-seq. For both bulk RNA-seq and scRNA-seq, cells were sorted into RPMI media containing 10% FBS and retained on ice. Samples for bulk RNA-seq were pelleted and flash frozen prior in liquid nitrogen.
Fluorophore-conjugated antibodies specific for mouse and human antigens were purchased from eBioscience, BD Biosciences, and BioLegend. The following clones were used for staining human cells: α-layilin (clone 3F7D7E2), α-CD8α (clone SK1), α-CD3 (clone SK7), α-CD18 (clone 1B4/CD18), α-Ki-67 (clone B56), α-PD-1 (EH12.2H7), α-LAG3 (3DS223H), α-TIGIT (MBSA43), α-CTLA-4 (14D3), α-granzyme B (clone GB11), α-IFN-γ (4S.B3), and α-TNF-α (MAb11). The α-layilin antibody was conjugated to biotin using the One-step Antibody Biotinylation Kit (catalog no. 130–093-385; Miltenyi Biotec) and detected with streptavidin-phycoerythrin (BioLegend). Antibodies for staining mouse cells included α-CD8α (clone 53–6.7), α-TCR-β (clone H57-597), α-CD4 (clone GK1.5), α-CD45.1 (clone A20), α-CD45.2 (clone 104), α-Ki67 (clone B56), α-IFN-γ (clone XMG1.2), α-TNF-α (clone MP6-XT22), α-granzyme B (clone GB11), and α-PD-1 (clone 29F.1A12). EdU (5-ethynyl-2′-deoxyuridine) was detected using Click-iT flow cytometry kit (Thermo Fisher Scientific).
Bulk RNA-seq
Samples were flash frozen for short-term storage in liquid nitrogen and sent to Expression Analysis, Quintiles for all subsequent processing steps. RNA isolation was performed with QIAGEN RNeasy Spin Columns, and RNA quality was assessed using an Agilent Bioanalyzer Pico Chip. RNA was then converted to cDNA libraries using the Illumina TruSeq Stranded mRNA sample preparation kit. Sequencing of cDNA libraries was performed to a 25 M read depth using an Illumina sequencing platform. After sequencing, TopHat (version 2.0.12) was used to align reads to the Ensembl GRCh38 reference genome, and SAMtools was used to generate SAM files. Htseq-count (0.6.1p1, with union option) was then used to generate read counts. Once the counts were obtained, differentially expressed genes between paired samples were determined using the R/Bioconductor package DESeq2. To compare our generated gene list with previously reported gene signatures, preranked gene set enrichment analysis (Subramanian et al., 2005) using logFC as a ranking metric was performed. Signature gene sets used for analysis include the following: T cell exhaustion signature genes (Wherry et al., 2007), tissue-resident memory signature genes (Savas et al., 2018), and activation and effector function signature genes derived from the C7 MSigDB database (systemic name M3013). Sequencing data have been uploaded to the National Center for Biotechnology Information Gene Expression Omnibus and can be accessed with the accession number GSE147620.
scRNA-seq and single-cell TCR sequencing (scTCR-seq)
scRNA-seq and scTCR-seq libraries were prepared by the UCSF Core Immunology laboratory using the 10X Chromium Single Cell 5′ Gene Expression and V(D)J Profiling Solution kit, according to the manufacturer’s instructions (10X Genomics). 150 paired-end sequencing was performed on a Novaseq 6000 instrument.
The Cell Ranger analysis pipelines (version 3.0.2; 10X Genomics) were then used to process the generated sequencing data. Data were demultiplexed into FASTQ files, aligned to the GRCh38 human reference genome, and counted, and TCR library reads were assembled into single-cell V(D)J sequences and annotations. For gene expression analysis, the R package Seurat (version 3.0; Stuart et al., 2019) was used.
Filtered gene-barcode matrices were loaded and quality-control steps were performed (low-quality or dying cells and cell doublets/multiplets were excluded from subsequent analysis). Data were normalized and scaled, and then linear dimensional reduction using principal-component analysis was performed. Highly variable genes were used to perform unsupervised clustering, and nonlinear dimensional reduction with UMAP was used to visualize the data.
For scRNA-seq analysis, human melanoma single-cell datasets were integrated with the IntegrateData function of Seurat (Stuart et al., 2019). For differential gene expression analysis comparing LAYN-expressing cells to LAYN-nonexpressing cells, data were subsetted into LAYN negative (−) and LAYN positive (+) categories using LAYN expression > 0.1 as a threshold. Heatmaps were created using the R package Pretty Heatmaps (Kolde, 2015), and volcano plots were produced with ggplot2 (Wickham, 2016).
From the 10X cellranger “vdj” and “count” outputs, clones are defined as groups of 10X barcodes with perfect amino acid sequence homology of one or both of the TCR α or β chains. No two cells both having α and β chains exist where only one chain matches. All plots were generated using the R packages ggplot2 and cowplot. GEX LAYN data were generated using the R package Seurat version 3.0 and UMAP coordinates. To generate the coxcomb plots, the top 20 clones both expressing and not expressing a marker were dichotomized by majority consensus of binarized expression for said marker. Sequencing data have been uploaded to the National Center for Biotechnology Information Gene Expression Omnibus and can be accessed with the accession number GSE148190.
LAYN CRISPR-Cas9 gene editing in human primary cells
Human peripheral blood mononuclear cells (PBMCs) from two individual donors were purchased from AllCells. CD8+ T cells were enriched from these samples using a negative selection kit (STEMCELL Technologies). Isolated T cells were activated with αCD3/CD28 ImmunoCult reagent and grown in ImmunoCult-XF T cell Expansion Medium (STEMCELL Technologies) with the addition of 10 ng/ml IL-15 and 100 U/ml IL-2. To delete LAYN at the genomic level, we used a gRNA targeting exon 4 (single gRNA target sequence 5′-GGTCATGTACCATCAGCCAT-3′) and a nontargeting “scramble” control sequence (5′-GGTTCTTGACTACCGTAAT-3′); gRNAs were purchased from Integrated DNA Technologies. Recombinant Cas9 protein (UC Berkeley QB3 Macrolab) was combined with gRNA and introduced into primary T cells via electroporation as previously described (Schumann et al., 2015; Roth et al., 2018). Cells were subsequently cultured for 4 d before analyzing or incorporating into functional assays.
In vitro human T cell assays
Cytotoxicity assays were designed as previously described (Shifrut et al., 2018). Briefly, CD8+ T cells were transduced with lentivirus containing the 1G4 NY-ESO1 reactive α95:LY TCR construct and sort purified to generate a uniform population. These cells then underwent LAYN deletion with CRISPR-Cas9 gene editing (described above) and were cocultured with A375 melanoma cells expressing RFP in varying cellular ratios. A375 numbers were monitored over 5 d using the IncuCyte platform. Cytokine protein levels were determined by multiplex ELISA (Eve Technologies). Static adhesion experiments were performed by coating nontissue culture-treated polystyrene 96-well flat-bottom plates with recombinant human ICAM-1 (R&D Systems) at 10 µg/ml. T cells were labeled with calcein AM (Thermo Fisher Scientific) and loaded onto plates at 2 × 10⁶ cells/ml together with the indicated stimulus. PMA was added at 10 ng/ml, while LFA-1 blocking was accomplished with 10 µg/ml anti-CD11a (clone HI111; Thermo Fisher Scientific). After incubating for 15 min at 37°C, plates were flipped upside down and centrifuged at 50 g for 5 min. Fluorescence intensity was measured with a plate reader (PerkinElmer). Proximity ligation assays were performed using the Duolink PLA flow cytometry kit (Millipore Sigma) with the following antibodies: mouse α-layilin (clone 3F7D7E2; Sino Biological), rabbit α-CD18 (polyclonal; ProteinTech), and rabbit α-CD11a (clone EP1285Y; Abcam). For measurement of LFA-1 activation, Jurkat E6-1 cells were transduced with a lentivirus containing a full-length or truncated LAYN construct. Expressing cells were selected to form a stable line. LFA-1 activation was reported by staining the cells at 37°C with clone m24 (BioLegend) in 20 mM Hepes, 140 mM NaCl, 1 mM MgCl2, 1 mM CaCl2, 2 mg/ml glucose, and 0.5% BSA. 2 mM MnCl2 was used as a positive control.
Statistical analysis
Statistical analyses were performed with Prism software (GraphPad). For wet laboratory experiments, a two-tailed unpaired Student’s t test or two-way ANOVA was used to calculate P values, and appropriate statistical analysis assuming a normal sample distribution was applied, as indicated. RNA-seq experiments were analyzed as described in the above section. All experiments were performed with at least two independent trials, as indicated. P values correlate with symbols as follows: ns, not significant; *, P < 0.05; **, P < 0.01; ***, P < 0.001; ****, P < 0.0001.
Online supplemental material
Fig. S1 shows the flow cytometric gating and sorting strategy. Fig. S2 shows comparative scRNA-seq analysis of human melanoma CD8+ TIL subsets. Fig. S3 shows layilin expressed on mouse CD8+ T cells protects against tumor growth. Fig. S4 shows layilin expression and gene editing in human CD8+ T cells. Fig. S5 shows human layilin can be cross-linked and does not require talin for localization with LFA-1. Table S1 lists clinical sample and human donor demographics.
Supplementary Material
lists clinical sample and human donor demographics. It shows melanoma patient and PBMC donor samples used in flow cytometry, in vitro studies, bulk RNA-seq, and/or scRNA-seq.
Acknowledgments
We thank the staff of the UCSF Parnassus Flow Cytometry Core and Laboratory Animal Resource Center for research support.
The Parnassus Flow Cytometry Core is funded by a National Institutes of Health Diabetes Research Center grant (P30 DK063720). This work was supported by a National Institutes of Health National Institute of Arthritis and Musculoskeletal and Skin Diseases R21 grant (R21AR72195 to M.D. Rosenblum), a TRex Bio research support grant (M.D. Rosenblum), generous gifts provided by Inga-Lill and David Amoroso as well as Stephen Juelsgaard and Lori Cook (A.I. Daud and M.D. Rosenblum), a Human Frontiers Science Program long-term fellowship (LT000183/2018-L to J.M. Moreau), and a National Institutes of Health T32 Training Grant in Gastrointestinal Surgery (5T32DK007573 to K.M. Mahuron).
Author contributions: Conceptualization, K.M. Mahuron, J.M. Moreau, and M.D. Rosenblum; Methodology, K.M. Mahuron, J.M. Moreau, J.E. Glasgow, E. Shifrut, A. Marson, M. Singer, J. Wells, A.I. Daud, and M.D. Rosenblum; Investigation, K.M. Mahuron, J.M. Moreau, D.P. Boda, J.E. Glasgow, M.L. Pauli, V. Gouirand, R. Grewal, L. Panjabi, A.N. Mathur, R.M. Feldman, and J.M. Luber; Resources, J.E. Glasgow, E. Shifrut, A.N. Mathur, R.M. Feldman, P. Mehta, M.M. Lowe, A. Marson, M.D. Alvarado, R. Jupp, J. Wells, and A.I. Daud; Writing, K.M. Mahuron, J.M. Moreau, and M.D. Rosenblum; Supervision, M.D. Rosenblum; Funding acquisition, M.D. Rosenblum.
References
- Abram C.L., and Lowell C.A.. 2009. The ins and outs of leukocyte integrin signaling. Annu. Rev. Immunol. 27:339–362. 10.1146/annurev.immunol.021908.132554 [DOI] [PMC free article] [PubMed] [Google Scholar]
- Alfei F., Kanev K., Hofmann M., Wu M., Ghoneim H.E., Roelli P., Utzschneider D.T., von Hoesslin M., Cullen J.G., Fan Y., et al. 2019. TOX reinforces the phenotype and longevity of exhausted T cells in chronic viral infection. Nature. 571:265–269. 10.1038/s41586-019-1326-9 [DOI] [PubMed] [Google Scholar]
- Anikeeva N., Somersalo K., Sims T.N., Thomas V.K., Dustin M.L., and Sykulev Y.. 2005. Distinct role of lymphocyte function-associated antigen-1 in mediating effective cytolytic activity by cytotoxic T lymphocytes. Proc. Natl. Acad. Sci. USA. 102:6437–6442. 10.1073/pnas.0502467102 [DOI] [PMC free article] [PubMed] [Google Scholar]
- Bono P., Rubin K., Higgins J.M., and Hynes R.O.. 2001. Layilin, a novel integral membrane protein, is a hyaluronan receptor. Mol. Biol. Cell. 12:891–900. 10.1091/mbc.12.4.891 [DOI] [PMC free article] [PubMed] [Google Scholar]
- Borowsky M.L., and Hynes R.O.. 1998. Layilin, a novel talin-binding transmembrane protein homologous with C-type lectins, is localized in membrane ruffles. J. Cell Biol. 143:429–442. 10.1083/jcb.143.2.429 [DOI] [PMC free article] [PubMed] [Google Scholar]
- Bugaj L.J., Spelke D.P., Mesuda C.K., Varedi M., Kane R.S., and Schaffer D.V.. 2015. Regulation of endogenous transmembrane receptors through optogenetic Cry2 clustering. Nat. Commun. 6:6898 10.1038/ncomms7898 [DOI] [PMC free article] [PubMed] [Google Scholar]
- Chen X., Xie C., Nishida N., Li Z., Walz T., and Springer T.A.. 2010. Requirement of open headpiece conformation for activation of leukocyte integrin alphaXbeta2. Proc. Natl. Acad. Sci. USA. 107:14727–14732. 10.1073/pnas.1008663107 [DOI] [PMC free article] [PubMed] [Google Scholar]
- Cong L., Ran F.A., Cox D., Lin S., Barretto R., Habib N., Hsu P.D., Wu X., Jiang W., Marraffini L.A., et al. 2013. Multiplex genome engineering using CRISPR/Cas systems. Science. 339:819–823. 10.1126/science.1231143 [DOI] [PMC free article] [PubMed] [Google Scholar]
- Daud A.I., Loo K., Pauli M.L., Sanchez-Rodriguez R., Sandoval P.M., Taravati K., Tsai K., Nosrati A., Nardo L., Alvarado M.D., et al. 2016. Tumor immune profiling predicts response to anti-PD-1 therapy in human melanoma. J. Clin. Invest. 126:3447–3452. 10.1172/JCI87324 [DOI] [PMC free article] [PubMed] [Google Scholar]
- De Simone M., Arrigoni A., Rossetti G., Gruarin P., Ranzani V., Politano C., Bonnal R.J.P., Provasi E., Sarnicola M.L., Panzeri I., et al. 2016. Transcriptional Landscape of Human Tissue Lymphocytes Unveils Uniqueness of Tumor-Infiltrating T Regulatory Cells. Immunity. 45:1135–1147. 10.1016/j.immuni.2016.10.021 [DOI] [PMC free article] [PubMed] [Google Scholar]
- Dirkx A.E.M., Oude Egbrink M.G.A., Kuijpers M.J.E., van der Niet S.T., Heijnen V.V.T., Bouma-ter Steege J.C.A., Wagstaff J., and Griffioen A.W.. 2003. Tumor angiogenesis modulates leukocyte-vessel wall interactions in vivo by reducing endothelial adhesion molecule expression. Cancer Res. 63:2322–2329. [PubMed] [Google Scholar]
- Duhen T., Duhen R., Montler R., Moses J., Moudgil T., de Miranda N.F., Goodall C.P., Blair T.C., Fox B.A., McDermott J.E., et al. 2018. Co-expression of CD39 and CD103 identifies tumor-reactive CD8 T cells in human solid tumors. Nat. Commun. 9:2724 10.1038/s41467-018-05072-0 [DOI] [PMC free article] [PubMed] [Google Scholar]
- Faustino-Rocha A., Oliveira P.A., Pinho-Oliveira J., Teixeira-Guedes C., Soares-Maia R., da Costa R.G., Colaço B., Pires M.J., Colaço J., Ferreira R., et al. 2013. Estimation of rat mammary tumor volume using caliper and ultrasonography measurements. Lab Anim. (NY). 42:217–224. 10.1038/laban.254 [DOI] [PubMed] [Google Scholar]
- Franciszkiewicz K., Le Floc’h A., Boutet M., Vergnon I., Schmitt A., and Mami-Chouaib F.. 2013. CD103 or LFA-1 engagement at the immune synapse between cytotoxic T cells and tumor cells promotes maturation and regulates T-cell effector functions. Cancer Res. 73:617–628. 10.1158/0008-5472.CAN-12-2569 [DOI] [PubMed] [Google Scholar]
- Guo X., Zhang Y., Zheng L., Zheng C., Song J., Zhang Q., Kang B., Liu Z., Jin L., Xing R., et al. 2018. Global characterization of T cells in non-small-cell lung cancer by single-cell sequencing. Nat. Med. 24:978–985. 10.1038/s41591-018-0045-3 [DOI] [PubMed] [Google Scholar]
- Hammer J.A., Wang J.C., Saeed M., and Pedrosa A.T.. 2019. Origin, Organization, Dynamics, and Function of Actin and Actomyosin Networks at the T Cell Immunological Synapse. Annu. Rev. Immunol. 37:201–224. 10.1146/annurev-immunol-042718-041341 [DOI] [PMC free article] [PubMed] [Google Scholar]
- Harjunpää H., Llort Asens M., Guenther C., and Fagerholm S.C.. 2019. Cell adhesion molecules and their roles and regulation in the immune and tumor microenvironment. Front. Immunol. 10:1078 10.3389/fimmu.2019.01078 [DOI] [PMC free article] [PubMed] [Google Scholar]
- Huang A.C., Orlowski R.J., Xu X., Mick R., George S.M., Yan P.K., Manne S., Kraya A.A., Wubbenhorst B., Dorfman L., et al. 2019. A single dose of neoadjuvant PD-1 blockade predicts clinical outcomes in resectable melanoma. Nat. Med. 25:454–461. 10.1038/s41591-019-0357-y [DOI] [PMC free article] [PubMed] [Google Scholar]
- Im S.J., Hashimoto M., Gerner M.Y., Lee J., Kissick H.T., Burger M.C., Shan Q., Hale J.S., Lee J., Nasti T.H., et al. 2016. Defining CD8+ T cells that provide the proliferative burst after PD-1 therapy. Nature. 537:417–421. 10.1038/nature19330 [DOI] [PMC free article] [PubMed] [Google Scholar]
- Jiang Y., Woronicz J.D., Liu W., and Goeddel D.V.. 1999. Prevention of constitutive TNF receptor 1 signaling by silencer of death domains. Science. 283:543–546. 10.1126/science.283.5401.543 [DOI] [PubMed] [Google Scholar]
- Kather J.N., Suarez-Carmona M., Charoentong P., Weis C.A., Hirsch D., Bankhead P., Horning M., Ferber D., Kel I., Herpel E., et al. 2018. Topography of cancer-associated immune cells in human solid tumors. eLife. 7 e36967 10.7554/eLife.36967 [DOI] [PMC free article] [PubMed] [Google Scholar]
- Khan O., Giles J.R., McDonald S., Manne S., Ngiow S.F., Patel K.P., Werner M.T., Huang A.C., Alexander K.A., Wu J.E., et al. 2019. TOX transcriptionally and epigenetically programs CD8+ T cell exhaustion. Nature. 571:211–218. 10.1038/s41586-019-1325-x [DOI] [PMC free article] [PubMed] [Google Scholar]
- Kolde R. 2015. Pheatmap: pretty heatmaps. R Package Version 1.0.12. https://rdrr.io/cran/pheatmap/
- Loo K., Tsai K.K., Mahuron K., Liu J., Pauli M.L., Sandoval P.M., Nosrati A., Lee J., Chen L., Hwang J., et al. 2017. Partially exhausted tumor-infiltrating lymphocytes predict response to combination immunotherapy. JCI Insight. 2 e93433 10.1172/jci.insight.93433 [DOI] [PMC free article] [PubMed] [Google Scholar]
- Mariathasan S., Turley S.J., Nickles D., Castiglioni A., Yuen K., Wang Y., Kadel E.E. III, Koeppen H., Astarita J.L., Cubas R., et al. 2018. TGFβ attenuates tumour response to PD-L1 blockade by contributing to exclusion of T cells. Nature. 554:544–548. 10.1038/nature25501 [DOI] [PMC free article] [PubMed] [Google Scholar]
- Melero I., Rouzaut A., Motz G.T., and Coukos G.. 2014. T-cell and NK-cell infiltration into solid tumors: a key limiting factor for efficacious cancer immunotherapy. Cancer Discov. 4:522–526. 10.1158/2159-8290.CD-13-0985 [DOI] [PMC free article] [PubMed] [Google Scholar]
- Park S.L., Buzzai A., Rautela J., Hor J.L., Hochheiser K., Effern M., McBain N., Wagner T., Edwards J., McConville R., et al. 2019. Tissue-resident memory CD8+ T cells promote melanoma-immune equilibrium in skin. Nature. 565:366–371. 10.1038/s41586-018-0812-9 [DOI] [PubMed] [Google Scholar]
- Peranzoni E., Lemoine J., Vimeux L., Feuillet V., Barrin S., Kantari-Mimoun C., Bercovici N., Guérin M., Biton J., Ouakrim H., et al. 2018. Macrophages impede CD8 T cells from reaching tumor cells and limit the efficacy of anti-PD-1 treatment. Proc. Natl. Acad. Sci. USA. 115:E4041–E4050. 10.1073/pnas.1720948115 [DOI] [PMC free article] [PubMed] [Google Scholar]
- Roth T.L., Puig-Saus C., Yu R., Shifrut E., Carnevale J., Li P.J., Hiatt J., Saco J., Krystofinski P., Li H., et al. 2018. Reprogramming human T cell function and specificity with non-viral genome targeting. Nature. 559:405–409. 10.1038/s41586-018-0326-5 [DOI] [PMC free article] [PubMed] [Google Scholar]
- Savas P., Virassamy B., Ye C., Salim A., Mintoff C.P., Caramia F., Salgado R., Byrne D.J., Teo Z.L., Dushyanthen S., et al. ; Kathleen Cuningham Foundation Consortium for Research into Familial Breast Cancer (kConFab) . 2018. Single-cell profiling of breast cancer T cells reveals a tissue-resident memory subset associated with improved prognosis. Nat. Med. 24:986–993. 10.1038/s41591-018-0078-7 [DOI] [PubMed] [Google Scholar]
- Schumann K., Lin S., Boyer E., Simeonov D.R., Subramaniam M., Gate R.E., Haliburton G.E., Ye C.J., Bluestone J.A., Doudna J.A., et al. 2015. Generation of knock-in primary human T cells using Cas9 ribonucleoproteins. Proc. Natl. Acad. Sci. USA. 112:10437–10442. 10.1073/pnas.1512503112 [DOI] [PMC free article] [PubMed] [Google Scholar]
- Scott A.C., Dündar F., Zumbo P., Chandran S.S., Klebanoff C.A., Shakiba M., Trivedi P., Menocal L., Appleby H., Camara S., et al. 2019. TOX is a critical regulator of tumour-specific T cell differentiation. Nature. 571:270–274. 10.1038/s41586-019-1324-y [DOI] [PMC free article] [PubMed] [Google Scholar]
- Shifrut E., Carnevale J., Tobin V., Roth T.L., Woo J.M., Bui C.T., Li P.J., Diolaiti M.E., Ashworth A., and Marson A.. 2018. Genome-wide CRISPR Screens in Primary Human T Cells Reveal Key Regulators of Immune Function. Cell. 175:1958–1971.e15. 10.1016/j.cell.2018.10.024 [DOI] [PMC free article] [PubMed] [Google Scholar]
- Simoni Y., Becht E., Fehlings M., Loh C.Y., Koo S.L., Teng K.W.W., Yeong J.P.S., Nahar R., Zhang T., Kared H., et al. 2018. Bystander CD8+ T cells are abundant and phenotypically distinct in human tumour infiltrates. Nature. 557:575–579. 10.1038/s41586-018-0130-2 [DOI] [PubMed] [Google Scholar]
- Söderberg O., Gullberg M., Jarvius M., Ridderstråle K., Leuchowius K.J., Jarvius J., Wester K., Hydbring P., Bahram F., Larsson L.G., et al. 2006. Direct observation of individual endogenous protein complexes in situ by proximity ligation. Nat. Methods. 3:995–1000. 10.1038/nmeth947 [DOI] [PubMed] [Google Scholar]
- Stuart T., Butler A., Hoffman P., Hafemeister C., Papalexi E., Mauck W.M. III, Hao Y., Stoeckius M., Smibert P., and Satija R.. 2019. Comprehensive Integration of Single-Cell Data. Cell. 177:1888–1902.e21. 10.1016/j.cell.2019.05.031 [DOI] [PMC free article] [PubMed] [Google Scholar]
- Subramanian A., Tamayo P., Mootha V.K., Mukherjee S., Ebert B.L., Gillette M.A., Paulovich A., Pomeroy S.L., Golub T.R., Lander E.S., et al. 2005. Gene set enrichment analysis: a knowledge-based approach for interpreting genome-wide expression profiles. Proc. Natl. Acad. Sci. USA. 102:15545–15550. 10.1073/pnas.0506580102 [DOI] [PMC free article] [PubMed] [Google Scholar]
- Sun Z., Costell M., and Fässler R.. 2019. Integrin activation by talin, kindlin and mechanical forces. Nat. Cell Biol. 21:25–31. 10.1038/s41556-018-0234-9 [DOI] [PubMed] [Google Scholar]
- Thommen D.S., Koelzer V.H., Herzig P., Roller A., Trefny M., Dimeloe S., Kiialainen A., Hanhart J., Schill C., Hess C., et al. 2018. A transcriptionally and functionally distinct PD-1+ CD8+ T cell pool with predictive potential in non-small-cell lung cancer treated with PD-1 blockade. Nat. Med. 24:994–1004. 10.1038/s41591-018-0057-z [DOI] [PMC free article] [PubMed] [Google Scholar]
- Walling B.L., and Kim M.. 2018. LFA-1 in T cell migration and differentiation. Front. Immunol. 9:952 10.3389/fimmu.2018.00952 [DOI] [PMC free article] [PubMed] [Google Scholar]
- Wegener K.L., Basran J., Bagshaw C.R., Campbell I.D., Roberts G.C.K., Critchley D.R., and Barsukov I.L.. 2008. Structural basis for the interaction between the cytoplasmic domain of the hyaluronate receptor layilin and the talin F3 subdomain. J. Mol. Biol. 382:112–126. 10.1016/j.jmb.2008.06.087 [DOI] [PubMed] [Google Scholar]
- Wei S.C., Duffy C.R., and Allison J.P.. 2018. Fundamental mechanisms of immune checkpoint blockade therapy. Cancer Discov. 8:1069–1086. 10.1158/2159-8290.CD-18-0367 [DOI] [PubMed] [Google Scholar]
- Wherry E.J., Ha S.-J., Kaech S.M., Haining W.N., Sarkar S., Kalia V., Subramaniam S., Blattman J.N., Barber D.L., and Ahmed R.. 2007. Molecular signature of CD8+ T cell exhaustion during chronic viral infection. Immunity. 27:670–684. 10.1016/j.immuni.2007.09.006 [DOI] [PubMed] [Google Scholar]
- Wickham H. 2016. ggplot2: Elegant Graphics for Data Analysis. Springer-Verlag, New York. [Google Scholar]
- Yost K.E., Satpathy A.T., Wells D.K., Qi Y., Wang C., Kageyama R., McNamara K.L., Granja J.M., Sarin K.Y., Brown R.A., et al. 2019. Clonal replacement of tumor-specific T cells following PD-1 blockade. Nat. Med. 25:1251–1259. 10.1038/s41591-019-0522-3 [DOI] [PMC free article] [PubMed] [Google Scholar]
- Zhang Y., and Wang H.. 2012. Integrin signalling and function in immune cells. Immunology. 135:268–275. 10.1111/j.1365-2567.2011.03549.x [DOI] [PMC free article] [PubMed] [Google Scholar]
- Zheng C., Zheng L., Yoo J.K., Guo H., Zhang Y., Guo X., Kang B., Hu R., Huang J.Y., Zhang Q., et al. 2017. Landscape of Infiltrating T Cells in Liver Cancer Revealed by Single-Cell Sequencing. Cell. 169:1342–1356.e16. 10.1016/j.cell.2017.05.035 [DOI] [PubMed] [Google Scholar]
- Zou Y.R., Sunshine M.J., Taniuchi I., Hatam F., Killeen N., and Littman D.R.. 2001. Epigenetic silencing of CD4 in T cells committed to the cytotoxic lineage. Nat. Genet. 29:332–336. 10.1038/ng750 [DOI] [PubMed] [Google Scholar]
Associated Data
This section collects any data citations, data availability statements, or supplementary materials included in this article.
Supplementary Materials
lists clinical sample and human donor demographics. It shows melanoma patient and PBMC donor samples used in flow cytometry, in vitro studies, bulk RNA-seq, and/or scRNA-seq.


