

Abstract
Pleural effusion (PE) remains insurmountable challenge and public health problem, requiring novel noninvasive biomarkers for accurate diagnosis. The aim of this study was to assess the clinical significance of apolipoprotein E (Apo-E) in PE, in order to determine its potential use as a diagnostic biomarker for malignant PE (MPE).
PE samples were obtained from 127 patients and the etiology of PE was determined by multiple diagnostic techniques. Apo-E levels were then measured in the pleural fluid samples.
58 PE patients were diagnosed with tumors, while 69 were tumor-free. Apo-E levels in MPE patients were significantly higher than those with benign PE (BPE) (P < .05). An Apo-E cut-off of 69.96 ng/mL yielded sensitivity and specificity of 79.31% and 73.91% respectively for MPE detection. The area under the curve for Apo-E was 0.793 (95% confidence interval: 0.712 to 0.860), which was smaller than that of carcinoembryonic antigen (CEA) (Z = 2.081, P<.05). In addition, the combination of Apo-E and CEA detection yielded a higher sensitivity of 87.90% and specificity of 95.65% in diagnosing MPE.
In conclusion, Apo-E levels in PE may be a potential biomarker for the detection of MPE. The combined detection of Apo-E and CEA could improve the diagnostic sensitivity and specificity for MPE. These findings provide a simple and convenient method for clinical screening and detection of PE.
Keywords: apolipoprotein E, diagnosis, malignant, pleural effusion, sensitivity, specificity
1. Introduction
Pleural effusion (PE) is a common clinical condition with more than 50 recognized causes.[1] Since malignant PE (MPE) has significant mortality, it is essential to rapidly distinguish it from the benign PE (BPE). However, it is still an analytical challenge since the diagnosis process is long and invasive, which further increases the risk for the patients.[2] The gold standard for MPE diagnosis include pleural biopsy and exfoliative cytology which have an average sensitivity of 60%, depending on the underlying primary tumor, specimen preparation and experience of the cytologist.[3,4] Thoracoscopy has the highest diagnostic sensitivity of more than 90%,[5] and is also highly invasive, thereby precluding its use on older individuals, or those in poor physical condition.[6] The recent advancements in high-throughput techniques like proteomics and genomics have revealed several biomarkers for this condition, and the over expression of apolipoprotein E (Apo-E) has been shown to be related to this malignancy.[7–10]Moreover, Apo-E levels were also elevated in the PE of patients with nonsmall cell lung cancer.[11] Many human lung cancer cell lines overexpress Apo-E, especially those derived from MPE in patients with lung adenocarcinoma,[12] but that needs to be validated prospectively. At a cut-off level that achieves 100% specificity for the diagnosis of malignancy, a panel of pleural fluid tumour markers including carcinoembryonic antigen (CEA), CA-125, CA 15-3 and cytokeratin fragments 19 has been shown to reach a combined sensitivity of only 54%, such that a negative result cannot be used to support a conservative approach to monitoringand investigation.[1] Therefore, researchers have been trying to devise a novel, non-invasive diagnostic method for MPE, with higher sensitivity and specificity. The aim of this study was to further determine the clinical efficacy and diagnostic accuracy of Apo-E for predicting malignancy in patients with unilateral PE. The diagnostic efficacies of Apo-E and CEA were also compared, and the diagnostic value of the Apo-E and CEA combination in differentiating MPE from BPE was assessed, which expanded the research of of Wang et al.[13]
2. Subjects and methods
2.1. Participants
This was a prospective study patients with PE for the first time admitted for further analysis at the Department of Respiratory, Ningde Municipal Hospital Affiliated to Fujian Medical University between January 2015 and December 2018. For each patient, PE diagnosis was based on medical history(cough, chest pain, dyspnea, and /or fever) and physical examination (decreased breath sounds and percussion dullness), and confirmed by chest imaging. The inclusion criteria:
-
(1)
All adult patients(aged >18years) admitted to hospital with unilateral PE.
-
(2)
The depth of PE was measured by ultrasonography greater than 2 cm, which enabled pleural fluid aspiration.
Patients with such conditions:
-
(1)
The presence of coagulopathic states, systemic anticoagulation, platelet dysfunction.
-
(2)
Patients with evidence of skin or soft tissue infection overlaying the site of needle insertion.
-
(3)
Patients with severe disease may not tolerate the thoracentesis were excluded.
The patients who met the inclusion criteria were coded according to the order of admission, and 30 patients were randomly selected from every 100 patients using a random number generator. The demographic and diagnostic data of the eligible patients were recorded from the charts, and the cases were classified as MPE or BPE according to their etiologies. All participants gave informed consent, and the study was approved by the ethics committee of Ningde Municipal Hospital Affiliated to Fujian Medical University.
2.2. Acquisition and detection of PE
Pleural fluid (20 ml) was siphoned within 12 hours of hospitalization from each patient by thoracentesis, and were collected in tubes containing ethylene diamine tetraacetic acid. The specimens were centrifuged at 3000 rpm for 10 minute, and the extracted supernatant was stored at -80°C until use. Apo-E, CEA, lactate dehydrogenase (LDH), adenosine deaminase (ADA) levels in the pleural fluid samples were determined by a clinical technician blinded to the clinical data.
2.3. Instruments and reagents
CEA was detected by Roche cobas e 601 electro-chemiluminescence immuno-analyzer and suitable reagents. ADA and LDH were analyzed by Roche cobas c702 automatic biochemical analyzer using the peroxidase and colorimetric methods respectively. Apo-E was detected by enzyme-linked immunosorbent assay, as per the instructions provided along with the kit (Shanghai Meixuan Biotechnology Co. Ltd.). The above tests were conducted by investigators who were blinded to the clinical information.
2.4. Reference standard of MPE and BPE
In accordance with the PE diagnosis protocol released by British Thoracic Society,[1] the etiology of PE was determined by conventional fluid analysis, including cell classification count, protein quantitation, LDH and ADA levels, microbial culture, cytological examination of the pleural fluid, pleural biopsy (blind, radiologically-guided or direct visualization of the pleura), trans-bronchoscopic biopsy, lymph node biopsy, antinuclear antibody set, acid-fast staining of phlegm, and/or positron emission tomography and computer tomography scanning. A PE was categorized as definitively tumor-related if tumor cells were found in the pleural fluid or biopsy. A positive diagnosis of MPE was made when a primary or metastatic carcinoma, which could cause PE without any additional factors, were seen adjacent to the pleura. BPE was identified as tuberculous PE, parapneumonic effusion or connective tissue diseases -associated PE and so on. The diagnosis of tuberculous PE was confirmed when 1 of the following criteria was achieved: Mycobacterium tuberculosis was identified based on the stain of sputum or bronchoalveolar lavage fluid (BALF); typical caseating granuloma was found by biopsy for histologic examination; or a remarkable response to antituberculosis treatment was presented. PE associated with pneumonia and response to antibiotics was confirmed as parapneumonic effusion. PE asoociated with rheumatoid arthritis, systemic lupus erythematosus and so on was classified as connective tissue diseases-associated PE. In case the etiology was unclear initially, we followed up the patients at the outpatient department or called them to inquire about any changes in their condition, diagnosis, or treatment until a definitive etiology was determined. Two experienced clinicians were trained to conduct separate quality control for the diagnosis of related diseases. If the results were not consistent, the study group decided the results after discussion.
2.5. Statistical analysis
The Kolmogorov-Smirnov test was used to evaluate the distribution of all variables. For normally distributed data, results are presented as mean ± standard deviation, and for non-normally distributed data, median (interquartile) was used. BPE and MPE groups were compared by Mann–Whitney U test or t test. Differences between categorical variables were tested by the chi-square test. Logistic regression analysis was used to determine factors affecting the test results. A receiver operating characteristic (ROC) curve was created using the pleural fluid Apo-E and CEA levels, with cutoff value taken from the concentration at the maximum Jordan exponent, and the area under the curve (AUC) was used to evaluate the ability of Apo-E and CEA tests to differentiate MPE from BPE. AUCs were compared using medcalc 15.2 (medcalc software bvba, Ostend, Belgium), and other statistical analyses was performed using SPSS 16.0 (IBM, Armonk, NY). P < .05 was considered statistically significant.
3. Results
3.1. Etiology of PE
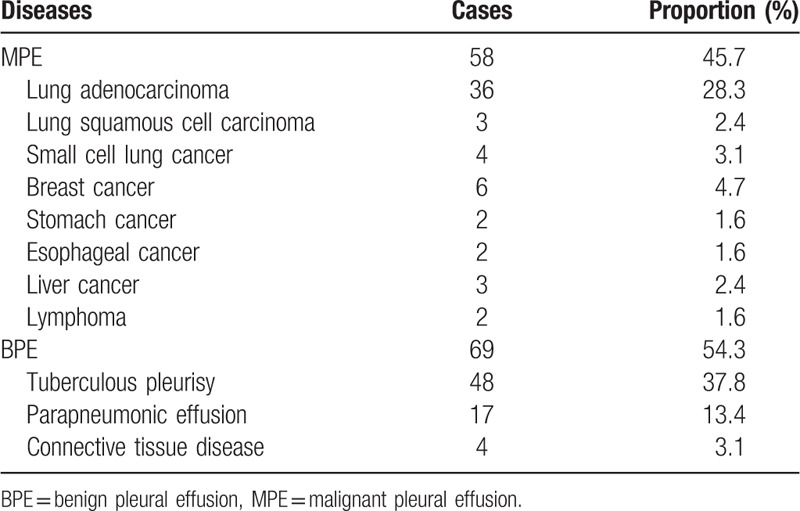
A total of 446 participants with unilateral PE were admitted to our hospital and 6 patients were excluded because of physical or mental conditions. One - hundred thirty two patients were selected randomly from 440 consecutive nonselected patients with unilateral PE. The etiology of PE was initially identified in 104 cases.3 patients with inconclusive etiology who rejected biopsy for histologic examination were excluded. The remaining 25 cases were followed up but 2 patients were excluded for lost follow-up. The etiology of PE in follow-up patients was established by repeated examination in our or other hospitals. The longest time taken to determine the etiology was almost 3 months. A total of 127 patients were eventually enrolled in our study (Fig. 1). The frequency distribution of PE etiologies is shown in Table 1. Fifty-eight PE patients presented with a tumor, of which lung cancer was most prevalent (n = 43). Sixty-nine patients were diagnosed with other non-malignant diseases, including tuberculous pleurisy (n = 48), parapneumonic effusion (n = 17), and connective tissue disease (n = 4). There were no additional side effects for Apo-E detection.
Figure 1.
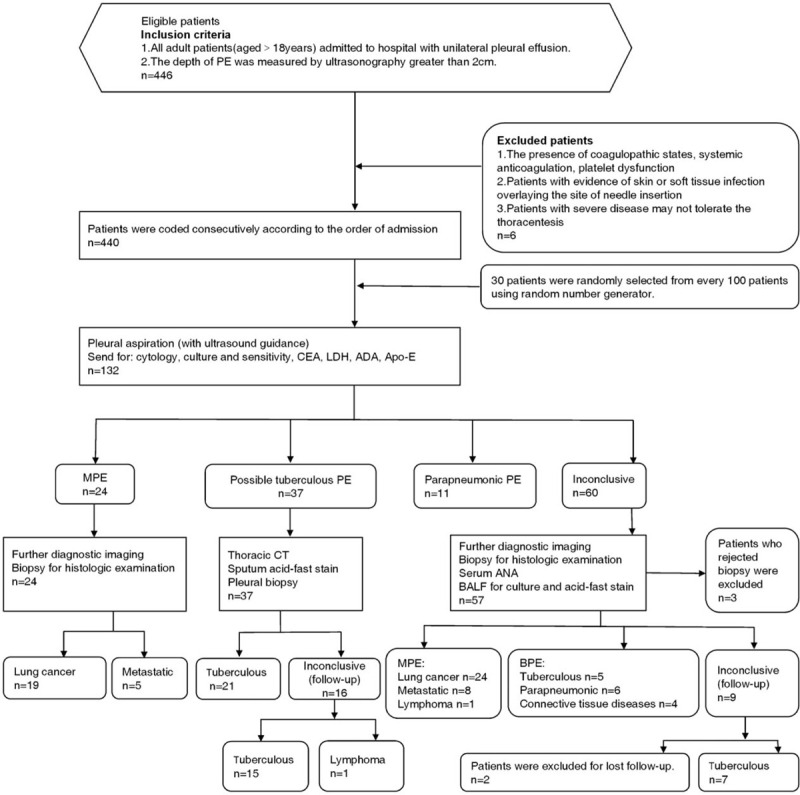
Study flow chart of enrolling patients. ADA = adenosine deaminase, ANA = antinuclear antibodies, Apo-E = apolipoprotein E, BALF = bronchoalveolar lavage fluid, BPE = benign pleural effusion, CEA = carcinoembryonic antigen, CT = computer tomography, LDH = lactate dehydrogenase, MPE = malignant pleural effusion, PE = pleural effusion.
Table 1.
Etiological distribution of unilateral pleural effusion (total n = 127).
3.2. Demographic and clinical characteristics
Demographic and clinical characteristics of participants enrolled in this study are shown in Table 2. Age and smoking index (SI: the average root number per day multiplied by years of smoking) of the MPE group was notably higher than the BPE group (P <.05),and fever rate of the MPE group was lower than the BPE group (P <.05),while sex, body mass index,chest pain and dyspnea between the 2 groups were not statistically significant (P >.05). The levels of Apo-E, CEA, ADA, and LDH in the pleural fluid were compared between the MPE and BPE groups. The Apo-E levels were significantly higher in the MPE compared to the BPE patients [121.96 ± 68.97 ng/ml vs 45.12(53.37) ng/mL, P < .05, Fig. 2]. CEA and LDH levels were significantly higher, and that of ADA was significantly lower in the MPE group compared to the BPE group (P < .05 for all).
Table 2.
Clinical characteristics and levels of markers in pleural fluid (total n = 127).
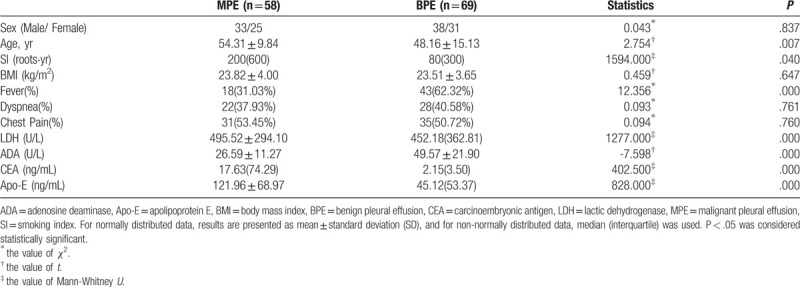
Figure 2.
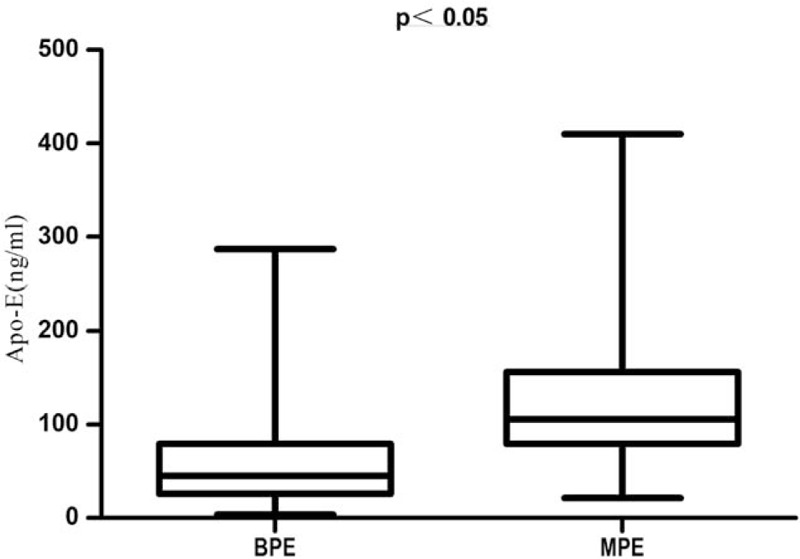
The comparison of Apo-E levels in the PE of BPE and MPE groups. The non-rank sum test showed that Apo-E levels were significantly lower in the BPE compared to the MPE group. (P < .05) Apo-E = apolipoprotein E, BPE = benign pleural effusion, MPE = malignant pleural effusion, PE = pleural effusion.
3.3. Analysis of Apo-E level in PE affected by age and SI
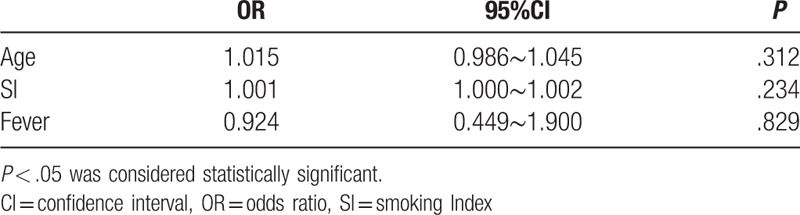
Since the MPE and BPE patient groups were different in terms of age, SI and fever rate, the impact of these 3 indices on Apo-E levels was determined using the cutoff Apo-E value of 69.96 ng/mL to distinguish between the positive and negative samples. Logistic regression analysis showed no significant association of age, SI and fever rate with Apo-E levels (P = .312, .234 and .829, respectively, Table 3). Therefore, age, SI and fever rate can be considered as confounding factors in Apo-E mediated diagnosis of PE.
Table 3.
Logistic regression analysis of factors that may affect the level of apolipoprotein E in pleural effusion.
3.4. Diagnostic value of Apo-E in differentiating MPE from BPE
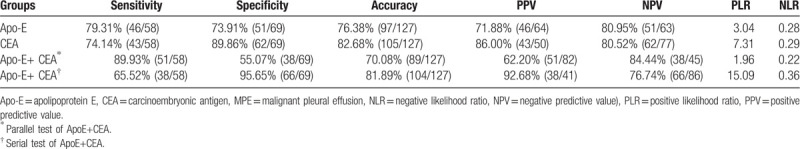
ROC curve analysis was carried out to determine a high-specificity cutoff for Apo-E to and CEA to differentiate between the 58 MPE and 69 BPE patients (Fig. 3). A cutoff value of 69.96 ng/mL for pleural fluid Apo-E levels yielded sensitivity and specificity of 79.31% and 73.91% respectively for the detection of tumor in PEs. The AUC for Apo-E was 0.793 (95% confidence interval [CI]; 0.712 to 0.860). The CEA cutoff value was 7.38 ng/mL, with sensitivity 74.1%, specificity 89.9%, and AUC 0.899 (95%CI 0.833 to 0.946). The diagnostic efficacy of CEA was greater than that of Apo-E (Z = 2.081; P = .037). When Apo-E and CEA were combined, the sensitivity and specificity of the serial tests were 65.52% and 95.65% respectively, and that of parallel tests were 87.90% and 55.07% respectively (Table 4).
Figure 3.
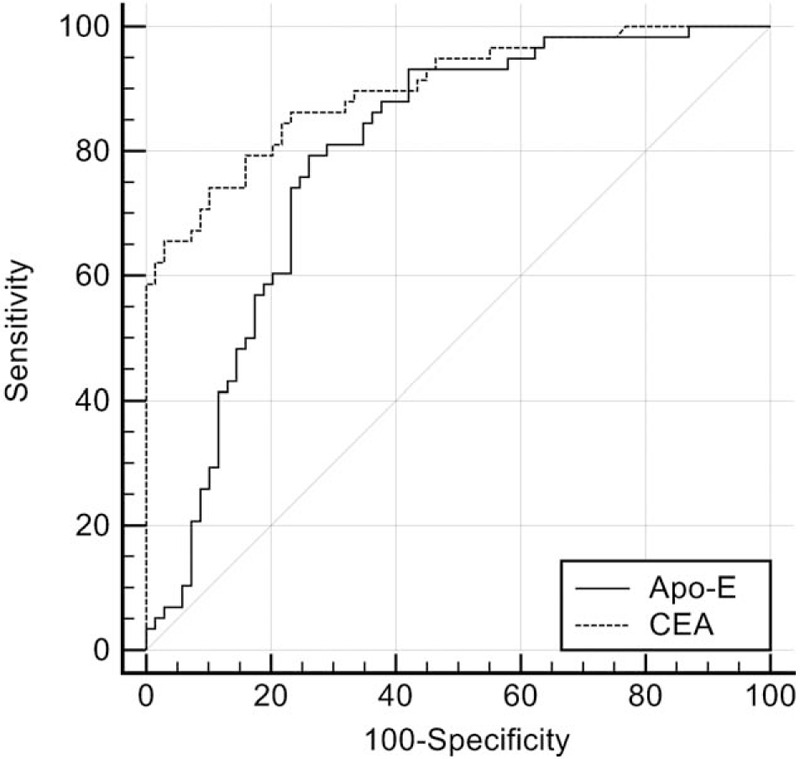
ROC curve analysis of Apo-E and CEA for predicting MPE. At Apo-E cutoff of 69.96 ng/mL, the sensitivity was 79.31% and specificity 73.91%. At CEA cutoff of 7.38 ng/mL, sensitivity was 74.1% and specificity 89.9%. Apo-E AUC was 0.793 (95%CI 0.712 to 0.860) and CEA AUC was 0.899 (95%CI 0.833 to 0.946). The AUC of Apo-E was smaller than that of CEA. (z = 2.081, P = .037) ROC = receiver-operating characteristic, Apo-E = apolipoprotein E, AUC = area under the curve, CEA = carcinoembryonic antigen, CI = confidence interval.
Table 4.
Diagnostic value of Apo-E and CEA in predicting MPE.
4. Discussion
The incidence and associated medical costs of MPE are rising, and its management remains palliative, with median survival times ranging from 3 to 12 months.[5] It is therefore essential to differentiate MPE from BPE, and identify a biomarker for MPE that offers superior diagnostic sensitivity. We assessed the levels of tumor biomarkers Apo-E in the pleural fluid of a randomly selected patient population in China. Apo-E levels were significantly higher in the MPE compared to the BPE patients. Using a cutoff value of 69.96 ng/mL, the sensitivity and specificity of 79.31% and 73.91% were respectively obtained for Apo-E. Our findings are consistent with previous studies showing overexpression of Apo-E in MPE.[14]
A previous study indicated that at the cutoff 105 ng/mL, the sensitivity and specificity of Apo-E were 87.5% and 85.3% respectively, and the AUC was 0.748, for the diagnosis of MPE.[13] Our data slightly deviates from this observation, and several reasons may be responsible. We selected the subjects randomly from a consecutive series of participants, resulting in a smaller bias. Furthermore, we did not exclude patients when the etiology was initially unconfirmed and instead followed them up till the exact etiology was determined, further lessening the bias. Due to random selection, the age, SI and fever rate of the 2 groups were significantly different. However, logistic regression analysis showed that none affected the diagnostic impact of Apo-E in PE, and were thus confounding factors.[13]
Efforts are ongoing to develop a simple, low-cost, and noninvasive test to distinguish diverse types of PE in clinical and laboratory settings, but no typical biochemical approach has been established so far. CEA is secreted in the PE when the malignancy spreads to the adjacent pleura, while only low amounts are released into the bloodstream since it is a glycoprotein macromolecule.[15] It has been confirmed that CEA level in the PE is remarkably higher than that in the serum of the same patients. Therefore, CEA is an extensively broad spectrum tumor marker which can be used in the differential diagnosis of MPE and BPE.[15–17] and remains the most dependable of all biomarkers examined to date.[18] Therefore, we evaluated the diagnostic sensitivity, specificity, and AUC of Apo-E relative to that of CEA to differentially diagnose PE types. Our results showed that the diagnostic efficacy of Apo-E was less satisfactory compared to that of CEA. However, the Apo-E gene has several polymorphisms.[19] which may further improve its diagnostic efficacy. In addition, using proteomics techniques, Tyan et al identified Apo-E as 1 of the unique proteins in PE of patients with lung adenocarcinoma.[11,13] This suggests that Apo-E may be more helpful in the diagnosis of certain tumors. Additional studies are needed to obtain a definitive result regarding the diagnostic efficacy of Apo-E.
Numerous studies have confirmed that combined detection of multiple tumor markers can enhance the sensitivity and specificity of differential diagnosis of MPE.[20,21] We found that the sensitivity and specificity of the combination of Apo-E and CEA was 87.9% and 95.65% respectively, higher than that of either marker used individually. There are however several limitations of our study. First, the inpatients were confined to the Department of Respiratory Medicine. Some patients with PE were admitted to oncology, thoracic surgery and infection department, so patients in this study were not representative. In addition, Apo-E was not collected and detected in sera of these patients, which may affect the efficiency of differentiating MPE through sera Apo-E statistical correction. Finally, our preliminary data did not show any correlation between Apo-E values in MPE and Apo-E polymorphisms. Further study is necessary to address these concerns.
These findings provide additional evidence for the use of Apo-E for the differential diagnosis of MPE and BPE, with a simple, easily scalable method.
5. Conclusion
Apo-E levels in PE may be a potential biomarker for the detection of MPE. The combined detection of Apo-E and CEA could improve the diagnostic sensitivity and specificity for MPE.
Acknowledgment
We thank Yali Zheng PhD (Department of Pulmonary and Critical Care Medicine, Peking University People's Hospital, China), who is specialized in biomedical writing and editing, for copyediting this manuscript.
Author contributions
Conceptualization: Xinyu Deng.
Data curation: Xinyu Deng.
Formal analysis: Xinyu Deng.
Funding acquisition: Jianhui Wu.
Methodology: Guiju Fang, Canhui Zhang, Yunjuan Peng.
Project administration: Canhui Zhang.
Resources: Guiju Fang, Canhui Zhang, Zhixin Liu, Zhiwen Peng, Zibiao Lai, Yunjuan Peng.
Software: Jianhui Wu, Guiju Fang.
Supervision: Zhixin Liu.
Validation: Zhixin Liu, Zhiwen Peng.
Visualization: Zhiwen Peng.
Writing – original draft: Qing Xue.
Writing – review and editing: Jianhui Wu.
Footnotes
Abbreviations: ADA = adenosine deaminase, Apo-E = apolipoprotein E, AUC = area under the curve, BPE = benign pleural effusion, CYFRA = cytokeratin fragments 19, CEA = carcinoembryonic antigen, CI = confidence interval, LDH = lactate dehydrogenase, MPE = malignant pleural effusion, PE = pleural effusion, PET/CT = positron emission tomography and computer tomography, ROC = receiver-operating characteristic, SI = smoking index.
How to cite this article: Xue Q, Fang G, Deng X, Zhang C, Liu Z, Peng Z, Lai Z, Peng Y, Wu J. The value of apolipoprotein E in distinguishing benign and malignant unilateral pleural effusions. Medicine. 2020;99:10(e19320).
This study was supported by the funds from Ningde Municipal Science and Technology Bureau, China (20130200).
The authors have no conflicts of interest to disclose.
References
- [1].Hooper C, Lee YC, Maskell N. Investigation of a unilateral pleural effusion in adults: British thoracic society pleural disease guideline 2010 Thorax 2010;65 Suppl 2: ii:4–17. [DOI] [PubMed] [Google Scholar]
- [2].Domanski D, Perzanowska A, Kistowski M, et al. A multiplexed cytokeratin analysis using targeted mass spectrometry reveals specific profiles in cancer-related pleural effusions. Neoplasia 2016;18:399–412. [DOI] [PMC free article] [PubMed] [Google Scholar]
- [3].Porcel JM. Malignant pleural effusions because of lung cancer. Curr Opin Pulm Med 2016;22:356–61. [DOI] [PubMed] [Google Scholar]
- [4].Porcel JM, Azzopardi M, Koegelenberg CF, et al. The diagnosis of pleural effusions. Expert Rev Respir Med 2015;9:801–15. [DOI] [PubMed] [Google Scholar]
- [5].Psallidas I, Kalomenidis I, Porcel JM, et al. Malignant pleural effusion: from bench to bedside. Eur Respir Rev 2016;25:189–98. [DOI] [PMC free article] [PubMed] [Google Scholar]
- [6].Gu Y, Zhai K, Shi HZ. Clinical value of tumor markers for determining cause of pleural effusion. Chin Med J (Engl) 2016;129:253–8. [DOI] [PMC free article] [PubMed] [Google Scholar]
- [7].Liu X, Zheng W, Wang W, et al. A new panel of pancreatic cancer biomarkers discovered using a mass spectrometry-based pipeline. Br J Cancer 2017;117:1846–54. [DOI] [PMC free article] [PubMed] [Google Scholar]
- [8].Kulminski AM, Arbeev KG, Culminskaya I, et al. Trade-offs in the effects of the apolipoprotein E polymorphism on risks of diseases of the heart, cancer, and neurodegenerative disorders: insights on mechanisms from the long life family study. Rejuvenation Res 2015;18:128–35. [DOI] [PMC free article] [PubMed] [Google Scholar]
- [9].Amidi A, Agerbæk M, Wu LM, et al. Changes in cognitive functions and cerebral grey matter and their associations with inflammatory markers, endocrine markers, and APOE genotypes in testicular cancer patients undergoing treatment. Brain Imaging Behav 2017;11:769–83. [DOI] [PubMed] [Google Scholar]
- [10].Luo J, Song J, Feng P, et al. Elevated serum apolipoprotein E is associated with metastasis and poor prognosis of non-small cell lung cancer. Tumour Biol 2016;37:10715–21. [DOI] [PubMed] [Google Scholar]
- [11].Tyan YC, Wu HY, Su WC, et al. Proteomic analysis of human pleural effusion. Proteomics 2005;5:1062–74. [DOI] [PubMed] [Google Scholar]
- [12].Su WP, Chen YT, Lai WW, et al. Apolipoprotein E expression promotes lung adenocarcinoma proliferation and migration and as a potential survival marker in lung cancer. Lung Cancer 2011;71:28–33. [DOI] [PubMed] [Google Scholar]
- [13].Wang Y, Chen Z, Chen J, et al. The diagnostic value of apolipoprotein E in malignant pleural effusion associated with non-small cell lung cancer. Clin Chim Acta 2013;421:230–5. [DOI] [PubMed] [Google Scholar]
- [14].Tyan YC, Wu HY, Lai WW, et al. Proteomic profiling of human pleural effusion using two-dimensional nano liquid chromatography tandem mass spectrometry. J Proteome Res 2005;4:1274–86. [DOI] [PubMed] [Google Scholar]
- [15].Yu YX, Tong ZH, Zhou XX, et al. Evaluation of the diagnosis value of carcinoembryonic antigen in malignant pleural effusion. Zhonghua Yi Xue Za Zhi 2018;98:432–5. [DOI] [PubMed] [Google Scholar]
- [16].Li H, Huang L, Tang H, et al. Pleural fluid carcinoembryonic antigen as a biomarker for the discrimination of tumor-related pleural effusion. Clin Respir J 2017;11:881–6. [DOI] [PubMed] [Google Scholar]
- [17].Watanabe H, Tamura T, Satoh H. Pleural fluid CEA. Clin Respir J 2018;12:363. [DOI] [PubMed] [Google Scholar]
- [18].Wang WW, Zhou XL, Song YJ, et al. Combination of long noncoding RNA MALAT1 and carcinoembryonic antigen for the diagnosis of malignant pleural effusion caused by lung cancer. Onco Targets Ther 2018;11:2333–44. [DOI] [PMC free article] [PubMed] [Google Scholar]
- [19].Han S, Xu Y, Gao M, et al. Serum apolipoprotein E concentration and polymorphism influence serum lipid levels in Chinese Shandong Han population. Medicine (Baltimore) 2016;95:e5639. [DOI] [PMC free article] [PubMed] [Google Scholar]
- [20].Chen M, Xie S, Wan C, et al. Diagnostic performance of CTLA-4, carcinoembryonic antigen and CYFRA 21-1 for malignant pleural effusion. Postgrad Med 2017;129:644–8. [DOI] [PubMed] [Google Scholar]
- [21].Porcel JM, Esquerda A, Martínez-Alonso M, et al. Identifying thoracic malignancies through pleural fluid biomarkers: a predictive multivariate model. Medicine (Baltimore) 2016;95:e3044. [DOI] [PMC free article] [PubMed] [Google Scholar]