

Abstract
Introduction
Pathological flows in patients with severe aortic stenosis are associated with acquired von Willebrand syndrome. This syndrome is characterized by excessive cleavage of von Willebrand factor by its main protease, A Disintegrin and Metalloproteinase with a Thrombospondin Type 1 Motif, Member 13 (ADAMTS13) leading to decreased VWF function and mucocutaneous bleeding. Aortic valve replacement and correction of the flow behavior to physiological levels reverses the syndrome, supporting the association between pathological flow and acquired von Willebrand syndrome. We investigated the effects of shear and elongational rates on von Willebrand factor cleavage in the presence of ADAMTS13.
Methods
We identified acquired von Willebrand syndrome in five patients with severe aortic stenosis. Doppler echography values from these patients were used to develop three computational fluid dynamic (CFD) aortic valve models (normal, mild and severe stenosis). Shear, elongational rates and exposure times identified in the CFD simulations were used as parameters for the design of microfluidic devices to test the effects of pathologic shear and elongational rates on the structure and function of von Willebrand factor.
Results
The shear rates (0–10,000s−1), elongational rates (0–1000 s−1) and exposure times (1–180 ms) tested in our microfluidic designs mimicked the flow features identified in patients with aortic stenosis. The shear and elongational rates tested in vitro did not lead to excessive cleavage or decreased function of von Willebrand factor in the presence of the protease.
Conclusions
High shear and elongational rates in the presence of ADAMTS13 are not sufficient for excessive cleavage of von Willebrand Factor.
Electronic supplementary material
The online version of this article (10.1007/s12195-020-00631-2) contains supplementary material, which is available to authorized users.
Keywords: Acquired von Willebrand syndrome, Non-surgical bleeding, Elongational flow, Shear rate, Reynolds number, Aortic stenosis
Introduction
Acquired von Willebrand syndrome (aVWS) can develop in patients with severe aortic stenosis (AS), leading to an increased risk of bleeding. This syndrome is characterized by excessive cleavage and decreased function of a key hemostatic protein, von Willebrand factor (VWF). VWF is a large multimeric protein that has a flow-dependent conformation.50 While in circulation VWF travels in a globular form, and when exposed to high shear rates it changes conformation to an elongated form exposing its various domains.44 The A1 domain contains the platelet binding site, while the A2 domain contains the cryptic Tyr1605–Met1606 cleavage site of Disintegrin And Metalloproteinase with a Thrombospondin type-1 motif, member 13 (ADAMTS13).21,34 ADAMTS13 is constitutively active and can only cleave the VWF in its extended conformation.18,54,61
VWF mediates platelet adhesion to subendothelial collagen and initiates the formation of a platelet plug.36,37,44 This ability to arrest bleeding depends on the protein’s size with the high molecular weight multimers (HMWM) being the most efficient for hemostasis.56 Excessive cleavage of VWF leads to loss of HMWM and aVWS.23,55,60 VWF’s force-dependent conformation suggests that changes in hemodynamics mediate excessive exposure of the A2 domain and allow for cleavage to occur.
Pathological flow conditions are associated with loss of HMWM.1,8,29,45 Prior studies have proposed the use of VWF multimer analysis to identify the presence aortic pathological flow.59 Further supporting the association between abnormal flow conditions and aVWS, it has been reported that full reversal of aVWS occurs post-correction of AS when the physiological flow conditions are restored.16,52,59 Several groups have studied the role of ions,3,62,64 mutations,21,35 factor VIII51 and platelets47 on VWF cleavage by ADAMTS13. However, the fluid conditions commonly described as pathologic that lead to excessive cleavage of VWF have not been fully characterized.
The term “pathological flow” has been used to describe several features of flow through severely stenotic aortic valves, such as large pressure gradients, high velocities, high shear rates (SR), and altered blood flow patterns.5 Severe AS also, like abrupt constrictions, exhibits high elongational flow (EF).11,49 EF is the axial strain rate along the flow direction and has been studied in the field of polymer science and used to orient macromolecules.42,53,65 EF induces changes in DNA conformation 31,33 and Brownian dynamics show that it can also cause VWF extension.38 Recent computational studies predict that the threshold for VWF extension at a critical EF of 3 × 10² − 6 × 10² s−1.49 In comparison, these same studies estimate that SR induced stretching near 104 s−1.49 Schneider et al. used acoustic streaming to induce VWF extension which occurred at a SR of 5000 s−1.44 Thus, although both SR and EF appear to have a role in VWF extension, the main driver of VWF extension that also facilitates excessive cleavage of VWF by ADAMTS13 has not yet been identified. Determining the flow conditions that lead to excessive cleavage of VWF would not only contribute to the understanding of VWF biology, but would also further our understanding of aVWS and how to treat or prevent it.
We designed this study to evaluate the effect and relative contributions of SR and EF on VWF extension and cleavage by ADAMTS13. We developed three computational aortic valve models using patient Doppler echography data and calculated the SR and EF present in normal, mildly stenotic and severely stenotic aortic valves. We then developed microfluidic models to test the effects relevant SR and EF on VWF cleavage by ADAMTS13. We performed structural characterization of VWF post-flow treatment, followed by functional tests to compare the effects of flow on VWF capacity to bind platelets.
Methods
Patient Blood Collection and Echocardiography
The study was approved by the Colorado Multiple Institution Review Board and all participants provided informed consent prior to participating in the study. Five patients undergoing elective cardiac surgery with transesophageal echocardiography at the University of Colorado Hospital participated in the study. We collected blood from a radial artery catheter placed prior to surgery and stored citrated plasma samples at − 80 °C as previously reported.17 We performed transesophageal echocardiography as part of routine clinical care for cardiac surgery and determined the maximum flow velocity across the aortic valve with continuous wave Doppler and calculated the aortic valve area with the continuity equation using established methods6 with the following equation:
Blood Collection from Healthy Controls
As previously described,12 blood collection from healthy controls was conducted in accordance with the Declaration of Helsinki and the Institutional Review Board of the University of Colorado, Anschutz Medical Campus. In short, blood was obtained from healthy donors (males between 30 and 50 years old) by venipuncture into 4.5 ml vacutainer tubes containing 3.2% sodium citrate. The initial tube was discarded to avoid possible effects of platelet activation from the initial puncture. The samples were then centrifuged twice at 2000g for 20 min. The supernatant was collected at the end of each cycle and spun again to obtain platelet-poor plasma that was then stored at − 80 C for later use.
Computational Fluid Dynamics of a Model of Aortic Stenosis
The fluid in the aortic valves was assumed to be incompressible and Newtonian, with the latter commonly assumed in blood for high shear conditions.1,15 Three aortic valve models were designed using patient data (Table 1): (a) Healthy: normal aortic valve, (b) Case 1: mild stenosis and (c) Case 2: severe stenosis. Patient doppler measurements were collected to benchmark the boundary conditions against clinical data. Data obtained from Doppler results collected by the authors and AHA/ACC guidelines25,41 for the management of patients with valvular heart disease were utilized to determine normal, mild (case 1), and severe stenosis (case 2). Details regarding the criteria can be found in Supplemental Information.
Table 1.
Aortic valve patient data and CFD model data (healthy, Case 1, Case 2)
| Patient | Aortic valve area (cm2) | Max velocity (m/s) | Time-averaged Pressure gradient (mmHg) | Radius (cm) | Diameter (cm) |
|---|---|---|---|---|---|
| 1 | 1 | 2.72 | 18.8 | 0.56 | 1.13 |
| 2 | 1.3 | 3.1 | 20.2 | 0.64 | 1.29 |
| 3 | 1.2 | 3.26 | 25.3 | 0.62 | 1.24 |
| 4 | 1.1 | 3.69 | 32.9 | 0.59 | 1.18 |
| 5 | 0.34 | 4.0 | 35 | 0.33 | 0.66 |
| Healthy | 4.4 | 0.6 | 3 | 1.18 | 2.36 |
| Case 1 | 2.2 | 2.23 | 17.5 | 0.83 | 1.66 |
| Case 2 | 1 | 3.45 | 38 | 0.56 | 1.12 |
The aortic valves in the three cases were simulated as 2D axisymmetric models and the fluid flow.2,7,46,57 We note that this approach does not capture the geometry of the aortic sinus region. However, EF and SR are relatively negligible in this region, which is why we use the simplified geometry. Geometry was based on patients with aortic stenosis, where pressure drops were matched, while using a maximum sinus diameter of 1.24 cm and a leaflet length of 0.7 cm, a consistent choice for each model.58 An inlet unsteady velocity condition was applied to match values during systole.1 For all the simulations the pressure outlet equal to 0 Pa was applied.2,7,57 Walls were assumed to be rigid with no-slip boundary conditions. A mesh sensitivity analysis was carried out to ensure that the numerical solutions are mesh independent with triangular mesh elements totaling 50,000 for aortic valve simulations. Grids were finer near the walls to capture severe gradients. Simulations and mesh generation for all simulations were performed with ANSYS 18.1 (Pittsburgh, Pennsylvania, USA). To determine how the flow field may affect structures like VWF, we released massless particles at the inlet of the domain in a uniform distribution. Particles were released in every time step to assess the shear history of small-scale proteins like VWF.
Design and Fabrication of the Microfluidic Devices
Two microfluidic devices were designed to mimic flow patterns seen in AS. The first design consists of a 90-degree step leading to an abrupt constriction to replicate the SR obtained from the computational fluid dynamics (CFD) models of normal and stenotic aortic valves. The second design consists of a hyperbolic function leading to a gradual width change up to the constriction region to replicate the EF obtained in the aortic stenosis models.65 EF at the centerline of the microfluidic devices can be expressed as:
where Q is the flow rate, w is width of the channel, u is the velocity in x- flow direction and h is the height of the channel. Microfluidic channels were designed using computer aided design software (SolidWorks, Dassault Systems, Waltham, Ma.). Final channel dimensions are shown in Supplemental Information Table 1. Channels were made using soft lithography approaches, and we used polydimethylsiloxane (PDMS) as the material for the microfluidic devices, as previously described.39 The PDMS and glass slides were cleaned and treated using a BD-20AC Laboratory Corona treater (Electrotechnic PR). The surface treatment was followed by a 4-h temperature treatment at 60 °C to permanently bond the PDMS device to the glass slide.
Computational Fluid Dynamics of the Microfluidic Devices
The 3D simulations were conducted with transient velocity inlet and pressure equal to 0 at the outlet. No-slip boundary condition was applied to the walls. The fluid in the channels was assumed to be incompressible and Newtonian similar to the aortic models.1,15 Total 100,000 elements for microchannel simulations are used to have mesh independent results.
Recombinant ADAMTS-13 Activity
Recombinant ADAMTS13 was obtained from transfected HEK-293 cell supernatants as previously described.40 Cell supernatant containing ADAMTS13 was collected and filtered. ADAMTS13 activity was measured using the FRETS-VWF73 assay (Peptides International, Kentucky, USA) based on the method described by Kokame et al.30 Briefly, varying volumes of samples containing ADAMTS13 were diluted in reaction buffer before being added to a 96-well plate. Subsequently, a fluorescence-quenching substrate for ADAMTS13 was added. Fluorescence of each well was measured every 5 min for 90 min on a plate reader (Synergy 2, Biotek). Values were established by comparing them to a standard curve, determined by measuring pooled plasma from healthy controls.
VWF Cleavage Experiments
The microfluidic channels were blocked for 2 h with 30 mg/ml human serum albumin (HSA) in PBS under vacuum to remove air bubbles. Subsequently, channels were rinsed, and samples containing 30 µg/ml VWF, 2.5 U/mL ADAMTS13, were added to wells leading to the channels. Concentrations were similar to those previously used by other authors.14,51 Additionally, these concentrations allow to obtain sufficient signal in the western blots to evaluate the results. We used both single-pass and cycled (forward and backward) flow in the devices through a programmable syringe pump (standard withdraw/infuse PHD ULTRA), as shown for 15, 30, and 60 min. The assay was performed at seven flow rates (10, 15, 20, 30, 60, 140 and 250 µl/min). Following the flow experiment, samples were collected and stored for analysis. The positive control for VWF cleavage was prepared as previously described27,51 with modifications. HSA (30 mg/ml), 10 µg/ml of recombinant human VWF (Vonvendi®) and 1 U/mL ADAMTS13, were placed on a vortexer (VWR Standard Microplate Vortex Mixers, VWR) for 1–60 min at a speed setting of 7 (VWR Vortex Mixer). A high-speed camera was used to evaluate the rotational rate, which was 148 rad/s.
VWF Activity and Antigen
An automated latex enhanced immunoassay (HemosiL®, Diagnostica Stago, France) was used to determine VWF activity (VWF:Act). This assay evaluates VWF’s ability to bind the platelet receptor GPIbα.32,43 Standard curves were prepared, and the sample was added to cuvettes that were placed in the Compact Max® (Diagnostica, Stago). At the same time, an immune-turbidimetric assay (LIATEST VWF:Ag, Diagnostica Stago, France) was performed according to the instructions of the manufacturer to determine the VWF antigen levels (VWF:Ag). The ratio of VWF:Act/VWF:Ag was calculated and used to evaluate VWF activity. VWF:Act/VWF:Ag ratios were then normalized with respect to the control sample (not exposed to flow) of the day to compare samples from different days. Experiments were repeated at least twice at each flow rate.
VWF Multimer Analysis
SDS-agarose gel electrophoresis was performed as previously described.13 Briefly, low resolution gels (1.2%) were prepared (HGT agarose, Lonza, Rockland, ME). Subsequently, the VWF sample concentration was calculated using the VWF ELISA and 1 milli-unit VWF from each patient was added to each lane. Electrophoresis was conducted for 16 h at 45 V. VWF multimers were then transferred to an Immobilon-P (Millipore, Billerica, MA) membrane at 4 °C in transfer buffer (25 mM Tris, 200 mM glycine, 20% methanol and 0.03% SDS).
Western Blotting
Samples were subjected to 3–8% SDS-PAGE and transferred to polyvinylidene difluoride (PVDF) membranes (Invitrogen). Membranes were blocked for 1 h and then incubated in a 1:1000 dilution of polyclonal rabbit anti-human VWF antibody (Agilent, Santa Clara, CA). All incubation and washing steps were performed at room temperature in 5% nonfat dry milk. After three washing steps, membranes were incubated for 1 h with a second antibody diluted 1:10000 (Goat anti-rabbit IgG HRP conjugate; BioRad Laboratories, Hercules, CA, USA). Subsequently, membranes were developed with Western Lightning-ECL (Perkin Elmer, Waltham, MA) and multimer bands were visualized by exposure to Fujifilm Super RX (Edison, NJ). Uncleaved mature VWF was detected with the appearance of a 225-kDa band while cleavage fragments were detected with the appearance of a 176- and 140-kDa bands as previously reported.19,20
Statistical Analysis
Statistical analysis was performed with GraphPad Prism 7.03 (GraphPad, La Jolla, Ca, USA). Normality and variance of the data were evaluated, and significance was determined with paired t tests unless otherwise noted. A p value less than 0.05 was considered significant. All data are presented as the mean ± standard deviation unless otherwise noted.
Results
Multimer Analysis of Patients with Aortic Stenosis
We obtained echocardiography data and plasma from patients undergoing elective cardiac surgery. Loss of VWF HMWM was observed in all five patients when compared to healthy controls (Fig. 1). Using the Doppler echography data (Table 1), three CFD models of aortic valves were used to estimate the flow fields using patient data. As shown on Figs. 2a–2c, CFD results show a systolic peak maximum flow velocity of 0.8 m/s in the normal valve model, 2.5 m/s with mild stenosis, and 3.5 m/s with severe stenosis. The values for the mild and severe stenoses are comparable to those measured in patients (Table 1). EF along the leaflet (Figs. 2d–2f) and SR (Figs. 2g–2i) were calculated for each case throughout the flow domain and where these values are maximum, i.e. along the wall for the SR (Fig. 2j) and along the center of the channel for EF (Fig. 2k). These EF and SR values were used to design and inform flow rates in the fabrication of microfluidic devices.
Figure 1.
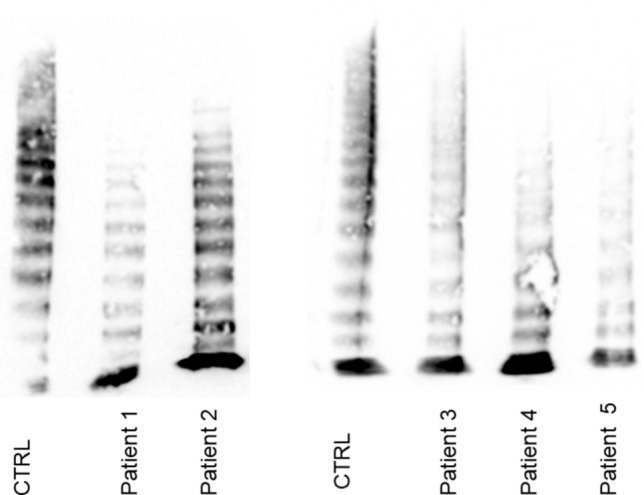
Multimer analysis of patients studied. Multimer analysis showed all patients with aortic stenosis in the study had loss of HMWM when compared to healthy controls.
Figure 2.

Computational fluid dynamic results of three aortic valve models. Pathlines with a color that correspond to the axial velocity (m/s), in the legend on the left for (a) a healthy aortic model, (b) Case 1: Stenosis model (valve is 55% open), and (c) Case 2: Severe aortic stenosis model (valve is 37% open). Shear rate () and elongational rate () for the (d) healthy aortic model, (e) Case 1, and (f) Case 2. Elongational rate () for the (g) healthy aortic model, (h) Case 1, and (i) Case 2. Shear Rate () comparison (j) between healthy aortic model, Case 1 and Case 2 along the leaflet and from leaflet to the outlet. Elongational rate () comparison (k) between healthy aortic model, Case 1 and Case 2 on the centerline.
Microfluidic Device Designs and CFD Results
Two types of microfluidic devices were designed: a 90-degree angle to form a severe constriction and test the SR present in severe AS (Fig. 3a), and a hyperbolic function leading to a gradual constriction designed to increase the exposure time to the EF rates of interest present in severe AS (Fig. 3b). CFD was conducted to calculate SR, EF, and velocity for flow rates of 10, 20, 30, 60, 140 and 250 µl/min within each microfluidic design (Figs. 3c–3h). Flow within the both microfluidic channels exhibit varying shear rates along the vertical and horizontal axis at each cross section (Fisg. 3e–3f). EF spikes at the inlet due to the gradual and constant cross-sectional change (Fig. 3h). This effect is not observed in the 90-degree channel because the channel cross section does not vary until the 90-degree angle construction is encountered. Depending on the flow rate simulated, the SR was 10–100 times larger than that of the EF.
Figure 3.

Microfluidic device designs and CFD of the flow through the microfluidic channels. (a) Graphical representation of the 90 degree constriction (b) Graphical representation of the curved geometry described by hyperbolic function (c) Particle velocity through the 90 degree channel (stenosis) (d) Particle Velocity though the hyperbolic channel (e) Shear Rate () comparison in hyperbolic channel for different flowrates along the wall (f) Shear Rate () comparison in 90 degree channel for different flowrates along the wall (g) Elongational rate () comparison in hyperbolic channel for different flowrates on the centerline (h) Elongational rate () comparison in 90 degree channel for different flowrates on the centerline.
Massless Particle Stress History Comparison Between Patients and Microfluidic Devices
To identify the stresses the VWF molecules might be exposed to in circulation in AS and in the microfluidic channels, we simulated massless particles. We then registered the percentage of particles exposed to various ranges of SR and EF along with the exposure times and used them to compare the aortic valve models with the microfluidic devices and the various inlet flow rates. The SR or EF ranges found from the CFD results present in the AS (Case 1) and severe AS (Case 2) and absent in the healthy case (Tables 2 and 4) in this work were defined as pathologic. Thus, Fig. 4a shows that when the VWF samples were tested in the 90-degree channel using an inlet flow rate of 140 µl/min the percentage of particles exposed to the pathologic SR (SR > 5000 s−1) encompassed the values calculated from the CFD model of patient 5 that exhibited the highest shear rate. Similarly, we found that the pathologic EF (EF > 500 s−1) present in the severe AS cases was present in hyperbolic channel when tested at an inlet flow rate of 250 µl/min (Fig. 4b).
Table 2.
Particle exposure time to shear rates in the aortic valve models.
| Normal valve | Case 1: aortic stenosis | Case 2: severe aortic stenosis | ||||
|---|---|---|---|---|---|---|
| (!)” | % Particles | Exposure time (ms) | % Particles | Exposure time (ms) | % Particles | Exposure time (ms) |
| 0–1000 | 93.14 | 1–130 | 89.5 | 2–180 | 83.32 | 1–180 |
| 1000–5000 | 6.86 | 1–5 | 9.56 | 1–80 | 11.54 | 1–50 |
| 5000–10,000 | 0 | 0 | 0.94 | 1–60 | 4.76 | 1–35 |
| > 10,000 | 0 | 0 | 0 | 0 | 0.38 | 1–5 |
Table 4.
Particle exposure time to elongational flow in the aortic valve models.
| (!)” | Normal valve | Case 1: aortic stenosis | Case 2: severe aortic stenosis | |||
|---|---|---|---|---|---|---|
| % Particles | Exposure time (ms) | % Particles | Exposure time (ms) | % Particles | Exposure time (ms) | |
| < 0 | 37.01 | 1–150 | 33.58 | 1–120 | 42.31 | 1–110 |
| 0–500 | 62.2 | 2–5 | 66.31 | 2–6 | 54.45 | 1–5 |
| 500–1000 | 0.79 | 1–3 | 0.098 | 1–4 | 3.24 | 1–3 |
| > 1000 | 0 | 0 | 0.01 | 1–3 | 0.047 | 1–3 |
Figure 4.

Comparison between aortic valve models and microfluidic devices. (a) Percentage of particles exposed to each shear rate () in the severe AS (Case 2) compared to the 90 degree channel (inlet flow rate: 140 μl/min) and hyperbolic channel (inlet flow rate: 140 μl/min). (b) Percentage of particles exposed to each elongational rate () in the severe AS (Case 2) compared to the 90° channel (inlet flow rate: 250 μl/min) and hyperbolic channel (inlet flow rate: 250 μl/min).
Since exposure time for a given stress will also affect cleavage of VWF by ADAMTS13 the corresponding exposure time for each condition was calculated. The exposure time to pathological SR (5000–10000, > 100,000) in the 90 degree channel were comparable to that of the severe AS case at a flow rate of 140 µl/min (Tables 2 and 3). The exposure time to the pathologic EF (500–1000, > 1000) in the hyperbolic channel was comparable to that of the severe AS case at a flow rate of 250 µl/min (Tables 4 and 5).
Table 3.
Particle exposure time to shear rates in the microfluidic models at a flow rate of 140 µl/min).
| Hyperbolic channel | 90 Degree channel | |||
|---|---|---|---|---|
| (!)” | % Particles | Exposure time (ms) | % Particles | Exposure time (ms) |
| 0–1000 | 2.4 | 20–100 | 19.54 | 10–80 |
| 1000–5000 | 5.03 | 10–60 | 24.87 | 30–75 |
| 5000–10,000 | 5.12 | 10–25 | 54.21 | 30–50 |
| > 10,000 | 87.45 | 0.5–1 | 1.4 | 0.5–2 |
Table 5.
Particle exposure time to elongational flow in microfluidic models at a flow rate of 250 µl/min).
| (!)” | Hyperbolic channel | 90 Degree channel | ||
|---|---|---|---|---|
| % Particles | Exposure time (ms) | % Particles | Exposure time (ms) | |
| < 0 | 49 | 1–7 | 46.19 | 0.1–1 |
| 0–500 | 33.15 | 1–3 | 52.03 | 0.2–0.6 |
| 500–1000 | 12.33 | 1–3 | 1.04 | 0.1–0.5 |
| > 1000 | 5.52 | 2–5 | 0.74 | 0.1–0.2 |
The pathologic SR found from the severe AS CFD simulations were best modeled at 140 µl/min in the 90 degree channel, while the EF were modeled at 250 µl/min in the hyperbolic channel. However, various rates above and below these ranges were tested to fully evaluate the effects of SR and EF on VWF cleavage by ADAMTS13.
Transient EF in a Severe Constriction Is Not Sufficient for VWF Cleavage
In vitro assay results (Figs. 5a, 5b, results shown in duplicates) show that neither VWF cleavage by ADAMTS13, nor loss of HMWM was detected at any flow rate in all microfluidic devices. Furthermore, to evaluate if SR or EF had an effect on VWF function we evaluated VWF:Act/VWF:Ag ratio. VWF activity was not significantly reduced in any experimental condition. Furthermore, we noticed no difference in VWF:Act/VWF:Ag ratio between channels (Figs. 5c, 5d). VWF antigen levels pre- and post-flow assays were measured and no significant loss was observed to adsorption in the tubing or microfluidic channel. Thus, we can conclude that none of the conditions tested did not lead to excessive cleavage of soluble VWF.
Figure 5.

Effect of elongational flow on VWF cleavage by ADAMTS13. Western Blot (a) and multimer analysis (b) of VWF for an inlet flow rate 250 µl/min. Effect of shear rate (c) and exposure time (d) on VWF activity/VWF antigen ratio. No statistical difference was found in between samples at each condition.
Subsequently, we also considered the frequency of exposure to elevated stresses as blood continuously cycles through the body in healthy and diseased conditions every 20–60 s.9 As this cumulative exposure to the region of stenosis may have an impact on VWF structure and function samples were re-circulated at different flow rates for different times (15 and 30 min). As shown on Supplemental Fig. 1, no cleavage fragments were detected by western blot or loss of HMWM for an inlet flow rate of 250 µl/min. Together these results suggest that the SR and EF conditions tested in the microfluidic devices do not lead to excessive cleavage of VWF by ADAMTS13.
Discussion
The main goal of this study was to evaluate the effect of SR and EF on VWF cleavage by ADAMTS13 in vitro. While prior single molecule and molecular dynamic studies have shown that EF and SR can induce a change in VWF conformation leading to exposure of the A2 domain, we sought to evaluate these forces under flow.19,49 Since ADAMTS13 is constitutively active and its proteolytic activity is allosterically modulated by VWF conformation,21,54 we hypothesized that VWF extension induced by EF or high SR, which are features of cardiovascular constrictions, would cause excessive cleavage of VWF by ADAMTS13.19,49 However, cleavage of VWF was not detected in our microfluidic models under EF and high SR modeled from echocardiographic data from patients with AS.
Lack of cleavage in this study can be attributed to two main factors. First, the conditions tested may have caused VWF extension, but may not have been sufficient to allow exposure of the A2 domain where the cryptic Tyr1605–Met1606 cleavage site is found. Secondly, our assays may not have been sufficiently sensitivity to detect any cleavage that did occur. Thus, other pathological flows might may be responsible for cleavage. For example, turbulent flow conditions are present in severe AS10,26 and these have been shown to cause excessive cleavage in the presence of ADAMTS13 by our group and others.12,28
Prior studies conducted by Schneider et al. reported VWF extension at SR above 1000 s−1.44 At such rates the platelet binding capacity of VWF, mediated by the A1 domain, might be substantial.4 However, a SR above 1000 s−1 might not produce conditions that facilitate exposure of the A2 domain and excessive cleavage of VWF. Furthermore, significantly higher values of VWF cleavage were observed in patients with severe AS suggesting that unknown in vivo conditions are likely playing a role in pathological cleavage of VWF. Additionally, Sing et al. predicted that EF of 3 × 10² − 6 × 10² were sufficient to cause VWF elongation, a threshold significantly lower than the SR threshold of 104 s−1.49 Therefore our initial hypothesis assumed that, since ADAMTS13 is constitutively active54,61 and bound to VWF,22 extension would lead to exposure of the A2 domain and allow for cleavage of VWF. However, this assumption could be incorrect as Fu et al. recently reported that the threshold at which VWF extension begins might have limited physiological significance.24
In circulation VWF travels in a globular form,48 and mechanical forces can induce a conformational change that exposes the A2 domain. The degree of conformational change that VWF experiences in a shear flow is a source of debate. Studies by Zhang et al.63 and Schneider et al.44 suggest that elongation can occur, at least in purified systems that only include VWF and highly controlled flow fields. While others suggest that binding to platelet or surface must precede conformation change to provide an adequate magnitude of force. Hence, the initial values of VWF extension previously reported by Schneider et.al. might suggest that the protein could undergo an apparent change in conformation that might not be sufficient for full exposure of the A2 domain and subsequent cleavage of VWF.
Lack of cleavage could also be due to the conditions tested in vitro. Our model was a purified system while in vivo, platelets could also be playing a role in VWF stretching and subsequent cleavage. Platelets contain the VWF’s binding receptor platelet glycoprotein Ib alpha (GP1bα), and VWF/platelet binding could contribute to cleavage by increasing the force across the VWF molecule.20,28 Since the goal of our biophysical study was to evaluate the role of elongation and shear rates on VWF cleavage by ADAMTS13, we utilized recombinant VWF (Vonvendi®) as all molecules in the sample are of similar size. This allowed us to limit the potential variability associated with the heterogeneous size distribution of VWF in plasma that results from the presence of ADAMTS13.43 Finally, the recombinant VWF source in our in vitro studies did not contain Factor VIII, that has been previously shown in some studies to enhance cleavage of VWF.22,40
Our approach has limitations. First, due to the small length scale in our microfluidic models, it was difficult to match both SR/ER and Reynolds number to the ones observed in AS. As such, we could not simulate the effects of secondary and turbulent flows that had been reported to play a role in VWF cleavage.12,28 Second, the CFD model assumes an axisymmetric idealized aortic valve using physiological velocity waveforms as input data. These simulations act like an axisymmetric constriction, as opposed to a more complex AS that involves potentially calcified leaflets and an aortic sinus. Third, the particle simulations assume uniform massless particle distributions, which would experience the forces that lead to margination in the presence of red blood cells. Furthermore, VWF may not be neutrally buoyant and it would be hard to predict the concentration distribution of VWF in a suspension.
Conclusion
In conclusion, our results show that high SR and EF are not associated with cleavage of VWF by ADAMTS13 in microfluidic models of gradual and severe constrictions over 30 min. EF and high SR might lead to changes in VWF conformation; however, these conformational changes were not sufficient to produce detectable VWF cleavage in these assays. Further studies are necessary to evaluate the effect of SR and EF in microfluidic models.
Electronic supplementary material
Below is the link to the electronic supplementary material.
Funding
This work was supported in part by American Heart Association Pre-Doctoral Fellowship (18PRE33990253), the National Institutes of Health (R01 HL120728 and R01 HL141794) the National Science Foundation (1762705) and by an award from the American Heart Association (18CDA34110134).
Footnotes
Publisher's Note
Springer Nature remains neutral with regard to jurisdictional claims in published maps and institutional affiliations.
Maria Bortot and Alireza Sharifi have contributed equally to this work.
References
- 1.Amindari A, Saltik L, Kirkkopru K, Yacoub M, Yalcin HC. Assessment of calcified aortic valve leaflet deformations and blood flow dynamics using fluid-structure interaction modeling. Inform. Med. Unlocked. 2017;9:191–199. [Google Scholar]
- 2.Amindari A, Saltik L, Kirkkopru K, Yacoub M, Yalcin HC. Informatics in medicine unlocked assessment of calcified aortic valve leaflet deformations and blood flow dynamics using fluid-structure interaction modeling. Inform. Med. Unlocked. 2017;9(July):191–199. [Google Scholar]
- 3.Anderson PJ, Kokame K, Sadler JE. Zinc and calcium ions cooperatively modulate ADAMTS13 activity. J Biol Chem. 2006;281(2):850–857. doi: 10.1074/jbc.M504540200. [DOI] [PubMed] [Google Scholar]
- 4.Baldauf C, Schneppenheim R, Stacklies W, et al. Shear-induced unfolding activates von Willebrand factor A2 domain for proteolysis. J. Thromb. Haemost. 2009;7(12):2096–2105. doi: 10.1111/j.1538-7836.2009.03640.x. [DOI] [PubMed] [Google Scholar]
- 5.Barker AJ, van Ooij P, Bandi K, et al. Viscous energy loss in the presence of abnormal aortic flow. Magn. Reson. Med. 2014;72(3):620–628. doi: 10.1002/mrm.24962. [DOI] [PMC free article] [PubMed] [Google Scholar]
- 6.Baumgartner H, Kratzer H, Helmreich G, Kuehn P. Determination of aortic valve area by doppler echocardiography using the continuity equation: a critical evaluation. Cardiology. 1990;77(2):101–111. doi: 10.1159/000174590. [DOI] [PubMed] [Google Scholar]
- 7.Bavo AM, Rocatello G, Iannaccone F, Degroote J, Vierendeels J, Segers P. Fluid-structure interaction simulation of prosthetic aortic valves: comparison between immersed boundary and arbitrary Lagrangian-Eulerian techniques for the mesh representation. PLoS ONE. 2016;11(4):e0154517. doi: 10.1371/journal.pone.0154517. [DOI] [PMC free article] [PubMed] [Google Scholar]
- 8.Blackshear JL, Wysokinska EM, Safford RE, et al. Indices of von Willebrand factor as biomarkers of aortic stenosis severity: (from the biomarkers of aortic stenosis severity [bass] study) Am. J. Cardiol. 2013;111(3):374–381. doi: 10.1016/j.amjcard.2012.10.015. [DOI] [PMC free article] [PubMed] [Google Scholar]
- 9.Blom JA. Monitoring of Respiration and Circulation. Boston: CRC Press; 2003. [Google Scholar]
- 10.Bluestein D, Einav S. The effect of varying degrees of stenosis on the characteristics of turbulent pulsatile flow through heart valves. J. Biomech. 1995;28(8):915–924. doi: 10.1016/0021-9290(94)00154-v. [DOI] [PubMed] [Google Scholar]
- 11.Bluestein D, Niu L, Schoephoerster RT, Dewanjee MK. Fluid mechanics of arterial stenosis: relationship to the development of mural thrombus. Ann. Biomed. Eng. 1997;25(2):344. doi: 10.1007/BF02648048. [DOI] [PubMed] [Google Scholar]
- 12.Bortot M, Ashworth K, Sharifi A, et al. Turbulent flow promotes cleavage of VWF (von Willebrand Factor) by ADAMTS13 (a disintegrin and metalloproteinase with a thrombospondin type-1 motif, member 13) Arterioscler. Thromb. Vasc. Biol. 2019 doi: 10.1161/ATVBAHA.119.312814. [DOI] [PMC free article] [PubMed] [Google Scholar]
- 13.Budde U, Schneppenheim R, Eikenboom J, et al. Detailed von Willebrand factor multimer analysis in patients with von Willebrand disease in the European study, molecular and clinical markers for the diagnosis and management of type 1 von Willebrand disease (MCMDM-1VWD) J. Thromb. Haemost. 2008;6(5):762–771. doi: 10.1111/j.1538-7836.2008.02945.x. [DOI] [PubMed] [Google Scholar]
- 14.Cao W, Krishnaswamy S, Camire RM, Lenting PJ, Zheng XL. Factor VIII accelerates proteolytic cleavage of von Willebrand factor by ADAMTS13. Proc. Natl. Acad. Sci. USA. 2008;105(21):7416–7421. doi: 10.1073/pnas.0801735105. [DOI] [PMC free article] [PubMed] [Google Scholar]
- 15.Chandra S, Rajamannan NM, Sucosky P. Computational assessment of bicuspid aortic valve wall-shear stress: implications for calcific aortic valve disease. Biomech. Model Mechanobiol. 2012;11(7):1085–1096. doi: 10.1007/s10237-012-0375-x. [DOI] [PubMed] [Google Scholar]
- 16.Chen D, Thomas CS, Blackshear JL. Predictors of ccquired Von Willebrand syndrome in patients with aortic stenosis. Blood. 2015;118(21):3318–3318. [Google Scholar]
- 17.Clendenen N, Tollefson A, Dzieciatkowska M, et al. Correlation of pre-operative plasma protein concentrations in cardiac surgery patients with bleeding outcomes using a targeted quantitative proteomics approach. Proteomics Clin. Appl. 2017;1:1. doi: 10.1002/prca.201600175. [DOI] [PMC free article] [PubMed] [Google Scholar]
- 18.Crawley JTB, de Groot R, Xiang Y, Luken BM, Lane DA. Unraveling the scissile bond: how ADAMTS13 recognizes and cleaves von Willebrand factor. Blood. 2011;118(12):3212–3221. doi: 10.1182/blood-2011-02-306597. [DOI] [PMC free article] [PubMed] [Google Scholar]
- 19.Dent JA, Berkowitz SD, Ware J, Kasper CK, Ruggeri ZM. Identification of a cleavage site directing the immunochemical detection of molecular abnormalities in type IIA von Willebrand factor. Proc. Natl. Acad. Sci. USA. 1990;87(16):6306–6310. doi: 10.1073/pnas.87.16.6306. [DOI] [PMC free article] [PubMed] [Google Scholar]
- 20.Dent JA, Galbusera M, Ruggeri ZM. Heterogeneity of plasma von willebrand factor multimers resulting from proteolysis of the constituent subunit. J. Clin. Invest. 1991;88(3):774–782. doi: 10.1172/JCI115376. [DOI] [PMC free article] [PubMed] [Google Scholar]
- 21.Feys HB, Anderson PJ, Vanhoorelbeke K, Majerus EM, Sadler JE. Multi-step binding of ADAMTS13 to VWF. J. Thromb. Haemost. 2009 doi: 10.1111/j.1538-7836.2009.03620.x. [DOI] [PMC free article] [PubMed] [Google Scholar]
- 22.Feys HB, Anderson PJ, Vanhoorelbeke K, Majerus EM, Sadler JE. Multi-step binding of ADAMTS-13 to von Willebrand factor. J. Thromb. Haemost. 2009;7(12):2088–2095. doi: 10.1111/j.1538-7836.2009.03620.x. [DOI] [PMC free article] [PubMed] [Google Scholar]
- 23.Frank RD, Lanzmich R, Haager PK, Budde U. Severe aortic valve stenosis: sustained cure of acquired von willebrand syndrome after surgical valve replacement. Clin. Appl. Thromb. 2016;23(3):229–234. doi: 10.1177/1076029616660759. [DOI] [PubMed] [Google Scholar]
- 24.Fu H, Jiang Y, Yang D, Scheiflinger F, Wong WP, Springer TA. Flow-induced elongation of von Willebrand factor precedes tension-dependent activation. Nat. Commun. 2017;8(1):324. doi: 10.1038/s41467-017-00230-2. [DOI] [PMC free article] [PubMed] [Google Scholar]
- 25.Grimard BH, Larson JM. Aortic stenosis: diagnosis and treatment. Am. Fam. Physician. 2008;78(6):717–724. [PubMed] [Google Scholar]
- 26.Ha H, Lantz J, Ziegler M, et al. Estimating the irreversible pressure drop across a stenosis by quantifying turbulence production using 4D Flow MRI. Sci. Rep. 2017;7:46618. doi: 10.1038/srep46618. [DOI] [PMC free article] [PubMed] [Google Scholar]
- 27.Han Y, Xiao J, Falls E, Zheng XL. A shear-based assay for assessing plasma ADAMTS13 activity and inhibitor in patients with thrombotic thrombocytopenic purpura. Transfusion. 2011;51(7):1580–1591. doi: 10.1111/j.1537-2995.2010.03020.x. [DOI] [PMC free article] [PubMed] [Google Scholar]
- 28.Jhun C-S, Siedlecki C, Xu L, et al. Stress and exposure time on von Willebrand factor degradation. Artif. Organs. 2019;43(2):199–206. doi: 10.1111/aor.13323. [DOI] [PubMed] [Google Scholar]
- 29.Kleiman NS, Reardon MJ. Von Willebrand factor, paravalvular leak, and a new vista for TAVR. J. Thorac. Dis. 2016;8(10):E1337–E1339. doi: 10.21037/jtd.2016.10.61. [DOI] [PMC free article] [PubMed] [Google Scholar]
- 30.Kokame K, Nobe Y, Kokubo Y, Okayama A, Miyata T. FRETS-VWF73, a first fluorogenic substrate for ADAMTS13 assay. Br. J. Haematol. 2005;129(1):93–100. doi: 10.1111/j.1365-2141.2005.05420.x. [DOI] [PubMed] [Google Scholar]
- 31.Larson JW, Yantz GR, Zhong Q, et al. Single DNA molecule stretching in sudden mixed shear and elongational microflows. Lab. Chip. 2006;6(9):1187–1199. doi: 10.1039/b602845d. [DOI] [PubMed] [Google Scholar]
- 32.Lasne D, Dey C, Dautzenberg M-D, et al. Screening for von Willebrand disease: contribution of an automated assay for von Willebrand factor activity. Haemophilia. 2012;18(3):e158–e163. doi: 10.1111/j.1365-2516.2011.02662.x. [DOI] [PubMed] [Google Scholar]
- 33.Li Y, Hsiao K-W, Brockman CA, et al. When ends meet: circular DNA stretches differently in elongational flows. Macromolecules. 2015;48(16):5997–6001. [Google Scholar]
- 34.Majerus EM, Anderson PJ, Sadler JE. Binding of ADAMTS13 to von Willebrand Factor. J. Biol. Chem. 2005;280(23):21773–21778. doi: 10.1074/jbc.M502529200. [DOI] [PubMed] [Google Scholar]
- 35.Majerus EM, Zheng X, Tuley EA, Sadler JE. Cleavage of the ADAMTS13 propeptide is not required for protease activity. J. Biol. Chem. 2003;278(47):46643–46648. doi: 10.1074/jbc.M309872200. [DOI] [PMC free article] [PubMed] [Google Scholar]
- 36.Maxwell MJ, Dopheide SM, Turner SJ, Jackson SP. Shear induces a unique series of morphological changes in translocating platelets. Arterioscler. Thromb. Vasc. Biol. 2006;26(3):663–669. doi: 10.1161/01.ATV.0000201931.16535.e1. [DOI] [PubMed] [Google Scholar]
- 37.Meyer D, Girma JP. Von-willebrand-factor - structure and function. Thromb. Haemost. 1993;70(1):99–104. [PubMed] [Google Scholar]
- 38.Morabito M, Dong C, Wei W, et al. Internal tensile force and A2 domain unfolding of von Willebrand factor multimers in shear flow. Biophys. J. 2018;115(10):1860–1871. doi: 10.1016/j.bpj.2018.09.001. [DOI] [PMC free article] [PubMed] [Google Scholar]
- 39.Neeves KB, Maloney SF, Fong KP, et al. Microfluidic focal thrombosis model for measuring murine platelet deposition and stability: PAR4 signaling enhances shear-resistance of platelet aggregates. J. Thromb. Haemost. 2008;6(12):2193–2201. doi: 10.1111/j.1538-7836.2008.03188.x. [DOI] [PubMed] [Google Scholar]
- 40.Ng CJ, McCrae KR, Ashworth K, et al. Effects of anti-β2GPI antibodies on VWF release from human umbilical vein endothelial cells and ADAMTS13 activity. Res. Pract. Thromb. Haemost. 2018;2(2):380–389. doi: 10.1002/rth2.12090. [DOI] [PMC free article] [PubMed] [Google Scholar]
- 41.Nishimura RA, Otto CM, Bonow RO, et al. 2014 AHA/ACC guideline for the management of patients with valvular heart disease: executive summary: a report of the American College of Cardiology/American Heart Association Task Force on Practice Guidelines. Circulation. 2014;129(23):2440–2492. doi: 10.1161/CIR.0000000000000029. [DOI] [PubMed] [Google Scholar]
- 42.Ober TJ, Haward SJ, Pipe CJ, Soulages J, McKinley GH. Microfluidic extensional rheometry using a hyperbolic contraction geometry. Rheol. Acta. 2013;52(6):529–546. [Google Scholar]
- 43.Sagheer S, Rodgers S, Yacoub O, Dauer R, Mcrae S, Duncan E. Comparison of von Willebrand factor (VWF) activity levels determined by HemosIL AcuStar assay and HemosIL LIA assay with ristocetin cofactor assay by aggregometry. Haemophilia. 2016;22(3):e200–e207. doi: 10.1111/hae.12937. [DOI] [PubMed] [Google Scholar]
- 44.Schneider SW, Nuschele S, Wixforth A, et al. Shear-induced unfolding triggers adhesion of von Willebrand factor fibers. Proc. Natl. Acad. Sci. USA. 2007;104(19):7899–7903. doi: 10.1073/pnas.0608422104. [DOI] [PMC free article] [PubMed] [Google Scholar]
- 45.Sedaghat A, Kulka H, Sinning J-M, et al. Transcatheter aortic valve implantation leads to a restoration of von Willebrand factor (VWF) abnormalities in patients with severe aortic stenosis – Incidence and relevance of clinical and subclinical VWF dysfunction in patients undergoing transfemoral T. Thromb. Res. 2017;151:23–28. doi: 10.1016/j.thromres.2016.12.027. [DOI] [PubMed] [Google Scholar]
- 46.Sharifi A, Niazmand H. Analysis of flow and LDL concentration polarization in siphon of internal carotid artery: non-Newtonian effects. Comput. Biol. Med. 2015;65:93–102. doi: 10.1016/j.compbiomed.2015.08.002. [DOI] [PubMed] [Google Scholar]
- 47.Shim K, Anderson PJ, Tuley EA, Wiswall E, Evan SadlerJ. Platelet-VWF complexes are preferred substrates of ADAMTS13 under fluid shear stress. Blood. 2008;111(2):651–657. doi: 10.1182/blood-2007-05-093021. [DOI] [PMC free article] [PubMed] [Google Scholar]
- 48.Siediecki CA, Lestini BJ, Kottke-Marchant KK, Eppell SJ, Wilson DL, Marchant RE. Shear-dependent changes in the three-dimensional structure of human von Willebrand factor. Blood. 1996;88(8):2939–2950. [PubMed] [Google Scholar]
- 49.Sing CE, Alexander-Katz A. Elongational flow induces the unfolding of von Willebrand factor at physiological flow rates. Biophys. J. 2010;98(9):L35–L37. doi: 10.1016/j.bpj.2010.01.032. [DOI] [PMC free article] [PubMed] [Google Scholar]
- 50.Singh I, Themistou E, Porcar L, Neelamegham S. Fluid shear induces conformation change in human blood protein von willebrand factor in solution. Biophys. J. 2009;96(6):2313–2320. doi: 10.1016/j.bpj.2008.12.3900. [DOI] [PMC free article] [PubMed] [Google Scholar]
- 51.Skipwith CG, Cao W, Zheng XL. Factor VIII and platelets synergistically accelerate cleavage of von Willebrand factor by ADAMTS13 under fluid shear stress. J. Biol. Chem. 2010;285(37):28596–28603. doi: 10.1074/jbc.M110.131227. [DOI] [PMC free article] [PubMed] [Google Scholar]
- 52.Solomon C, Budde U, Schneppenheim S, et al. Acquired type 2A von Willebrand syndrome caused by aortic valve disease corrects during valve surgery. Br. J. Anaesth. 2011;106(4):494–500. doi: 10.1093/bja/aeq413. [DOI] [PubMed] [Google Scholar]
- 53.Sousa PC, Pinho FT, Oliveira MSN, Alves MA. Extensional flow of blood analog solutions in microfluidic devices. Biomicrofluidics. 2011;5(1):14108. doi: 10.1063/1.3567888. [DOI] [PMC free article] [PubMed] [Google Scholar]
- 54.South K, Luken BM, Crawley JTB, et al. Conformational activation of ADAMTS13. Proc. Natl. Acad. Sci. 2014;111(52):18578–18583. doi: 10.1073/pnas.1411979112. [DOI] [PMC free article] [PubMed] [Google Scholar]
- 55.Spangenberg T, Budde U, Schewel D, et al. Treatment of acquired von willebrand syndrome in aortic stenosis with transcatheter aortic valve replacement. JACC Cardiovasc. Interv. 2015;8(5):692–700. doi: 10.1016/j.jcin.2015.02.008. [DOI] [PubMed] [Google Scholar]
- 56.Stockschlaeder M, Schneppenheim R, Budde U. Update on von Willebrand factor multimers: focus on high-molecular-weight multimers and their role in hemostasis. Blood Coagul. Fibrinolysis. 2014;25(3):206–216. doi: 10.1097/MBC.0000000000000065. [DOI] [PMC free article] [PubMed] [Google Scholar]
- 57.Su B, Zhong L, Wang X-K, et al. Numerical simulation of patient-specific left ventricular model with both mitral and aortic valves by FSI approach. Comput. Methods Programs Biomed. 2014;113(2):474–482. doi: 10.1016/j.cmpb.2013.11.009. [DOI] [PubMed] [Google Scholar]
- 58.Thubrikar MJ. The Aortic Valve. London: Taylor & Francis; 1989. [Google Scholar]
- 59.Van Belle E, Rauch A, Vincentelli A, et al. von Willebrand factor as a biological sensor of blood flow to monitor percutaneous aortic valve interventions. Circ. Res. 2015;116(7):1193–1201. doi: 10.1161/CIRCRESAHA.116.305046. [DOI] [PubMed] [Google Scholar]
- 60.Vincentelli A, Susen S, Le Tourneau T, et al. Acquired von Willebrand Syndrome in Aortic Stenosis. N. Engl. J. Med. 2003;349(4):343–349. doi: 10.1056/NEJMoa022831. [DOI] [PubMed] [Google Scholar]
- 61.Xiang Y, de Groot R, Crawley JTB, Lane DA. Mechanism of von Willebrand factor scissile bond cleavage by a disintegrin and metalloproteinase with a thrombospondin type 1 motif, member 13 (ADAMTS13) Proc. Natl. Acad. Sci. 2011;108(28):11602–11607. doi: 10.1073/pnas.1018559108. [DOI] [PMC free article] [PubMed] [Google Scholar]
- 62.Xu AJ, Springer TA. Calcium stabilizes the von Willebrand factor A2 domain by promoting refolding. Proc. Natl. Acad. Sci. USA. 2012;109(10):3742–3747. doi: 10.1073/pnas.1121261109. [DOI] [PMC free article] [PubMed] [Google Scholar]
- 63.Zhang X, Halvorsen K, Zhang C-Z, Wong WP, Springer TA. Mechanoenzymatic cleavage of the ultralarge vascular protein von Willebrand Factor. Science (80-) 2009;324(5932):1330–1334. doi: 10.1126/science.1170905. [DOI] [PMC free article] [PubMed] [Google Scholar]
- 64.Zhou M, Dong X, Baldauf C, et al. A novel calcium-binding site of von Willebrand factor A2 domain regulates its cleavage by ADAMTS13. Blood. 2011;117(17):4623–4631. doi: 10.1182/blood-2010-11-321596. [DOI] [PubMed] [Google Scholar]
- 65.Zografos K, Pimenta F, Alves MA, Oliveira MSN. Microfluidic converging/diverging channels optimised for homogeneous extensional deformation. Biomicrofluidics. 2016;10(4):043508. doi: 10.1063/1.4954814. [DOI] [PMC free article] [PubMed] [Google Scholar]
Associated Data
This section collects any data citations, data availability statements, or supplementary materials included in this article.