

Abstract
Lentiviral vectors (LVs) are a popular gene delivery tool in cell and gene therapy and they are a primary tool for ex vivo transduction of T cells for expression of chimeric antigen receptor (CAR) in CAR-T cell therapies. Extensive process and product characterization are required in manufacturing virus-based gene vectors to better control batch-to-batch variability. However, it has been an ongoing challenge to make quantitative assessments of LV product because current analytical tools often are low throughput and lack robustness and standardization is still required. This paper presents a high-throughput and robust physico-chemical characterization method that directly assesses total LV particles. With simple sample preparation and fast elution time (6.24 min) of the LV peak in 440 mM NaCl (in 20 mM Tris-HCl [pH 7.5]), this ion exchange high-performance liquid chromatography (IEX-HPLC) method is ideal for routine in-process monitoring to facilitate the development of scalable and robust LV manufacturing processes. Furthermore, this HPLC method is suitable for the analysis of all in-process samples, from crude samples such as LV supernatants to final purified products. The linearity range of the standard curve is 3.13 × 10⁸ to 1.0 × 10¹⁰ total particles/mL, and both the intra- and inter-assay variabilities are less than 5%.
Keywords: high-performance liquid chromatography, lentiviral vector, particle quantification, Process Analytical Technologies, ratio transducing units to total particles
Graphical Abstract
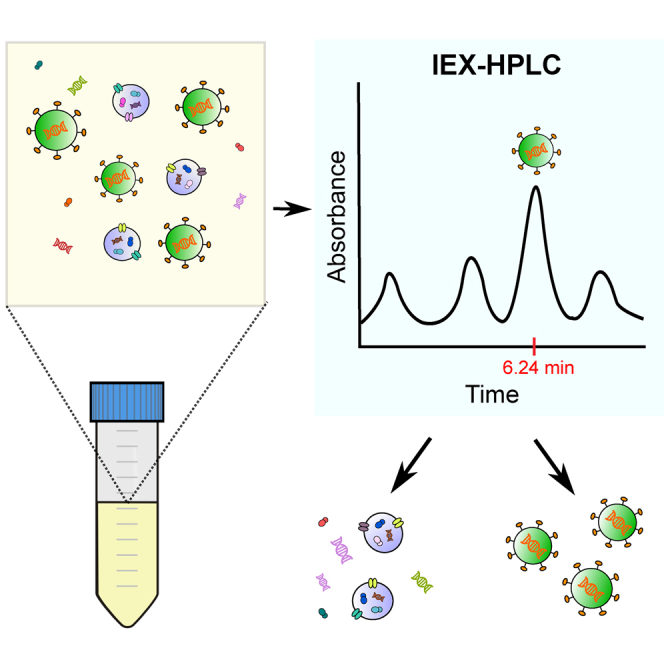
A rapid and sensitive high-performance liquid chromatography method was developed to characterize total lentiviral vector (LV) particles produced for cancer treatments. Key advantages of this method are short response time and routine use for analyzing all in-process samples, including crude and purified samples along the manufacturing steps.
Introduction
Lentiviral vectors (LVs) are approximately 80–100 nm in diameter and their genome consists of two copies of positive-sense single-stranded RNA inside a conical capsid, which is surrounded by a lipid bilayer.1 In addition to LVs’ ability to transduce both dividing and non-dividing cells, they offer many advantages, such as stable genome integration, long-term transgene expression, low mutagenicity, and delivery of large amounts of genetic information (∼10 kb) into host cell DNA.2 Some examples of lentiviruses are human (HIV), simian (SIV), feline (FIV), and equine infectious anemia (EIAV) immunodeficiency viruses and the most widely used LVs are derived from the HIV-1 virus.1
To date, there are two approved CAR (chimeric antigen receptor)-T cell therapies (Kymriah and Yescarta) and one approved ex vivo therapy for monogenic immunodeficiency (Strimvelis) that uses integrating LVs. Currently, there are 185 LV clinical trials, including 75 CAR-T cell trials that utilize LVs to transduce the T cells (ClinicalTrials.gov, accessed on March 10, 2020), as well as significant ongoing research activities using LVs for cell and gene therapy treatments for various conditions that are steadily progressing toward clinical applications.3 To effectively support these progressions and accelerate the transition from research and development to the clinic, scalable and robust LV manufacturing processes must be developed. A key factor in speeding up process development is rapid and sensitive quantification methods of vector particles that are suitable for analyzing in-process samples, from crude supernatants to final purified products. Such methods provide the means to assess process efficiency in terms of yield and recovery at each step of the manufacturing process. In addition, extensive characterization of purified LV batches is required in a good manufacturing practice (GMP) environment to develop a product suitable for human use. In fact, in response to the growing demand of LV standardization and to ensure the delivery of safe and efficacious doses of LV products for patients, the World Health Organization recently developed and characterized the first standard for LV integration.4
Over the years, there has been an increase of effort in developing faster and more reliable characterization methods to measure functional and total LV particles. However, the existing analytical tools often have low throughput and robustness, there is high variability in the obtained results due to limitations of each method, and the field continues to face the persisting challenge of making quantitative assessments of LV products. Some commonly used methods are the gene transfer assay (GTA), p24 enzyme-linked immunosorbent assay (ELISA), and polymerase chain reaction (PCR).5, 6, 7, 8, 9, 10
GTA is a cell-based analytical method that measures the transgene expression in transduced target cells to report functional vector particles. This method is commonly used in process development because the transgene can include green fluorescent protein (GFP), which can be easily detected and counted by flow cytometry. However, results from this cell-based assay are generally obtained in 3 days or longer, rendering it unsuitable to be used as a routine in-process monitoring tool. p24 ELISA, which is applicable only for HIV-1-derived LVs, and PCR are physical-based direct methods that provide faster delivery of results. However, they are tedious to perform and only a limited number of samples can be analyzed at a time.8 The droplet digital PCR (ddPCR) method is more robust and has higher throughput than the gold standard quantitative PCR since since it provides absolute quantification with higher sensitivity, omits the use of a standard, and requires less sample volume.11 However, the sample preparation steps, RNA extraction and cDNA synthesis, have been identified as sources of variability.
High-performance liquid chromatography (HPLC) methods, which are physico-chemical based, have been developed and used for the particle quantification of viral vectors, viral vaccines, and therapeutics, such as adenovirus, adeno-associated virus, baculovirus, influenza, and reovirus.12, 13, 14, 15, 16, 17, 18 In fact, an ion exchange (IEX)-HPLC method was instrumental in the development of a scalable and robust process at the 100-L scale in record time, leading to the process technology transfer to a GMP contract manufacturing organization to produce clinical-trial-grade material.14 This paper presents the development of an IEX-HPLC method for the quantification of total LV particles to be used for routine in-process monitoring. In addition, the HPLC method is compared with the commonly used characterization methods (GTA, p24 ELISA, and ddPCR) described above.
Results
LV Standard Used for Method Development
An in-house sucrose cushion purified LV material, SC-LV, was generated to be used for the HPLC method development. The LVs were produced using a stable producer cell line, HEK293SF-LVP-CMVGFPq-92, developed by the National Research Council Canada.19 These LVs contain GFP as the transgene and vesicular stomatitis virus-glycoprotein (VSV-G) at the membrane surface. The functional vector titer, determined by GTA, is 1.08 × 10⁸ TU/mL (transducing units per milliliter) and the total vector titer, determined by p24 ELISA, is 1.16 × 10¹⁰ LP/mL (LV particle concentration per milliliter). Figure 1A shows the SDS-PAGE (sodium dodecyl sulfate polyacrylamide gel electrophoresis) profiles of the protein molecular weight marker and SC-LV. Based on their apparent molecular weights, p24 capsid and VSV-G envelope were the major bands detected. Figure 1B shows the western blot profiles against p24 capsid and VSV-G envelope. In lane 1 of Figure 1B, p24 was detected as a major band and precursor Pr55 was detected as a minor band, with two light bands below Pr55 that are possibly intermediate proteins released during Pr55 maturation. In lane 2 of Figure 1B, VSV-G envelope was the only detected band. Figure 1C is an electron micrograph of SC-LV with pronounced rigid tails, which is typical of LVs when stained with phosphotungstic acid (PTA) and might underline the challenges associated with the size distribution of LV particles.
Figure 1.

Characterization of Sucrose Cushion Purified LV Standard (SC-LV)
(A) SDS-PAGE profiles: lane 1, protein molecular weight markers; lane 2, SC-LV, showing p24 capsid (bottom band) and VSV-G envelope (top band). (B) Western blot profiles: lane 1, against p24 capsid (bottom band) with precursor Pr55 (top band) and two light bands below Pr55 that are possibly the intermediate proteins released during Pr55 maturation; lane 2, against VSV-G envelope. (C) Negative stain electron microscopy using phosphotungstic acid staining, where the scale bar represents 100 nm at 40,000× magnification.
Resolution and Confirmation of LV Elution
An IEX-HPLC method for total LV particle quantification was developed using the LV standard (SC-LV), LV supernatant collected at 3 days post induction (3 dpi), and cell culture supernatant without LVs (0 dpi). First, a linear NaCl gradient of 100 mM/mL in 20 mM Tris-HCl (pH 7.5) was used to analyze SC-LV. The chromatographic peaks were monitored by fluorescence (FL), absorbance at 260 nm (OD260), and absorbance at 280 nm (OD280). Figure 2A shows the chromatogram monitored by OD260, where four peaks were detected (indicated as 1, 2, 3, and 4) and eluted at NaCl concentrations of 35, 190, 508, and 777 mM, respectively. To identify and confirm LVs, the same SC-LV sample was repeatedly injected at a volume of 200 μL, and the individual peaks as shown in Figure 2A (except for peak 4) were collected, pooled, and concentrated, followed by western blot analysis against p24 capsid and VSV-G envelope. Peak 3, which eluted around 500 mM NaCl, exhibits the presence of p24 capsid and VSV-G envelope bands (inset figure of Figure 2A), whereas these bands were not detected in the other peaks (results shown in Figure S1). Thus, these results confirmed the identity of LVs in peak 3.
Figure 2.

HPLC Chromatographic Profiles during Method Development Using a Linear NaCl Gradient of 100 mM/mL in 20 mM Tris-HCl (pH 7.5)
(A) SC-LV sample detected by OD260, where LVs were confirmed to elute in peak 3 at ∼500 mM NaCl based on the detection of p24 capsid and VSV-G envelope by western blot analysis (inset figure). (B) 3 dpi LV supernatant, 0 dpi cell culture supernatant, and cell culture medium samples with an overlay of the SC-LV sample, detected by FL.
Peaks 1 and 2 were assumed to be residual host proteins based on their elution in low salt concentrations. Peak 4 was identified to be residual host DNA based on the analysis of double-stranded DNA standard (Figure S2A), and its area in Figure 2A suggests that the amount is insignificant in the SC-LV sample. Overall, the chromatographic profile in Figure 2A shows that LVs can be well resolved from host proteins and DNA. Chromatograms monitored by FL were used for the remainder of the method development because its detection shows superior sensitivity as compared with OD260 detection, as shown in Figure S2B.
Then, to further assess the LV separation from other components in the sample matrix, 3 and 0 dpi samples, as well as the cell culture medium used for production, were analyzed using the same linear salt gradient used for SC-LV. Figure 2B shows the chromatographic profiles of these samples detected by FL with an overlay of SC-LV. The peak eluted at 500 mM NaCl for 3 dpi is significantly higher than for SC-LV, although it is unresolved from an adjacent peak, which is eluted earlier. The 0 dpi sample shows a similar profile as 3 dpi, except with lower signal intensity. As expected, no peak was detected at 500 mM NaCl for cell culture medium. Given that 0 dpi is a cell culture supernatant with no LVs, the eluted peak at 500 mM NaCl for this sample was assumed to be extracellular vesicles (EVs) or exosomes. To confirm the presence of EVs in these samples, we performed the acetylcholinesterase (AChE) activity assay, a commonly used method for detecting the presence of exosomes in biological samples. The results showed that all three samples (SC-LV, 3 dpi, and 0 dpi) exhibited AChE activity (results shown in Table S1), which is indicative of the presence of EVs.
Minimization of Co-eluting EVs
The method was further optimized to separate or minimize the presence of EVs in the LV peak by implementing a column wash post sample injection while maintaining the elution at 500 mM NaCl. The tested step gradients for the column wash were from 250 to 400 mM NaCl, the samples used for this optimization were SC-LV and 0 dpi, and the analysis was based on the peak area (PA) reduction of the peak eluted at 500 mM NaCl. Figure S3 shows the highest PA reduction of 85% and 94% for SC-LV and 0 dpi, respectively, with 370 mM NaCl column wash. Additionally, the OD260/280 ratio was used to evaluate the quality of the LV peak eluted at 500 mM NaCl with the varying concentrations of the NaCl wash. OD260/280 ratio results from Table S2 suggest that the 0 dpi sample contains only EVs, whereas the SC-LV sample contains both LVs and EVs.
Optimization of LV Peak Elution
Based on the results obtained from minimizing the presence of co-eluting EVs, the optimized conditions are a 370 mM NaCl step gradient column wash, followed by a 500 mM NaCl step gradient elution. Next, the three samples (SC-LV, 3 dpi, and 0 dpi) were analyzed to validate these conditions. Interestingly, the LV peak for 3 dpi was detected as split peaks with retention times of 6.24 and 6.68 min, whereas SC-LV showed a single peak eluted at 6.24 min and 0 dpi showed an insignificant peak also at 6.24 min (Figure S4A). To resolve the split peaks, we further optimized the LV elution using a step gradient elution lower than 500 mM NaCl, where the test range was from 410 to 450 mM NaCl. An enlarged profile of the LV peak at these varying NaCl concentrations and some of the OD260/280 ratios are shown in Figure S4B. From the evaluation of LV peak intensities and OD260/280 ratios, 440 mM NaCl was selected as the step gradient elution.
Finalized HPLC Method
SC-LV, 3 dpi, and 0 dpi samples were analyzed using the final established conditions (50-μL sample injection, 370 mM NaCl step gradient column wash post sample injection, 440 mM NaCl step gradient elution, and detection by FL at excitation and emission wavelengths at 290 and 335 nm, respectively). Figure 3 shows overlaid chromatographic profiles of the three samples, where the LV peak in 3 dpi is now a single peak eluted at the same retention time as the LV peak in SC-LV. The 0 dpi sample shows a minor LV peak eluted at 6.24 min as compared with the SC-LV and 3 dpi samples. This was expected because the 0 dpi sample should not contain any LVs. Note that the 3 dpi sample shows a significant peak eluted at a similar retention time as DNA (as indicated in Figure 3A). This was expected because the cell viability at harvest was low (<30%) and no DNase digestion was performed prior to analysis. Because DNA alone does not exhibit FL at the wavelengths used for detection, as previously shown in Figure S2B, it was assumed that the signal can come from host proteins bound to host DNA.
Figure 3.

Final Established HPLC Method: 370 mM NaCl Step Gradient Column Wash after Sample Injection and 440 mM NaCl Step Gradient Elution of LVs in 20 mM Tris-HCl (pH 7.5)
(A) HPLC chromatographic profile shows one single LV peak eluted at 6.24 min for SC-LV and 3 dpi samples. (B) A standard curve was generated using the SC-LV standard, with the linearity range of 3.13 × 10⁸ to 1.0 × 10¹⁰ TP/mL. The intra-assay (repeatability) and inter-assay (day-to-day) variabilities are less than 5% RSD.
A standard curve was generated using the LP per milliliter obtained by p24 ELISA of the SC-LV sample, where standards ranging from 3.13 × 10⁸ to 1.0 × 10¹⁰ were injected in repeats. The standard curve was plotted as total particles per milliliter (TP/mL) in the x-axis and PA in the y-axis. A good correlation coefficient (R2) of 0.9999 was obtained with a slope of 0.0077 and y-intercept of −296,992. The precision or variability of the assay, expressed as percentage relative standard deviation (RSD), was determined by the analysis of the 3 dpi LV supernatant sample for 5 days, with six injections per day. The repeat injections had a <5% RSD and were within ±20% of the linear regression line. The intra-assay (repeatability) and inter-assay (day-to-day) variabilities of the assay were found to be less than 5% RSD.
Monitoring LV Particles in Upstream Samples
The developed HPLC method, along with p24 ELISA and GTA, was performed on six LV supernatants (referred to as LV-1 to LV-6) that were collected at 3 days post induction during an optimization of an upstream process with various tested conditions, such as medium, seeding density, and production method. These LVs were produced using the stable producer cell line HEK293SF-LVP-CMVGFPq-92.19 Figure 4A shows that the TP/mL (total particles per milliliter), measured by HPLC, is higher than LP/mL (LV particle concentration per milliliter), measured by p24 ELISA, in all crude supernatants except for LV-4. In regard to the GTA, the TU/mL (transducing units -per milliliter) values, which reflect functional LV particles, for LV-1 to LV-6 are significantly lower than both TP/mL and LP/mL values, which reflect total LV particles.
Figure 4.

LV Particle Monitoring in Upstream Samples
LP/mL, Vg/mL, and TU/mL values are shown as mean + SD. (A) For six different crude supernatant samples: TP/mL (HPLC) is higher than LP/mL (p24 ELISA) for all samples, except for LV-4; TU/mL values (reflect functional particles) are significantly lower than TP/mL and LP/mL values (both reflect total particles). (B) Supernatants collected from 2 to 4 days after induction for a 3L perfusion LV production: TU/mL values are significantly lower than TP/mL, LP/mL, and Vg/mL values; total vector particle values converge as the LV production progresses.
In addition, LV supernatant of a 3L perfusion production was collected from 2 to 4 dpi and analyzed by HPLC, p24 ELISA, ddPCR (in vector genomes per milliliter [Vg/mL]), and GTA, as shown in Figure 4B. These LVs were also produced using the stable producer cell line HEK293SF-LVP-CMVGFPq-92.19 GTA, in comparison with HPLC, p24 ELISA, and ddPCR, shows a similar trend as in Figure 4A, where the number of functional LV particles is significantly lower than the number of total LV particles measured by the three different methods. The total vector particle values for the three analytical methods converge as the LV production progresses, with an average of 9.39 × 10⁸ titer and 3.8% coefficient of variation (CV) for the 4 dpi sample.
Monitoring LV Particles in Downstream Samples
The developed HPLC method, along with p24 ELISA, GTA, and ddPCR, was also performed on downstream process (DSP) samples from a LV production by transient transfection using the third generation LV encoding a CAR using four plasmids. In brief, the DSP started with the collection of the 3 dpi supernatant, DNA digestion with endonucleases, clarification through filtration, followed by concentration and diafiltration by tangential flow filtration (UFDF). The samples collected from the DSP are referred to as supernatant, DNA digestion, clarified supernatant, and UFDF product. Figure 5A shows that HPLC and p24 ELISA values exhibit a similar pattern, with TP per milliliter higher than LP per milliliter for each sample in the DSP. The ddPCR values are similar to p24 ELISA values for supernatant (average 2.92 × 10⁹ total particle titer, 3.1% CV) and clarified supernatant (average 3.05 × 10⁹ total particle titer, 8.7% CV) samples, but lower for DNA digestion and UFDF product samples. The functional vector particles (TU/mL) are significantly lower than the total vector particles (TP/mL, LP/mL, and Vg/mL), which is the same trend observed in the upstream samples.
Figure 5.

Total and Functional Vector Titers for Downstream Samples and the In-House LV Standard
(A) LV particle monitoring in downstream samples. HPLC and p24 ELISA values exhibit a similar pattern, with the former (TP/mL) higher than the latter (LP/mL) for each sample. ddPCR values (Vg/mL) are similar to p24 ELISA values (LP/mL) for supernatant and clarified supernatant samples, but lower for Benzonase digestion and UFDF product samples. Functional vector particles (TU/mL) are significantly lower than total vector particles (TP/mL, LP/mL, and Vg/mL). Vg/mL and TU/mL values are shown as mean + SD. (B) LV particle monitoring in the in-house LV standard (SC-LV). All values are shown as mean + SD.
Figure 5B shows the total vector particles, assessed by the three different analytical methods, as well as the functional vector particles, assessed by GTA, for the in-house LV standard, SC-LV. For this sample, the HPLC and p24 ELISA values are similar (average 1.20 × 10¹⁰ total particle titer, 5.0% CV), the ddPCR value is 1 log lower (1.31 × 10⁹ Vg/mL), and the GTA value is 2 logs lower (1.08 × 10⁸ TU/mL). As seen in Figure 5, both SC-LV and UFDF product samples show 109 Vg/mL for ddPCR and 1010 total particle titer for HPLC and p24 ELISA. The trend where functional vector particles are lower than total vector particles still exists; however, the functional vector titer is 108 TU/mL instead of 107 TU/mL, as previously seen in other DSP samples and upstream samples.
Discussion
The linearity range of the standard curve of this HPLC method was established to be 3.13 × 10⁸ to 1.0 × 10¹⁰ TP/mL. Taking the current state-of-the-art LV production into consideration, vector particles ranging from 108 to 1010 TP/mL can be achieved. With perfusion as the production method and ultracentrifugation as the concentration method for the in-house SC-LV, the practical higher limit of 1010 TP/mL was achieved and utilized as the upper limit of the linearity range. Theoretically, surpassing 1010 TP/mL can be achieved with process intensification and other improvements. However, currently, the ability to further concentrate beyond 1010 TP/mL is limited by the risk of aggregation. Thus, a higher upper limit of the linearity range cannot be proved experimentally. Until a more robust LV production process becomes a reality, this linearity range can still be utilized for characterizing viral preparations with higher total vector titers by sample dilution.
Toward the beginning of the HPLC method development, it was observed that the 3 dpi sample showed a significantly higher LV peak than SC-LV, where it was unresolved from an adjacent peak, and the 0 dpi sample exhibited a similar eluted profile as 3 dpi with lower signal intensity. Given that 0 dpi is a cell culture supernatant with no LVs, the eluted LV peak for this sample was assumed to be EVs or exosomes, because it is widely known that these particles co-produce with lentivirus/HIV production.20, 21, 22, 23 In addition, it has been shown that EVs co-purify with LVs, given their intrinsic similarities in physico-chemical properties with lentivirus/HIV.23 Thus, it was also assumed that EVs can be present in the 3 dpi and SC-LV samples. The HPLC method was further optimized to minimize the presence of EVs in the LV peak by implementing a column wash after sample injection.
During method development, the OD260/280 ratio was used to assess the LV peak content because this ratio reflects the relationship between nucleic acids and proteins in a virus suspension.24 In general, proteins typically have an OD260/280 ratio that is <1.0, which is indicative of the absence of nucleic acids (a major contribution to the OD260) and the presence of tryptophan and tyrosine residues, as well as disulfide bonds in proteins (a major contribution to the OD280). Although the OD260/280 ratio of a purified LV has not been determined, nor is it available in the literature, this approach was utilized to monitor the eluted LV peak while different NaCl column wash gradients were implemented. An OD260/280 ratio closer to or below 1.0 indicates that there might be a significant amount of EVs present in the eluted peak. The results obtained suggest that the 0 dpi sample contains only EVs, whereas the 3 dpi and SC-LV samples contain both LVs and EVs. The presence of co-eluting EVs is a well-recognized problem in the field of LV production. Although the current state-of-the-art does not support the complete removal of EVs, this developed HPLC method can serve as a valuable tool that quantifies LVs while minimizing EV contributions to the overall detection signal of LV particles.
The applicability of the HPLC method was demonstrated with crude LV supernatants collected at 2–4 dpi and at each step of the DSP. Overall, HPLC, p24 ELISA, and ddPCR methods show comparable total vector particle values for all samples. In comparison to the p24 ELISA, the HPLC method proves to be a superior method because of the ease of sample preparation, short analysis time, and cost-effectiveness of materials and reagents. The HPLC method is also a superior method when compared to to ddPCR because the latter requires extra sample preparation steps (nucleic acid extraction and cDNA synthesis), which have been identified as sources of variability, before the samples can be analyzed. Consequently, the HPLC method has the advantage of simple sample preparation while providing more consistent results. In addition, ddPCR has good precision for downstream samples, but not upstream samples. Thus, one main advantage of the HPLC method is its ability to characterize crude supernatant samples.
The data presented in Figures 4 and 5 support the important notion of tracking both total and functional vector particles because they show that only a fraction of the total produced LVs is functional. As expected, it is crucial to assess the total vector titer for each batch of produced LVs in order to assess yields and recoveries from the manufacturing process. However, any batch will include defective and non-functional particles in addition to the desired functional particles, which means not all of the produced LVs have the ability and efficiency in transducing host cells to effectively deliver genetic material to be integrated in the host cell genome. Thus, it is equally important to determine the functional vector titer for each batch of produced LVs to appropriately estimate the manufactured amount needed for an effective treatment. It is notably important to extensively characterize virus-based gene vectors because they tend to have greater variability between batches, especially when it comes to the ratio of functional to total vector particles.25
Reliable, rapid, and sensitive analytical methods are crucial in accelerating and transferring the process from development to manufacturing for the clinic, ultimately facilitating the development of scalable and robust LV manufacturing processes. In addition to being a high-throughput and robust method with simple sample preparation, a key advantage to this HPLC method is that it is suitable to be used routinely for analyzing all in-process samples, from crude samples such as LV supernatants to final purified products.
Materials and Methods
LV Production
For the in-house sucrose cushion LV standard and all crude supernatant samples, LVs were produced using the stable producer cell line HEK293SF-LVP-CMVGFPq-92, developed by the National Research Council Canada,19 with HyClone SFM4Transfx-293 or HyClone HyCell media from Cytiva (Marlborough, MA, USA) in 3L bioreactors, both in perfusion and batch modes, as previously described.19 For downstream samples, LVs were produced by transient transfection using the third generation LV encoding a CAR (LV-CAR) using four plasmids.
Purification of the In-House LV Standard
LV supernatant collected at 3 dpi from a 3L perfusion production was digested with 20 U/mL Benzonase from EMD Life Sciences (Darmstadt, Germany) for 1 h at room temperature, followed by clarification through a Supor membrane with double pore size of 0.8/0.45 μm from Pall Corporation (Port Washington, NY, USA) and centrifugation in 25% sucrose cushion at 37,000 × g using the A621 Sorvall rotor from Thermo Fisher Scientific (Waltham, MA, USA) for 3 h at 4°C. The spent medium was discarded, and Tris buffer (20 mM Tris-HCl [pH 7.5]) with 5% sucrose and 2 mM MgCl2 were added to the LV pellet, then kept overnight at 4°C. The pellet was then resuspended by gentle pipetting up and down, aliquoted, and kept at −80°C for future analyses. This in-house LV standard was characterized by SDS-PAGE, western blot, negative stain electron microscopy (NSEM), GTA, p24 ELISA, ddPCR, and HPLC.
SDS-PAGE and Western Blot
SDS-PAGE was performed using a 4%–15% Mini-PROTEAN TGX pre-cast gel under reducing conditions, and silver staining of the protein bands was performed using Clarity Western ECL Substrate, both from Bio-Rad (Hercules, CA, USA). Western blot was performed by transferring the protein bands onto a 0.45-μm Protran Premium nitrocellulose membrane from GE Healthcare (Chicago, IL, USA) and incubating with primary antibodies against p24 from eENZYME (Gaithersburg, MD, USA) and VSV-G from Sigma-Aldrich (St. Louis, MO, USA). The specific bands were detected by incubation with anti-mouse horseradish peroxidase conjugated antibody from Jackson ImmunoResearch Laboratories (West Grove, PA, USA).
NSEM
NSEM was performed at Institut Armand Frappier (Laval, Canada) according to a method previously described.26 Staining was performed using 3% PTA for 1 min.
AChE
AChE activity was assessed using a fluorometric AChE assay kit (ab138872) from Abcam (Cambridge, UK), following the manufacturer’s protocol. This assay uses the FL of a thiol probe, reported in relative FL units, to measure AChE activity (reported in mU/mL) in samples.
GTA for Functional LV Quantification
The functional titer in transducing units per milliliter of LV samples was determined by a flow cytometry-based GTA as previously described.19 For convenience, the protocol used was as follows: HEK293A (adherent) cells were cultured in Dulbecco’s modified Eagle’s medium (DMEM) containing 5% FBS and 2 mM l-glutamine; the cells were seeded at a density of 1 × 10⁵ cells/well of a 24-well plate 5 h before transduction with LVs; LV samples were serially diluted in DMEM supplemented with 8 μg/mL polybrene and incubated at 37°C for 30 min prior to transduction; transduction was performed by removing culture medium, adding 200 μL of diluted LVs to cells, and incubating overnight at 37°C; 800 μL of culture medium was added to each well the next day, and cells were incubated for an additional 48 h prior to flow cytometry to quantify GFP-expressing cells. The titer was determined by using the following formula: (% of GFP positive cells/100) × (number of cells transduced) × (dilution factor) × (1 mL/volume transduced).
p24 ELISA for Total LV Quantification
The LV particle concentration per milliliter was quantified by the p24 ELISA kit from Cell Biolabs (San Diego, CA, USA), following the manufacturer’s protocol. All LV samples were diluted in Tris buffer (20 mM Tris-HCl [pH 7.5]), which was established to be used as a diluent because it was found that the use of cell culture medium resulted in lower titers by up to 5 logs difference (refer to Table S3 in the Supplemental Information for more details).
ddPCR for Total LV Quantification
The LV Vg (Vg/mL) was quantified by a QX200 ddPCR System from Bio-Rad (Hercules, CA, USA). Prior to running samples on the ddPCR system, sample preparation included extracting RNA from LV samples using a High Pure Viral Nucleic Acid Kit from Roche (Basel, Switzerland) and reverse transcribing into cDNA using an iScript Select cDNA Synthesis Kit from Bio-Rad (Hercules, CA, USA), both following the manufacturers’ protocols. Serial dilutions of cDNA were prepared in nuclease-free water. PCRs were prepared with the QX200 ddPCR EvaGreen Supermix and the woodchuck hepatitis virus posttranscriptional regulatory element (WPRE) primer set, because WPRE is known to stabilize the transgene mRNA and therefore enhance transgene expression delivered by LVs.27 PCR mixtures (22 μL) were prepared for the QX200 Droplet Generator, with final primer concentration of 0.8 μM. After droplet generation, the following PCR program was run: one cycle of 95°C for 5 min; 40 cycles of 95°C for 30 s, 60°C for 1 min, and 72°C for 30 s; one cycle of 72°C for 5 min; indefinite 12°C hold. ddPCR results were analyzed with the QX200 Droplet Reader and QuantaSoft Program.
HPLC for Total LV Quantification
A Waters HPLC Alliance System (Milford, MA, USA) equipped with a 2695 separation module, 996 photodiode array, 2475 FL detectors, and Empower software for data acquisition and peak integration was used. The stock solutions used were as follows: stock solution A, 0.10 M Tris-HCl (pH 7.5); stock solution B, 2 M NaCl in Milli-Q purified water; and stock solution C, Milli-Q purified water. All stock solutions were filtered through a 0.22-μm membrane before use. A 4.6 × 10 mm UNO Q polishing anion exchange column from Bio-Rad (Hercules, CA, USA) was used for viral separation. The output stream was monitored by FL at excitation and emission wavelengths of 290 and 335 nm, respectively, OD260, and OD280.
All samples were filtered through a Supor membrane with a pore size of 0.45 μm from Pall Corporation (Port Washington, NY, USA) before injection. Unless otherwise specified, all samples were injected at 50 μL, all gradients were formed with 20% stock solution A (final composition: 20 mM Tris-HCl [pH 7.5]), and a flow rate of 1 mL/min was employed during the entire analysis. Prior to the first sample injection, the column was equilibrated with 18.5% stock solution B for 10 min, followed by three consecutive injections of Tris buffer (20 mM Tris-HCl [pH 7.5]) to ensure a flat baseline. After sample injection, the column was washed with the same concentration of stock solution B for 5 min, followed by a step gradient elution at 21% stock solution B for 5 min. The column was cleaned and regenerated using a linear gradient from 21% to 75% stock solution B for 3 min and was put on hold at 75% stock solution B for 3 min, followed by re-equilibration at 18.5% stock solution B for 7 min before the next sample injection.
Author Contributions
Conceptualization, J.T., M.Y.T., and A.A.K.; Methodology, J.T., M.Y.T., S.L., S.T., and N.C.; Execution, J.T., M.Y.T., S.L., S.T., and N.C.; Writing – Original Draft, J.T. and M.Y.T.; Writing – Review & Editing, J.T., M.Y.T., M.A., and A.A.K.; Funding Acquisition & Resources, M.A. and A.A.K.
Conflicts of Interest
The authors declare no competing interests.
Acknowledgments
M.Y.T. is financially supported by a fellowship from the Faculty of Engineering, and A.A.K. is partially funded through Canada Research Chair CRC-240394. The authors would like to thank David Sharon for help in setting up the ddPCR method and Nasha Nassoury for performing the AChE activity assay.
Footnotes
Supplemental Information can be found online at https://doi.org/10.1016/j.omtm.2020.08.005.
Supplemental Information
References
- 1.Tolmachov O.E., Tolmachova T., Al-Allaf F.A. Designing lentiviral gene vectors. In: Xu K., editor. Viral Gene Therapy. InTech; 2011. pp. 263–284. [Google Scholar]
- 2.Escors D., Breckpot K., Arce F., Kochan G., Stephenson H. Springer; 2012. Lentiviral Vectors and Gene Therapy. [Google Scholar]
- 3.Milone M.C., O’Doherty U. Clinical use of lentiviral vectors. Leukemia. 2018;32:1529–1541. doi: 10.1038/s41375-018-0106-0. [DOI] [PMC free article] [PubMed] [Google Scholar]
- 4.Zhao Y., Traylen C., Rigsby P., Atkinson E., Satkunanathan S., Schneider C.K., Participants . WHO; 2019. Report on a Collaborative Study for the Proposed WHO 1st International Reference Panel (19/158) for the Quantification of Lentiviral Vector Integration Copy Numbers. [Google Scholar]
- 5.Scherr M., Battmer K., Blömer U., Ganser A., Grez M. Quantitative determination of lentiviral vector particle numbers by real-time PCR. Biotechniques. 2001;31:520–522, 524 passim. doi: 10.2144/01313st05. [DOI] [PubMed] [Google Scholar]
- 6.Sastry L., Johnson T., Hobson M.J., Smucker B., Cornetta K. Titering lentiviral vectors: comparison of DNA, RNA and marker expression methods. Gene Ther. 2002;9:1155–1162. doi: 10.1038/sj.gt.3301731. [DOI] [PubMed] [Google Scholar]
- 7.Geraerts M., Willems S., Baekelandt V., Debyser Z., Gijsbers R. Comparison of lentiviral vector titration methods. BMC Biotechnol. 2006;6:34. doi: 10.1186/1472-6750-6-34. [DOI] [PMC free article] [PubMed] [Google Scholar]
- 8.Delenda C., Gaillard C. Real-time quantitative PCR for the design of lentiviral vector analytical assays. Gene Ther. 2005;12(Suppl 1):S36–S50. doi: 10.1038/sj.gt.3302614. [DOI] [PubMed] [Google Scholar]
- 9.Barczak W., Suchorska W., Rubiś B., Kulcenty K. Universal real-time PCR-based assay for lentiviral titration. Mol. Biotechnol. 2015;57:195–200. doi: 10.1007/s12033-014-9815-4. [DOI] [PMC free article] [PubMed] [Google Scholar]
- 10.Lizée G., Aerts J.L., Gonzales M.I., Chinnasamy N., Morgan R.A., Topalian S.L. Real-time quantitative reverse transcriptase-polymerase chain reaction as a method for determining lentiviral vector titers and measuring transgene expression. Hum. Gene Ther. 2003;14:497–507. doi: 10.1089/104303403764539387. [DOI] [PubMed] [Google Scholar]
- 11.Wang Y., Bergelson S., Feschenko M. Determination of Lentiviral Infectious Titer by a Novel Droplet Digital PCR Method. Hum. Gene Ther. Methods. 2018;29:96–103. doi: 10.1089/hgtb.2017.198. [DOI] [PubMed] [Google Scholar]
- 12.Transfiguracion J., Mena J.A., Aucoin M.G., Kamen A.A. Development and validation of a HPLC method for the quantification of baculovirus particles. J. Chromatogr. B Analyt. Technol. Biomed. Life Sci. 2011;879:61–68. doi: 10.1016/j.jchromb.2010.11.011. [DOI] [PubMed] [Google Scholar]
- 13.Transfiguracion J., Manceur A.P., Petiot E., Thompson C.M., Kamen A.A. Particle quantification of influenza viruses by high performance liquid chromatography. Vaccine. 2015;33:78–84. doi: 10.1016/j.vaccine.2014.11.027. [DOI] [PubMed] [Google Scholar]
- 14.Transfiguracion J., Bernier A., Voyer R., Coelho H., Coffey M., Kamen A. Rapid and reliable quantification of reovirus type 3 by high performance liquid chromatography during manufacturing of Reolysin. J. Pharm. Biomed. Anal. 2008;48:598–605. doi: 10.1016/j.jpba.2008.05.038. [DOI] [PubMed] [Google Scholar]
- 15.Transfiguracion J., Bernier A., Arcand N., Chahal P., Kamen A. Validation of a high-performance liquid chromatographic assay for the quantification of adenovirus type 5 particles. J. Chromatogr. B Biomed. Sci. Appl. 2001;761:187–194. doi: 10.1016/s0378-4347(01)00330-9. [DOI] [PubMed] [Google Scholar]
- 16.Klyushnichenko V., Bernier A., Kamen A., Harmsen E. Improved high-performance liquid chromatographic method in the analysis of adenovirus particles. J. Chromatogr. B Biomed. Sci. Appl. 2001;755:27–36. doi: 10.1016/s0378-4347(00)00597-1. [DOI] [PubMed] [Google Scholar]
- 17.Kapteyn J.C., Porre A.M., de Rond E.J., Hessels W.B., Tijms M.A., Kessen H., Slotboom A.M., Oerlemans M.A., Smit D., van der Linden J. HPLC-based quantification of haemagglutinin in the production of egg- and MDCK cell-derived influenza virus seasonal and pandemic vaccines. Vaccine. 2009;27:1468–1477. doi: 10.1016/j.vaccine.2008.11.113. [DOI] [PubMed] [Google Scholar]
- 18.Debelak D., Fisher J., Iuliano S., Sesholtz D., Sloane D.L., Atkinson E.M. Cation-exchange high-performance liquid chromatography of recombinant adeno-associated virus type 2. J. Chromatogr. B Biomed. Sci. Appl. 2000;740:195–202. doi: 10.1016/s0378-4347(00)00100-6. [DOI] [PubMed] [Google Scholar]
- 19.Manceur A.P., Kim H., Misic V., Andreev N., Dorion-Thibaudeau J., Lanthier S., Bernier A., Tremblay S., Gélinas A.M., Broussau S. Scalable Lentiviral Vector Production Using Stable HEK293SF Producer Cell Lines. Hum. Gene Ther. Methods. 2017;28:330–339. doi: 10.1089/hgtb.2017.086. [DOI] [PMC free article] [PubMed] [Google Scholar]
- 20.Gluschankof P., Mondor I., Gelderblom H.R., Sattentau Q.J. Cell membrane vesicles are a major contaminant of gradient-enriched human immunodeficiency virus type-1 preparations. Virology. 1997;230:125–133. doi: 10.1006/viro.1997.8453. [DOI] [PubMed] [Google Scholar]
- 21.Ellwanger J.H., Veit T.D., Chies J.A.B. Exosomes in HIV infection: a review and critical look. Infect. Genet. Evol. 2017;53:146–154. doi: 10.1016/j.meegid.2017.05.021. [DOI] [PubMed] [Google Scholar]
- 22.Bess J.W., Jr., Gorelick R.J., Bosche W.J., Henderson L.E., Arthur L.O. Microvesicles are a source of contaminating cellular proteins found in purified HIV-1 preparations. Virology. 1997;230:134–144. doi: 10.1006/viro.1997.8499. [DOI] [PubMed] [Google Scholar]
- 23.Cantin R., Diou J., Bélanger D., Tremblay A.M., Gilbert C. Discrimination between exosomes and HIV-1: purification of both vesicles from cell-free supernatants. J. Immunol. Methods. 2008;338:21–30. doi: 10.1016/j.jim.2008.07.007. [DOI] [PubMed] [Google Scholar]
- 24.Porterfield J.Z., Zlotnick A. A simple and general method for determining the protein and nucleic acid content of viruses by UV absorbance. Virology. 2010;407:281–288. doi: 10.1016/j.virol.2010.08.015. [DOI] [PMC free article] [PubMed] [Google Scholar]
- 25.McCarron A., Donnelley M., McIntyre C., Parsons D. Challenges of up-scaling lentivirus production and processing. J. Biotechnol. 2016;240(Suppl C):23–30. doi: 10.1016/j.jbiotec.2016.10.016. [DOI] [PubMed] [Google Scholar]
- 26.Alain R., Nadon F., Séguin C., Payment P., Trudel M. Rapid virus subunit visualization by direct sedimentation of samples on electron microscope grids. J. Virol. Methods. 1987;16:209–216. doi: 10.1016/0166-0934(87)90005-x. [DOI] [PubMed] [Google Scholar]
- 27.Zufferey R., Donello J.E., Trono D., Hope T.J. Woodchuck hepatitis virus posttranscriptional regulatory element enhances expression of transgenes delivered by retroviral vectors. J. Virol. 1999;73:2886–2892. doi: 10.1128/jvi.73.4.2886-2892.1999. [DOI] [PMC free article] [PubMed] [Google Scholar]
Associated Data
This section collects any data citations, data availability statements, or supplementary materials included in this article.