

Abstract
Epstein-Barr virus (EBV) is a latent and oncogenic human herpesvirus. Lytic viral protein expression plays an important role in EBV-associated malignancies. The EBV envelope glycoprotein 350 (gp350) is expressed abundantly during EBV lytic reactivation and sporadically on the surface of latently infected cells. Here we tested T cells expressing gp350-specific chimeric antigen receptors (CARs) containing scFvs derived from two novel gp350-binding, highly neutralizing monoclonal antibodies. The scFvs were fused to CD28/CD3ζ signaling domains in a retroviral vector. The produced gp350CAR-T cells specifically recognized and killed gp350+ 293T cells in vitro. The best-performing 7A1-gp350CAR-T cells were cytotoxic against the EBV+ B95-8 cell line, showing selectivity against gp350+ cells. Fully humanized Nod.Rag.Gamma mice transplanted with cord blood CD34+ cells and infected with the EBV/M81/fLuc lytic strain were monitored dynamically for viral spread. Infected mice recapitulated EBV-induced lymphoproliferation, tumor development, and systemic inflammation. We tested adoptive transfer of autologous CD8+gp350CAR-T cells administered protectively or therapeutically. After gp350CAR-T cell therapy, 75% of mice controlled or reduced EBV spread and showed lower frequencies of EBER+ B cell malignant lymphoproliferation, lack of tumor development, and reduced inflammation. In summary, CD8+gp350CAR-T cells showed proof-of-concept preclinical efficacy against impending EBV+ lymphoproliferation and lymphomagenesis.
Keywords: CAR-T cells, EBV, lymphoma, transplantation, PTLD, humanized mice, gp350, lymphoproliferation, lytic infection, adoptive T cell therapy
Graphical Abstract
EBV is an oncogenic virus, and lytic infection has been shown to promote malignancies. Slabik et al. showed that CAR-T cells targeting the gp350 envelope protein can react against EBV-infected cells. Humanized mice infected with EBV and treated with gp350CAR-T cells controlled EBV spread and EBV+ lymphoproliferative disease.
Introduction
Epstein-Barr virus (EBV) is an almost ubiquitous herpes virus and a relevant pathogen in humans.1,2 Primary infection, mostly asymptomatic, usually occurs during early childhood and pre-adolescence.3 After primary infection, hosts become latently infected. EBV lytic reactivation can be controlled, but the virus is not cleared, so infection and sporadic reactivation can persist for life.4 Latency is the preferred lifestyle of EBV, but expression of a single viral gene, BamHI Z fragment leftward open reading frame 1 (BZLF1), can lead to a lytic cascade of gene expression regulation, including epigenetic changes resulting in viral genome replication and late gene expression.4,5 Primary infection during adolescence and later in life can lead to infectious mononucleosis (IM) with inflammatory symptoms and CD8+ T cell inflation or over-activity that can persist for a long time.4 It has also been shown that IM elevates the risks of Hodgkin lymphoma and multiple sclerosis.3 In a setting of impaired T cell surveillance or immunosuppression, EBV reactivation can result in fatal lymphoproliferative disease (LPD) and predispose to lymphomagenesis.1,2 EBV-related post-transplant LPD (PTLD) in the setting of hematopoietic stem cell transplantation (HCT) or solid organ transplantation (SOT) is a severe complication. B cell depletion is the standard of care, with an approximately 60% success rate.2 Monoclonal PTLD can form a disseminated malignant lymphoma. Other EBV+ hematological neoplasias include Burkitt’s lymphoma, Hodgkin’s disease, and diffuse large B cell lymphoma (DLBCL).2,6, 7, 8 Additionally, when epithelial cells are involved, EBV is associated with the etiology of nasopharyngeal and gastric cancer.9,10
Virus-specific T (VST) cell therapies using autologous or allogenic T cells reactive against EBV have shown efficacy in clinical trials.11,12 VST cells rely on pre-existing antiviral memory T cells with functional T cell receptors (TCRs). They can be expanded in vitro with EBV antigenic epitopes presented in the context of human leukocyte antigens (HLAs). Several antigens associated with viral latency have been explored for generation of EBV VST cells, such as Epstein-Barr nuclear antigen 1 (EBNA-1), latent membrane protein 1 (LMP-1), and LMP-2.11,12 Despite some clinical success12, use of VST cells against EBV+ PTLD and EBV+ malignancies suffers from practical limitations: (1) EBV’s mechanism of immune escape downregulates expression of HLA on EBV-infected cells, (2) pre-existing memory T cell populations are required, and (3) matching HLA class I and II in the allogeneic setting between donor and recipient is complex.
The most abundant viral envelope glycoprotein, gp350, classified as a late lytic protein, binds to the cellular receptor CD21, initiating B cell infection.13 gp350 can be detected on the surface of cells during EBV reactivation, and its expression is sporadically observed in several EBV-associated malignancies.7,14,15 It has been reported that gp350 expression can be detected in EBV+ nasopharyngeal carcinoma cell lines,16 primary EBV+ carcinoma samples from patients,17 and tissues obtained from humanized non-obese diabetic (NOD).Cg-Prkdcscid Il2rgtm1Wjl/SzJ (NSG) mice after EBV/M81 infection.18 gp350 is relatively conserved among EBV subtypes and is a major viral target for neutralizing antibodies; therefore, it has been explored extensively as an antigen for vaccine development.19 Major histocompatibility complex (MHC) class II-restricted CD4+ T helper (Th) responses against immunodominant gp350 epitopes have been documented, and gp350-reactive cytotoxic CD4+ Th cells recognize and kill HLA-matched lymphoblastoid cell lines (LCLs).20 However, expansion and testing of gp350-specific CD8+ cytotoxic T lymphocyte (CTLs) for use as VST cells has not been described.
T cells expressing a chimeric antigen receptor (CAR) can bypass several limitations of VST cells and have emerged as a promising therapeutic option against cancer. CARs rely on target-specific single-chain variable fragments (scFvs) fused to domains that enable potent T cell signaling for activation, proliferation, and target cytotoxicity. CAR-T cells combine the ability of antibody-based recognition of target molecules with the strong cytolytic potency of T cells but without HLA restrictions or the requirement for memory T cells.21 CAR-T cell therapies have shown therapeutic benefits against hematologic malignancies that are refractory to combination chemoimmunotherapy or antibody-based immunotherapies.22 Exceptional results have been reported in clinical studies using CD19CAR-T cells redirected against B cell malignancies with high rates of complete or partial response rates in chemorefractory patients.23,24 Beyond the oncology field, CAR-T cells redirected against viral antigens expressed on the surface of infected cells are in development; for example, against human cytomegalovirus (HCMV), human immunodeficiency virus (HIV), and hepatitis C virus (HCV).25, 26, 27, 28, 29
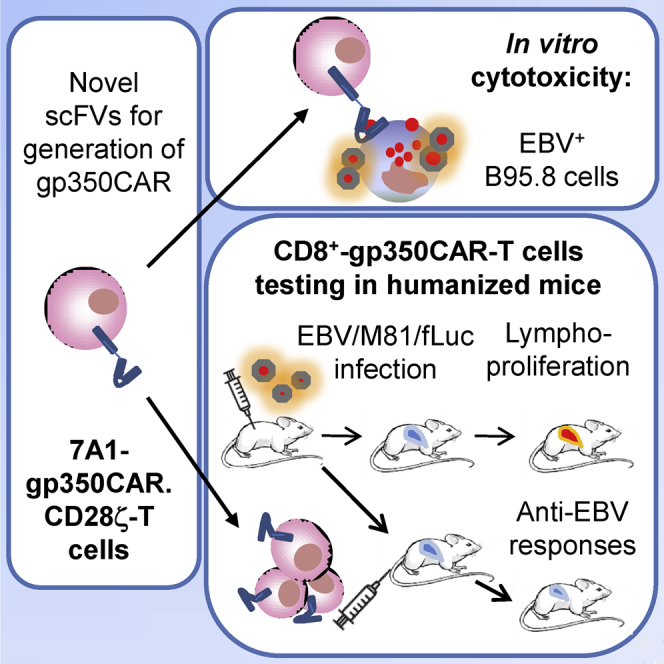
To generate EBV-specific gp350-targeted CARs, we relied on scFvs derived from two novel gp350-binding, highly neutralizing monoclonal antibodies (mAbs) (7A1 and 6G4). In this study, we show that these scFvs fused to a second-generation CAR backbone containing CD28 and CD3ζ as signaling domains are efficiently expressed on the surface of transduced T cells. These gp350CAR-T cells display gp350-specific activation and cytotoxic effects in vitro. 7A1-gp350CAR-T cells recognized and killed B95-8 EBV+ cells in vitro, with the remaining targets showing lower levels of gp350. Furthermore, using the preferentially lytic recombinant EBV M81/fLuc strain, we established a cord blood (CB)-based, fully humanized mouse model to non-invasively monitor EBV spread in vivo and evaluate the effects of CAR-T cells. CD8+ 7A1-gp350CAR-T cells generated with the same CB units used for mouse humanizations were evaluated in protective and therapeutic experiments. A 75% response rate against EBV spread was observed after CD8+ 7A1-gp350CAR-T cell therapy, which was correlated with lower impending LPD, tumor development, and systemic inflammation. This novel adoptive CAR-T cell immunotherapy is a promising EBV-specific strategy for management and treatment of IM, PTLD, LPD, and EBV-associated hematologic and epithelial malignancies.
Results
Novel Neutralizing mAbs Used for Flow Cytometry Detect gp350 Expression on the Surface of B Cell Lines Latently Infected with EBV
A mouse mAb raised against gp350 and derived from the hybridoma cell line 72A1 was produced in 1980, and in the past decades it has been shown to neutralize EBV infection of B cells in vitro, prevent development of EBV-positive tumors in xenograft mouse models, and provide some passive immunization effects in patients.30,31 Recently, we generated two novel rat-derived, highly neutralizing anti-gp350 mAbs, 7A1 and 6G4, showing higher in vitro neutralizing activity than 72A1 (Figure S1A). Therefore, we used fluorescence-activated cell sorting (FACS) analyses to compare whether 72A1, 7A1, and 6G4 mAbs could similarly detect gp350 expression on the surface of B cell lines latently infected with EBV. We analyzed the B95-8 cell line (derived from a cotton-top tamarin monkey infected with EBV-1), the Jijoye cell line (representing human lymphoma infected with EBV-2), the BL-60 cell line (representing Burkitt’s lymphoma), and two LCLs (derived from adult-donor B cells infected with EBV/M81) (see gating strategy in Figure S1B). We could detect higher frequencies of gp350+ cells with the 7A1 and 6G4 mAbs than with the 72A1 mAb (in the range of 1.5- to 7-fold higher sensitivity) (Figure 1A). These results indicate that the epitopes recognized by the 7A1 and 6G4 mAbs are highly conserved because these cells lines are infected with different EBV strains. Hence, these findings opened the perspective of exploring the variable sequences of these novel mAbs to develop CAR-T cells targeting gp350+ EBV+ malignancies.
Figure 1.

Design and Specificity of CAR-T Cells Targeting gp350
(A) EBV+ immortalized monkey cells (B95-8) and human cells (Jijoye, BL-60, LCL/M81fLuc-11, and LCL/M81fLuc-C) contain gp350+ cell subpopulations. FACS detection of gp350 was performed with primary monoclonal antibodies (mAbs) using as a reference the 72A1-positive control antibody specific for gp350 or the novel 6G4 and 7A1 mAbs followed by a second fluorochrome-labeled mAb. As negative controls for analyses, only the second mAbs were used for staining. The numbers represent the percentages of gp350+ cells. (B) Schematic representation of the chimeric antigen receptors (CARs) containing the IgHL signal peptide, scFv sequences (SM5-1 targeting HCMV/gB and 6G4 or 7A1 targeting EBV/gp350), the IgG4 hinge, the IgG1 Fc CH3 spacer, the CD28 transmembrane and endocytoplasmic domains, and CD3 zeta signaling domains. The DNA sequences encoding the scFvs were inserted between the Pml1 and BamHI restriction sites. (C) Representative examples of CD4+ and CD8+ T cells transduced with the retroviral vector and analyzed for CAR detection by flow cytometry. (D) Mean fluorescence intensity (MFI) calculated for different CAR-T cells using mock T cells as a negative control reference: gBCAR (n = 6, gray), 6G4-gp350CAR (n = 7, blue), or 7A1-gp350CAR (n = 7, red). PBMCs from 3 different donors were used for CAR-T cell production. **p≤0.01, ***p≤0.001. (E) Detection of 7A1-gp350CAR expression on CD4+- and CD8+-CAR-T cells generated with 5 different CB units. (F) Flow cytometry analyses of a 293T clonal cell line stably expressing gp350 stained with the primary 7A1 mAb (red) and with the second antibody (the gray histogram shows control staining with the second antibody only). (G) 293T/gp350 cells were cultured with CAR-T cells (gB, gray; 6G4-gp350, blue; 7A1-gp350, red) for 24 h at effector:target (E:T) ratios of 1:1 or 3:1. Left panel: concentrations of secreted IFN-γ (ng/mL) measured in the cell supernatants (n = 3). ∗∗p ≤ 0.01, ∗∗∗p ≤ 0.001. Center panel: percentages of viable 293T/gp350 cells analyzed by flow cytometry for one experiment. Right panel: percentages of viable gp350+ 293T/gp350 cells analyzed by flow cytometry for one experiment. (H) Control co-culture of 293T/WT cells with CAR-T cells. Left panel: no detectable secreted IFN-γ. Right panel: no cell killing. A summary of the descriptive statistical analyses is shown in Table S1.
Generation and Specificity Testing of gp350-Specific CAR-T Cells
The sequences of the variable heavy (VH) and variable light (VL) domains of the 7A1 and 6G4 mAbs were used to design scFv sequences. Initially, two different types of linkers interspacing the VH and VL domains were tested. The encoding DNAs were inserted into a retroviral vector backbone carrying an immunoglobulin HL (IgHL) signal peptide, an IgG4 hinge, an IgG1 Fc CH3 spacer, a CD28 transmembrane and endo-cytoplasmic domains, and a CD3 zeta signaling domain (Figure 1B). The vector backbone DNA plasmids were kindly provided by the Brenner laboratory (Baylor College of Medicine, Houston) and were used to transfect 293T cells. Expression of 7A1-gp350CAR after DNA transfection was higher than of 6G4-gp350CAR. In addition, constructs incorporating the first linker design showed quite superior expression of both CARs (Figure S2A). Therefore, the constructs incorporating the 7A1 and 6G4 scFvs and the linker type 1 were used for production of retroviral particles by transient transfection of 293T cells. T cells obtained from adult peripheral blood mononuclear cells (PBMCs) were transduced with the packaged retroviral vectors. Expression of gp350CARs on T cells was compared with gBCAR, recognizing the glycoprotein gB of HCMV and generated with the same vector backbone and signaling domains.29 The mean fluorescence intensities of the different CAR+ T cells were calculated (see flow cytometry gating strategy in Figures S2B and S2C). The reference gBCAR showed significantly higher expression on the surface of CD4+ and CD8+ T cells than 7A1-gp350CAR (p ≤ 0.01) and 6G4-gp350CAR (p ≤ 0.001) (Figures 1C and 1D; Table S1). 7A1-gp350CAR was significantly higher expressed on CD4+ and CD8+ T cells in comparison with 6G4-gp350CAR (p ≤ 0.001) (Figures 1C and 1D; Table S1). 7A1-gp350CAR-T cells could be also effectively produced with CB mononuclear cells (CBMCs), showing a non-significant trend for higher frequencies of CAR+CD8+ compared with CAR+CD4+ T cells (Figure 1E; Table S1). We established a clonal cell line stably expressing gp350 (83% positive), 293T/gp350, for conducting the initial in vitro CAR-T cell experiments to assess their specificity against the target (Figure 1F). These tests were performed as triplicate experiments. Although the overall expression of 7A1-gp350CAR was higher than that of 6G4-gp350CAR, whole T cells were used in the assays to avoid any putative T cell selection bias (see representative data in Figure S3A). The effector (E) CAR-T cells were incubated with the target (T) cells (293T/gp350 cells or 293T wild type [WT]) at effector:target (E:T) ratios of 1:1 and 3:1 for 24–48 h. A flow cytometry strategy was designed to quantify the cytotoxic effects of CD45+CAR-T cells against the CD45−293T target cells (see gating strategy in Figure S3B). Cell supernatants were collected after 24 and 48 h for interferon γ (IFN-γ) secretion analyses. Co-cultures with gBCAR-T control cells showed baseline levels of IFN-γ, whereas significantly higher levels of IFN-γ production were seen for both types of gp350CAR-T cells (Figure 1G; Figure S4A; Table S1). 7A1-gp350CAR-T cells secreted significantly higher levels of IFN-γ in comparison with 6G4-gp350CAR-T cells (E:T 1:1, p ≤ 0.01; E:T 3:1, p ≤ 0.001) (Figure 1G; Figure S4A; Table S1). IFN-γ was not detectable for CAR-T cells co-cultured with 293T WT cells, showing no alloreactive effects (Figure 1H; Figure S4B). The cells were collected after co-culture for flow cytometry quantification of the remaining viable target cells (see gating strategy in Figure S3; Figures 1G and 1H; Figures S4A and S4B). For 24 h co-culture at an E:T ratio of 3:1, only 68% and 48% of target cells remained viable after exposure to 6G4- and 7A1-gp350CAR-T cells, respectively, whereas cells exposed to gBCAR-T cells were not affected (Figure 1G). Restricting the survival analyses to the remaining viable gp350+ target cells showed that 56% and 34% of target cells remained viable after exposure to 6G4- and 7A1-gp350CAR-T cells, respectively (Figure 1G; data for 48-h co-culture are shown in Figure S4A). In conclusion, both types of gp350CAR-T cells specifically recognized gp350. 7A1-gp350CAR-T cells were selected for further studies because they showed higher CAR expression and higher reactivity against 293T/gp350 target cells than 6G4-gp350CAR-T cells.
Reactivity of 7A1-gp350CAR-T Cells against gp350+EBV-Infected B95-8 Cells
To evaluate the reactivity of 7A1-gp350CAR-T cells against gp350+ EBV-infected cells, the EBV+B95-8 cell line was used as a target. Co-culture experiments were performed for 38–86 h (Figure 2A). Cultures of B95-8 cells with no T cells or co-cultures with gBCAR-T cells were used as reference controls. After 38 h of co-culture, gp350CAR-T cells secreted significantly more IFN-γ than gBCAR-T cells for all E:T ratios (p ≤ 0.05 to p ≤ 0.001) (Figure 2B; Table S2). T cell proliferation and cytotoxicity were differentially quantified by flow cytometry analyses (see flow cytometry gating strategy in Figures S5A and S5B). CD4+ (Figure 2C) and CD8+ gp350CAR-T cells (Figure 2D) showed a trend of higher proliferation than gBCAR-T cells. For 86-h co-cultures, more than 60% of CD4+ and CD8+ gp350CAR-T cells proliferated. At an E:T ratio of 0.1:1, proliferation of gp350CAR-T cells was significantly higher than that of gBCAR-T cells (p ≤ 0.05) (Figures 2C and 2D; Table S2). For analyses of the remaining viable target cells after co-cultures, a viability dye was employed for flow cytometry analyses to exclude dead cells (see flow cytometry gating strategy in Figure S5A; Figures 2E and 2F). At an E:T ratio of 10:1 and 38-h co-culture, more than 95% of the total B95-8 targets remained viable, whereas viability dropped to 87% for co-cultures with gp350CAR-T cells (Figure 2E). At an E:T ratio of 10:1, when only gp350+ B95-8 cells were included in the analyses, about 25% of the target cells exposed to gp350CAR-T cells remained viable compared with 100% viability for co-culture with gBCAR-T cells (Figure 2F). Therefore, 7A1-gp350CAR-T cells demonstrated specific reactivity and selective killing of gp350+EBV+ cells in vitro.
Figure 2.

7A1-gp350CAR-T Cells Recognize and Kill gp350+ B95-8 Cells Latently Infected with EBV
(A) Experimental scheme. CAR-T cells were co-cultured with B95-8 target cells at 0.1:1, 1:1, and 10:1 E:T ratios for 38–86 h. Analyses were performed to follow activation and proliferation of CAR-T cells (IFN-γ ELISA and FACS) and to assess the effects on viability of target cells (FACS). (B) IFN-ɣ detection in cell supernatants after 38 h, showing that, after co-culture, 7A1-gp350CAR-T cells produced significantly higher levels of IFN-γ than control gBCAR-T cells. ∗p ≤ 0.05, ∗∗p ≤ 0.01, ∗∗∗p ≤ 0.001 (n = 9). (C and D) Analyses of CD4+ (C) or CD8+ (D) CAR-T cells by flow cytometry to evaluate proliferation after 38 or 86 h of co-culture. The graphs show the percentages of proliferated viable lymphocytes showing loss of the CellTrace dye (n = 3). Higher 7A1-gp350CAR-T cell proliferation of was observed after 86 h of co-culture. ∗p ≤ 0.05. (E) Left: representative examples showing the remaining viable B95-8 cells (negative for the viability dye) after 38 h of co-culture with gBCAR-T (center panel) or with gp350CAR-T cells (bottom panel). B95-8 cells with no T cells are shown as a control (top panel) Right: quantified remaining viable B95-8 cells showing cytotoxic effects for co-culture at a 10:1 E:T ratio (n = 3). Cultures with no T cells were used as references. (F) Left: representative examples showing the remaining viable gp350+B95-8 cells (negative for the viability dye) after 38 h of co-cultures with gBCAR-T (center panel) or with gp350CAR-T cells (bottom panel). B95-8 cells with no T cells are shown as a control (top panel). Right: quantified remaining viable gp350+B95-8 cells showing cytotoxic effects for co- culture at a 10:1 E:T ratio (n = 3). ∗p ≤ 0.05 (n = 3). A summary of the descriptive statistical analyses is shown in Table S2.
Development of a Fully Humanized NRG Mouse Model of EBV-M81/fLuc Infection and Pilot Testing of Syngeneic 7A1-gp350CAR-T Cells Administered Prophylactically
We have shown previously that fully humanized NRG mice transplanted with human CB CD34+ hematopoietic stem cells and infected with the preferentially latent recombinant EBV/B95-8 strain recapitulated EBV+ LPD, and approximately one-third of the animals progressed to a pathology recapitulating DLBCL.32 EBV latency and lytic cycles have been associated with development of aggressive EBV+ DLBCL.33 Similar observations were obtained from studies of humanized mice infected with EBV recombinant strains, showing that EBV pathogenesis resembling EBV+ LPD requires early lytic viral protein expression to accelerate development toward an EBV+ DLBCL phenotype.18,34 Tsai et al.17 showed high frequencies of gp350+ cells by immunohistochemistry analyses of mesenteric lymph nodes of humanized mice infected with M81. Therefore, for the current studies, we used the more infectious and preferentially lytic EBV/M81 strain for infection of humanized mice.18 The Delecluse laboratory (German Cancer Center, University of Heidelberg) kindly provided a recombinant EBV/M81 strain expressing firefly luciferase (fLuc) for our studies, allowing sensitive non-invasive monitoring of EBV infection and bio-distribution by bioluminescence imaging (BLI) analyses.35 Because EBV infection causes profound immune dysregulation of CD4+ and CD8+ T cells in fully humanized mice, the initial goal of the model was to evaluate the protective effects of adoptive 7A1-gp350CAR-T cells prior to EBV/M81 infection. The CAR-T cells were autologous to the CB CD34+ stem cells used to humanize the mice to avoid alloreactivity. We processed the CB for CD34+ cell isolation and then cryopreserved the CD34pos fraction for HCT and the CD34neg fraction for CAR-T cell production. 15 weeks after HCT, after confirmation of long-term human reconstitution in mice, the CD34neg fraction was thawed, and donor-matched CAR-T cells were generated (Figure 3A). After retroviral transduction and a short expansion, approximately 36% of CD4+ and 42% of CD8+ T cells were CAR+. Furthermore, to reduce putative xenograft versus host disease (xeno-GVHD) caused by activation of human TCRs by the mouse MHC, only the CAR+ T cell fraction was used. CAR+ T cells were selected by sorting and re-expanded, resulting in highly pure and viable CD4+ CAR+ (83%) and CD8+ CAR+ (88%) T cells (Figure 3B). To test whether CD4+ CAR+ T- cells were required, sorted CD8+ CAR+ T cells were administered alone or in combination with CD4+ CAR+ T cells 1 day prior to EBV infection, keeping in mind that EBV infection is associated with inflammatory expansion of CD8+ T cells, resulting in decreased levels of CD4+ T cells.32 Further, to avoid xeno-GVHD with non-specific human T cells, as a control, only phosphate-buffered saline (PBS) was administered to mice a day prior to EBV challenge. Two of three infection controls showed high progressive EBV spread from the spleen to the rest of the body until 5 weeks post infection (wpi), whereas for one mouse, the infection was very low and mostly restricted to the spleen (Figures 3C and 3D). On the contrary, mice administered with a 1:1 mixture of CD8+ and CD4+ 7A1-gp350CAR-T cells (n = 4) 1 day before infection showed a significantly slower pace of EBV progression compared with the control group (p ≤ 0.05) (Figure 3D; Table S3). Administration of only CD8+7A1-gp350CAR-T cells (n = 3) prior to infection showed slower progression of EBV spread compared with the control cohort (p ≤ 0.05) (Figure 3D; Table S3). For the single measurements at the terminal analyses at 5 wpi, the BLI signals were not significantly different among the cohorts (Figure 3D).
Figure 3.

Protective Effects of gp350CAR-T Cells Administered to Humanized Mice before EBV Infection
(A) Experimental scheme. Nod.Rag.Gamma (NRG) mice were transplanted with cord blood (CB) CD34pos hematopoietic stem cells and, 17 weeks later, infected with EBV-M81/fLuc (106 GRUs, intravenously [i.v.]). The CD34neg fraction obtained from the same CB donor was used for production of CAR-T cells. The sorted CAR-T cells were expanded in culture until administration 1 day prior to EBV infection. For this protective study, the control cohort received PBS i.v. (control [CTR], n = 3, gray), one cohort received 2 × 10⁶ CD4+CD8+gp350-CAR-T cells i.v. (n = 4, blue), and one cohort received 2 × 10⁶ CD8+gp350CAR-T cells i.v. (n = 3, red). Sequential bioluminescence imaging (BLI) analyses, weight measurements, and peripheral blood (PB) collection were performed 2, 3, 4, and 5 weeks post infection (wpi). (B) Flow cytometry dot plot graphs showing CD4+ and CD8+ gp350CAR+-T cells analyzed before (top panels) and after (bottom panels) sorting for fractionation into CD4+CAR+- or CD8+CAR+-enriched T cells. Enriched and expanded gp350CAR-T cells were highly viable. (C) Sequential BLI analyses, showing pictures of the left body of individual mice, performed 2, 3, 4, and 5 wpi. Signal intensity was measured with the same settings for all mice and depicted in logarithmic scale as log (flux) (photons/second [p/s]; see the color-coded bar). The region of interest (ROI) for BLI quantification was set for whole left body views. (D) Left graph: sequential BLI for the left body for each cohort. ∗p ≤ 0.05, calculated by longitudinal ANCOVA. Right: final BLI at 5 wpi, showing values for individual mice. (E) Left graph: longitudinal weight monitoring from baseline prior to infection until 5 wpi. Mice administered CD4+CD8+gp350CAR-T cells showed significant weight losses compared with the other cohorts. ∗∗∗p ≤ 0.001, calculated by longitudinal ANCOVA. Right: final BLI at 5 wpi, showing values for individual mice. ∗p ≤ 0.05. (F) In situ hybridization for EBER detection performed with the spleen. The graph shows the number of EBER+ cells per mm2 of spleen. (G and H) Quantification of EBV viral load in DNA isolated from the spleen (G) and bone marrow (H) analyzed by qRT-PCR (shown as international units, IU/μg DNA). A summary of the descriptive statistical analyses is shown in Table S3.
To access possible adverse immune-related effects (AIREs) because of CAR-T cell administration in this EBV infection model, we monitored weight, a very important indicator of the health and immunological status of mice and humans.36 Changes in weight after CAR-T cell administration and EBV infection were plotted relatively to the baseline, the actual day of infection (Figure 3E). Interestingly, control mice infected with EBV showed a temporary weight increase along EBV progression. We speculate that this may be associated with inflammatory CD8+ expansion because recent observations have linked CD8+ T cell and IFN-γ responses with metabolic changes and obesity.36 Mice administered CD8+ gp350CAR-T cells showed an even higher weight gain (8% at 5 wpi relative to baseline). On the contrary, mice administered CD4+CD8+ gp350CAR-T cells showed 5% weight loss at 5 wpi (5% at 5 wpi relative to baseline). The relative body weights were significantly different between the two CAR-T cell treatments (p ≤ 0.05) (Figure 3E; Table S3).
At 5 wpi, mice were sacrificed, and blood, spleen, and bone marrow specimens were collected. Analyses of EBV infection by in situ hybridization for analyses of EBV-encoded small RNA 1 (EBER-1) using spleen specimens were performed. On average, a 100-fold and a 10-fold reduction in the numbers of EBER+ cells were observed for mice pre-treated with CD4+CD8+gp350CAR-T and CD8+7A1-gp350CAR-T cells compared with controls, respectively (Figure 3F; the differences were not significant; Table S3). Quantitative polymerase chain reaction (qPCR) analyses to measure the EBV load in the spleen and bone marrow were performed. We observed a lower infection trend for the cohort receiving CD4+CD8+ gp350CAR-T cells compared with the other cohorts (Figures 3G and 3H; Table S3). Therefore, the CD4+CD8+gp350CAR-T cell mixture seemed to be superior to CD8+ gp350CAR-T cell alone to lessen EBV spread. However, CD4+gp350CAR-T cells promoted weight loss, which was a concern regarding the well-being of the mice used in further experiments.
Immune Monitoring after Prophylactic 7A1-gp350CAR-T Cell Administration
A flow cytometry-based immune monitoring panel was used to follow the overall dynamics of human lymphocytes in humanized mice after CAR-T cell administration and EBV infection (see gating strategy in Figure 4A). All humanized mice maintained human hematopoietic cells in the blood until 5 wpi (between 3%–25% human (hu) CD45+) (Figure 4B; Table S4). Administration of gp350CAR-T cells was correlated with a transitory increase in the relative frequencies of CD45+CD8+ T cells (Figure 4C; the CTR cohort showed a linear model, and CAR-T cell cohorts showed quadratic models; Table S4). Administration of gp350CAR-T cells was correlated with an expansion of CD45+CD4+ T cells (Figure 4D; the CTR cohort showed a linear model, and the CAR-T cell cohorts showed a sigmoid model; Table S4). Analyses of the total numbers of T cells in the spleen at 5 wpi showed that administration of gp350CAR-T cells was associated with lower infiltration of CD8+ and CD4+ T cells (Figures 4E and 4F; lower averages but not statistically significant; Table S4). Analyses of human cytokines in mouse plasma showed the highest inflammatory responses in the control group regarding the average levels of human IFN-γ and interleukin-10 (IL-10), IL-12, IL-6, IL-8, and monocyte chemoattractant protein 1 (MCP-1) (Figure 4G). For both cohorts administered gp350CAR-T cells, IFN-γ and IL-10 were also detectable in most mice, but with a lower trend than controls (Figure 4G; Table S4).The levels of granulocyte macrophage colony-stimulating factor (GM-CSF), IFN-α2, IL-2, and tumor necrosis factor alpha (TNF-α) were uniform among the three cohorts (Figure S6A). CAR+ lymphocytes were not detectable in the blood and spleen above background levels by flow cytometry and PCR analyses (data not shown). In summary, prophylactic administration of gp350CAR-T cells lowers virus-induced inflammation in the blood, spleen, and plasma.
Figure 4.

Immune Monitoring Analyses to Assess the Effects of gp350CAR-T Cells Administered prior to EBV Infection in Human T Lymphocytic Populations
(A) An exemplary gating strategy for the flow cytometry analyses of human lymphocyte subpopulations in the blood. Shown is gating of lymphocytes (side scatter [SSC] × forward scatter [FSC]), huCD45+, CD3+, CD8+, and CD4+ T cells. Calculations of the frequencies of CD8+ and CD4+ T cells within the sample were performed by back-gating to the huCD45 lymphocyte population. (B) Percentages of human CD45+ within total lymphocytes in PB for sequential time points. The cohort pre-treated with CD4+CD8+gp350-CAR-T cells is represented in blue, the cohort pre-treated with CD8+gp350CAR-T cells is represented in red, and non-treated CTRs receiving PBS are represented in gray. (C and D) Percentages of CD8+ T cells (C) and CD4+ T cells (D) within huCD45+ cells for sequential time points. The time point of CAR-T cell administration is indicated. (E and F) Terminal analyses at 5 wpi, showing the total numbers of CD8+ (E) and CD4+ (F) T cells in the spleen. (G) Concentration (picograms per milliliter) of human cytokines detected in the plasma of mice at 5 wpi: IFN-γ, IL-10, IL-12 (p70), IL-6, IL-8, and MCP-1. A summary of the descriptive statistical analyses is shown in Table S4.
Therapeutic Effects of CD8+ 7A1-gp350CAR-T Cell Adoptive Transfer against EBV Spread
Subsequently, the M81/fLuc infection model was used for therapeutic studies (Figure 5A; Figure S7; Table S5). We preferentially evaluated sole CD8+ CAR-T cells because, as shown above, their use did not result in weight loss. For the first pilot study, we compared gp350CAR-T cells (reacting specifically against the EBV-infected cells) with CD19CAR-T cells (which could potentially deplete normal and EBV-infected B cells) (Figure S7A). CD8+ 7A1-gp350CAR-T and CD8+ CD19CAR-T cells were generated with the CB CD34neg fraction (autologous to the CD34+ cells used for HCT), and after CD8+CAR+ sorting and short expansion, they showed high viability and purity (Figure 5B; Figure S7B). After infection of mice with EBV (time point 0 of the experiment), humanized mice were randomized at 3 wpi between non-treated and CAR-T cell treated cohorts. Mice were administered CD8+CD19CAR-T (n = 3) or CD8+7A1-gp350CAR-T cells (n = 7) at 3 and 5 wpi. Controls were injected with PBS (n = 6). One mouse administered CD8+CD19CAR-T cells succumbed at 5 wpi. For all other mice, no side effects were observed, and EBV spread was monitored by BLI analyses until 8 wpi (Figure S7C). For most mice, EBV infection was low from 3–4 wpi and mostly restricted to the anatomical region of the spleen. At 6 wpi, systemic EBV spread could be observed at different levels among the mice, but the bioluminescence signals showed no differences between the control and CAR-T cell-treated cohorts (Figure S7D; Table S5). At 8 wpi, a trend was observed, and the average bioluminescence signal was almost 10-fold higher for controls than for CAR-T cell-treated cohorts (Figure S7E; Table S5). Sequential analyses to monitor the frequencies of human CD8+ T cells within huCD45+ cells in blood showed a steeper CD8+ T cell expansion for controls, indicating a higher virus-induced inflation, than for CAR-T treated mice (Figure S7F). Because these pilot results indicated that gp350CAR-T cells promoted therapeutic antiviral effects comparable with CD19CAR-T cells, we subsequently expanded the control and CD8+gp350CAR-T cohorts using mice reconstituted with a second CB unit (CB2). The results of the duplicate experiments were homogeneous and were merged for statistical analyses (Figures 5C–5F; Table S5). At 7 wpi, one control mouse of the CB2 reconstitution succumbed, and post-mortem analyses showed development of tumors. From 6–8 wpi, subtle but homogeneous increases in bioluminescence signals were observed for the remaining 10 of 11 mice of the control cohort (Figures 5D and 5E; Table 1; Table S5). The mice were classified by outcome based on the BLI analyses: 4 of 10 showed increasing or progressive EBV spread, 4 of 10 showed stable levels of EBV spread, and 2 of 10 showered lower or controlled EBV (Figure 5E; see classification criteria based on BLI analyses in Table 1). None of the mice treated with gp350CAR-T cells died until 8 wpi. The BLI signals measured at 8 wpi were not significantly different between the gp350CAR-T cell-treated and control groups (Figure 5F; Table 1). Nonetheless, 75% of CAR-T cell-treated mice (9 of 12), called “responders,” showed significantly reduced BLI signals from 6–8 wpi (p = 0.007; Table 1) and at 8 wpi compared with controls (p = 0.005; Table 1; Figures 5E and 5F; see quantified optical imaging analyses for the frontal view in Figure S8A). On the other hand, 25% of CAR-T cell-treated mice, called “non-responders,” showed an opposite outcome to therapy; i.e., the BLI signal was significantly augmented at 8 wpi compared with the control cohort (p = 0.046; Table 1; Figures 5E and 5F; Figure S8B; Table 1). Because there was a noticeable divergence in outcome (i.e., the non-responders showed exacerbated EBV spread), for the subsequent analyses, we depicted the data as a whole “all” CAR-T cell-treated cohort and subgroups of responders and non-responders.
Figure 5.

CD8+gp350CAR-T Cells Administered Therapeutically to Humanized Mice after EBV Infection Lower Viral Spread in Most Mice
(A) Experimental scheme. NRG mice were transplanted with CB CD34+ hematopoietic stem cells and, 17 weeks later, infected with EBV-M81/fLuc (106 GRUs, i.v.). The CD34− fraction obtained from the same CB donors was used for production of CAR-T cells. The sorted CAR-T cells were expanded in culture until administration 3 and 5 wpi. For this therapeutic study, the CTR cohort received PBS i.v. (n = 11, gray), and the test group received 2 × 10⁶ CD8+gp350CAR-T cells i.v. (CAR, n = 12, black). Sequential BLI analyses, weight measurements, and PB collection were performed 3, 4, 6 and 8 wpi. (B) Flow cytometry dot plot graphs showing CD8+gp350CAR+-T cells analyzed before (top panel) and after (bottom panel) sorting for enrichment of CD8+CAR+ T cells. (C) Sequential BLI analyses, showing pictures of the left body of individual mice, performed 3, 4, 6, and 8 wpi. Mice transplanted with CD34pos derived from CB1 and CB2 are indicated. One mouse of the CTR group succumbed 7 wpi. Signal intensity was measured with the same settings for all mice and depicted in logarithmic scale as log (flux) (p/s; see color-coded bar). The ROI for BLI quantification was set for the whole left views. The BLI analyses showed, in the CAR group, 9 responders (R) with low BLI signals and 3 non-responder (NR) mice with high signals. (D) Quantified sequential BLI for the left body shown for each mouse of the CTR cohort (top graph) or CAR cohort (bottom graph). R and NR mice in the CAR cohort are indicated. (E) Detail of sequential BLI for each mouse from 6–8 wpi. R and NR mice are indicated. ∗∗∗p ≤ 0.001. (F) Quantification of the BLI intensity of the lateral left body view at endpoint analysis (log (flux] p/s) for CTR, CAR, CAR-T cell Rs, and CAR-T cell NRs. ∗p ≤ 0.05 and ∗∗p ≤ 0.01. (G and H) Quantification of EBV viral load in DNA isolated from the spleen (G) and bone marrow (H), analyzed by qRT-PCR (shown as IU/μg DNA). A summary of the descriptive statistical analyses is shown in Table S5.
Table 1.
Summary of the Descriptive Statistics Comparing Control (CTR) and CAR Therapy and Subdividing Responders (Rs) and Non-responders (NRs)
| Analysis Cohorts and Mouse Numerical IDs | BLI Analyses (Lateral View) |
EBER+ Spleens (%) | Cytokines (pg/mL) |
||||
|---|---|---|---|---|---|---|---|
| Week 6 | Week 8 | Fold Change Week 8 versus Week 6 | IFN-γ | IL-10 | |||
| CTR | 1 Stable Disease | 6.60E+05 | 6.15E+05 | 0.93 | 0.02 | N/A | N/A |
| 2 Response | 1.63E+06 | 5.60E+05 | 0.34 | 0.03 | 69.12 | 2.67 | |
| 3 Progressive Disease | 1.56E+06 | 3.49E+06 | 2.23 | 0.39 | 238.87 | 19.51 | |
| 4 Response | 2.97E+08 | 6.66E+06 | 0.02 | 0.80 | 52.77 | 18.25 | |
| 5 Stable Disease | 9.11E+06 | 8.72E+06 | 0.95 | 61.57 | 85.99 | 10.14 | |
| 6 Stable Disease; T | 1.98E+08 | 1.11E+08 | 0.56 | 0.37 | 450.88 | 118.17 | |
| 7 Stable Disease | 6.70E+06 | 5.46E+06 | 0.81 | 0.19 | 161.67 | 28.67 | |
| 8 Progressive Disease; T | 2.98E+05 | 1.16E+08 | 389.26 | 7.80 | 67.53 | 43.87 | |
| 9 Progressive Disease; T | 3.90E+07 | 1.47E+08 | 3.77 | 7.98 | 92.84 | 20.22 | |
| 10 Progressive Disease | 4.82E+05 | 3.80E+08 | 788.38 | 9.16 | 105.46 | 91.77 | |
| 11 death T | 6.91E+09 | N/A | N/A | 40.63 | N/A | N/A | |
| mean | 6.78E+08 | 7.79E+07 | 118.72 | 11.72 | 147.24 | 39.25 | |
| SD | 1.97E+09 | 1.14E+08 | 265.02 | 19.40 | 120.48 | 37.27 | |
| CAR R |
1 Stable Disease | 5.36E+05 | 3.84E+05 | 0.71 | 0.83 | 207.44 | 16.51 |
| 2 Response | 4.85E+05 | 2.45E+05 | 0.50 | 0.01 | 41.15 | 8.72 | |
| 3 Response | 5.52E+06 | 3.75E+05 | 0.07 | 0.05 | 49.89 | 35.24 | |
| 4 Response | 2.47E+07 | 3.21E+05 | 0.01 | 0.01 | 32.64 | 21.73 | |
| 5 Response | 6.24E+06 | 5.43E+05 | 0.09 | NA | 93.27 | 22.38 | |
| 6 Response | 7.54E+06 | 1.29E+06 | 0.17 | 0.14 | 79.91 | 10.06 | |
| 7 Response | 4.28E+07 | 5.44E+05 | 0.01 | 0.33 | 3.82 | 0.01 | |
| 8 Response | 3.27E+07 | 6.75E+05 | 0.02 | 1.04 | 69.91 | 21.34 | |
| 9 Response | 2.85E+07 | 1.12E+06 | 0.04 | 0.16 | 49.89 | 13.12 | |
| mean | 1.66E+07 | 6.11E+05 | 0.18 | 0.32 | 69.77 | 16.57 | |
| SD | 1.48E+07 | 3.44E+05 | 0.25 | 0.37 | 54.72 | 9.56 | |
| R (mean) versus CTR (mean) | 0.020 | 0.008 | 0.001 | 0.030 | 0.470 | 0.420 | |
| p value CTR versus CAR R | 0.738 | 0.005 | 0.007 | 0.026 | 0.188 | 0.247 | |
| CAR NR | 1 Progressive Disease | 3.47E+07 | 9.59E+07 | 2.76 | 1.48 | 162.73 | 39.44 |
| 2 Progressive Disease;T | 1.21E+05 | 1.52E+08 | 1256.20 | 1.74 | 3114.68 | 1309.19 | |
| 3 Progressive Disease; T | 4.38E+08 | 1.74E+09 | 3.97 | 1.18 | 1960.22 | 545.18 | |
| mean | 1.57E+08 | 6.61E+08 | 420.97 | 1.47 | 1745.88 | 631.27 | |
| SD | 1.99E+08 | 7.60E+08 | 723.32 | 0.23 | 1214.62 | 521.94 | |
| NR (mean) versus CTR (mean) | 0.230 | 8.490 | 3.550 | 0.103 | 11.860 | 16.080 | |
| p value CTR versus CAR NR | 0.965 | 0.046 | 0.376 | 0.257 | 0.188 | 0.247 | |
| All CAR (mean) versus CTR (mean) | 0.076 | 2.127 | 0.888 | 0.054 | 3.320 | 4.337 | |
| p value CTR versus all CAR | 0.831 | 0.15 | 0.145 | 0.10 | 0.84 | 0.78 | |
Definition for outcome classifications: fold change 0.5 or less; fold change 0.5–1.0; fold change 1.0 or higher; T, detection of macroscopic tumors.
Because EBV infection initiates in the spleen and then spreads to other organs, liver tissues were explanted from mice and directly analyzed by BLI. Non-responder mice showed a trend of higher bioluminescence in comparison with the other cohorts and could not control systemic EBV spread (Figures S8C and S8D; Table S5). Quantification of EBV genomic load by qPCR in the spleen and bone marrow showed lower infection trends for CAR-T responder mice compared with the control and non-responder cohorts (Figures 5G and 5H; Table S5). Together, these results indicate that the majority of gp350CAR-T cell-treated mice systemically controlled and lowered EBV spread. Still, about 25% of gp350CAR-T cell-treated mice showed exacerbation of EBV spread compared with controls.
Mice Responding to CD8+ 7A1-gp350CAR-T Cell Therapy Gain Weight, Lack Tumors, and Have Low Levels of EBV+ B Cell Lymphoproliferation
After showing that some responder mice treated with gp350CAR-T cells were capable of reducing EBV spread, additional analyses were undertaken to evaluate correlations between control of virus dissemination and morbidity or occurrence of malignancy development (Table S6). Longitudinal relative body weight monitoring showed that CAR-T-treated responder mice gained weight, whereas non-responder mice lost weight (Figure 6A). 4 of 11 control mice and 2 of 12 CAR-T cell-treated and non-responder mice developed macroscopically detectable tumors. No tumors were found in responder mice (Figure 6B; Table 1). Histopathological analyses were conducted to evaluate EBV+ lymphoproliferation and malignancy progression. In situ hybridization for detection of EBER in the spleen provided direct means to follow intracellular EBV infection at all latency stages: 0 (quiescent memory B cells), I (dividing memory B cell), II (germinal center), and III (clonal expansion). A trend of higher total numbers and frequencies of EBER+ cells were detectable in control mice compared with the whole-CAR-T cell-treated cohort, and significant differences were observed between control and responder mice (p ≤ 0.05) (Figures 6C and 6D; Table 1). To characterize EBV+ B cell neoplasms, EBER+ quantifications were then combined with additional immunohistochemistry analyses. Spleens of control mice showed EBER+ tumor masses intensively stained with Giemsa and predominantly containing CD30+Ki67+ proliferating B cells (Figure 6E; Figure S9A). Analyses of spleens from CAR-T responder mice showed EBER+ cells with dispersed distribution and frequently near vessels and, at the same time, low quantities of CD30+ cells (Figure 6E; Figure S9B). These results indicate that response to gp350CAR-T cell therapy leading to reduction of EBV lytic replication and spread is associated with control of tumor development.
Figure 6.

Response to CD8+gp350CAR-T Cell Therapy Is Associated with Weight Gain, Lower Tumor Development, and Lower EBER+ LPD
(A) Longitudinal weight monitoring from baseline prior to infection until 8 wpi. Mice responding to CD8+gp350CAR-T cell therapy showed the highest weight gain compared with the NR or CTR cohorts. (B) Stacked histogram representing the number of mice in each group with macroscopically detectable tumors (black) or with no detectable tumors (gray). Note that R mice showed no macroscopic tumors. (C and D) In situ hybridization for EBER detection performed with the spleen. The graph shows the number of EBER+ cells per mm2 of spleen (C) or the frequency of EBER+ cells in the analyzed field (D). The mean and SD for each group is shown. ∗p ≤ 0.05, ∗∗∗p ≤ 0.001. (E) Histopathological analyses of the spleen for a representative CTR mouse (top panels) and for a mouse responding to CD8+gp350CAR-T cell therapy (bottom panels). Giemsa staining: in both groups, perivascular spread of neoplastic cells is observed. Larger tumors were observed in CTR mice. EBER staining: EBV-infected cells are labeled in dark purple. CD20 and Ki67 staining: positive cells are labeled in brown. (F) Immunohistochemistry multiplex analysis was performed to detect CD3+ (green), CD20+ (purple), and Ki67+ (orange) cells. Exemplary analyses of the spleen of one CTR (top panel) and one CAR-T cell R mouse (bottom panel) are shown. (G) Quantitative results representing detectable double-positive CD20+Ki67+ cells (left graph) or CD3+Ki67+ (right graph) within the total cells analyzed for the spleen. These results indicate lower quantities of proliferating B and T cells in mice responding to gp350CAR-T cell therapy compared with CTR mice. A summary of the descriptive statistical analyses is shown in Table S6.
CD8+ 7A1-gp350CAR-T Cell Therapy Is Associated with Anti-inflammatory Effects
We have shown that long-term humanized NRG mice infected with EBV or HCMV show inflammatory responses associated with T cell expansion, activation, and release of cytokines in the plasma.32,37 Therefore, we investigated whether a response to CAR-T cell administrations could show lower virus-associated inflammation. We quantitatively integrated analyses of infiltrating B and T lymphocyte types with their cell proliferation status by multiplexed immunohistochemistry analyses of spleen tissues for quantification of CD20+Ki67+ and CD3+Ki67+ cells. Control mice showed, on average, higher levels of proliferating CD20+ tumor cells and CD3+ infiltrating lymphocytes than CAR-T cell-treated responder animals (Figures 6F and 6G). Proliferating EBV-infected cells in latency stages I–III typically express antigenic proteins that stimulate T cell responses (EBNA-1, LMP-1, and LMP-2), whereas quiescent EBV-infected cells in latency stage 0 do not express these antigens. Therefore, our results suggested that gp350CAR-T cells can keep EBV-infected cells in latency stage 0, concomitant with a lower T cell inflammatory profile.
We complemented the inflammation analyses by evaluating the immune-phenotypic profile by flow cytometry analyses. Longitudinal monitoring of huCD45+ and huCD4+ T cells in the blood did not reveal differential patterns for control, responder, or non-responder mice (Figures S10A–S10C). Control and non-responder mice showed significant increases in the frequencies of CD8+ T cells in the blood from 6–8 wpi (p ≤ 0.01 and p ≤ 0.05, respectively; Figures 7A and 7B), whereas a drop at 8 wpi was observed for responder mice. The analyses of the mean absolute numbers indicated a trend of higher infiltration of CD8+ T and CD4+ T cell in the spleen for controls and responders compared with non-responder mice (Figure 7C). We previously showed that EBV spread and malignancies in humanized mice were associated with upregulation of programmed cell death protein 1 (PD-1) on T cells, which is known as a relevant activation/exhaustion marker and checkpoint for T cell responses.32 Analyses of blood T cells indicated that responders contained lower levels of PD-1+CD8+ T cells (p ≤ 0.05 for the experiment performed with CB2) (Figure 7D; see flow cytometry gating strategy in Figure S11A). Low persistence of CAR-T cells was observed because, at 8 wpi, only three responders and one non-responder mouse showed CAR detectable on CD8+T cells of PB above background levels (Figure 7E; see gating strategy in Figure S11B). A trend of lower concentrations of human IFN-γ and IL-10 was observed in the plasma of responder mice compared with the other groups (Figure 7G; Table 1). Concurrently, non-responder mice showed the highest concentrations of IFN-γ, IL-10, IL-12, IL-6, IL-8, and MCP-1 in plasma, indicative of virus-associated inflammatory responses (Figure 7G; Table 1). The levels of GM-CSF, IFN-α, IL-2, and TNF-α were comparable among the groups (Figure S6B). CD8+7A1-gp350CAR-T cells were barely detectable at 8 wpi, nonetheless, the therapy was associated with lower CD8+ T cell inflation, reduced CD8+ T cell exhaustion, and a pattern of lowered cytokine release, indicating an overall decline of the inflammatory responses caused by EBV.
Figure 7.

Immune Monitoring Analyses to Assess the Affects of CD8+gp350CAR-T Cells Administered after EBV Infection in the Human T Lymphocytic Population
(A) Mice were grouped into CTR (gray, n = 11), R (red, n = 9) and NR (blue, n = 3). Analyses were performed at baseline prior to EBV infection (week 0) and sequentially after infection (3, 4, 6, and 8 wpi). Frequencies of human CD8+ T cells within huCD45+ cells were determined. Time points of CAR-T cell administration are indicated. (B) Comparison of the relative frequencies of human CD8+ T cells in the blood, analyzed 6 and 8 wpi. The mean and SD for each group is shown. R mice show lower expansion of CD8+ T cells than the other groups at 8 wpi. ∗p ≤ 0.05, ∗∗p ≤ 0.01. (C) Absolute numbers of huCD8+ T cells within huCD45+ (left graph) and CD4+ T cells within huCD45+ cells (right graph) in the spleen. Note the lower number of CD8+ T cells and higher numbers of CD4+ T cells in spleens of the R group compared with CTR mice. (D) MFI of PD-1 expression on CD45+/CD8+ (left graph) or on CD45+/CD4+ T cells (right graph), showing results from two experiments (CB1 and CB2). ∗p ≤ 0.05. (E) Detection of CAR+-T cells in PB within CD45+/CD8+ T cells at 8 wpi. The threshold for baseline detection was set arbitrarily at 1% (shadowed area). (F) Concentration (pg/ml) of human cytokines detected in the plasma of mice at 8 wpi: IFN-γ, IL-10, IL-12 (p70), IL-6, IL-8, and MCP-1. The mean and SD for each group is shown. A summary of the descriptive statistical analyses is shown in Table S7.
Discussion
Engineering and Validation of gp350CAR-T Cells against EBV
After primary infection, EBV lytic reactivation is controlled immunologically, but the virus is never cleared, and latent infection persists for life. EBV reactivation from latency can result in often fatal LPD in immune-compromised patients.2 In addition, virus latency and lytic cycles seem to be associated with development of aggressive EBV+ DLBCL.33 Studies of humanized mice, making use of EBV laboratory strains, have shown that EBV pathogenesis resembling EBV+ LPD required early lytic viral protein expression to accelerate development toward an EBV+ DLBCL phenotype.34 Thus, Ma et al.34 postulated that “lytically infected cells promote EBV-induced lymphomas through paracrine mechanisms and/or immunosuppressive factors.” Several immune therapies are in development and approved for treatment of lymphomas, but their implications regarding putative EBV lytic reactivation are still unknown. CD19CAR-T cell therapies are currently approved as a second- or third-line treatment approach against hematologic malignancies refractory to combination chemoimmunotherapy or antibody-based immunotherapies,22 but they have not been specifically validated against EBV+ lymphomas.
Here, we developed and tested gp350CAR-T cells as an EBV-specific adoptive T cell therapeutic option against LPD and lymphoma. We showed that CAR constructs containing the CD28 and CD3ζ domain and incorporating 7A1-derived scFvs were highly expressed on gp350CAR-T cells produced with PBMCs or with CBMCs after retroviral gene transfer. 7A1-gp350CAR-T cells showed high levels of specificity and reactivity against 293T/gp350 cell targets in vitro. In addition, 7A1-gp350CAR-T cells co-cultured with EBV+, latently infected B95-8 cells in vitro could effectively produce IFN-γ, proliferate and kill target cells, and reduce the frequencies of gp350+ cells in the target cell population.
Protective and Therapeutic Studies in Fully Humanized Mice
The effects of the gp350CAR-T cell immunotherapy were assessed pre-clinically in a relevant animal model. Because EBV has a narrow tropism to human B lymphocytes, we developed a dynamic mouse model with a human immune system (HIS) to elucidate the events related to EBV infection and the associated human immune responses. HIS models are at the forefront of biomedicine, and several different mouse strains and xenografting approaches have been optimized.38 Besides engraftment of human hematopoietic cells in bone marrow, it is now possible to follow the full human adaptive immune reconstitution in HIS mice. We have shown that HIS mice develop functional human memory CD4+ and CD8+ T cells and fully mature IgG+ and IgA+ B cells reactive against human herpes antigens.32,37,39 We have also shown that challenge of HIS mice with EBV/B95-8 resulted in LPD (perivascular lesions with abundant tumor infiltrating lymphocyte [TILs]) and a pathology recapitulating DLBCL (large and necrotic lesions with fewer TILs).32 A hallmark of EBV LPD progression toward DLBCL was emergence of highly activated/exhausted PD-1+CD8+ T cells.32
Here we used the preferentially lytic EBV/M81 strain, known to result in lytic infection and expression of gp350 in tissues of humanized mice.17 Two weeks after infection, viral spread was assessed longitudinally by dynamic optical imaging analyses, and the BLI results served as criteria to define responses. Purified CD8+gp350CAR-T and CD8+CD4+gp350CAR-T cells showed protective effects against EBV challenge, but, surprisingly, CD8+CD4+gp350CAR-T cells caused weight loss. Covassin et al.40 showed that CD4+ T cells purified from PBMCs and applied to humanized Nod.Rag.severe combined immunodeficiency (SCID) (NSG) mice mediated xeno-GVHD accompanied by weight loss and that the reactivity against mouse MHC was critical for this effect. Therefore, it is plausible to infer that some of the purified CD4+gp350CAR-T cells still expressed endogenous TCRs highly reactive against murine MHC class II, which promoted xeno-GVHD.
CD8+gp350CAR-T cells were subsequently tested in a therapeutic model setting because they did not cause weight loss. We observed by BLI that administration of CD8+gp350CAR-T cells 3 and 5 weeks after EBV/fLuc infection reduced viral spread from 6–8 wpi in 9 of 12 mice (75% response rate). Mice responding to gp350CAR-T cell therapy presented lower levels of EBV+ LPD and no tumor occurrences and showed lower signs of inflammation (lower levels of circulating PD-1+CD8+ T cells in the blood and lower levels of human cytokines in the plasma). These positive therapeutic effects of gp350CAR-T cells substantiate the observation that lytic reactivation seems to be important for development of EBV+ malignancies in humanized mouse models.34 Clinical observations have also confirmed that the EBV lytic cycle is involved in EBV+ DLBCL development and, therefore, that gp350CAR-T cell therapy can be of clinical value.33 Notably, in the clinical setting, a correlation was observed between gp350 expression in EBV+ DLBCL tumors and expression of IFN-γ and IL-10 transcripts.33 Thus, cytotoxic responses against EBV can coexist with the lymphoma tolerogenic microenvironment.41 This duality was also observed in our model, depending on the lymphocytes homing in the LPD milieu, which could be immune-stimulatory or immune-suppressive. Therefore, depending on the triggering context (probably involving antigenic stimulation or immune suppression of T cells), the immune responses could be shifted in favor of or against EBV. In fact, unexpectedly, 25% of mice receiving CD8+gp350CAR-T therapeutically showed higher EBV infection than controls, indicating exacerbation of EBV infection. Compared with control and responder mice, non-responders showed EBV rebound in the spleen, progressive weight loss, frequent tumor occurrence, and higher levels of cytokine release (particularly human IFN-γ and IL-10). Similarly, we recently observed that humanized mice infected with M81/fLuc and treated with pembrolizumab (a clinically used PD-1-blocking antibody) showed acceleration and augmentation of EBV spread and LPD (R.S. and F.F., unpublished data). This was also associated with weight loss, increased cytokine release, and higher levels of T cell exhaustion (expression of PD-1, LAG-3, and TIM-3) but also higher frequencies of tolerogenic regulatory T cells (R.S. and F.F., unpublished data). EBV has different mechanisms of immune escape; e.g., it has been shown that EBV-LMP-1 and IFN-γ can upregulate PD-L1 in EBV+ malignancies.42 Therefore, it is tempting to speculate that IFN-γ-producing gp350CAR-T cells interacting with EBV-infected cells could promote PD-L1 upregulation. Interaction of activated PD-1+ gp350CAR-T cells with PD-L1 on EBV-infected cells would, in turn, result in dysfunctional cytotoxic responses and apoptosis. These considerations remain to be evaluated experimentally in the future (for example, by combining gp350CAR-T cells with PD-L1 blockade). In summary, CD8+gp350CAR-T cells showed therapeutic responses for most mice. Further, our preclinical humanized mouse model warned about andn aggravated EBV spread in some non-responding mice.
Approaches to Improve the Persistence and Function of gp350CAR-T Cells
As a proof of principle, gp350CAR-T cells showed efficacy. However, as discussed above, evading immune response is a recognized hallmark of EBV. Persistent stimulation of gp350CAR-T cells during active EBV infection in humanized mice probably resulted in their exhaustion, hypoproliferation, and subsequent loss of functionality. Thus, as a logical first approach, it is important to disrupt the PD-1/PDL-1 axis; for example, by blocking PD-L1 with a minibody expressed by CAR-T cells, an approach proven previously to be effective for solid tumors by Porter et al.43 In addition, we can explore the “TRUCK” (T cells redirected for antigen-unrestricted cytokine-initiated killing) technologies, i.e., CAR-T cells can be co-engineered to deliver IL-12, known to activate the innate immune response, reduce regulatory T cells (Tregs), and increase Th17 cells in the tumor milieu.44 Alternatively, transgenic co-expression of IL-15 can potentially promote better CAR-T cell proliferation and persistence.44 In the future, the efficacy of gp350CAR-T cells can be further improved by combining the CAR signaling domains with 4-1BB and inducible T cell costimulatory (ICOS) signaling domains, which may improve gp350CAR-T cell in vivo persistence.21,45 Incorporating a suicide switch could allow more controlled treatment and the option to stop therapy if adverse effects become severe.46, 47, 48
It is worth mentioning that CAR-T cells targeting EBV LMP-1 showed potency in vitro and in mice xenografted with an EBV-negative nasopharyngeal carcinoma cell line (SUNE1) genetically modified for LMP1 overexpression.49 Nonetheless, LMP-1-CAR-T cells were not tested in the context of EBV+ cells or in vivo models recapitulating EBV infection or LPD. Therefore, other potential target EBV glycoproteins, such as gB, gH, gL, and gp42, could be tested in novel CAR designs and combinations to avoid immune escape mechanisms and to provide high efficacy to combat EBV infection and associated malignancies. In addition, combinations of different targets need to be evaluated to see whether a synergistic effect regarding tumor control and enhanced avoidance can be observed.
Prospects for CB-Derived CAR-T Cells for Herpesvirus Infection after HCT and SOT
Herpesvirus infections and reactivations are still major complications during the period of immune suppression for patients undergoing allogeneic HCT or SOT and adoptive T cell therapies have been developed.50, 51, 52 This is the case for CB HCT because the T cells in CB have not yet been exposed to and selected against EBV, and, in this case, no memory T cells are accessible. In our model, we showed that CB-derived CD8+gp350CAR-T cells could be efficiently produced, expanded, and sorted to very high purity. Administration of these purified CD8+gp350CAR-T cells did not produce any signs of acute GVHD even in this fully humanized mouse model system. Thus, it is tempting to foresee rational use of CD8+gp350CAR-T cells in the setting of CB HCT patients because they require a long time to recover immune function and are commonly affected by virus reactivation. In a recent related study, we have shown that CB-derived CAR-T cells targeted against the HCMV gB envelope also showed efficacy in vitro and in vivo.29 Therefore, similar to VST cells expanded with peptides and targeted against several viruses, polyfunctional CAR-T cells targeted simultaneously against EBV and HCMV can be developed in the future.
The incidence of EBV PTLD in post-allogeneic HCT is rising because of an increasing number of transplantations and relatively older donors and recipients.53 Treating EBV PTLD and EBV+ malignancies is rather problematic because there are no EBV-specific therapies approved by the European Medicine Agency (EMA) or by the US Food and Drug Administration (FDA). Our proof-of-concept in vivo studies showed the potency of CD8+gp350CAR-T cells in a state-of-the-art animal model recapitulating EBV spread and LPD and DLBCL development. Therefore, gp350CAR-T cells remain to be further optimized and developed clinically to combat EBV lytic reactivation and associated malignancies.
Materials and Methods
Primary Leukocytes and Cell Lines
Study protocols for procurement of primary cells from healthy donors were approved by the Ethics Committee of Hannover Medical School. Blood was collected and apheresis was performed at the Institute of Transfusion Medicine (Hannover Medical School) after informed consent of the donors. PBMCs were isolated using Ficoll density gradient separation (Biocoll Separating Solution; Biochrom, Berlin, Germany) and used for production of CAR-T cells and LCLs. Collection of umbilical CB was performed at the Department of Gynecology and Obstetrics (Hannover Medical School) after informed consent of the mothers. CBMCs were used for isolation of CD34+ HSCs after two rounds of positive selection using immune magnetic beads (CD34 MicroBead Kit, MACS® Cell Separation Miltenyi Biotec, Bergisch Gladbach, Germany) as described previously.54 The CD34− fraction was cryopreserved for production of CAR-T cells. HEK293T cells (ATCC, Manassas, VA, USA) were cultured at 37°C and 5% CO2 in Dulbecco’s modified Eagle’s medium (DMEM; Thermo Fisher Scientific, Waltham, MA) supplemented with 10% fetal bovine serum (FBS; HyClone, Logan, UT, USA) and 100 units/mL penicillin G and 10 mg/mL streptomycin sulfate (P/S; Merck Millipore, Billerica, MA, USA). A clonal 293T/gp350 cell line was established by transduction using a lentiviral vector expressing gp350, single-cell dilution, and selection of gp350-positive clones by FACS. B95-8 cells were kindly provided by Prof. Wolfgang Hammerschmidt (Helmholtz Zentrum Munich) and cultured in Roswell Park Memorial Institute (RPMI) 1640 medium (Lonza, Basel, Switzerland) with 10% FBS and 1% P/S. The Raji, Jijoye, and BL-60 cell lines were kindly provided by Dr. Andreas Moosmann (Helmholtz Zentrum Munich) and cultured in RPMI 1640 medium with 10% FBS and 1% P/S. HEK293 cell lines producing the EBV/M81/fLuc and B95-8/GFP strains and BZLF1 and BALF4 expression plasmids were kindly provided by Prof. Henri-Jacques Delecluse (German Cancer Research Center, Heidelberg, Germany) and cultivated in RPMI 1640 medium supplemented with 10% FBS, 1% P/S, and 100 μg/mL hygromycin.
Generation of the 7A1 and 6G4 mAbs and Neutralization Assays
Rats were immunized with EBV virus-like particles, and mAbs against gp350 were produced by standard hybridoma technologies. The hybridoma supernatants were purified with protein G columns, and the 7A1 and 6G4 antibodies were selected by immunostaining and flow cytometry analyses using parental HEK293 cells and HEK293 cells stably transfected with a plasmid expressing gp350. The reference murine gp350-specific antibody 72A1 was obtained from the Core Facility “Monoclonal Antibodies” at the Helmholtz Centre Munich. To test the neutralizing capacity of the antibodies, 200,000 primary B cells isolated from adenoids were infected with the recombinant EBV 2089 expressing GFP55,56 at a MOI of 0.2. Prior to infection, the virus was incubated with serial dilutions of the antibodies at room temperature for 30 min. Two days later, the frequencies of GFP+ infected cells were determined by flow cytometry.
EBV Production, LCL Generation, and gp350 Detection on Cells
Virus production was performed as described previously.13 Briefly, packaging HEK293 cell lines were induced to produce virus by transfection of the BZLF1 and BALF4 expression plasmids in the presence of polyethylenimine (PEI MAX transfection-grade linear polyethylenimine hydrochloride; Polyscience, Hirschberg, Germany). Supernatants were harvested 3 days after induction and centrifuged at 300 × g for 10 min and then at 4,000 × g for an additional 20 min to remove cell debris. Supernatants were harvested and ultra-centrifuged at 100,000 × g for 2 h. Viral pellets were resuspended in PBS and shaken in an ice bath for 1 h. Viral stocks were stored at 4°C.
Determination of the titer was performed by infecting Raji cells with different volumes of B95-8/GFP virus stock as described previously.34 One day after infection, fresh medium was added. After 3 days, the percentage of GFP+ cells was determined by flow cytometry. Virus titers were expressed as “green Raji units” (GRUs), calculated using the following formula: total number of Raji cells infected × percentage of GFP+ cells/volume of the virus stock used. Because direct determination of M81/fLuc GRUs is not possible, first the titer (copies per microliter) was determined via EBV qPCR for the B95-8/GFP and M81/fLuc virus stocks. Subsequently, the viral copies per microliter were calculated for both viral strains. The titers of EBV/M81/fLuc lots can be determined by correlation of the number of viral copies with EBNA2 staining and using the B95-8/GFP virus with a known titer determined by GRUs as a reference. For that, B cells from CB were isolated through positive selection using magnetic beads (CD19 MicroBead Kit, MACS Miltenyi Biotec). Isolated cells were then seeded in 24-well plates with 2 × 10⁵ cells per well and infected in parallel with B95-8/GFP and M81/fLuc at different MOIs. After 3 days of culture, the infection rate was determined by analysis of EBNA2 staining. For detection of EBNA2, intracellular staining was performed. Cells were fixed with Cytofix (BD Biosciences, Becton Dickinson, Heidelberg, Germany). Then cells were washed twice with Perm/Wash buffer (BD Biosciences). Staining was then performed using the primary EBNA2 mAb (Table S8) diluted in Perm/Wash buffer, followed by washing with Perm/Wash buffer. Then the secondary mouse anti-rat IgG antibody (Table S8), also diluted in Perm/Wash buffer, was applied. Cells were subsequently washed and analyzed.
LCLs were generated by infection of PBMCs or CBMCs with EBV/M81/fLuc at a MOI of 0.1 overnight. The next day, cells were centrifuged at 300 × g and resuspended in fresh RPMI 1640 medium with 10% FBS and 1% P/S. LCLs were expanded for at least 4 weeks. For detection of gp350, cells were incubated with PBS containing 10% human serum for blocking (Capricorn Scientific, Ebsdorfergrund, Germany), and for staining, the antibodies were diluted in PBS containing 1% human serum. For detection of gp350 on the cell surface, the primary 72A1 mouse IgG mAb (1:10, kindly provided by GeneVector Laboratory, Munich, Germany) and secondary goat anti-mouse IgG (Jackson ImmunoResearch Laboratories, Bar Harbor, ME, USA) or primary rat 7A1 and 6G4 mAbs (kindly provided by GeneVector Laboratory) and secondary mouse anti-rat IgG (Jackson ImmunoResearch Laboratories) were used (Table S8). Then samples were fixated with CellFix (BD Biosciences). Flow cytometry data were acquired using a BD LSR II (BD Biosciences) or a CytoFLEX S apparatus (Beckman Coulter, Brea, USA) and analyzed using FlowJo (v.10, Tree Star, Ashland, OR, USA).
CAR Design, CAR-T Cell Production, and Flow Cytometry
Sequences of scFvs of the gp350-specific rat-derived mAbs 6G4 and 7A1 in VH→VL orientation and incorporating a signal peptide for CAR transmembrane translocation and an interspacing linker sequence were synthesized after codon optimization (Thermo Fisher Scientific). The DNA fragments were excised with PmI1 and BamHI sites and subcloned into a SFG retroviral expression plasmid incorporating a CAR backbone,57 and a CD19CAR construct was used as a reference (kindly provided by Prof. Malcolm Brenner and Prof. Cliona Rooney, Baylor College of Medicine, Houston, TX, USA).57 The identity of the vectors was confirmed by restriction digestion with the Fast Digest enzymes Pml1, Cla1, and BamHI (Thermo Fisher Scientific, Waltham, MA, USA) and sequencing of the CAR insert (Microsynth Seqlab, Göttingen, Germany). A cognate vector expressing a control CAR targeting the HCMV gB protein was used as a non-specific control.29 Retroviral vectors were produced after transient co-transfection of 293T cells with RD114 envelope and PegPAM plasmids using a standard calcium phosphate-based method.57 16 h after transfection, cells were treated with sodium butyrate for 8 h and washed, and 24 h later, the cell supernatants were harvested, filtered, and cryopreserved. Retroviral stocks were tested in transduction of 293T cells. PBMCs or CBMCs were thawed and cultured in RPMI 1640 medium supplemented with 10% FBS, 1% P/S, IL-7, and IL-15 (5 ng/mL each, Miltenyi Biotec). PBMCs were activated with plate-bound CD3 (OKT3; eBioscience, Waltham, MA, USA) and CD28-binding antibodies (CD28.2; BioLegend, San Diego, CA, USA) for 2 days. CBMCs were activated with magnetic beads conjugated with anti-CD2, anti-CD3, and anti-CD28 antibodies (Miltenyi Biotec) in a bead-to-cell ratio of 1:2 for 3 days. After activation, T cells were transduced with the retroviral vectors by spinoculation on retronectin-coated plates (Takara Bio, Otsu, Japan) for 60 min at 4,500 × g at 32°C. The medium was exchanged 6 h after transductions and, a day later, T cells were harvested and transferred to a non-adherence plate. CAR-T cells produced with PBMCs were further expanded in RPMI 1640 medium supplemented with 10% FBS, 1% P/S, IL-7, and IL-15 (5 ng/mL each). CAR-T cells generated from CBMCs were expanded in the presence of activation beads, IL-7, and IL-15. For CAR detection, cells were blocked in PBS containing 10 μg/mL mouse-IgG (Sigma-Aldrich, St. Louis, MO, USA) (Table S8). Fluorochrome-conjugated isotype controls and anti-human CD3, CD4, CD8 were purchased from BioLegend (Table S8). CARs were detected with fluorochrome-conjugated goat anti-human IgG-Fc Fab fragments directed against the IgG4 spacer incorporated in the CAR (Jackson ImmunoResearch Laboratories) (Table S8). After staining, samples were fixed with CellFix (BD Biosciences, Becton Dickinson). Flow cytometry data were acquired using a BD LSR II (BD Biosciences, Becton Dickinson) and analyzed using FlowJo (v.10, Tree Star, Ashland, OR, USA).
Co-culture of Effector CAR-T Cells with Target Cells
For co-culture of CAR-T cells with 293T/gp350 target cells, 293T/WT and 293T/gp350 cells were seeded in 96-well plates with 1 × 10⁴ cells per well 1 day before addition of CAR-T cells. The following day, CAR-T cells were added to the 293T cultures at 1:1 and 3:1 effector to target ratios. Triplicates were performed for each group. After co-incubation periods of 24 and 48 h, cell supernatants were harvested from triplicate wells and analyzed independently. IFN-γ secretion was analyzed using an ELISA kit (Ready-Set-Go!, Thermo Fisher Scientific, Waltham, MA, USA; according to the manufacturer, the detection limit is 4 pg/mL). The cells were harvested, and triplicates were pooled for FACS analyses. Cells were stained with the fixable viability dye e450 (eBioscience) prior to flow cytometry analyses, allowing distinction between viable and dead cells. The dye was used according to the company’s protocol. The percentage of viable cells was calculated as follows: percentage of viable target cells in co-cultures/percentage of viable target cells in target-only cell cultures.
Gp350 staining was performed using the 72A1 antibody (to avoid binding of the antibody to CAR-T cells) as described above. The percentage of gp350+ viable targets was calculated as follows: percentage of viable gp350+ target cells in co-cultures/percentage of viable gp350+ target cells in target-only cell cultures.
For co-cultures of CAR-T cells with B95-8 target cells, CAR-T cells were labeled for 20 min in the dark with CellTrace Yellow (Thermo Fisher Scientific, Waltham, MA, USA) according to the vendor’s protocol prior to setup of the co-cultures. 1 × 10⁴ target cells were seeded in 96-well plates, and effector CAR-T cells were added at different E:T ratios. Triplicates were performed for each co-culture. 38 and 86 h after co-culture, cell supernatants were harvested from triplicate wells and analyzed independently. IFN-γ secretion was analyzed using an ELISA kit (Ready-Set-Go!). The cells were harvested and pooled for FACS analyses. For analysis of T cell proliferation, loss of the proliferation dye CellTrace upon cell division was detected by flow cytometry.
Cells were stained with the fixable viability dye e450 (eBioscience) prior to flow cytometry analyses, allowing distinction between viable and dead cells, and gp350 staining was performed using the 72A1 antibody as described above. The percentage of viable cells as well as the percentage of gp350 viable cells were calculated as described above for 293T co-cultures.
Generation of Humanized Mice, EBV Infection, and CAR-T Cell Administration
All experiments involving mice were performed in accordance with the German Animal Welfare Act and European Union Directive 2010/63 and were approved by the Lower Saxony Office for Consumer Protection and Food Safety – LAVES (permit 16/2222). Breeding pairs of NRG mice were originally obtained from The Jackson Laboratory (Bar Harbor, ME, USA) and bred under pathogen-free conditions. 5- to 6-week-old female mice were used for CB-CD34+ HCT using techniques described previously.54,58, 59, 60 CD34+ cells were pretested in two mice to confirm more than 15 weeks of human reconstitution. Only CB units resulting in 20% or higher frequencies of human CD45+ cells in mouse PB lymphocytes 15 weeks post-HCT were used for further experiments. Prior to HCT, mice were irradiated sublethally (450 cGy) using a [137Cs] column irradiator (Gammacell 3000 Elan; Best Theratronics, Ottawa, ON, Canada). 4 h after irradiation, 2.0 × 10⁵ CD34+ cells were administrated to mice through the tail vein as described previously.59,61 Weight and signs of GVHD were monitored weekly after HCT. Reconstitution of human CD45/CD3/CD19/CD4/CD8 cells in the blood was monitored during weeks 10 and 15 after HCT as described below. For the protective experiment, gp350CAR-T cells autologous to the CB stem cells used for humanization were produced, expanded as described above, sorted as CD4+CAR+ or CD8+CAR+ (83% and 89% purity, respectively), and expanded for 1 week prior to administration. To obtain comparable initial cohorts of control and CAR-T cell treatment groups, humanized mice were grouped based on the levels of human immune reconstitution at week 15 after HCT. 17 weeks after HCT, 3 humanized mice received 2 × 10⁶ CD8+ gp350CAR+ T cells, 4 mice received 2 × 10⁶ CD4+gp350CAR+ plus CD8+gp350CAR+ T cells (at a 1:1 ratio), and 3 mice were injected with PBS and served as controls. One day later, mice were infected with 106 GRUs EBV-M81/fLuc.
For the therapeutic experiments, humanized mice were generated with CD34+ stem cells from two donors. 17 weeks after HCT, mice were infected with EBV-M81/fLuc. To obtain comparable initial cohorts of control and CAR-T cell treatment groups, humanized mice used in the therapeutic experiments were grouped based on the levels of human immune reconstitution at week 17 after HCT and EBV infection levels 3 wpi. CD8+CD19CAR-T cells or CD8+gp350CAR-T cells matched to the HCT donor were produced as described above. CD8+gp350CAR-T cells were consistently expanded and sorted to purity (83.0%–98.2% purity for 4 independent productions). 2 × 10⁶ CD8+gp350CAR-T cells were administered 3 and 5 wpi (n = 12 mice). 10 mice served as PBS injection controls. Weight was monitored weekly until euthanasia.
BLI Analyses of EBV-Infected Mice and Their Explanted Organs
Mice infected with EBV-M81/fLuc were analyzed by BLI using the IVIS SpectrumCT apparatus (PerkinElmer, Waltham, Massachusetts, USA) as described.32 In brief, mice were anesthetized using isoflurane. 5 min before imaging, mice were injected intraperitoneally (i.p.) with 2.5 mg D-Luciferin potassium salt (SYNCHEM, Elk Grove Village, IL, USA) dissolved in 100 μL PBS. For explanted mouse organs, BLI analyses were performed 5 min after the organs were incubated in 25 mg/mL D-Luciferin potassium salt solution. Datasets were analyzed using LivingImage software (PerkinElmer, Waltham, MA, USA).
Immunomonitoring, PD-1 Expression, and Detection of CAR-T Cells in Mouse Tissues
The human immune reconstitution and persistence of CAR detection in different tissues were analyzed by flow cytometry as described previously.29,32 Lysis of erythrocytes was performed in 0.83% ammonium chloride/20 mM HEPES (pH 7.2) for 5 min at room temperature, followed by stabilization with cold PBS (Biochrom) and washing. Spleen, bone marrow, and tumor tissue were isolated and homogenized. Cell suspensions were washed and resuspended in PBS for staining as described above. Anti-human CD45, CD3, CD4, CD8, CD19, and PD-1 (BioLegend) in pretested dilutions were used to stain the respective cell surface markers (Table S8).
RT-qPCR for Determination of EBV Copies
Snap-frozen tissue samples were processed with a blood DNA isolation kit (QIAGEN, Hilden, Germany). DNA concentration and purity were determined by spectrophotometry. For detection of EBV DNA, 20 μL of the DNA samples were used. Quantification of EBV DNA was performed with a commercial kit (Altona Diagnostics, Hamburg, Germany) according to the manufacturer’s instructions. qRT-PCR was performed and analyzed with a StepOnePlus-PCR cycler (Thermo Fisher Scientific). Cycle threshold (CT) values were used to calculate the number of copies of EBV genomes by a standard dilution curve provided with the kit and adjusted to the respective DNA concentrations.
Analysis of Human Cytokines in Mouse Plasma
At sacrifice, PB samples were collected by heart puncture, and cells were subsequently sedimented by centrifugation. The supernatant containing plasma was stored at −80°C until analysis. After thawing, plasma samples were centrifuged at 2,000 × g for 10 min at room temperature prior to analysis to remove the remaining cell debris. 25 μL of plasma was used for analysis of each sample. The concentration in plasma of human GM-CSF, IFN-α, IFN-γ, MCP-1, TNF-α, IL-1β, IL-2, IL-4, IL-5, IL-6, IL-7, IL-8, IL-10, and IL-12 (p70) was analyzed by a multiplex bead kit for cytokine analysis (Milliplex; Millipore, MA, USA) according to the manufacturer’s protocol.
Analyses of Tissues for EBER by In Situ Hybridization and Immunohistochemistry
3-μm-thick spleen and liver sections were produced from formalin-fixed, paraffin-embedded tissue blocks. Consecutive sections were subjected to Giemsa staining according to standard protocols, immunohistochemistry for CD30 and Ki67 using the Ultra-View 3,3′-Diaminobenzidine (DAB) universal staining kit (Roche), and detection of EBER 1 by in situ hybridization (EBER 1 DNP Probe, Ventana/Roche Tissue Diagnostics, Tucson, AZ, USA) on the automated Benchmark Ultra instrument (Ventana/Roche Tissue Diagnostics, as described previously).32 Multiplexed immunohistochemistry was performed using the Opal technology (Akoya Bioscience, Menlo Park, CA) for detection of CD3 (polyclonal; Dako, Bollschweil, Germany), CD20 (clone L26, Dako), and Ki67 (Thermo Scientific, Waltham, MA, USA). The detection reagents Opal 650, Opal 690, and Opal 620 (Akoya Bioscience) were applied (Table S8). Multiplexed immunohistochemistry was analyzed by the VectraPolaris instrument (Akoya Biosciences). For quantitative analysis, multiplexed images were analyzed using inForm 2.4.8 software (Akoya Biosciences) as described previously.32 Several representative regions of interest (ROIs) were selected from the spleen (2–4 ROIs per sample) and liver (3–6 per sample, near blood vessels). ROIs were scanned at 5,568 × 4,176 pixel or 3,728 × 2 729 pixel at 0.5 or 0.25 μm/pixel resolution.
Statistical Analysis
Comparisons between different treatments/conditions were carried out by Welch’s t test, taking into account the variance inhomogeneity. Bonferroni-Holm correction was applied to account for multiple comparisons. When values were depicted on a logarithmic scale, Welch’s t test was also applied to the logarithmic values. For longitudinal data analyses, except for Figures 3D and 3E, Welch’s t test was applied at each time point, again with Bonferroni-Holm correction for the treatments/conditions. It should be noted that, for small sample sizes, the p values for Welch’s t test might carry a bias. For the longitudinal data in Figures 3D and 3E (left panels), analysis of covariance (ANCOVA) was applied because, in these cases, the linear model was the most suitable according to the Bayesian information criterion. Mean and standard deviation (SD) are displayed; ∗p ≤ 0.05, ∗∗p ≤ 0.01, ∗∗∗p ≤ 0.001.
Author Contributions
C.S. and M.K. performed experiments, analyzed data, and wrote the first draft of the manuscript. S.D., R.Z., V.V., and C.F.d.F. performed experiments and analyzed data. H.O., S.J.T., A.S., N.K., and S.L. performed experiments. F.K. revised or conducted the statistical analyses. R.S., F.F., A.B., A.G., R.B., C.v.K., and W.H. provided resources and materials. R.S. provided overall conceptualization and project leadership, obtained funding, administered the resources, supervised the data analyses, and wrote and revised the final manuscript.
Conflicts of Interest
R.S., C.S., R.Z., and W.H. are co-inventors in the patent application “CHIMERIC ANTIGEN RECEPTOR AND CAR-T CELLS THAT BIND A HERPES VIRUS ANTIGEN” (European patent application number EP18168410.1; priority date of April 20, 2018; international publication number WO 2019/201995). R.S. received honoraria and funding support from The Jackson Laboratory. R.S. serves as a scientific consultant with honoraria from BioSyngen/Zelltechs Pte. Ltd. (Singapore) for clinical development of gp350CAR-T cells.
Acknowledgments
This work was financed by grants from the German Center for Infections Research (DZIF-TTU07.803 and DZIF-TTU07.805 to R.S.), by a research collaboration grant from THE JACKSON LABORATORY, and by the German Research Council (DFG/SFB738 Project A6 and DFG/REBIRTH Unit 6.4 to R.S.). C.S., M.K., and H.O. received DZIF MD stipends. S.J.T. received a RegSci PhD fellowship, and V.V. received a DAAD/ZIB Ph.D. fellowship. C.F. was funded by REBIRTH Unit 6.3. F.F. was funded by the German Ministry of Education and Research (BMBF) and DLR project management (e:Med) grants 01ZX1710A and 01ZX1608A. R.Z. was financed by DZIF-TTU07.803. We would like to thank Dr. Malcolm Brenner and Dr. Cliona Rooney (Baylor College of Medicine, Houston, TX, USA) for kindly providing the retroviral vector backbones expressing CARs used for these studies. We thank Dr. Henri-Jacques Delecluse (German Cancer Research Center, Heidelberg, Germany) for providing the EBV/M81-fLuc virus. We are grateful for the excellent conceptual and technical advice regarding generation of CAR-T cells provided by Dr. Maksim Mamonkin (Baylor College of Medicine, Houston, TX, USA). We thank Dr. Ute Behrens (Ludwig Maximilian University, Munich) for critical discussions. We thank other members of the Regenerative Immune Therapies Applied Laboratory, in particular Benjamin Ostermann, Laura Gerasch, and Angela Cornelius, for valuable technical contributions.
Footnotes
Supplemental Information can be found online at https://doi.org/10.1016/j.omto.2020.08.005.
Supplemental Information
References
- 1.Heslop H.E. How I treat EBV lymphoproliferation. Blood. 2009;114:4002–4008. doi: 10.1182/blood-2009-07-143545. [DOI] [PMC free article] [PubMed] [Google Scholar]
- 2.DeStefano C.B., Desai S.H., Shenoy A.G., Catlett J.P. Management of post-transplant lymphoproliferative disorders. Br. J. Haematol. 2018;182:330–343. doi: 10.1111/bjh.15263. [DOI] [PubMed] [Google Scholar]
- 3.Rostgaard K., Balfour H.H., Jr., Jarrett R., Erikstrup C., Pedersen O., Ullum H., Nielsen L.P., Voldstedlund M., Hjalgrim H. Primary Epstein-Barr virus infection with and without infectious mononucleosis. PLoS ONE. 2019;14:e0226436. doi: 10.1371/journal.pone.0226436. [DOI] [PMC free article] [PubMed] [Google Scholar]
- 4.Münz C. Latency and lytic replication in Epstein-Barr virus-associated oncogenesis. Nat. Rev. Microbiol. 2019;17:691–700. doi: 10.1038/s41579-019-0249-7. [DOI] [PubMed] [Google Scholar]
- 5.Buschle A., Hammerschmidt W. Epigenetic lifestyle of Epstein-Barr virus. Semin. Immunopathol. 2020;42:131–142. doi: 10.1007/s00281-020-00792-2. [DOI] [PMC free article] [PubMed] [Google Scholar]
- 6.Vockerodt M., Cader F.Z., Shannon-Lowe C., Murray P. Epstein-Barr virus and the origin of Hodgkin lymphoma. Chin. J. Cancer. 2014;33:591–597. doi: 10.5732/cjc.014.10193. [DOI] [PMC free article] [PubMed] [Google Scholar]
- 7.Tao Q., Robertson K.D., Manns A., Hildesheim A., Ambinder R.F. Epstein-Barr virus (EBV) in endemic Burkitt’s lymphoma: molecular analysis of primary tumor tissue. Blood. 1998;91:1373–1381. [PubMed] [Google Scholar]
- 8.Lu T.X., Liang J.H., Miao Y., Fan L., Wang L., Qu X.Y., Cao L., Gong Q.X., Wang Z., Zhang Z.H. Epstein-Barr virus positive diffuse large B-cell lymphoma predict poor outcome, regardless of the age. Sci. Rep. 2015;5:12168. doi: 10.1038/srep12168. [DOI] [PMC free article] [PubMed] [Google Scholar]
- 9.Brennan B. Nasopharyngeal carcinoma. Orphanet J. Rare Dis. 2006;1:23. doi: 10.1186/1750-1172-1-23. [DOI] [PMC free article] [PubMed] [Google Scholar]
- 10.Iizasa H., Nanbo A., Nishikawa J., Jinushi M., Yoshiyama H. Epstein-Barr Virus (EBV)-associated gastric carcinoma. Viruses. 2012;4:3420–3439. doi: 10.3390/v4123420. [DOI] [PMC free article] [PubMed] [Google Scholar]
- 11.Leen A.M., Bollard C.M., Mendizabal A.M., Shpall E.J., Szabolcs P., Antin J.H., Kapoor N., Pai S.Y., Rowley S.D., Kebriaei P. Multicenter study of banked third-party virus-specific T cells to treat severe viral infections after hematopoietic stem cell transplantation. Blood. 2013;121:5113–5123. doi: 10.1182/blood-2013-02-486324. [DOI] [PMC free article] [PubMed] [Google Scholar]
- 12.Heslop H.E., Slobod K.S., Pule M.A., Hale G.A., Rousseau A., Smith C.A., Bollard C.M., Liu H., Wu M.F., Rochester R.J. Long-term outcome of EBV-specific T-cell infusions to prevent or treat EBV-related lymphoproliferative disease in transplant recipients. Blood. 2010;115:925–935. doi: 10.1182/blood-2009-08-239186. [DOI] [PMC free article] [PubMed] [Google Scholar]
- 13.Neuhierl B., Feederle R., Hammerschmidt W., Delecluse H.J. Glycoprotein gp110 of Epstein-Barr virus determines viral tropism and efficiency of infection. Proc. Natl. Acad. Sci. USA. 2002;99:15036–15041. doi: 10.1073/pnas.232381299. [DOI] [PMC free article] [PubMed] [Google Scholar]
- 14.Hoshikawa Y., Satoh Y., Murakami M., Maeta M., Kaibara N., Ito H., Kurata T., Sairenji T. Evidence of lytic infection of Epstein-Barr virus (EBV) in EBV-positive gastric carcinoma. J. Med. Virol. 2002;66:351–359. doi: 10.1002/jmv.2152. [DOI] [PubMed] [Google Scholar]
- 15.Martel-Renoir D., Grunewald V., Touitou R., Schwaab G., Joab I. Qualitative analysis of the expression of Epstein-Barr virus lytic genes in nasopharyngeal carcinoma biopsies. J. Gen. Virol. 1995;76:1401–1408. doi: 10.1099/0022-1317-76-6-1401. [DOI] [PubMed] [Google Scholar]
- 16.Lin W., Yip Y.L., Jia L., Deng W., Zheng H., Dai W., Ko J.M.Y., Lo K.W., Chung G.T.Y., Yip K.Y. Establishment and characterization of new tumor xenografts and cancer cell lines from EBV-positive nasopharyngeal carcinoma. Nat. Commun. 2018;9:4663. doi: 10.1038/s41467-018-06889-5. [DOI] [PMC free article] [PubMed] [Google Scholar]
- 17.Tsai M.H., Raykova A., Klinke O., Bernhardt K., Gärtner K., Leung C.S., Geletneky K., Sertel S., Münz C., Feederle R., Delecluse H.J. Spontaneous lytic replication and epitheliotropism define an Epstein-Barr virus strain found in carcinomas. Cell Rep. 2013;5:458–470. doi: 10.1016/j.celrep.2013.09.012. [DOI] [PubMed] [Google Scholar]
- 18.Tsai M.H., Lin X., Shumilov A., Bernhardt K., Feederle R., Poirey R., Kopp-Schneider A., Pereira B., Almeida R., Delecluse H.J. The biological properties of different Epstein-Barr virus strains explain their association with various types of cancers. Oncotarget. 2017;8:10238–10254. doi: 10.18632/oncotarget.14380. [DOI] [PMC free article] [PubMed] [Google Scholar]
- 19.van Zyl D.G., Mautner J., Delecluse H.J. Progress in EBV Vaccines. Front. Oncol. 2019;9:104. doi: 10.3389/fonc.2019.00104. [DOI] [PMC free article] [PubMed] [Google Scholar]
- 20.Adhikary D., Behrends U., Moosmann A., Witter K., Bornkamm G.W., Mautner J. Control of Epstein-Barr virus infection in vitro by T helper cells specific for virion glycoproteins. J. Exp. Med. 2006;203:995–1006. doi: 10.1084/jem.20051287. [DOI] [PMC free article] [PubMed] [Google Scholar]
- 21.Harris D.T., Kranz D.M. Adoptive T Cell Therapies: A Comparison of T Cell Receptors and Chimeric Antigen Receptors. Trends Pharmacol. Sci. 2016;37:220–230. doi: 10.1016/j.tips.2015.11.004. [DOI] [PMC free article] [PubMed] [Google Scholar]
- 22.June C.H., O’Connor R.S., Kawalekar O.U., Ghassemi S., Milone M.C. CAR T cell immunotherapy for human cancer. Science. 2018;359:1361–1365. doi: 10.1126/science.aar6711. [DOI] [PubMed] [Google Scholar]
- 23.Kochenderfer J.N., Dudley M.E., Kassim S.H., Somerville R.P., Carpenter R.O., Stetler-Stevenson M., Yang J.C., Phan G.Q., Hughes M.S., Sherry R.M. Chemotherapy-refractory diffuse large B-cell lymphoma and indolent B-cell malignancies can be effectively treated with autologous T cells expressing an anti-CD19 chimeric antigen receptor. J. Clin. Oncol. 2015;33:540–549. doi: 10.1200/JCO.2014.56.2025. [DOI] [PMC free article] [PubMed] [Google Scholar]
- 24.Maude S.L., Frey N., Shaw P.A., Aplenc R., Barrett D.M., Bunin N.J., Chew A., Gonzalez V.E., Zheng Z., Lacey S.F. Chimeric antigen receptor T cells for sustained remissions in leukemia. N. Engl. J. Med. 2014;371:1507–1517. doi: 10.1056/NEJMoa1407222. [DOI] [PMC free article] [PubMed] [Google Scholar]
- 25.Zhen A., Peterson C.W., Carrillo M.A., Reddy S.S., Youn C.S., Lam B.B., Chang N.Y., Martin H.A., Rick J.W., Kim J. Correction: Long-term persistence and function of hematopoietic stem cell-derived chimeric antigen receptor T cells in a nonhuman primate model of HIV/AIDS. PLoS Pathog. 2018;14:e1006891. doi: 10.1371/journal.ppat.1006891. [DOI] [PMC free article] [PubMed] [Google Scholar]
- 26.Sautto G.A., Wisskirchen K., Clementi N., Castelli M., Diotti R.A., Graf J., Clementi M., Burioni R., Protzer U., Mancini N. Chimeric antigen receptor (CAR)-engineered T cells redirected against hepatitis C virus (HCV) E2 glycoprotein. Gut. 2016;65:512–523. doi: 10.1136/gutjnl-2014-308316. [DOI] [PMC free article] [PubMed] [Google Scholar]
- 27.Proff J., Brey C.U., Ensser A., Holter W., Lehner M. Turning the tables on cytomegalovirus: targeting viral Fc receptors by CARs containing mutated CH2-CH3 IgG spacer domains. J. Transl. Med. 2018;16:26. doi: 10.1186/s12967-018-1394-x. [DOI] [PMC free article] [PubMed] [Google Scholar]
- 28.Carrillo M.A., Zhen A., Zack J.A., Kitchen S.G. New approaches for the enhancement of chimeric antigen receptors for the treatment of HIV. Transl. Res. 2017;187:83–92. doi: 10.1016/j.trsl.2017.07.002. [DOI] [PubMed] [Google Scholar]
- 29.Olbrich H., Theobald S.J., Slabik C., Gerasch L., Schneider A., Mach M., Shum T., Mamonkin M., Stripecke R. Adult and Cord Blood-Derived High-Affinity gB-CAR-T Cells Effectively React Against Human Cytomegalovirus Infections. Hum. Gene Ther. 2020;31:423–439. doi: 10.1089/hum.2019.149. [DOI] [PMC free article] [PubMed] [Google Scholar]
- 30.Hoffman G.J., Lazarowitz S.G., Hayward S.D. Monoclonal antibody against a 250,000-dalton glycoprotein of Epstein-Barr virus identifies a membrane antigen and a neutralizing antigen. Proc. Natl. Acad. Sci. USA. 1980;77:2979–2983. doi: 10.1073/pnas.77.5.2979. [DOI] [PMC free article] [PubMed] [Google Scholar]
- 31.Haque T., Johannessen I., Dombagoda D., Sengupta C., Burns D.M., Bird P., Hale G., Mieli-Vergani G., Crawford D.H. A mouse monoclonal antibody against Epstein-Barr virus envelope glycoprotein 350 prevents infection both in vitro and in vivo. J. Infect. Dis. 2006;194:584–587. doi: 10.1086/505912. [DOI] [PubMed] [Google Scholar]
- 32.Danisch S., Slabik C., Cornelius A., Albanese M., Tagawa T., Chen Y.A., Krönke N., Eiz-Vesper B., Lienenklaus S., Bleich A. Spatiotemporally Skewed Activation of Programmed Cell Death Receptor 1-Positive T Cells after Epstein-Barr Virus Infection and Tumor Development in Long-Term Fully Humanized Mice. Am. J. Pathol. 2019;189:521–539. doi: 10.1016/j.ajpath.2018.11.014. [DOI] [PMC free article] [PubMed] [Google Scholar]
- 33.Cohen M., Vistarop A.G., Huaman F., Narbaitz M., Metrebian F., De Matteo E., Preciado M.V., Chabay P.A. Epstein-Barr virus lytic cycle involvement in diffuse large B cell lymphoma. Hematol. Oncol. 2018;36:98–103. doi: 10.1002/hon.2465. [DOI] [PubMed] [Google Scholar]
- 34.Ma S.D., Hegde S., Young K.H., Sullivan R., Rajesh D., Zhou Y., Jankowska-Gan E., Burlingham W.J., Sun X., Gulley M.L. A new model of Epstein-Barr virus infection reveals an important role for early lytic viral protein expression in the development of lymphomas. J. Virol. 2011;85:165–177. doi: 10.1128/JVI.01512-10. [DOI] [PMC free article] [PubMed] [Google Scholar]
- 35.Bilger A., Plowshay J., Ma S., Nawandar D., Barlow E.A., Romero-Masters J.C., Bristol J.A., Li Z., Tsai M.H., Delecluse H.J., Kenney S.C. Leflunomide/teriflunomide inhibit Epstein-Barr virus (EBV)- induced lymphoproliferative disease and lytic viral replication. Oncotarget. 2017;8:44266–44280. doi: 10.18632/oncotarget.17863. [DOI] [PMC free article] [PubMed] [Google Scholar]
- 36.Kalathookunnel Antony A., Lian Z., Wu H. T Cells in Adipose Tissue in Aging. Front. Immunol. 2018;9:2945. doi: 10.3389/fimmu.2018.02945. [DOI] [PMC free article] [PubMed] [Google Scholar]
- 37.Theobald S.J., Khailaie S., Meyer-Hermann M., Volk V., Olbrich H., Danisch S., Gerasch L., Schneider A., Sinzger C., Schaudien D. Signatures of T and B Cell Development, Functional Responses and PD-1 Upregulation After HCMV Latent Infections and Reactivations in Nod.Rag.Gamma Mice Humanized With Cord Blood CD34+ Cells. Front. Immunol. 2018;9:2734. doi: 10.3389/fimmu.2018.02734. [DOI] [PMC free article] [PubMed] [Google Scholar]
- 38.Stripecke R., Münz C., Schuringa J.J., Bissig K.D., Soper B., Meeham T., Yao L.C., Di Santo J.P., Brehm M., Rodriguez E. Innovations, challenges, and minimal information for standardization of humanized mice. EMBO Mol. Med. 2020;12:e8662. doi: 10.15252/emmm.201708662. [DOI] [PMC free article] [PubMed] [Google Scholar]
- 39.Theobald S.J., Kreer C., Khailaie S., Bonifacius A., Eiz-Vesper B., Figueiredo C., Mach M., Backovic M., Ballmaier M., Koenig J. Repertoire characterization and validation of gB-specific human IgGs directly cloned from humanized mice vaccinated with dendritic cells and protected against HCMV. PLoS Pathog. 2020;16:e1008560. doi: 10.1371/journal.ppat.1008560. [DOI] [PMC free article] [PubMed] [Google Scholar]
- 40.Covassin L., Laning J., Abdi R., Langevin D.L., Phillips N.E., Shultz L.D., Brehm M.A. Human peripheral blood CD4 T cell-engrafted non-obese diabetic-scid IL2rγ(null) H2-Ab1 (tm1Gru) Tg (human leucocyte antigen D-related 4) mice: a mouse model of human allogeneic graft-versus-host disease. Clin. Exp. Immunol. 2011;166:269–280. doi: 10.1111/j.1365-2249.2011.04462.x. [DOI] [PMC free article] [PubMed] [Google Scholar]
- 41.Cohen M., Vistarop A.G., Huaman F., Narbaitz M., Metrebian F., De Matteo E., Preciado M.V., Chabay P.A. Cytotoxic response against Epstein Barr virus coexists with diffuse large B-cell lymphoma tolerogenic microenvironment: clinical features and survival impact. Sci. Rep. 2017;7:10813. doi: 10.1038/s41598-017-11052-z. [DOI] [PMC free article] [PubMed] [Google Scholar]
- 42.Fang W., Zhang J., Hong S., Zhan J., Chen N., Qin T., Tang Y., Zhang Y., Kang S., Zhou T. EBV-driven LMP1 and IFN-γ up-regulate PD-L1 in nasopharyngeal carcinoma: Implications for oncotargeted therapy. Oncotarget. 2014;5:12189–12202. doi: 10.18632/oncotarget.2608. [DOI] [PMC free article] [PubMed] [Google Scholar]
- 43.Porter C.E., Rosewell Shaw A., Jung Y., Yip T., Castro P.D., Sandulache V.C., Sikora A., Gottschalk S., Ittman M.M., Brenner M.K., Suzuki M. Oncolytic Adenovirus Armed with BiTE, Cytokine, and Checkpoint Inhibitor Enables CAR T Cells to Control the Growth of Heterogeneous Tumors. Mol. Ther. 2020;28:1251–1262. doi: 10.1016/j.ymthe.2020.02.016. [DOI] [PMC free article] [PubMed] [Google Scholar]
- 44.Holzinger A., Abken H. CAR T Cells: A Snapshot on the Growing Options to Design a CAR. HemaSphere. 2019;3:e172. doi: 10.1097/HS9.0000000000000172. [DOI] [PMC free article] [PubMed] [Google Scholar]
- 45.Guedan S., Posey A.D., Jr., Shaw C., Wing A., Da T., Patel P.R., McGettigan S.E., Casado-Medrano V., Kawalekar O.U., Uribe-Herranz M. Enhancing CAR T cell persistence through ICOS and 4-1BB costimulation. JCI Insight. 2018;3:e96976. doi: 10.1172/jci.insight.96976. [DOI] [PMC free article] [PubMed] [Google Scholar]
- 46.Budde L.E., Berger C., Lin Y., Wang J., Lin X., Frayo S.E., Brouns S.A., Spencer D.M., Till B.G., Jensen M.C. Combining a CD20 chimeric antigen receptor and an inducible caspase 9 suicide switch to improve the efficacy and safety of T cell adoptive immunotherapy for lymphoma. PLoS ONE. 2013;8:e82742. doi: 10.1371/journal.pone.0082742. [DOI] [PMC free article] [PubMed] [Google Scholar]
- 47.Diaconu I., Ballard B., Zhang M., Chen Y., West J., Dotti G., Savoldo B. Inducible Caspase-9 Selectively Modulates the Toxicities of CD19-Specific Chimeric Antigen Receptor-Modified T Cells. Mol. Ther. 2017;25:580–592. doi: 10.1016/j.ymthe.2017.01.011. [DOI] [PMC free article] [PubMed] [Google Scholar]
- 48.Gargett T., Brown M.P. The inducible caspase-9 suicide gene system as a “safety switch” to limit on-target, off-tumor toxicities of chimeric antigen receptor T cells. Front. Pharmacol. 2014;5:235. doi: 10.3389/fphar.2014.00235. [DOI] [PMC free article] [PubMed] [Google Scholar]
- 49.Tang X., Zhou Y., Li W., Tang Q., Chen R., Zhu J., Feng Z. T cells expressing a LMP1-specific chimeric antigen receptor mediate antitumor effects against LMP1-positive nasopharyngeal carcinoma cells in vitro and in vivo. J. Biomed. Res. 2014;28:468–475. doi: 10.7555/JBR.28.20140066. [DOI] [PMC free article] [PubMed] [Google Scholar]
- 50.Haque T., Wilkie G.M., Jones M.M., Higgins C.D., Urquhart G., Wingate P., Burns D., McAulay K., Turner M., Bellamy C. Allogeneic cytotoxic T-cell therapy for EBV-positive posttransplantation lymphoproliferative disease: results of a phase 2 multicenter clinical trial. Blood. 2007;110:1123–1131. doi: 10.1182/blood-2006-12-063008. [DOI] [PubMed] [Google Scholar]
- 51.Doubrovina E., Oflaz-Sozmen B., Prockop S.E., Kernan N.A., Abramson S., Teruya-Feldstein J., Hedvat C., Chou J.F., Heller G., Barker J.N. Adoptive immunotherapy with unselected or EBV-specific T cells for biopsy-proven EBV+ lymphomas after allogeneic hematopoietic cell transplantation. Blood. 2012;119:2644–2656. doi: 10.1182/blood-2011-08-371971. [DOI] [PMC free article] [PubMed] [Google Scholar]
- 52.Bollard C.M., Heslop H.E. T cells for viral infections after allogeneic hematopoietic stem cell transplant. Blood. 2016;127:3331–3340. doi: 10.1182/blood-2016-01-628982. [DOI] [PMC free article] [PubMed] [Google Scholar]
- 53.Al Hamed R., Bazarbachi A.H., Mohty M. Epstein-Barr virus-related post-transplant lymphoproliferative disease (EBV-PTLD) in the setting of allogeneic stem cell transplantation: a comprehensive review from pathogenesis to forthcoming treatment modalities. Bone Marrow Transplant. 2020;55:25–39. doi: 10.1038/s41409-019-0548-7. [DOI] [PubMed] [Google Scholar]
- 54.Volk V., Reppas A.I., Robert P.A., Spineli L.M., Sundarasetty B.S., Theobald S.J., Schneider A., Gerasch L., Deves Roth C., Klöss S. Multidimensional Analysis Integrating Human T-Cell Signatures in Lymphatic Tissues with Sex of Humanized Mice for Prediction of Responses after Dendritic Cell Immunization. Front. Immunol. 2017;8:1709. doi: 10.3389/fimmu.2017.01709. [DOI] [PMC free article] [PubMed] [Google Scholar]
- 55.Delecluse H.J., Hilsendegen T., Pich D., Zeidler R., Hammerschmidt W. Propagation and recovery of intact, infectious Epstein-Barr virus from prokaryotic to human cells. Proc. Natl. Acad. Sci. USA. 1998;95:8245–8250. doi: 10.1073/pnas.95.14.8245. [DOI] [PMC free article] [PubMed] [Google Scholar]
- 56.Mrozek-Gorska P., Buschle A., Pich D., Schwarzmayr T., Fechtner R., Scialdone A., Hammerschmidt W. Epstein-Barr virus reprograms human B lymphocytes immediately in the prelatent phase of infection. Proc. Natl. Acad. Sci. USA. 2019;116:16046–16055. doi: 10.1073/pnas.1901314116. [DOI] [PMC free article] [PubMed] [Google Scholar]
- 57.Mamonkin M., Rouce R.H., Tashiro H., Brenner M.K. A T-cell-directed chimeric antigen receptor for the selective treatment of T-cell malignancies. Blood. 2015;126:983–992. doi: 10.1182/blood-2015-02-629527. [DOI] [PMC free article] [PubMed] [Google Scholar]
- 58.Daenthanasanmak A., Salguero G., Sundarasetty B.S., Waskow C., Cosgun K.N., Guzman C.A., Riese P., Gerasch L., Schneider A., Ingendoh A. Engineered dendritic cells from cord blood and adult blood accelerate effector T cell immune reconstitution against HCMV. Mol. Ther. Methods Clin. Dev. 2015;1:14060. doi: 10.1038/mtm.2014.60. [DOI] [PMC free article] [PubMed] [Google Scholar]
- 59.Sundarasetty B., Volk V., Theobald S.J., Rittinghausen S., Schaudien D., Neuhaus V., Figueiredo C., Schneider A., Gerasch L., Mucci A. Human Effector Memory T Helper Cells Engage with Mouse Macrophages and Cause Graft-versus-Host-Like Pathology in Skin of Humanized Mice Used in a Nonclinical Immunization Study. Am. J. Pathol. 2017;187:1380–1398. doi: 10.1016/j.ajpath.2017.02.015. [DOI] [PubMed] [Google Scholar]
- 60.Volk V., Schneider A., Spineli L.M., Grosshennig A., Stripecke R. The gender gap: discrepant human T-cell reconstitution after cord blood stem cell transplantation in humanized female and male mice. Bone Marrow Transplant. 2016;51:596–597. doi: 10.1038/bmt.2015.290. [DOI] [PMC free article] [PubMed] [Google Scholar]
- 61.Salguero G., Daenthanasanmak A., Münz C., Raykova A., Guzmán C.A., Riese P., Figueiredo C., Länger F., Schneider A., Macke L. Dendritic cell-mediated immune humanization of mice: implications for allogeneic and xenogeneic stem cell transplantation. J. Immunol. 2014;192:4636–4647. doi: 10.4049/jimmunol.1302887. [DOI] [PubMed] [Google Scholar]
Associated Data
This section collects any data citations, data availability statements, or supplementary materials included in this article.