

Summary
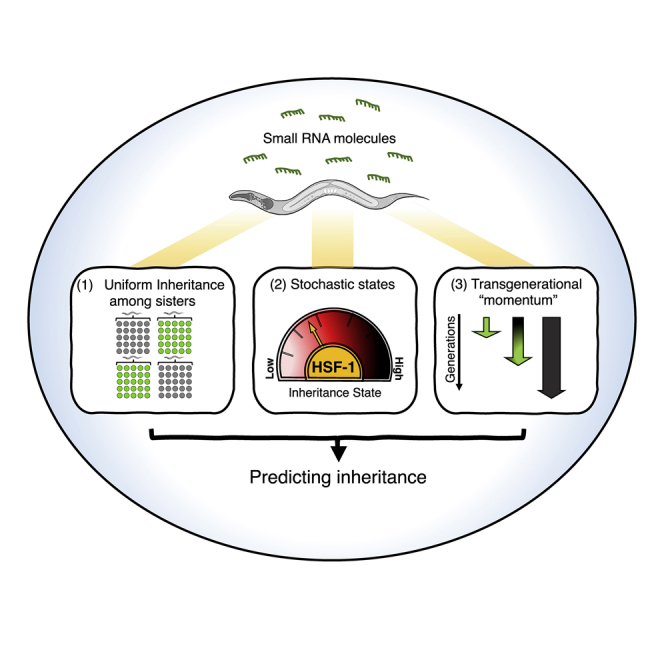
Experiences trigger transgenerational small RNA-based responses in C. elegans nematodes. Dedicated machinery ensures that heritable effects are reset, but how the responses segregate in the population is unknown. We show that isogenic individuals differ dramatically in the persistence of transgenerational responses. By examining lineages of more than 20,000 worms, three principles emerge: (1) The silencing each mother initiates is distributed evenly among her descendants; heritable RNAi dissipates but is uniform in every generation. (2) Differences between lineages arise because the mothers that initiate heritable responses stochastically assume different “inheritance states” that determine the progeny’s fate. (3) The likelihood that an RNAi response would continue to be inherited increases the more generations it lasts. The inheritance states are determined by HSF-1, which regulates silencing factors and, accordingly, small RNA levels. We found that, based on the parents’ inheritance state, the descendants’ developmental rate in response to stress can be predicted.
Graphical Abstract
Highlights
-
•
Segregation of inherited small RNA responses follows three simple principles
-
•
Mothers stochastically assume inheritance states that determine the progeny’s fate
-
•
HSF-1 defines the states and regulates silencing factors and small RNA levels
-
•
The mothers’ inheritance state can predict the progeny’s response to stress
Transgenerational RNAi responses in C.elegans exhibit distinct segregation patterns described by three simple rules.
Introduction
Even when environmental conditions are tightly controlled, isogenic Caenorhabditis elegans nematodes exhibit inter-individual differences in many traits, including developmental timing, response to stress, behavior, and lifespan (Bazopoulou et al., 2019; Burga et al., 2011; Casanueva et al., 2012; Perez et al., 2017; Rea et al., 2005; Rechavi et al., 2014; Stern et al., 2017). Moreover, worms display substantial variability in the manifestation of heritable epigenetic effects (Alcazar et al., 2008; Houri-Ze’evi et al., 2016; Vastenhouw et al., 2006). The source of this variation is currently unknown.
C. elegans regulates genes transgenerationally via heritable small RNAs that mediate RNA interference (RNAi) (Ashe et al., 2012; Gu et al., 2012; Luteijn et al., 2012; Perales et al., 2018; Rechavi et al., 2011; Shirayama et al., 2012). Heritable small RNAs regulate genes across the genome, and their inheritance is modulated by external and internal processes (Hall et al., 2013; Moore et al., 2019; Ni et al., 2016; Rechavi et al., 2011, 2014; Sims et al., 2016) and is under control of the nervous system (Posner et al., 2019). Inherited small RNAs are amplified by RNA-dependent RNA polymerases (RdRPs); this way, they avoid “dilution” and persist for multiple generations (Rechavi et al., 2011).
Exogenous introduction of double-stranded RNA (dsRNA) triggers transgenerational silencing, which typically lasts ∼3–5 generations (Alcazar et al., 2008). However, the precise number of generations varies between experiments and also depends on the gene being silenced. Repetitive activation of the RNAi machinery can extend the duration of ancestral RNAi responses (Houri-Ze’evi et al., 2016), and inherited effects are terminated earlier when the progeny are stressed (Houri-Ze’evi et al., 2019). Although, at the population level, RNAi peters out after a number of generations, some individuals continue to silence genes for a very long time, and others rapidly lose the inherited effects. Selection of individuals that silence the target gene enables maintenance of heritable RNAi indefinitely (Vastenhouw et al., 2006). Control over the duration of transgenerational silencing is achieved via an elaborate regulatory pathway (Houri-Ze’evi et al., 2016), and disabling some of the genes in the pathway (e.g., met-2, which encodes for an H3K9 methyltransferase) leads to stable inheritance (Lev et al., 2017, 2019; Perales et al., 2018). The duration of heritable RNAi is affected by competition between different small RNA species over shared biosynthesis resources (Houri-Ze’evi et al., 2016; Sarkies et al., 2013; Zhuang and Hunter, 2012). However, there are currently no models that explain why genetically identical individuals differ in their capacity to inherit epigenetic responses.
In this manuscript, we studied how heritable silencing is segregated across generations in multiple lineages of worms and tracked back the origin of the inter-individual variability in small RNA inheritance. We suggest three simple principles that together enable prediction of the fate of heritable physiological responses to environmental challenges.
Results
To study how heritable silencing is distributed in the population, we initiated a heritable RNAi response by exposing worms containing a germline-expressed single-copy gfp transgene to anti-gfp dsRNA. We scored gfp silencing in sister worms that derive from a single mother that was exposed to RNAi (STAR Methods). dsRNA was delivered by feeding to circumvent the high technical variability inherent in dsRNA injections and to avoid the stress involved in the injection process (we recently described the dramatic effects of different types of stress on small RNA inheritance dynamics; Houri-Ze’evi et al., 2019; STAR Methods). As expected, 100% of the worms that were directly exposed to RNAi (the P0 generation) silenced gfp. We then examined how these isogenic sisters pass on the silencing response transgenerationally. For this purpose, we used two different experimental setups. In the first set of experiments, we tracked silencing across multiple generations by propagating a few randomly selected individuals from each lineage in every generation (on separate plates; Figure 1A; STAR Methods). In the second set of experiments, we examined inheritance in individual worms by monitoring heritable silencing for one generation and scored all the progeny groups of the entire synchronized RNAi-exposed population (Figure 1B; STAR Methods). Importantly, in both types of experiments, the “P0 mothers” all derived from a single mother and were exposed to RNAi together (they shared the same plate and experienced the same conditions; STAR Methods). In contrast to these experiments, where individual lineages of worms were examined for transgenerational inheritance, in the past, RNAi experiments were traditionally performed by exposing populations of worms to RNAi followed by random sampling of worms in every generation (e.g., Buckley et al., 2012; Houri-Ze’evi et al., 2016, 2019; Lev et al., 2017).
Figure 1.

Inheritance Patterns of an Anti-gfp Silencing Response Reveal Striking Uniformity in Heritable Silencing in Worms that Are Derived from the Same Mother
(A) Four P0 mothers, derived from one single ancestor, initiate an anti-gfp RNAi response. At each generation, the inheritance phenotype of the entire synchronized progeny of each mother is scored, and three worms are randomly selected to generate the next generation. (i) Displayed are the proportions of worms that still inherit the anti-gfp silencing response (dark circles) and worms that lost the silencing response (green circles) in each progeny group. (ii) Displayed is the percentage of worms that re-express the target gene (gfp) in each lineage across generations (dotted lines) and the percentage of re-expressing worms in all examined lineages together (solid black line). The number of worms in each group of progeny ranged from 25–90. Mean, 43; median, 41.5. ∗In group 3.2., only 7 worms were examined because of partial sterility of the mother.)
(B) Multiple (41) synchronized P0 mothers, derived from one single ancestor, initiate an anti-gfp RNAi response. In these sets of experiments, the in utero exposure of the F1 generation to the dsRNA trigger was further minimized. For further details regarding synchronization and exposure times, see STAR Methods.
We analyzed the results to identify underlying principles that could explain why isogenic worms differ from one another in the degree of small RNA-mediated silencing they inherit and to study how the effects are segregated across the population. When comparing multiple groups of progeny that were derived from different RNAi-treated P0 mothers, we observed strong differences in the dynamics and penetrance of heritable silencing between the different lineages (Figures 1A and 1B). We wondered whether the differences between the lineages arise early, when the heritable response is initiated, or later, in the generations that maintain the effect transgenerationally.
Rule 1: The Silencing Response Each Mother Initiates Is Distributed Evenly among Her Descendants
The first rule that emerged from analyses of multiple lineages is that, in every generation, individuals descending from a single RNAi-treated worm exhibit striking uniformity in heritable silencing levels. Heritable silencing usually peters out, and, as generations pass, silencing levels change, but in every generation, all sisters that derive from the same RNAi-treated ancestor display the same degree of silencing. We found that the very small differences in heritable silencing that might be observed between F1 sisters are canceled in later generations (Figure 1A). In a second set of experiments, we further controlled for differences in in utero exposure of the F1 progeny to the external dsRNA trigger (STAR Methods) and were able to eliminate heritable variability even in the F1 generation. Similar to the first set of experiments, we observed that all progeny that derive from the same RNAi-exposed mother exhibit the same inherited response. Still, progeny that derive from different isogenic RNAi-exposed mothers are strikingly different in their inheritance response (Figures 1A and 1B). Finally, summing up the inheritance responses across all the individual lineages recapitulates the dynamics of RNAi inheritance that are observed in typical population-based assays (Figure 1A). Thus, by examining inheritance across lineages that originate in single mothers, we revealed that the variability in inheritance dynamics that is observed in the population can be attributed to differences that begin in the RNAi-exposed mothers.
Rule 2: Each Mother Stochastically Assumes a Global, Non-target-specific “Inheritance State”
Why do isogenic mothers initiate different heritable RNAi responses? We reasoned that this inter-individual variability could arise because each mother was exposed to different amounts of dsRNA or, more interestingly, because the RNAi inheritance machinery in isogenic mothers can assume different internal “states.” Despite extensive efforts to minimize potential differences in exposure of individual worms to the dsRNA trigger (STAR Methods), we still observed remarkable variability in anti-gfp RNAi inheritance between lineages. It is impossible to completely rule out minimal differences in exposure to anti- gfp dsRNA; however, the observed differences between P0-derived lineages are dramatic (full expression in some, complete silencing in others) and are difficult to explain by minute exposure differences. We therefore examined whether the variability could instead be explained by internal inter-individual differences in the overall activation state of each worm’s RNAi machinery.
To study the internal state of the RNAi machinery, we analyzed the silencing patterns of a germline-expressed mcherry transgene that is spontaneously silenced by endogenous small RNAs independent of exogenous dsRNA (Zhang et al., 2018). As we observed when examining dsRNA-induced anti-gfp silencing, we found that isogenic worms vary in their tendency to silence the mcherry transgene. mcherry silencing is inherited over generations and accumulates over time so that repeated random sampling of worms results in increasingly homogeneous populations in which all worms silence the transgene (Figure S1; STAR Methods). Variation in silencing occurred in every generation anew, and, as long as the accumulation of silencing was not complete, the mothers that were randomly selected could generate progeny with a range of silencing levels, including highly and lowly expressing worms (Figure S1).
Figure S1.

Stochastic Silencing of the mcherry Transgene across Lineages and in Comparison with GFP Expression in the Absence of anti-gfp RNAi, Related to Figure 2
A. Top panel: a scheme of examination of mcherry stochastic silencing across lineages (see STAR Methods). Bottom: mCherry expression levels in each examined worm across the different lineages. Scale represent high (red) and low (dark) mCherry expression levels. Each square represents a measurement of a single worm. Few groups were omitted from the analysis due to contamination or premature death.
B. Paired measurements of GFP and mCherry expression in the absence of anti-gfp RNAi treatment in worms which bear the two transgenes. Each dot represents the GFP and the mCherry measurements of a single worm. Slight negative correlation is observed between the two expression levels (Spearman correlation. r = −0.467 p value < 0.0005)
The inter-individual variability in mcherry silencing cannot be ascribed to differences in exposure to exogenous dsRNA because silencing of this transgene does not depend on exogenous dsRNA. Therefore, we hypothesized that at each generation every worm stochastically assumes a general internal silencing state that manifests in differences in endogenous silencing of mcherry, and which might also explain the observed differences in the heritable dsRNA-induced response against gfp. Thus, we examined whether the worms that express mcherry at the parental generation are also less susceptible to anti-gfp heritable silencing. To test this hypothesis, we generated worms that contain gfp and mcherry transgenes, which are integrated into different genomic locations on different chromosomes (containing the same promoter and 3′ UTR; Figure 2A and STAR Methods). For these experiments, we selected worms in which the mcherry transgene is still expressed and varies in the population and exposed their progeny (hereafter called the P0 generation) to anti-gfp dsRNA. We then examined whether the levels of spontaneous endogenous small RNA-mediated silencing of mcherry could predict the fate of the dsRNA-initiated RNAi inheritance against gfp (Figures 2B and 2C). We found that mothers that spontaneously silence the mcherry transgene induce stronger and more penetrant heritable gfp-silencing responses across generations compared with their sisters (Figure 2D). Thus, the two silencing phenomena are coordinated, and their observed variability is shared. We conclude that each mother assumes a general, non-target-specific “small RNA inheritance state”. Importantly, the mother’s silencing state in itself is not inherited (in each generation, we observe re-distribution of silencing states; Figure S1). In addition, although the spontaneous silencing of the mcherry transgene predicted the strength of the dsRNA-triggered anti-gfp RNAi inheritance, the expression of the two transgenes in the absence of anti-gfp dsRNA-induced RNAi was not positively correlated (Figure S1). Thus, the second rule we uncovered is that isogenic mothers stochastically assume different internal inheritance states that determine the fate of inherited responses that propagate and segregate across generations.
Figure 2.

Inter-individual Variability in Anti-gfp Small RNA Inheritance Can Be Predicted by the Rate of Spontaneous mCherry Silencing at the Parental Generation
(A) Schemes of genomically integrated single copies of the gfp and mCherry transgenes (Sapetschnig et al., 2015; Zeiser et al., 2011; STAR Methods).
(B) Experimental scheme. Worms that bear both transgenes were subjected to anti-gfp RNAi treatment and scored for spontaneous silencing of the mcherry transgene at the generation of exposure to RNAi. Experiments were done in triplicates, with each replicate of P0 mothers derived from one single ancestor. Inheritance of anti-gfp silencing response was scored in the next generations separately for each P0-derived lineage.
(C) Composite fluorescence microscope images of sister worms which are exposed to anti-gfp RNAi. While all mothers completely silence the gfp transgene upon exposure to RNAi (the green signal in the pictures stems from gut autofluorescence), the mcherry transgene is spontaneously silenced to different degrees in sister worms.
(D) Matched scores of parental mCherry expression and inheritance of anti-gfp silencing across generations. Each individual P0 mother was examined for mCherry expression levels at the parental generation and ranked based on its relative expression compared with its sister worms. Presented are the log10 expression levels (corrected total fluorescence [CTF]) of mCherry for each mother and the proportion of GFP silencing (dark gray) versus re-expressing (green) progeny in each lineage across generations.
(E) Visual summary of all anti-gfp RNAi inheritance lineages examined in this study (>20,000 worms) and the inheritance rules that emerge from the data. Data are presented as inheritance “sequence”: the course of silencing/expression across generations and the number of worms that show the specific sequence of inheritance in each lineage (e.g., an inheritance sequence in a lineage could be P0: silencing > F1: silencing > F2: re-expression > F3: re-expression). Each colored section of the inner circle represents one separate lineage originating from an individual P0 mother. The outer circles represent the consecutive generations of the lineages and the scored silencing phenotype for the specified generation. OFF, full silencing of gfp; ON, re-expression of GFP.
Rule 3: The Likelihood that an RNAi Response Would Continue to Propagate across a Lineage Increases the More Generations the Response Lasts
Overall and throughout the different experiments carried out in this study, we examined inheritance in lineages composed of more than 20,000 worms. The third rule emerged from analyzing the “transition rules” of all silencing responses across multiple generations and experiments. Systematic analysis of the anti-gfp inheritance data revealed that the more generations a heritable response lasts, the higher the chances that it will be transmitted to the next generation. In summary, we observed a transgenerational silencing “momentum”: 46.5% of the silencing worms kept silencing the gfp transgene at the transition from the first to the second generation, 80.5% at the transition from the second to the third, and 92.6%–100% starting from the third generation (Figure 2E).
Characterizing the Different Inheritance States
What are the molecular mechanisms the three rules reflect? We discovered that the inheritance state of the mother determines the fate of the silencing response for the entire progeny across generations. To understand what underlies the inheritance states that different mothers assume, we characterized the differences in gene expression and small RNAs in worms that assume different RNAi inheritance states. We isolated four sister worms that derive from a single mother and allowed each of these worms to lay eggs for 6 h on separate plates. The worms exhibit a range of silencing levels, and we used a COPAS Worm Sorter (Pulak, 2006) to sort progeny (∼80 synchronized worms) that either strongly expressed or spontaneously silenced mcherry in each of these 4 groups of progeny (25th top and bottom percentiles; see scheme in Figure 3A). We sequenced small RNAs and mRNA from the sorted worms to investigate what underlies the different internal inheritance states. We found that the overall endogenous small RNA levels are reduced in worms that spontaneously silence the mcherry transgene (Figure 3B). The worm has a complex pool of small RNAs composed of many different endogenous small RNA species, and production of some small RNA species comes at the expense of others as different small RNA pathways compete over limited shared biosynthesis machineries (Zhuang and Hunter, 2012). It is therefore possible that the decrease in endogenous protein-coding-targeting small RNAs in mcherry-silencing worms makes more small RNA-processing machinery available for additional endogenous or exogenous small interfering RNA (siRNA) species. To study these differences further, we examined whether the mRNA levels of worms of opposing inheritance states might explain the varying silencing capacities that are observed in worm populations.
Figure 3.

The Transcriptomic Changes that Underlie the Different Inheritance States in Isogenic Sister Worms
(A) The experimental design for collecting tightly synchronized, isogenic sister worms bearing different inheritance states (STAR Methods).
(B) Global changes in expression levels of small RNA species in silencer versus non-silencer worms (χ2 test). The y axis represents the normalized total number of reads for each indicated type of small RNA species. Each coupled measurement of progeny (silencer and non-silencer sisters) is marked with a dotted line. See STAR Methods for full details regarding analyses. ∗∗∗ represents p value < 0.001.
(C) Volcano plot depicting the differences in expression levels of mRNAs in silencer versus non-silencer worms. Each dot represents expression of a single gene. The y axis represents -log10 of adjusted p values (correction for multiple comparisons). The x axis represents the fold change in mRNA expression between silencer and non-silencer worms.
(D) Gene Ontology (GO) enrichment of genes that typify the two states of inheritance (Angeles-Albores et al., 2018).
See also Figure S2.
Although we sequenced tightly synchronized isogenic progeny that were derived from a single mother, we found that 349 genes are differentially expressed between sisters that strongly express or silence the mcherry transgene (Figure 3C). Tellingly, genes that exhibited altered expression in the two states of inheritance we examined were found to be significantly enriched for immune and defense response processes (defense response, fold enrichment = 6.4, q = 3.4 × 10⁻¹⁵; immune system process, fold enrichment = 6.7, q = 4.1 × 10⁻¹²) (Figure 3D; Figure S2). RNAi in worms also serves to protect against viruses and other selfish elements (Fischer et al., 2013; Lu et al., 2005). The enrichment we detected for defense and immune functions might hint at the existence of a coordinated gene expression program and could echo the evolutionary origins of small RNAs as part of the worm’s immune system (Yan and Chen, 2012). Among the genes that differentiate the inheritance states, we identified irg-1 (immune response gene 1), a gene that has a critical role in immunity and specifically in the response to pathogenic Pseudomonas (PA14) (Dunbar et al., 2012). We used a fluorescent reporter to quantify Pirg-1::GFP levels in individuals to validate the sequencing results. We found that irg-1 indeed shows variable pathogen-induced transcription levels in isogenic synchronized individuals (Figure S3).
Figure S2.

GO Term Enrichment and STRING Representation of Genes that Typify the Two States of Inheritance, Related to Figure 3
A. Gene ontology (GO) enrichment of genes which are upregulated in silencer and non-silencer worms. Presented are the top 20 terms for each dataset which display FDR < 0.05 (only 11 terms pass this criterion in the dataset of genes which are upregulated in non-silencers).
B. STRING representation of the protein-protein interactions between the genes which are differentially expressed in the two states of inheritance. Indicated is the expected number of interactions, the observed number, and a significance value for enrichment of interactions (Fisher’s exact test followed by a correction for multiple testing).
Both panels were created using ShinyGO v0.61 (Ge and Jung, 2018).
Figure S3.

Transcriptional Changes that Typify the Different Inheritance States, Related to Figure 3
A. Inter-individual variability in the expression of an irg-1 transcriptional reporter, one of the genes which were found to vary between the different inheritance states. Expression was measured in progeny of individual worms following 8 hours of exposure to the pathogenic bacterium Pseudomonas aeruginosa (PA14) (see STAR Methods).
B. Examination of variability and co-expression of the genes that typify the two inheritance states in gene expression profiles of 41 individual worms (Perez et al., 2017).
i. Standard deviation of residual gene expression of the genes that typify the different states of inheritance (“States Genes”) across all individuals compared to residual gene expression of the rest of the genes. Boxplot represents the 25%–75% percentiles of the data, whiskers represent 5%–95%, middle line represents the median (Mann-Whitney test).
ii. Absolute averaged and median values of residual gene expression in the “States Genes” and in randomized groups of genes of the same size. Each dot represents the averaged value (top) or the median value (bottom) of residual gene expression in an individual worm. Higher absolute averaged levels indicate co-expression: the absolute averaged levels increase as many genes share the same directionality of residual gene expression and decrease toward 0 when directionalities are inconsistent across the tested gene (Wilcoxon test).
∗∗∗∗ represents p value < 0.0001.
C. The heat-shock protein genes hsp-16.2 and hsp-16.41 share the same promoter and their expression levels change together in the two different states of inheritance. Presented are normalized mRNA-seq reads along the two genes in the four matched groups of silencer and non-silencer worms. Grey areas represent annotated exons locations.
D. A summarizing table of genes that share their promoter region and exhibit shared altered expression (either up or downregulation) in the different states of inehritance. The promoter region is considered to be shared if the two genes have a shared transcription start site upstream region (~2Kbp upstream of the TSS) either in the same or the opposite orientation (e.g., panel C).
E. Total normalized (reads per million) levels of small RNA reads which possess 3′ polyuridylation. Heritable small RNAs which are loaded by Argonautes with opposing functions (e.g., HRDE-1-bound versus CSR-1-bound small RNAs) can differ in the levels of their 3′ polyuridylation (van Wolfswinkel et al., 2009). An analysis of 3′ polyuridylation levels in small RNA pools of worms that assume the different inheritance states did not reveal consistent differences in small RNA loading (see STAR Methods)
Next we examined individual worms that were selected randomly and not sorted based on their inheritance state to see whether the 349 state-typical genes display inter-individual variability even in such populations. We analyzed the gene expression profiles of 41 synchronized individuals (Perez et al., 2017) and found that the genes that differentiate the inheritance states show higher inter-individual variability in their expression (Figure S3). Furthermore, we found that the genes that define each state also tend to change together at the single-worm level (Figure S3).
A Coordinated Transcriptional Switch
We found that genes that show altered expression between different states of inheritance include multiple genes that function together in specific regulatory pathways (Figure S2; Table S1). Among these genes, we identified hsp-16.2, a heat shock protein whose variable activation upon heat stress is a classic example of stochastic gene expression differences between isogenic worms. Non-genetic variable expression of hsp-16.2 has been shown to predict the worm’s lifespan and stress resistance (Rea et al., 2005). Interestingly, the promoter of hsp-16.2 is shared (in the opposite orientation; Figure S3) with hsp-16.41, another heat shock protein. We found that hsp-16.2 and hsp-16.41 show similar transcriptional changes between states (Figure S3), indicating that the observed variability might arise from variation at the level of transcriptional regulation. Closer examination revealed multiple pairs of genes that are regulated by a shared promoter and show coordinated gene expression changes between different inheritance states (Figure S3).
We therefore looked for transcriptional regulators that might synchronize distinct RNAi inheritance states. The existence of multiple heat shock proteins that vary between the different inheritance states and the unexpected enrichment for cuticle-structure genes (Figure 3D) pointed us toward heat shock factor 1 (HSF-1)-dependent regulation (Brunquell et al., 2016).
HSF-1 is a highly conserved transcription factor and a master regulator of proteostasis whose activity is important under stressful and non-stressful conditions (Li et al., 2016). HSF-1 has been shown recently to be involved in transcriptome remodeling of non-coding RNA pools in response to heat shock in C. elegans (Schreiner et al., 2019) and to account for cell-to-cell variation and phenotypic plasticity in budding yeast (Zheng et al., 2018).
To directly test the involvement of HSF-1 in generating variable inheritance states, we first examined whether individual worms display variability in HSF-1 expression. In accordance with previous observations showing that HSF-1’s activity is regulated at the post-translational level (Huang et al., 2018), we did not detect variability in hsf-1 mRNA levels. Instead, we used a single-copy integrated GFP translational reporter to monitor HSF-1 aggregation because it has been shown recently in C. elegans that HSF-1 activity corresponds to formation of nuclear stress granules (Morton and Lamitina, 2013). We found that the number of HSF-1 granules and HSF-1 expression intensity vary in the syncytial germline nuclei of isogenic and tightly synchronized sister worms (Figure 4A).
Figure 4.

HSF-1 Regulates the Inheritance States and Suppresses Endogenous Small RNA Pathways
(A) A translational reporter of HSF-1 reveals inter-individual variation in the formation of HSF-1 stress granules in the germline. Each dot represents GFP levels (y axis) in one syncytial nucleus. Data were collected from 10 separate and tightly synchronized individual worms (x axis).
(B) Genes that are upregulated in silencer worms (right) overlap with genes that are positively regulated by HSF-1 (up in HSF-1High worms and down in HSF-1Low worms). Genes that are upregulated in non-silencer worms (left) overlap with genes that are negatively regulated by HSF-1 (down in HSF-1High worms and up in HSF-1Low worms). Values on the x axis represent the number of overlapping genes. Hypergeometric test.
(C) Variability in spontaneous silencing of the mcherry transgene is abolished in HSF-1High and HSF-1Low worms. In HSF-1High worms, we observe complete silencing of the mcherry transgene, whereas in HSF-1Low worms, we observe strong expression in all worms. Wild-type groups represent typical variable expression of the mcherry transgene. Each dot represents a measurement of total fluorescence in one individual worm (Mann-Whitney test).
(D) HSF-1 suppresses multiple small RNA and epigenetic factors. Presented are changes in expression of 310 known small RNA and epigenetic factors in HSF-1High and HSF-1Low worms. “Overlap” represents small RNA and epigenetic factors that show consistently altered expression in both datasets (e.g., down in HSF-1High and up in HSF-1Low worms). Hypergeometric test.
(E) Small RNA and epigenetic factors that are suppressed by HSF-1 are part of multiple small RNA pathways in the worm.
(F) Targets of small RNAs that show significantly altered expression in the different states of inheritance are enriched (Yang et al., 2016) for multiple endogenous small RNA pathways, including the same pathways that are suppressed by HSF-1.
(G) Global changes of different small RNA species in silencer versus non-silencer worms (χ2 test). The presented species correspond to the small RNA pathways that show enrichment for targets of state-dependent differentially expressed small RNAs (F). The y axis represents the normalized total number of reads for each indicated type of small RNA species. Each coupled measurement of silencer and non-silencer sisters is marked with a dotted line.
See STAR Methods for full details regarding analyses.
∗∗∗ represents p value < 0.001 and ∗∗∗∗ represents p value < 0.0001.
To understand how HSF-1 regulation corresponds to the variability in inheritance states, we analyzed mRNA sequencing data of worms that overexpress hsf-1 and worms with reduced hsf-1 levels (hereafter called HSF-1High and HSF-1Low, respectively) (Brunquell et al., 2016; Sural et al., 2019). The results revealed a striking overlap between HSF-1-regulated genes and genes that define each inheritance state (Figure 4B). We found that genes that are upregulated in silencers are also upregulated in HSF-1High worms. In contrast, genes that are upregulated in non-silencers are upregulated in HSF-1low worms (Figure 4B).
To investigate whether HSF-1 plays a role in constituting the different inheritance states, we tested how changes in HSF-1 activity affect silencing of the mcherry transgene, which was used to differentiate silencers from non-silencers. We examined the silencing states in HSF-1High and HSF-1Low worms (HSF-1 overexpression and reduction of function, respectively) by measuring the rate and variability of spontaneous mcherry silencing. We found that, in HSF-1High and HSF-1Low worms, the variability in silencing between isogenic sisters (namely, the existence of both mcherry silencing and non-silencing worms) is completely abolished, and in each group, all worms exhibited uniform levels of the mcherry transgene and acquired the same silencing state (Figure 4C). Specifically, all HSF-1High worms were silencers and, thus, exhibited complete silencing of the mcherry transgene; in contrast, all HSF-1Low worms were non-silencers and exhibited strong expression of the mcherry transgene (Figure 4C). These results are in agreement with the observed overlap in gene expression changes between HSF-1High and silencer worms (Figure 4B, right), and HSF-1Low and non-silencer worms (Figure 4B, left). Together with previous evidence showing that HSF-1 sculpts the pools of different endogenous small RNAs (Schreiner et al., 2019), these observations suggest that HSF-1 can tune the function of the silencing machinery.
HSF-1 is a transcription factor that controls the expression of many genes. Gene Ontology (GO) enrichment analysis of genes that are differentially regulated in HSF-1High and HSF-1Low worms revealed an enrichment for “gene silencing by RNA”. Examination of a comprehensive list of 310 small RNA and epigenetic factors (an updated version of the list used here; Houri-Ze’evi et al., 2016; Table S2) revealed that 22.9% (71 of 310, 4.69-fold enrichment, p value = 1.6 × 10⁻²⁸, Figure 4D) of the examined small RNA and epigenetic factors are consistently suppressed by HSF-1 (namely, these genes were downregulated in HSF-1High and upregulated in HSF-1Low worms). In contrast to the many silencing-related factors that are suppressed by HSF-1, only 3 of 310 (less than 1%, 4.73 times less than expected, p value = 0.0003, hypergeometric test) of the examined epigenetic factors showed activation by HSF-1 (Figure 4D and Table S2). This suggests a specific role of HSF-1 in suppressing components of small RNA functions and epigenetic processes. To study how HSF-1-mediated suppression can coordinate the inheritance states and regulate the RNAi machinery, we examined the small RNA and epigenetic factors that show altered expression in HSF-1High and HSF-1Low worms. We found that multiple Argonaute genes (ppw-1, hrde-1, wago-1, wago-2, C14B1.7, prg-1, C04F12.1, ergo-1, C06A1.4, and alg-5) (Figure 4E; Grishok, 2013) are suppressed by HSF-1. These HSF-1-suppressed Argonautes are at the core of various endogenous small RNA (endo-siRNA) pathways; they bind and execute the functions of “primary” 26G small RNAs, microRNAs, PIWI-interacting small RNAs, and “secondary” RdRP-amplified 22G small RNAs (Billi et al., 2014; Figure 4E). In addition, we found that HSF-1 suppresses numerous silencing factors that act upstream and downstream in the pathways of the identified Argonaute proteins (Figure 4E). Notably, among these HSF-1-supressed silencing genes, we found a strong representation of endogenous small RNA factors that have been specifically shown before to compete with and restrict exogenous dsRNA-mediated RNAi and transgene silencing (e.g., eri-1, eri-3, and eri-9. Mutants in which these genes are disabled exhibit an enhanced RNA interference phenotype [Billi et al., 2014; Figure 4E]). Further, we found that germ granule components that control the potency, duration, and selectivity of small RNA inheritance were also suppressed by HSF-1 (e.g., meg-3, meg-4, and deps-1; see the full list in Figure 4E; Lev et al., 2019).
Because our results suggest that, in HSF-1High worms, the endogenous silencing machinery is suppressed, we next wanted to find out whether the corresponding endogenous small RNA pathways are downregulated in silencer worms. We analyzed small RNA changes in worms with different inheritance states and found 320 genes that had significantly different levels of endo-siRNAs antisense to them. Of these, most of the targets (229 of 320, 71.6%) had reduced levels of endo-siRNAs antisense to them in silencer compared with non-silencer worms. Analyses of gene set enrichment of these genes (Yang et al., 2016) again revealed enrichment of multiple different endo-siRNA pathways, including the same pathways we found to be suppressed by HSF-1 (Figure 4F; Table S3). We then quantified the total endo-siRNA levels in the different endogenous small RNA pathways and found consistent downregulation of overall endo-siRNA levels in silencer compared with non-silencer worms (Figure 4G). Thus, we conclude that inheritance states are controlled by the conserved transcription factor HSF-1, which suppresses multiple endogenous small RNA factors and the corresponding small RNA populations.
Predicting the Progeny’s Responses Based on the Parent’s Inheritance State
To further explore how small RNA inheritance is affected by the silencing states isogenic worms assume, we built a minimal mathematical model that expands on our previous work (Houri-Ze’evi et al., 2016). Before, we identified competition over resources of synthesis and utilization of small RNAs as a major force that drives small RNA inheritance dynamics. We suggested that this competition eventually leads to termination of small RNA inheritance after several generations. Specifically, we modeled the competition between exogenous and endogenous small RNAs as determining the duration of transgenerational RNAi at the population level. We updated the model according to the principles discovered in this manuscript and, in particular, by analyzing inheritance dynamics at the resolution of individual worms.
We found that two different regimes—or possible outcomes—of inheritance dynamics emerge from including the three inheritance principles in the model (Figures 5A and 5B; Data S1; STAR Methods). In one scenario, all of the population eventually re-expresses the silenced gene (monostability; Figure 5B). In the other scenario, some lineages eventually re-express the target gene, whereas others continue to stably silence it (bistability, as seen here experimentally; Figures 2E, 5B, and 5C). Based on the updated components of the model and their set of relationships in the system, we simulated the dynamics of silencing in isogenic worm populations and the way the fate of the silencing is affected by the parental distribution of inheritance states (Figure 5D). Changing the parental distribution of inheritance states while leaving all other parameters fixed (e.g., the same mean) can dramatically alter the inheritance dynamics across the population, leading to inheritance that peters out quickly or is fixed in most of the worms (Figure 5D). Thus, a simple model based on a minimal set of parameters, updated to include the three inheritance principles, recapitulates the inheritance dynamics typically observed in the lab. Importantly, this model shows that the inheritance state of the parents that initiate silencing, and not the inheritance states in the next generations, can determine the fate of the heritable RNAi response.
Figure 5.

Predicting the Progeny’s Heritable Response Based on the Parental Inheritance State
(A) The scheme and equation of the updated mathematical model to describe small RNA inheritance dynamics and the three rules of inheritance. Blue arrows indicate interactions that appear in the previous model (Houri-Ze’evi et al., 2016) and were omitted from the current version (STAR Methods).
(B) Model parameter scan. The model is bistable for the high rescaled amplification coefficient and high RNAi replication cooperativity (yellow region), leading to eventual re-expression of the target gene or long-lasting silencing, depending on the parental inheritance state (STAR Methods). Other parameter combinations lead to monostability, with all of the population eventually re-expressing the target gene (blue region).
(C) The silencing response (z) against the target gene (left) and re-expression of the target gene across generations (right). Different colors represent different initial states of the inheritance machinery (y). The purple trajectory remains silenced, whereas other trajectories transition from silencing to re-expression of the target gene at different generations. A dashed line represents the threshold for detection of re-expression (STAR Methods).
(D) A simulated parental inheritance state distribution y (top panels) determines the distribution of the silencing response z across generations (center panels) and the percentage of worms that re-express the target gene (bottom panels). Although other parameters remain constant in the different simulations (), changing the distribution of the parental inheritance state () leads to altered inheritance dynamics across generations.
(E) The worms’ response to starvation stress can be predicted by examination of the inheritance state at the parental generation prior to starvation (STAR Methods). The progeny of non-silencer worms show pronounced variability and developmental delay following recovery from 8 days of starvation. Left panel: length measurements (Hakim et al., 2018) 60 h after transferring the worms to plates with food. Differences in variance were assessed by F test. Right panel: frequency of developmentally delayed worms (arrest as L1/L2) 48 h after transferring the worms to plates with food (χ2 test). ∗∗∗ represents p value < 0.001 and ∗∗∗∗ represents p value < 0.0001.
Finally, to understand whether the different inheritance states could predict physiologically relevant transgenerational inheritance responses, we subjected worms to starvation. Survival during long periods of starvation requires HSF-1 (Roux et al., 2016). In the absence of food, worms arrest their development at the first larval stage; starvation alters the transgenerational pool of heritable small RNAs (Houri-Ze’evi et al., 2019; Rechavi et al., 2014) and leads to multiple phenotypic changes in the progeny (Jobson et al., 2015; Rechavi et al., 2014; Webster et al., 2018). Interestingly, isogenic worms produce different transgenerational responses following starvation (Jobson et al., 2015), and these responses correspond to the developmental delay rate of the worms following recovery from starvation. We hypothesized that the inheritance states of the parents could predict the heritable phenotypic responses to starvation. We found that starved progeny of mothers that silence the mcherry transgene did not show pronounced variability in recovery time following starvation, as measured by size distribution and the presence of L1/2-arrested worms in the population (Figure 5E). In contrast, progeny of mothers that express the mcherry transgene exhibited high variability in recovery time following starvation and higher rates of developmental delay (Figure 5E). Overall, these results indicate that the mother’s inheritance state predicts multiple heritable small RNA-related phenotypes: transgenerational dsRNA-induced silencing, spontaneous transgene-silencing, and the inherited outcomes of stress responses.
Discussion
We observed three principles that enable prediction of the fate of particular transgenerational small RNA responses. It is important to clarify that, although gene- and trigger-specific RNAi responses are inherited and can be “fixed” over generations, the global RNAi inheritance state of the worm is not in itself heritable, nor can it be fixed; the inheritance state that is assumed anew in every generation by each worm only affects the course of new gene- and trigger-specific RNAi responses this individual worm transmits to its progeny. The global inheritance state of the next generation is not dictated by the inheritance state of the parents, at least not in any trivial manner.
Different individuals might assume a range of intermediate inheritance states. To identify the underlying mechanisms, we studied the molecular characteristics that typify strong silencers and non-silencer worms (25th top and bottom percentiles). This allowed revealing that the difference between states corresponds to the activity level of HSF-1. Our analyses demonstrate that multiple endo-siRNA factors are suppressed by HSF-1 and that, in silencer worms (characterized by high HSF-1 activity), small RNA molecules that are controlled by these endo-siRNA factors are downregulated.
Interestingly, we found that the genes that have altered expression levels in isogenic worms that assume different states show enrichment for the neuropeptide signaling pathway (fold enrichment = 3.3, q value = 0.027) (Figure 3D). In-depth tissue enrichment analysis (Kaletsky et al., 2018) revealed that the genes that differentiate the states are indeed predicted to be enriched for expression in the nervous system (Figure S4). We recently showed that small RNAs that are synthesized in neurons can affect expression of target genes in the germline and in the next generations (Posner et al., 2019). Specifically, we reported that the saeg-2 gene is strongly silenced in the germline in response to synthesis of small RNAs in neurons and that this response is transmitted transgenerationally and controls the progeny’s behavior (Posner et al., 2019). Using single-molecule fluorescence in situ hybridization (smFISH), we found that HSF-1 affects saeg-2 silencing in the germline (Figure S4). It would be interesting to study whether the worm’s nervous system, perhaps via HSF-1 regulation, can control the state of the small RNA inheritance system.
Figure S4.

Genes that Typify the Inheritance States Show Predicted Enrichment for Nervous System Expression, and HSF-1 Regulates Expression of a Gene that Is Regulated by Neuronally Produced Small RNAs, Related to Figures 3 and 5
A. Tissue-enrichment analysis for genes which are up or downregulated between the two states of inheritance (Kaletsky et al., 2018). Red color represents higher predicted gene expression in the indicated tissue.
B. Quantifications of saeg-2 transcripts using smFISH in wild-type, hsf-1 (sy441) and rde-4 (ne299) worms. Each dot represents one quantified worm. P values were determined by Kruskal-Wallis test with Dunn’s post hoc correction for multiple comparison and asterisks represent p values in comparison to wild-type. ∗∗∗∗ represents p value < 0.0001.
Theoreticians argue whether there are any real “rules” in biology (in contrast to physics, for example; Beatty, 1993). Indeed, even Mendel’s “laws” have numerous exceptions. Regardless, we believe that our observations illuminate deep patterns and could be shared across different inheritance systems because we show that epigenetic inheritance is not purely chaotic; transgenerational small RNA responses spread across lineages in a predictable manner. It is certainly possible that exceptions to our rules will be discovered, but we hope that, by explicitly outlining the three principles that emerged from the data, we provide the means to test new hypotheses and potentially advance our understanding of this new and exciting mode of inheritance.
Finally, it is still unclear whether and how epigenetic inheritance contributes to the process of evolution. Variation is the raw material of evolution, and our results suggest that, similar to the mechanisms that evolved to generate genetic variation (e.g., random assortment of chromosomes and recombination), the innate mechanisms that give rise to variability in small RNA inheritance could increase inter-individual differences on which selection can act.
STAR★Methods
Key Resources Table
| REAGENT or RESOURCE | SOURCE | IDENTIFIER |
|---|---|---|
| Chemicals, Peptides, and Recombinant Proteins | ||
| Levamisole hydrochloride | Sigma | L0380000 |
| Trizol Reagent | Life Technologies | 15596026 |
| Phenol Chloroform Isoamyl | Sigma | P2069 |
| Heavy Phase Lock tube | QuantaBio | 23028330 |
| Ultra Pure Glycogen | ThermoFisher | 10814010 |
| RNA 5′ Polyphosphatase | Epicenter | RP8092H |
| NEBNext® Multiplex Small RNA Library Prep Set for Illumina | New England Biolabs | E7300 |
| TapeStation screen tapes | Agilent | 5067-5582 |
| 5067-5588 | ||
| TapeStation reagents | Agilent | 5067-5583 |
| 5067-5589 | ||
| E-Gel 4% agarose | Life Technologies | G401004 |
| MinElute DNA purification kit | QIAGEN | 28006 |
| RNase free Nuclease-free water | Ambion | AM9932 |
| Sodium Azide | Sigma | S2002 |
| SMART-Seq v4 Ultra Low Input RNA Kit | Nextera | 634890 |
| Nextera XT DNA Library Preparation Kit | Illumina | FC-131-1024 |
| 10X Phosphate Buffered Saline (PBS) | Ambion | AM9624 |
| Formaldehyde | Sigma | F8775 |
| RNase free Nuclease-free water | Ambion | AM9932 |
| Dextran sulfate | Sigma | D8906-50G |
| Escherichia coli tRNA | ROCHE | 10109541001 |
| Vanadyl ribonucleoside complex | New England Biolabs | S1402S |
| RNase free BSA | Ambion | AM2618 |
| Formamide | Ambion | AM9342 |
| 20X SSC | Ambion | AM9763 |
| 1 M Tris-HCl, pH 8.0 | Ambion | AM9855G |
| Glucose oxidase stock | Sigma | G2133 |
| Catalase suspension | Sigma | C3515 |
| DAPI | Sigma | D9542 |
| Critical Commercial Assays | ||
| TG NextSeq® 500/550 High Output Kit v2 (75 cycles) | Illumina | TG-160-2005 |
| Deposited Data | ||
| States: small RNA sequencing data | This study | GEO: GSE149422 |
| States: mRNA sequencing data | This study | GEO: GSE149422 |
| HSF-1High: mRNA sequencing data | Sural et al., 2019 | GEO: GSE119993 |
| HSF-1Low: mRNA sequencing data | Brunquell et al., 2016 | SRA: SRP078295 |
| HSF-1 ChIP-seq data | Li et al., 2016 | GEO: GSE81523 |
| Experimental Models: Organisms/Strains | ||
| C. elegans: Strain SX1263 | The Eric Miska lab; Sapetschnig et al., 2015 | SX1263 |
| mjIs134 [Pmex-5::gfp::(Gly)5Ala/his-58/tbb-2 3′UTR; cb-unc-119(+)] II | ||
| C. elegans: Strain JA1527: | The Julie Ahringer lab; Zeiser et al., 2011 | JA1527 |
| weSi14 [Pmex-5::mCherry::(Gly)5Ala/his-58/tbb-2 3′UTR; cb-unc-119(+)] IV | ||
| C. elegans: Strain JA1527 crossed to SX1263 | This study | N/A |
| (mjIs134 [Pmex-5::gfp::(Gly)5Ala/his-58/tbb-2 3′UTR; cb-unc-119(+)] II); (weSi14 [Pmex-5::mCherry::(Gly)5Ala/his-58/tbb-2 3′UTR; cb-unc-119(+)] IV) | ||
| C. elegans: Strain PS3551 | Caenorhabditis Genetics Center | PS3551 |
| hsf-1(sy441) | ||
| C. elegans: strain OG532 | Caenorhabditis Genetics Center | OG532 |
| (hsf-1(sy441); drSi13 [Phsf-1::hsf-1::gfp::unc-54 3′UTR + Cbr-unc-119(+)] II) | ||
| C. elegans: strain OG532 | This study | OG532 |
| (drSi13 [Phsf-1::hsf-1::gfp::unc-54 3′UTR + Cbr-unc-119(+)] II) - outcrossed to generate wild-type background, bearing two copies of hsf-1 | ||
| C. elegans: strain AU133 | Caenorhabditis Genetics Center | AU133 |
| agIs17 [Pmyo-2::mCherry + Pirg-1::GFP] IV | ||
| C. elegans: Strain BFF12 | Posner et al., 2019 | BFF12 |
| rde-4 (ne299) | ||
| Software and Algorithms | ||
| WorMachine | Hakim et al., 2018 | N/A |
| FastQC | Andrews, 2010 | N/A |
| Cutadapt | Martin, 2011 | N/A |
| Shortstack | Shahid and Axtell, 2014 | N/A |
| HTSeq count | Anders et al., 2014 | N/A |
| R Deseq2 | Love et al., 2014 | N/A |
| Fiji | Schindelin et al., 2012 | N/A |
| R (version 3.6.1) | R | N/A |
| GraphPad Prism (8.3.0) | GraphPad Software | N/A |
Resource Availability
Lead Contact
Further information and requests for resources and reagents should be directed to and will be fulfilled by the Lead Contact, Oded Rechavi (odedrechavi@gmail.com).
Materials Availability
This study did not generate new unique reagents.
Data and Code Availability
Small RNA and mRNA sequencing libraries generated during this study are available at the GEO repository accession number GEO: GSE149422.
Experimental Model and Subject Details
Nematodes’ growth and maintenance
Standard culture techniques were used to maintain the worms. Worms were grown on Nematode Growth Medium (NGM) plates and fed with Escherichia coli OP50 bacteria. Strains maintenance and experiments were performed at 20°C. The worms were kept fed for at least five generations before the beginning of each experiment. Extreme care was taken to avoid contamination or starvation. Contaminated plates were discarded from the analysis. The age of the examined worms is indicated per experiment, and the examined worms were all hermaphrodites.
Strains
The following C. elegans strains were used in this study: N2, SX1263 (mjIs134 [Pmex-5::gfp::(Gly)5Ala/his-58/tbb-2 3′UTR; cb-unc-119(+)] II), JA1527 (weSi14 [Pmex-5::mCherry::(Gly)5Ala/his-58/tbb-2 3′UTR; cb-unc-119(+)] IV) (Zeiser et al., 2011), PS3551 (hsf-1(sy441)), OG532 (hsf-1(sy441);drSi13 [Phsf-1::hsf-1::gfp::unc-54 3′UTR + Cbr-unc-119(+)] II), OG532 outcrossed to generate wild-type background (drSi13 [Phsf-1::hsf-1::gfp::unc-54 3′UTR + Cbr-unc-119(+)] II) – bearing an additional copy of hsf-1, AU133 (agIs17 [Pmyo-2::mCherry + Pirg-1::GFP] IV), BFF12 (rde-4 (ne299)).
Method Details
dsRNA administration
The standard assay for RNAi by feeding was carried out as previously described (Kamath et al., 2001): HT115 bacteria that transcribe dsRNA targeting gfp were grown in Carbenicillin-containing LB and were than seeded on NGM plates that contain Carbenicillin (100 μg/ml) and IPTG (1 mM). The plates were seeded with bacteria 24 hours prior to their use.
Lineages experiments
Diversifying anti-gfp RNAi lineages (Figure 1A)
An individual worm (day 2 of adulthood) was placed on a plate containing anti-gfp producing bacteria and was given 2-3 hours to lay eggs (the P0 generation). We then let the eggs hatch, and the worms grow until they become young adults. Four P0 worms were then transferred to plates containing regular bacteria (OP50) and were allowed to lay eggs (the F1 generation) for 6-8 hours. The P0 mothers were then removed and pictured for their silencing phenotype (all P0 mothers exhibited complete silencing).
The eggs (F1 generation) were then allowed to hatch, and the worms grew until reaching day 2 of adulthood. On day 2, we randomly selected 3 F1 worms from each separate P0-derived group and transferred each of them to a new plate for 12-16 hours of egg laying. We then pictured the entire F1 population and the three randomly selected F1 mothers. We repeated this procedure in the transmission between the F2 and F3 generation. In the F3 generation all 36 progeny groups were pictured. Across all generations, each group of progenies was constructed of 25-90 worms, with an average of 43 worms per group (median = 41.5).
(4 P0s x 3 F1s each x 3F2s each = 36 F3 groups).
Uniformity of inheritance was observed regardless of the day in which the progeny were laid (namely, the uniformity in inheritance does not depend on the mother’s age, (Beguet and Brun, 1972; Perez et al., 2017).
Multiple separate anti-gfp RNAi P0 mothers (Figure 1B)
To control for differences in in utero exposure of both the P0 and the F1 generation, we exposed the ancestor worm (which will lay the P0 generation) to the RNAi signal from the beginning of the L4 stage (before the creation of eggs), and allowed the P0 worms to “recover” on control plated before laying the F1 generation that will be examined in the experiments. Namely: an individual L4 worm was placed on a plate containing anti-gfp producing bacteria until it reached day 2 of adulthood. It was then transferred to a new anti-gfp plate and was allowed to lay eggs for 6-8 hours (the P0 generation). The eggs were allowed to hatch, and the worms grew until they reached day 1-2 of adulthood. The P0 mothers were transferred to regular plates for 4 hours (during which the fertilized eggs that were directly exposed to the RNAi signal should have all been laid). The P0 mothers were then transferred to separate plate (1 worm per plate) to lay eggs (the F1 generation) for 6-8 hours, and then removed and pictured for the silencing phenotype. The eggs (F1 generation) hatched and the worm grew until day 1 of adulthood, in which they were scored for their silencing phenotype.
Diversifying mcherry stochastic silencing lineages experiments (Figure S1)
Five mCherry-expressing worms were chosen to create the five different lineages. Similar to anti-gfp lineages experiments, three worms were randomly selected from the progeny to generate the next generation. This procedure repeated in each examined generation (until F3).
Coupled mcherry (stochastic silencing) and gfp (dsRNA-induced) lineages (Figure 2)
For each of the three replicates, a single expressing adult (day 2) worm was chosen and was allowed to lay eggs (the P0 generation) on an anti-gfp RNAi plate for 6-8 hours. The eggs were allowed to hatch, and the worms grew until they reached adulthood. The P0 worms were then transferred to regular plates for 4 hours of “recovery” egg laying (to minimize differences in in utero exposure of the eggs to the dsRNA signal). The P0 mothers were then transferred to separate plates – one P0 worm per plate – and allowed to lay eggs (the F1 generation) for 6-8 hours. The mothers were then removed and pictured for the anti-gfp silencing phenotype and for their mcherry silencing phenotype. The eggs were allowed to hatch, and worms grew until they reached day 2 of adulthood, at which each group was pictured for the anti-gfp silencing phenotype and one worm was transferred to a new plate to lay the next generation (12-16 hours of egg laying). This procedure repeated itself in each examined generation.
Handling of the JA1527 strain
(bearing a stochastically silenced mcherry transgene)
The JA1527 strain was kindly received from the Julie Ahringer lab (University of Cambridge). After 6 outcrosses rounds, rapid silencing of the mcherry transgene was initiated in the population. To avoid a complete “drift” of mcherry silencing in the population we either (1) kept large stocks of frozen expressing JA1527 worms and thawed the worms a couple of weeks prior to the initiation of experiments or (2) transferred the worms to 25°C for a couple of generations, transferred them back to 20°C and selected multiple expressing worms to create the next generations. We let these worms revive for at least 3 generations before the initiation of experiments.
It is highly recommended to avoid repetitive selection of expressing worms (tens of generations of selection), as it seems to drastically change RNAi sensitivity in the population.
RNA and small RNA sequencing experiments
Collecting worms for sequencing
four mCherry-expressing worms were allowed to lay eggs in separate plates (one worm per plate) for 8 hours. The eggs were allowed to hatch and grew until they reached adulthood. Each group of progenies (isogenic sisters) was then washed with M9 buffer into a 1.5ml Eppendorf tube, followed by 3-4 M9 washes, in order to remove any residual bacteria. Each group was then examined in COPAS™ Biosort (Union Biometrica) and sorted to get the top and bottom 25% of mCherry expressing worms in each group. TRIzol® (Life Technologies) was then added to each sorted tube, and the tubes were immediately transferred to −80°C until RNA extraction procedure.
RNA extraction
RNA extraction was performed as previously described (Posner et al., 2019): For RNA isolation worms were lysed using the TRIzol reagent. 300 μL of TRIzol was added to 50ul of adult worms and were subjected to three cycles of freezing in −80C and vortexing at RT for 15mins. 60 μL of chloroform was added and samples were transferred to a pre-spun Heavy Phase Lock tube and centrifuged at 12,000 g for 15mins at 4C. The aqueous phase was transferred to a pre-spun Heavy Phase Lock tube and 1:1 Phenol:Chloroform:Isoamyl Alcohol was added and centrifuged at 16,000 g for 5mins at RT. The aqueous layer was transferred to a 1.5ml Eppendorf tube and 20 μg of Glycogen and 1:1 Isopropanol was added. The samples were incubated at −20C for 30 mins and then centrifuged for 30mins at 16,000 g at 4C. The pellet was washed 2 times with 70% ethanol and then air-dried for 10 minutes. The pellet was re-suspended in 10ul of RNase free water.
Small RNA libraries
total RNA samples were treated with tobacco acid pyrophosphatase (TAP, Epicenter), to ensure 5′ monophosphate-independent capturing of small RNAs. Libraries were prepared using the NEBNext® Small RNA Library Prep Set for Illumina® according to the manufacturer’s protocol. The resulting cDNAs were separated on a 4% agarose E-Gel (Invitrogen, Life Technologies), and the 140–160 nt length species were selected. cDNA was purified using the MinElute Gel Extraction kit (QIAGEN). Libraries were sequenced using an Illumina HiSeq 2500 instrument.
mRNA libraries
cDNA was generated using SMART-Seq v4 Ultra Low Input RNA (Takara) and libraries were prepared using Nextera XT DNA Sample Preparation Kit (Illumina). Libraries were sequenced using an Illumina MiniSeq instrument.
Sequencing analyses
Small RNA libraries
Small RNA libraries were processed and analyzed as recently described (Houri-Ze’evi et al., 2019). The Illumina fastq output files were first assessed for quality, using FastQC (Andrews, 2010), and compared to the FastQC-provided example of small RNA sequencing results. The files were then assigned to adapters clipping using Cutadapt (Martin, 2011) and the following specifications were used:
cutadapt -m 15 -a AGATCGGAAGAGCACACGTCT input.fastq > output.fastq
-
-
m 15: discard reads which are shorter than 15 nucleotides after the adaptor clipping process
-
-
a AGATCGGAAGAGCACACGTCT: the 3′ adaptor sequence used as a query The clipped reads were then aligned against the ce11 version of the C. elegans genome using ShortStack (Shahid and Axtell, 2014) using the default settings:
ShortStack–readfile Input.fastq –genomefile Ce11Reference.fa
Next, we counted reads which align in the sense or antisense orientation to genes. Since stress is known to affect the abundance of structural RNA molecules, we omitted reads which align to structural genes from our analyses. We used the python-based script HTSeq-count (Anders et al., 2014) and the Ensembl-provided gff file (release-95), using the following command:
ANTISENSE
SENSE
We then assigned the summarized counts for differential expression analysis using the R package DESeq2 (Love et al., 2014) and limited the hits for genes which were shown to have an FDR < 0.1. Normalization of the total number of reads in each sample, and the total number of reads which align to the different types of genomic features was generated based on the SizeFactor normalization provided by the DESeq2 package (the median ratio method). To omit effects of PCR amplifications and additional sources of variability which are driven by sequencing artifacts, Chi square test was performed on DESeq2-size-factor normalized reads and the statistic value of the test was normalized to the same size factors.
mRNA libraries. mRNA libraries (both of States worms and of HSF-1High worms (Sural et al., 2019)) were first assessed for quality using the FastQC tool (Andrews, 2010) and were then aligned to ce11 version of the genome using bowtie 2 (Langmead and Salzberg, 2012), using the command:
The aligned reads were then counted using the python-based script HTSeq-count (Anders et al., 2014) and the Ensembl-provided gff file (release-95), using the following command:
The samples were then compared for differential expression using the R package DESeq2 (Love et al., 2014), and a “patient”-based comparison, to directly compare between each pairs of silencer and non-silencer sisters. Genes were regarded as differentially expressed if they pass the criterion of FDR < 0.1.
Small RNAs 3′ polyuridylation analysis
small RNA reads were first aligned as described above. The unaligned reads were then assigned for 3′ trimming of U (T) nucleotides. The reads which were successfully trimmed (and thus are considered to be 3′ polyuridylated small RNA reads) were then aligned again to the ce11 reference genome using ShortStack and counted using HTSeq-count, as described above.
PA14 exposure experiments
Corresponds to Figure S3: worms were exposed to PA14 as previously described (Dunbar et al., 2012), with slight modifications: Adult (day 2) AU133 and wild-type worms were allowed to lay eggs in separate OP50 plates (single worm per plate) for 10 hours. The eggs hatched and the worms grew until they reached adulthood. The worms were then placed on PA14-containing plates for 8 hours. After 8 hours the worms were removed and pictured for Pirg-1::GFP expression.
HSF-1 translational reporter experiments
Corresponds to Figure 4B: Worms were first outcrossed with wild-type (N2) worms to generate worms which bear genomically integrated Phsf-1::hsf-1::gfp::unc-54 3′UTR construct in a wild-type background. A single worm was allowed to lay eggs for 12 hours. L4 worms were selected from the progeny to further facilitate synchronization between the different individuals and were examined for the HSF-1 translational reporter expression 24 hours later. Similar results (variability in HSF-1 aggregation) were observed for worms which bear the translational reporter in an hsf-1 (sy441) background.
smFISH experiments
smFISH experiments and analyses were performed as previously described (Posner et al., 2019) using the same probe set: Probes of 20nt in length targeting mature mRNAs were designed with Stellaris RNA FISH probe designer, and probe sets of 32-40 probes selected based on gene target specificity, defined by a maximum complementary sequence of 16 nt to genes other than the defined target transcript (ensembl BLAST tool. Probes were produced, conjugated to Quasar 670 and purified by Biosearch Technologies. Populations of worms were treated with a sodium hypochlorite protocol and left to incubate at 20°C overnight in M9 buffer to reach a synced L1 population. L1 larvae were transferred to plates with E.coli OP50 and allowed to develop at 20°C for 48 hours reaching mid-late L4 stage. SNR (signal to noise ratio) of probes detecting tissue specific expression was optimal at the L4 stage. Synced worms were collected in M9 buffer and washed three times in 1.5 mL Eppendorf tubes. Supernatant was removed and 1 mL of fixation buffer (100ul 37% formaldehyde solution, 100ul 10X PBS and 800ul nuclease free water) added, followed by an incubation of 45 minutes on a rotator at room temperature. Worms were then washed twice with 1XPBS and suspended in 70% Ethanol and incubated on a rotator for 30 hours at 4°C. Ethanol was removed and 1 mL wash buffer (100ul 20XSSC, 100ul deionized formamide and 800ul nuclease free water) added and let to stand for 5 minutes. Wash buffer was aspirated away and 100ul hybridization buffer (for 10mL: 1g dextran sulfate, 10 mg Escherichia coli tRNA, 100 μL 200 mM vanadyl ribonucleoside complex, 40 μL 50 mg/mL RNase free BSA, 1ml Formamide and nuclease free water to 10 mL final volume) with a concertation of 0.05uM single-molecule fluorescent in situ hybridization (smFISH) probes added, and left for overnight incubation at 37C in the dark. Prior to imaging, hybridization buffer was removed and 1 mL of wash buffer added and left to incubate at 37C in the dark for 30 minutes. Samples were then suspended in 1 mL of fresh wash buffer with 5ug/mL DAPI, and left to incubate at 37C in the dark for 30 minutes. Wash buffer was removed and worms suspended in 1 mL 2XSSC. Buffer was aspirated and samples were incubated in 100ul GLOX buffer (for 1 mL: 40 μL 10% glucose, 10 μL 1 M Tris-HCl, pH 8.0, 100 μL 20X SSC and 850 μL nuclease-free water) for 2 minutes. Buffer was aspirated and 100ul GLOX buffer with the addition of 1ul glucose oxidase (3.7mg/mL) and 1ul of mildly vortexed Catalase suspension, samples were kept on ice until imaging. Images were acquired with an Olympus IX83 motorized inverted microscope coupled with an ORCA flash4.0 V2 Hamamatsu camera. Exposure times and acquisition settings were identical between replicates. Individual worms were chosen for acquisition based on normal morphology and developmental stage was verified based on vulva morphology (Mok et al., 2015). Regions of interest for acquisition were defined by nuclei DAPI staining. Z stacks were acquired with a 0.3 um step size ranging between 70-85 slices per stack.
Starvation experiments
Corresponds to Figure 5E: Multiple mCherry-expressing adult worms were allowed to lay eggs over-night. The eggs hatched and the worms grew, until they reached day 2 of adulthood. The population was separated into silencers and non-silencers groups based on mCherry fluorescence. Each group was bleached to achieve clean batches of eggs. The eggs were transferred to unseeded Nematode Growth Medium (NGM) plates for either 24 hours of 8 days. After the indicated starvation period, worms were washed and transferred to plates with food (OP50 bacteria) and were scored for size and developmental delay.
Scoring of developmentally delayed worms
After 48 hours of recovery, the worms were examined for the existence of developmentally delayed worms (arrested at the L1/L2 stage). The number of all worms and the developmentally delayed worms in each condition was counted. The investigators were blinded to identity of the groups during their examination.
Measuring worms’ size using WorMachine
After 60 hours of recovery, each group of worms was washed, paralyzed, pictured and then analyzed using the WorMachine as previously described (Hakim et al., 2018), using the WorMachine software: Worms were washed three times to get eliminate bacterial (OP50) residues. Worms were left in ∼100 μL of M9 buffer and paralyzed via the addition of sodium azide (final concentration of 25–50 mM). The paralyzed worms were transferred to imaging plates and then physically separated from each other using a platinum-wire pick. The imaging plates were 60-mm Petri dishes filled with 8 mL of modified transparent nematode growth medium (NGM, 2% agarose, 0.3% NaCl, 5 mM K2PO4, 1 mM CaCl2, 1 mM MgSO4). Pictures were taken using a 4X objective lens.
Microscopy
We used an Olympus BX63 microscope for fluorescence microscopy assays (except for smFISH experiments). Unless otherwise noted experiments were pictured using a 10X objective lens, and an exposure time of 750ms. Generally, worms were picked and transferred to 2% agarose padded microscope slides containing drops of tetramisole to generate paralysis, covered with a glass coverslip, and pictured after 2-5 minutes.
Measuring anti-gfp RNAi inheritance
GFP silencing and inheritance was scored using a binary system: no expression (OFF) or any level of expression (ON).
Measuring mCherry’s stochastic silencing and irg-1 reporter
Using Fiji, we measured the integrated density of the whole worm, based on its contour, as well as multiple background measurements per picture. The corrected total fluorescence (CTF) of each worm was calculated as {Integrated Density – (Area of selected worm X Mean fluorescence of background readings)}.
Measuring hsf-1 reporter
The syncytial germline of the worms was pictured using 40X objective lens. The GFP fluorescence in nuclei of each worm were then measured using Fiji.
Mathematical model
To update our minimal mathematical model that describes the dynamics of silencing inheritance across generation we aimed to fulfill the following requirement:
-
1.
Based on rule #1, “uniform inheritance among sisters”: The progeny’s inheritance state should not affect the course of inheritance, and therefore, all the progeny of a given mother should display the same inheritance phenotypes in each generation.
-
2.
Based on rule #2, “stochastic states”: The mother’s inheritance state will dictate the dynamics of transgenerational silencing in its lineage.
-
3.
Based on rule #3, “transgenerational momentum”: The system should be bistable. Namely, some conditions should lead to a decay of silencing across generations and transition to re-expression of the target gene, while other conditions should lead to stable silencing inheritance across multiple generations.
The model is based on the following logic: The mother's “inheritance state” sets the initial response to the dsRNA trigger, which dictates the strength of the silencing response that is produced in the mother and passed on to the next generation. The transgenerational RNAi is then amplified in a non-linear fashion: high levels of small RNAs are amplified at a higher rate per unit and low levels of small RNAs are amplified in a lower rate. Importantly, the amplification rate of the heritable small RNAs in the subsequent generations is not affected by the inheritance state of the worms.
The non-linearity of small RNA amplification gives rise to a dependence on the mother’s stochastic inheritance state: If the mother has a high inheritance state, high levels of small RNAs are transmitted to the progeny, and the silencing response is amplified to overcome its natural dilution/degradation rate, leading to a sustained silencing. Conversely, if the mother has a low inheritance state, low levels of small RNAs are transmitted to the progeny, and the silencing response is diluted/degraded faster than its amplification. This leads to a gradual loss of the silencing response and eventually to re-expression of the target gene. The generation in which silencing terminates is determined by the initial response that is transmitted from the mother. Thus, the mother’s inheritance state determines the fate of silencing and its termination in the entire lineage.
The three requirements that are detailed above can thus be fulfilled in the case that small RNA amplification is non-linear, with cooperativity . Mathematically, we model the dynamics of the silencing response against the target gene, denoted as z. At t = 0 (generation P0), z is increased by an initial dsRNA trigger x. The trigger is processed to generate the silencing response z in a process that depends on the worm inheritance state y. The silencing response z is further processed and amplified at a maximal rate , and degraded and diluted at rate . We assume that the small RNA-mediated silencing response is amplified in a Hill-like manner with parameters n,k. This is summarized in the following equation:
| (1) |
For simplicity, we regard the expression of the target gene as binary: A worm is considered as either expressing the target gene or silencing it. Thus, we assume that the target gene will be detected when the silencing response z falls below a certain threshold level , and will not be detected when . We assume that the trigger x is only present at t = 0, so that the term only enters as initial conditions.
The model has two regimes, depending on two parameters – the silencing response amplification rate scaled by the dilution rate , and the amplification cooperativity coefficient . For small ,n, the system has only one stable steady-state – , i.e., the system will eventually transition to a stable expression of the target gene. Notably, for the system will have only one stable solution regardless of the value of . For high n and high enough , there are two stable states, depending on initial conditions: expression or silencing. We therefore conclude that the bistability that was observed experimentally indicates that RNAi amplification is non-linear. The non-linearity of the amplification rate can represent the competition of different small RNA species over shared amplification resources (see main text for further discussion regarding the effects of competition on inheritance).
Quantification and Statistical Analysis
Statistical analyses were performed in R (version 3.6.1) or Graphpad Prism (version 8.3.0). Statistical tests were performed as two-sided tests, unless inapplicable. Chi-square test and hypergeometric tests were performed using online tools. Sample sizes are indicated per experiment in either the methods section or the figures. Graphs were created in R and Graphpad Prism. In all figures: ∗∗ represents p value < 0.01, ∗∗∗ represents p value < 0.001, and ∗∗∗∗ represents p value < 0.0001.
Acknowledgments
We thank all Rechavi lab members for comments and discussions. We especially thank to Sarit Anava, Ekaterina Star, Hila Gingold, and Guy Teichman for experimental and visualization assistance. Some strains were provided by the CGC, which is funded by the NIH Office of Research Infrastructure Programs (P40 OD010440). We thank Eric Miska and Julie Ahringer for kindly providing us with strains. L.H.-Z. thanks the Clore Foundation. O.R. thanks the Adelis Foundation for grant 0604916191. This work was funded by ERC grants 335624 and 819151.
Author Contributions
Conceptualization, L.H.-Z. and O.R.; Experiments, L.H.-Z. and O.A.; Mathematical Model, Y.K.K.; Writing, L.H.-Z. and O.R.; Formal Analysis, Data Curation, and Visualization, L.H.-Z.; Supervision and Funding Acquisition, O.R.
Declaration of Interests
The authors declare no competing interests.
Published: August 24, 2020
Footnotes
Supplemental Information can be found online at https://doi.org/10.1016/j.cell.2020.07.022.
Contributor Information
Leah Houri-Zeevi, Email: leah.houri@gmail.com.
Oded Rechavi, Email: odedrechavi@gmail.com.
Supplemental Information
Provided is a DESeq2 analysis of differential expression in silencers compared to non-silencers.
References
- Alcazar R.M., Lin R., Fire A.Z. Transmission dynamics of heritable silencing induced by double-stranded RNA in Caenorhabditis elegans. Genetics. 2008;180:1275–1288. doi: 10.1534/genetics.108.089433. [DOI] [PMC free article] [PubMed] [Google Scholar]
- Anders S., Pyl P.T., Huber W. Cold Spring Harbor Labs Journals; 2014. HTSeq A Python framework to work with high-throughput sequencing data. [DOI] [PMC free article] [PubMed] [Google Scholar]
- Andrews S. FastQC: A Quality Control tool for High Throughput Sequence Data. 2010. https://www.bioinformatics.babraham.ac.uk/projects/fastqc/
- Angeles-Albores D., Lee R.Y., Chan J., Sternberg P. Two new functions in the WormBase Enrichment Suite. 2018. https://www.micropublication.org/journals/biology/w25q2n/ [DOI] [PMC free article] [PubMed]
- Ashe A., Sapetschnig A., Weick E.-M., Mitchell J., Bagijn M.P., Cording A.C., Doebley A.-L., Goldstein L.D., Lehrbach N.J., Le Pen J. piRNAs can trigger a multigenerational epigenetic memory in the germline of C. elegans. Cell. 2012;150:88–99. doi: 10.1016/j.cell.2012.06.018. [DOI] [PMC free article] [PubMed] [Google Scholar]
- Bazopoulou D., Knoefler D., Zheng Y., Ulrich K., Oleson B.J., Xie L., Kim M., Kaufmann A., Lee Y.-T., Dou Y. Developmental ROS individualizes organismal stress resistance and lifespan. Nature. 2019;576:301–305. doi: 10.1038/s41586-019-1814-y. [DOI] [PMC free article] [PubMed] [Google Scholar]
- Beatty J. The Evolutionary Contingency Thesis. In: Wolters G., Lennox J.G., editors. Concepts, Theories, and Rationality in the Biological Sciences. University of Pittsburgh Press; 1993. pp. 45–81. [Google Scholar]
- Beguet B., Brun J.L. Influence of parental aging on the reproduction of the F 1 generation in a hermaphrodite nematode Caenorhabditis elegans. Exp. Gerontol. 1972;7:195–206. doi: 10.1016/0531-5565(72)90026-5. [DOI] [PubMed] [Google Scholar]
- Billi A.C., Fischer S.E.J., Kim J.K. Endogenous RNAi pathways in C. elegans. WormBook. 2014:1–49. doi: 10.1895/wormbook.1.170.1. [DOI] [PMC free article] [PubMed] [Google Scholar]
- Brunquell J., Morris S., Lu Y., Cheng F., Westerheide S.D. The genome-wide role of HSF-1 in the regulation of gene expression in Caenorhabditis elegans. BMC Genomics. 2016;17:559. doi: 10.1186/s12864-016-2837-5. [DOI] [PMC free article] [PubMed] [Google Scholar]
- Buckley B.A., Burkhart K.B., Gu S.G., Spracklin G., Kershner A., Fritz H., Kimble J., Fire A., Kennedy S. A nuclear Argonaute promotes multigenerational epigenetic inheritance and germline immortality. Nature. 2012;489:447–451. doi: 10.1038/nature11352. [DOI] [PMC free article] [PubMed] [Google Scholar]
- Burga A., Casanueva M.O., Lehner B. Predicting mutation outcome from early stochastic variation in genetic interaction partners. Nature. 2011;480:250–253. doi: 10.1038/nature10665. [DOI] [PubMed] [Google Scholar]
- Casanueva M.O., Burga A., Lehner B. Fitness Trade-Offs and Environmentally Induced Mutation Buffering in Isogenic C. elegans. Science. 2012;335:82–85. doi: 10.1126/science.1213491. [DOI] [PubMed] [Google Scholar]
- Dunbar T.L., Yan Z., Balla K.M., Smelkinson M.G., Troemel E.R. C. elegans detects pathogen-induced translational inhibition to activate immune signaling. Cell Host Microbe. 2012;11:375–386. doi: 10.1016/j.chom.2012.02.008. [DOI] [PMC free article] [PubMed] [Google Scholar]
- Fischer S.E.J., Pan Q., Breen P.C., Qi Y., Shi Z., Zhang C., Ruvkun G. Multiple small RNA pathways regulate the silencing of repeated and foreign genes in C. elegans. Genes Dev. 2013;27:2678–2695. doi: 10.1101/gad.233254.113. [DOI] [PMC free article] [PubMed] [Google Scholar]
- Ge S.X., Jung D. ShinyGO: a graphical enrichment tool for ani-mals and plants. bioRxiv. 2018 doi: 10.1101/315150. [DOI] [PMC free article] [PubMed] [Google Scholar]
- Grishok A. Biology and Mechanisms of Short RNAs in Caenorhabditis elegans. Adv. Genet. 2013;83:1–69. doi: 10.1016/B978-0-12-407675-4.00001-8. [DOI] [PubMed] [Google Scholar]
- Gu S.G., Pak J., Guang S., Maniar J.M., Kennedy S., Fire A. Amplification of siRNA in Caenorhabditis elegans generates a transgenerational sequence-targeted histone H3 lysine 9 methylation footprint. Nat. Genet. 2012;44:157–164. doi: 10.1038/ng.1039. [DOI] [PMC free article] [PubMed] [Google Scholar]
- Hakim A., Mor Y., Toker I.A., Levine A., Neuhof M., Markovitz Y., Rechavi O. WorMachine: machine learning-based phenotypic analysis tool for worms. BMC Biol. 2018;16:8. doi: 10.1186/s12915-017-0477-0. [DOI] [PMC free article] [PubMed] [Google Scholar]
- Hall S.E., Chirn G.-W., Lau N.C., Sengupta P. RNAi pathways contribute to developmental history-dependent phenotypic plasticity in C. elegans. RNA. 2013;19:306–319. doi: 10.1261/rna.036418.112. [DOI] [PMC free article] [PubMed] [Google Scholar]
- Houri-Ze’evi L., Korem Y., Sheftel H., Faigenbloom L., Toker I.A., Dagan Y., Awad L., Degani L., Alon U., Rechavi O. A Tunable Mechanism Determines the Duration of the Transgenerational Small RNA Inheritance in C. elegans. Cell. 2016;165:88–99. doi: 10.1016/j.cell.2016.02.057. [DOI] [PubMed] [Google Scholar]
- Houri-Ze’evi L., Teichman G., Gingold H., Rechavi O. Stress Resets Transgenerational Small RNA Inheritance. bioRxiv. 2019 doi: 10.1101/669051. [DOI] [Google Scholar]
- Huang C., Wu J., Xu L., Wang J., Chen Z., Yang R. Regulation of HSF1 protein stabilization: An updated review. Eur. J. Pharmacol. 2018;822:69–77. doi: 10.1016/j.ejphar.2018.01.005. [DOI] [PubMed] [Google Scholar]
- Jobson M.A., Jordan J.M., Sandrof M.A., Hibshman J.D., Lennox A.L., Baugh L.R. Transgenerational Effects of Early Life Starvation on Growth, Reproduction, and Stress Resistance in Caenorhabditis elegans. Genetics. 2015;201:201–212. doi: 10.1534/genetics.115.178699. [DOI] [PMC free article] [PubMed] [Google Scholar]
- Kaletsky R., Yao V., Williams A., Runnels A.M., Tadych A., Zhou S., Troyanskaya O.G., Murphy C.T. Transcriptome analysis of adult Caenorhabditis elegans cells reveals tissue-specific gene and isoform expression. PLoS Genet. 2018;14:e1007559. doi: 10.1371/journal.pgen.1007559. [DOI] [PMC free article] [PubMed] [Google Scholar]
- Kamath R.S., Martinez-Campos M., Zipperlen P., Fraser A.G., Ahringer J. Effectiveness of specific RNA-mediated interference through ingested double-stranded RNA in Caenorhabditis elegans. Genome Biol. 2001;2 doi: 10.1186/gb-2000-2-1-research0002. RESEARCH0002. [DOI] [PMC free article] [PubMed] [Google Scholar]
- Langmead B., Salzberg S.L. Fast gapped-read alignment with Bowtie 2. Nat. Methods. 2012;9:357–359. doi: 10.1038/nmeth.1923. [DOI] [PMC free article] [PubMed] [Google Scholar]
- Lev I., Seroussi U., Gingold H., Bril R., Anava S., Rechavi O. MET-2-Dependent H3K9 Methylation Suppresses Transgenerational Small RNA Inheritance. Curr. Biol. 2017;27:1138–1147. doi: 10.1016/j.cub.2017.03.008. [DOI] [PubMed] [Google Scholar]
- Lev I., Toker I.A., Mor Y., Nitzan A., Weintraub G., Antonova O., Bhonkar O., Ben Shushan I., Seroussi U., Claycomb J.M. Germ Granules Govern Small RNA Inheritance. Curr. Biol. 2019;29:2880–2891.e4. doi: 10.1016/j.cub.2019.07.054. [DOI] [PMC free article] [PubMed] [Google Scholar]
- Li J., Chauve L., Phelps G., Brielmann R.M., Morimoto R.I. E2F coregulates an essential HSF developmental program that is distinct from the heat-shock response. Genes Dev. 2016;30:2062–2075. doi: 10.1101/gad.283317.116. [DOI] [PMC free article] [PubMed] [Google Scholar]
- Love M.I., Huber W., Anders S. Moderated estimation of fold change and dispersion for RNA-seq data with DESeq2. Genome Biol. 2014;15:550. doi: 10.1186/s13059-014-0550-8. [DOI] [PMC free article] [PubMed] [Google Scholar]
- Lu R., Maduro M., Li F., Li H.W., Broitman-Maduro G., Li W.X., Ding S.W. Animal virus replication and RNAi-mediated antiviral silencing in Caenorhabditis elegans. Nature. 2005;436:1040–1043. doi: 10.1038/nature03870. [DOI] [PMC free article] [PubMed] [Google Scholar]
- Luteijn M.J., van Bergeijk P., Kaaij L.J.T., Almeida M.V., Roovers E.F., Berezikov E., Ketting R.F. Extremely stable Piwi-induced gene silencing in Caenorhabditis elegans. EMBO J. 2012;31:3422–3430. doi: 10.1038/emboj.2012.213. [DOI] [PMC free article] [PubMed] [Google Scholar]
- Martin M. Cutadapt removes adapter sequences from high-throughput sequencing reads. EMBnet. J. 2011;17:10. [Google Scholar]
- Mok D.Z.L., Sternberg P.W., Inoue T. Morphologically defined sub-stages of C. elegans vulval development in the fourth larval stage. BMC Dev. Biol. 2015;15:26. doi: 10.1186/s12861-015-0076-7. [DOI] [PMC free article] [PubMed] [Google Scholar]
- Moore R.S., Kaletsky R., Murphy C.T. Piwi/PRG-1 Argonaute and TGF-β Mediate Transgenerational Learned Pathogenic Avoidance. Cell. 2019;177:1827–1841.e12. doi: 10.1016/j.cell.2019.05.024. [DOI] [PMC free article] [PubMed] [Google Scholar]
- Morton E.A., Lamitina T. Caenorhabditis elegans HSF-1 is an essential nuclear protein that forms stress granule-like structures following heat shock. Aging Cell. 2013;12:112–120. doi: 10.1111/acel.12024. [DOI] [PMC free article] [PubMed] [Google Scholar]
- Ni J.Z., Kalinava N., Chen E., Huang A., Trinh T., Gu S.G. A transgenerational role of the germline nuclear RNAi pathway in repressing heat stress-induced transcriptional activation in C. elegans. Epigenetics Chromatin. 2016;9:3. doi: 10.1186/s13072-016-0052-x. [DOI] [PMC free article] [PubMed] [Google Scholar]
- Perales R., Pagano D., Wan G., Fields B.D., Saltzman A.L., Kennedy S.G. Transgenerational Epigenetic Inheritance Is Negatively Regulated by the HERI-1 Chromodomain Protein. Genetics. 2018;210:1287–1299. doi: 10.1534/genetics.118.301456. [DOI] [PMC free article] [PubMed] [Google Scholar]
- Perez M.F., Francesconi M., Hidalgo-Carcedo C., Lehner B. Maternal age generates phenotypic variation in Caenorhabditis elegans. Nature. 2017;552:106–109. doi: 10.1038/nature25012. [DOI] [PMC free article] [PubMed] [Google Scholar]
- Posner R., Toker I.A., Antonova O., Star E., Anava S., Azmon E., Hendricks M., Bracha S., Gingold H., Rechavi O. Neuronal Small RNAs Control Behavior Transgenerationally. Cell. 2019;177:1814–1826.e15. doi: 10.1016/j.cell.2019.04.029. [DOI] [PMC free article] [PubMed] [Google Scholar]
- Pulak R. Techniques for Analysis, Sorting, and Dispensing of C. elegans on the COPAS Flow-Sorting System. Methods Mol. Biol. 2006;351:275–286. doi: 10.1385/1-59745-151-7:275. [DOI] [PubMed] [Google Scholar]
- Rea S.L., Wu D., Cypser J.R., Vaupel J.W., Johnson T.E. A stress-sensitive reporter predicts longevity in isogenic populations of Caenorhabditis elegans. Nat. Genet. 2005;37:894–898. doi: 10.1038/ng1608. [DOI] [PMC free article] [PubMed] [Google Scholar]
- Rechavi O., Minevich G., Hobert O. Transgenerational inheritance of an acquired small RNA-based antiviral response in C. elegans. Cell. 2011;147:1248–1256. doi: 10.1016/j.cell.2011.10.042. [DOI] [PMC free article] [PubMed] [Google Scholar]
- Rechavi O., Houri-Ze’evi L., Anava S., Goh W.S.S., Kerk S.Y., Hannon G.J., Hobert O. Starvation-induced transgenerational inheritance of small RNAs in C. elegans. Cell. 2014;158:277–287. doi: 10.1016/j.cell.2014.06.020. [DOI] [PMC free article] [PubMed] [Google Scholar]
- Roux A.E., Langhans K., Huynh W., Kenyon C. Reversible Age-Related Phenotypes Induced during Larval Quiescence in C. elegans. Cell Metab. 2016;23:1113–1126. doi: 10.1016/j.cmet.2016.05.024. [DOI] [PMC free article] [PubMed] [Google Scholar]
- Sapetschnig A., Sarkies P., Lehrbach N.J., Miska E.A. Tertiary siRNAs mediate paramutation in C. elegans. PLoS Genet. 2015;11:e1005078. doi: 10.1371/journal.pgen.1005078. [DOI] [PMC free article] [PubMed] [Google Scholar]
- Sarkies P., Ashe A., Le Pen J., McKie M.A., Miska E.A. Competition between virus-derived and endogenous small RNAs regulates gene expression in Caenorhabditis elegans. Genome Res. 2013;23:1258–1270. doi: 10.1101/gr.153296.112. [DOI] [PMC free article] [PubMed] [Google Scholar]
- Schindelin J., Arganda-Carreras I., Frise E., Kaynig V., Longair M., Pietzsch T., Preibisch S., Rueden C., Saalfeld S., Schmid B. Fiji: an open-source platform for biological-image analysis. Nat. Methods. 2012;9:676–682. doi: 10.1038/nmeth.2019. [DOI] [PMC free article] [PubMed] [Google Scholar]
- Schreiner W.P., Pagliuso D.C., Garrigues J.M., Chen J.S., Aalto A.P., Pasquinelli A.E. Remodeling of the Caenorhabditis elegans non-coding RNA transcriptome by heat shock. Nucleic Acids Res. 2019;47:9829–9841. doi: 10.1093/nar/gkz693. [DOI] [PMC free article] [PubMed] [Google Scholar]
- Shahid S., Axtell M.J. Identification and annotation of small RNA genes using ShortStack. Methods. 2014;67:20–27. doi: 10.1016/j.ymeth.2013.10.004. [DOI] [PMC free article] [PubMed] [Google Scholar]
- Shirayama M., Seth M., Lee H.-C., Gu W., Ishidate T., Conte D., Jr., Mello C.C. piRNAs initiate an epigenetic memory of nonself RNA in the C. elegans germline. Cell. 2012;150:65–77. doi: 10.1016/j.cell.2012.06.015. [DOI] [PMC free article] [PubMed] [Google Scholar]
- Sims J.R., Ow M.C., Nishiguchi M.A., Kim K., Sengupta P., Hall S.E. Developmental programming modulates olfactory behavior in C. elegans via endogenous RNAi pathways. eLife. 2016;5:e11642. doi: 10.7554/eLife.11642. [DOI] [PMC free article] [PubMed] [Google Scholar]
- Stern S., Kirst C., Bargmann C.I. Neuromodulatory Control of Long-Term Behavioral Patterns and Individuality across Development. Cell. 2017;171:1649–1662.e10. doi: 10.1016/j.cell.2017.10.041. [DOI] [PubMed] [Google Scholar]
- Sural S., Lu T.-C., Jung S.A., Hsu A.-L. HSB-1 Inhibition and HSF-1 Overexpression Trigger Overlapping Transcriptional Changes To Promote Longevity in Caenorhabditis elegans. G3 (Bethesda) 2019;9:1679–1692. doi: 10.1534/g3.119.400044. [DOI] [PMC free article] [PubMed] [Google Scholar]
- van Wolfswinkel J.C., Claycomb J.M., Batista P.J., Mello C.C., Berezikov E., Ketting R.F. CDE-1 affects chromosome segregation through uridylation of CSR-1-bound siRNAs. Cell. 2009;139:135–148. doi: 10.1016/j.cell.2009.09.012. [DOI] [PubMed] [Google Scholar]
- Vastenhouw N.L., Brunschwig K., Okihara K.L., Müller F., Tijsterman M., Plasterk R.H.A. Gene expression: long-term gene silencing by RNAi. Nature. 2006;442:882. doi: 10.1038/442882a. [DOI] [PubMed] [Google Scholar]
- Webster A.K., Jordan J.M., Hibshman J.D., Chitrakar R., Baugh L.R. Transgenerational Effects of Extended Dauer Diapause on Starvation Survival and Gene Expression Plasticity in Caenorhabditis elegans. Genetics. 2018;210:263–274. doi: 10.1534/genetics.118.301250. [DOI] [PMC free article] [PubMed] [Google Scholar]
- Yan N., Chen Z.J. Intrinsic antiviral immunity. Nat. Immunol. 2012;13:214–222. doi: 10.1038/ni.2229. [DOI] [PMC free article] [PubMed] [Google Scholar]
- Yang W., Dierking K., Schulenburg H. WormExp: a web-based application for a Caenorhabditis elegans-specific gene expression enrichment analysis. Bioinformatics. 2016;32:943–945. doi: 10.1093/bioinformatics/btv667. [DOI] [PubMed] [Google Scholar]
- Zeiser E., Frøkjær-Jensen C., Jorgensen E., Ahringer J. MosSCI and gateway compatible plasmid toolkit for constitutive and inducible expression of transgenes in the C. elegans germline. PLoS ONE. 2011;6:e20082. doi: 10.1371/journal.pone.0020082. [DOI] [PMC free article] [PubMed] [Google Scholar]
- Zhang D., Tu S., Stubna M., Wu W.-S., Huang W.-C., Weng Z., Lee H.-C. The piRNA targeting rules and the resistance to piRNA silencing in endogenous genes. Science. 2018;359:587–592. doi: 10.1126/science.aao2840. [DOI] [PMC free article] [PubMed] [Google Scholar]
- Zheng X., Beyzavi A., Krakowiak J., Patel N., Khalil A.S., Pincus D. Hsf1 Phosphorylation Generates Cell-to-Cell Variation in Hsp90 Levels and Promotes Phenotypic Plasticity. Cell Rep. 2018;22:3099–3106. doi: 10.1016/j.celrep.2018.02.083. [DOI] [PMC free article] [PubMed] [Google Scholar]
- Zhuang J.J., Hunter C.P. The Influence of Competition Among C. elegans Small RNA Pathways on Development. Genes (Basel) 2012;3:671–685. doi: 10.3390/genes3040671. [DOI] [PMC free article] [PubMed] [Google Scholar]
Associated Data
This section collects any data citations, data availability statements, or supplementary materials included in this article.
Supplementary Materials
Provided is a DESeq2 analysis of differential expression in silencers compared to non-silencers.
Data Availability Statement
Small RNA and mRNA sequencing libraries generated during this study are available at the GEO repository accession number GEO: GSE149422.