Jiang and colleagues investigate how locations of sites of organelle assembly are determined during cell division in the ciliate Tetrahymena thermophila. They find that correct placement of new organelles involves antagonistic influences of a cyclin E and a Hippo/Mst kinase.
Abstract
Not much is known about how organelles organize into patterns. In ciliates, the cortical pattern is propagated during “tandem duplication,” a cell division that remodels the parental cell into two daughter cells. A key step is the formation of the division boundary along the cell’s equator. In Tetrahymena thermophila, the cdaA alleles prevent the formation of the division boundary. We find that the CDAA gene encodes a cyclin E that accumulates in the posterior cell half, concurrently with accumulation of CdaI, a Hippo/Mst kinase, in the anterior cell half. The division boundary forms between the margins of expression of CdaI and CdaA, which exclude each other from their own cortical domains. The activities of CdaA and CdaI must be balanced to initiate the division boundary and to position it along the cell’s equator. CdaA and CdaI cooperate to position organelles near the new cell ends. Our data point to an intracellular positioning mechanism involving antagonistic Hippo signaling and cyclin E.
Introduction
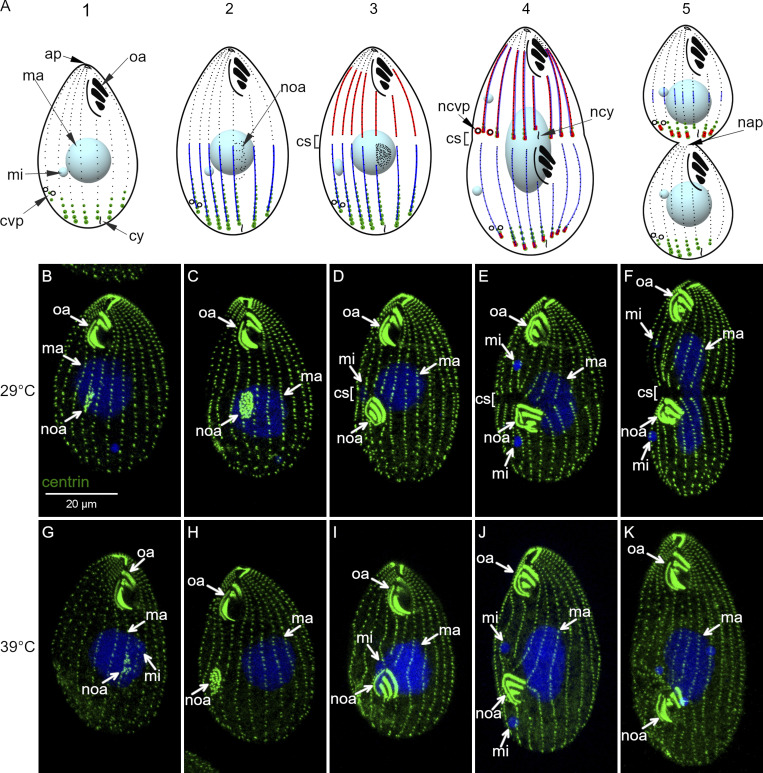
Ciliates are among the most complex cells known. Using the widely studied Tetrahymena thermophila as an example, it is a single cell with numerous cortical structures whose positions reveal the anteroposterior (A/P) and circumferential polarities. Ciliates divide by “tandem duplication,” a transverse binary fission during which the parental cell forms a cortical boundary along its equator and the resulting cell halves remodel into complete two daughter cells, retaining the polarity of the parental cell (Fig. 1 A). While the underlying intracellular patterning mechanisms operate mainly if not entirely in the cell cortex (reviewed in Frankel 1989), surprisingly, not a single cortical structure or region is required as a source of polarity cues. For example, large ciliates (e.g., Stentor) can regenerate their cortical pattern, even if almost the entire cell cortex is removed (Tartar, 1956, 1961). Hypotrich ciliates form cysts in which the cortical pattern is resorbed and reformed during redevelopment (Fryd-Versavel et al., 2010; Grimes, 1973a, 1973b). Thus, ciliates can duplicate, regenerate, and form de novo complex organelle patterns by largely unknown mechanisms that seem to use intracellular positional information.
Figure 1.
cdaA-1 inhibits the formation of the division boundary. (A) The course of cell division and the localizations of proteins relevant to this study: Elo1 (green), CdaI (red), and CdaA (blue) in T. thermophila. (B–K) Confocal images of cdaA-1 cells stained with anti-centrin antibodies (green) and DAPI (blue), grown at 29°C (B–F) or incubated at 39°C for 3 h (G–K). ap, cell apex; cs, cortical subdivision; cvp, contractile vacuole pore; cy, cytoproct; ma, macronucleus; mi, micronucleus; nap, new cell apex; ncvp, new contractile vacuole pore; ncy, new cytoproct; noa, new oral apparatus (oral primordium); oa, oral apparatus.
Recently, Hippo signaling proteins have been linked to the A/P positioning of the division boundary in ciliates (Jiang et al., 2017, 2019a; Slabodnick et al., 2014; Tavares et al., 2012). In T. thermophila, posterior Elo1 (Lats/Ndr kinase) and Mob1 and anterior CdaI (Hippo/Mst kinase) contribute to placement of the division boundary at the cell’s equator (Jiang et al., 2017, 2019a; Tavares et al., 2012). However, the mechanisms that induce the formation of the division boundary remain unknown. The conditional cdaA alleles prevent the formation of the division boundary (Frankel et al., 1976a, 1976b, 1977, 1980). Here, we use comparative next-generation sequencing (NGS) to identify CDAA as a gene encoding a cyclin E. We find that CdaA becomes enriched in the cortex of the posterior cell half at the time when CdaI accumulates in the anterior cell half. Our data indicate that cortical antagonism between Hippo signaling and cyclin E contributes to a cell-wide positional information that places new structures at correct locations along the A/P axis.
Results
cdaA-1 inhibits the formation of the division boundary
In the wild-type T. thermophila, cell division starts with the appearance of the new oral apparatus (oral primordium) at the subequatorial position (stage 2; Fig. 1 A). The A/P position of the oral primordium is influenced by Elo1, which occupies the most posterior cell region (green, Fig. 1 A). As the oral primordium differentiates, CdaI appears throughout the anterior cell half (stage 3; red, Fig. 1 A). The division boundary forms along the cell’s equator, initially presenting as a circumferential gap in the ciliary rows (stage 3; Fig. 1 A). This “cortical subdivision” forms posteriorly to the posterior margin of the CdaI cortical domain. Concurrently with cytokinesis, the cortical regions that are immediately anterior and posterior to the division boundary remodel to become the new cell ends (stages 4–5; Fig. 1 A). The (germline) micronucleus divides by mitosis at the time of cortical subdivision and the (somatic) macronucleus divides by amitosis at the time of cytokinesis.
At a restrictive temperature, cdaA-1 prevents the formation of cortical subdivision and subsequently blocks cytokinesis and amitosis (Frankel et al., 1976a, 1977, 1980; Joachimiak et al., 2004). Based on the anti-centrin antibodies that label the basal bodies, the course of cell division in the cdaA-1 cells at the permissive temperature of 29°C was undisturbed (Fig. 1, B–F). At the restrictive temperature of 39°C, the cdaA-1 mutants developed a normal oral primordium (Fig. 1, G and H). Fig. 1, D and I, show cdaA-1 cells in the same stage of cell division at 29°C and 39°C, respectively. The oral primordium is advanced based on the visibility of oral rows. While the cortical subdivision formed at 29°C (Fig. 1 D), it failed at 39°C (Fig. 1 I). Subsequently, at 39°C, the cdaA-1 cells do not constrict and the basal body rows that cross the cell’s equator remain intact (Fig. 1, J and K; compare to Fig. 1, E and F). The macronucleus does not complete its amitosis (Fig. 1 K). The structures that normally form at the new cell ends, e.g., the new contractile vacuole pores (CVPs) in the anterior cell half and the new apex in the posterior cell half, do not appear (Frankel et al., 1981; Gonda et al., 1999; Kaczanowska et al., 1992, 1993, 1999). When continuously maintained at 39°C, cdaA-1 cells undergo multiple abortive cell cycles and become large “monsters” (Fig. 2, C and D).
Figure 2.
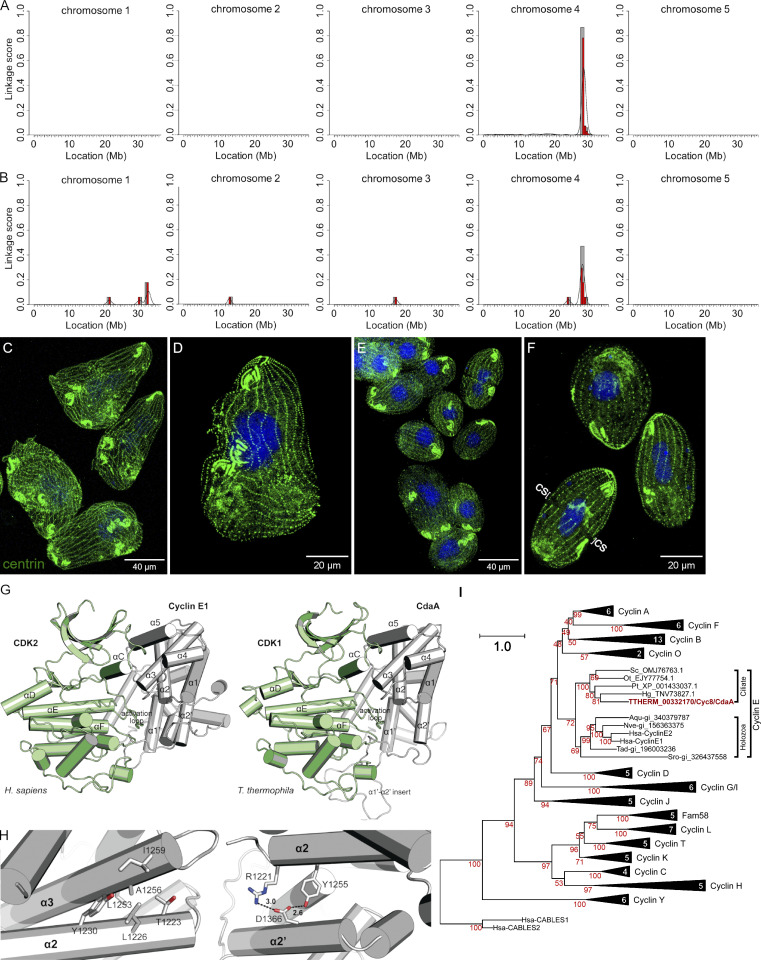
Strains with the cdaA alleles carry mutations in TTHERM_00332170/CYC8. (A) Mapping of cdaA-1 in the micronuclear genome using the ACCA workflow. (B) Mapping of cdaA-4 using the SVD workflow. (C–F) cdaA-1 cells (C and D) and cdaA-1 cells rescued with a wild-type fragment of TTHERM_00332170/CYC8 (E and F) grown at 39°C and stained with the anti-centrin (green) and DAPI (blue). cs, cortical subdivision. (G) Left: A crystal structure of the human Cyclin E1/CDK2 complex (PDB accession no. 1W98; Honda et al., 2005). Right: a homology model of T. thermophila CdaA/CdK1. (H) Left: A1256 is located on the α3 helix and forms hydrophobic interactions with the α2 helix of CdaA. (H) Right: D1366 is located on the α2′ helix and forms electrostatic interactions with the α2 helix of CdaA. (I) A phylogenetic analysis of the cyclin domain sequences classifies CdaA as cyclin E. Bootstrap percentage values are shown in red. Triangles represent collapsed clades with sequence numbers indicated. The full topology is provided in Fig. S1 A.
CDAA encodes a cyclin E
We used comparative NGS to map the causal mutations for cdaA-1 and another noncomplementing allele, cdaA-4. Importantly, cdaA-1 is derived from the natural isolate D, while cdaA-4 originates from the isolate B (Frankel et al., 1976b, 1977). We used our allelic composition contrast analysis (ACCA) NGS-based bioinformatics workflow (see Materials and methods) to map cdaA-1 to a 3-Mb interval on the micronuclear chromosome 4 at ∼28.9 Mb (Fig. 2 A). However, this interval harbored >2,700 variants. Because the reference genome and the mapping strain both originate from the B background, most of these cdaA-1-linked variants were expected to be noncausal and originate from the D background. Indeed, subtraction of variants also observed in the wild-type D background strain eliminated all but three variants. Next, we used the simple variant density (SVD) NGS bioinformatics approach to map cdaA-4 to about the same region of chromosome 4 at ∼28.6 Mb (Fig. 2 B), which contained eight variants. Exactly one variant among the cdaA-1–linked variants and exactly one variant among the cdaA-4–linked variants affect the same protein-coding gene, TTHERM_00332170. The cdaA-1 genome carries a C to T transition (chromosome 4: 28875789, scf_8254010:664158) that produces a D1366N amino acid substitution. The cdaA-4 genome has a C to T transition (chromosome 4: 28878966, scf_8254010:664822) that produces an A1256T substitution. TTHERM_00332170 encodes a protein with a cyclin domain named CYC8 (Stover and Rice, 2011; Yan et al., 2016a). A phylogenetic analysis (based on Cao et al. 2014) revealed that the cyclin domain of TTHERM_00332170/CYC8 is of type E (Fig. 2 I and Fig. S1 A). Reciprocal “best hit” Blastp searches identified potential orthologues of TTHERM_00332170/CYC8 in other ciliates. Nonciliate alveolates (Apicomplexa and dinoflagellates) lack cyclin E (Fig. S1 B), as reported earlier (Alvarez and Suvorova, 2017; Cato et al., 2019). Overall, cyclin E is present in Holozoa, an apusozoan Thecamonas trahens, and ciliates (Cao et al., 2014; Stover and Rice, 2011; Suga et al., 2013; this study).
Figure S1.
Phylogenetic analyses of cyclin domains. (A) A phylogenetic analysis reveals that the cyclin domain of TTHERM_00332170/CYC8/CdaA is most closely related to cyclin E domains. The tree was prepared using the multiple sequence alignment of the N-terminal cyclin domains of Holozoa species published in (Cao et al. 2014) with addition of CdaA/CYC8 of T. thermophila (red) and several orthologues of CdaA/CYC8 in other ciliates (P. tetraurelia, S. coeruleus, H. grandinella, and O. trifallax). Bootstrap percentage values are shown in red. Aqu, A. queenslandica; Hg, Halteria grandinella; Hsa, H. sapiens; Mbr, M. brevicollis; Nve, N. vectensis; Ot, Oxytricha trifallax; Pt, Paramecium tetraurelia; Sc, Stentor coeruleus; Sro, S. rosetta; Tad, T. adhaerens. (B) A phylogenetic tree prepared using the sequences used in A (Holozoa and ciliate orthologues of CYC8/CdaA), with the addition of a complete set of cyclin domain sequences for T. thermophila (Tt; based on Stover and Rice, 2011; Yan et al., 2016a) and the nonciliate alveolates T. gondii (Tg; based on Alvarez and Suvorova, 2017) and B. minutum (Bm; based on Cato et al., 2019). The names of human proteins, National Center for Biotechnology Information GI or accession numbers follow the species name abbreviations.
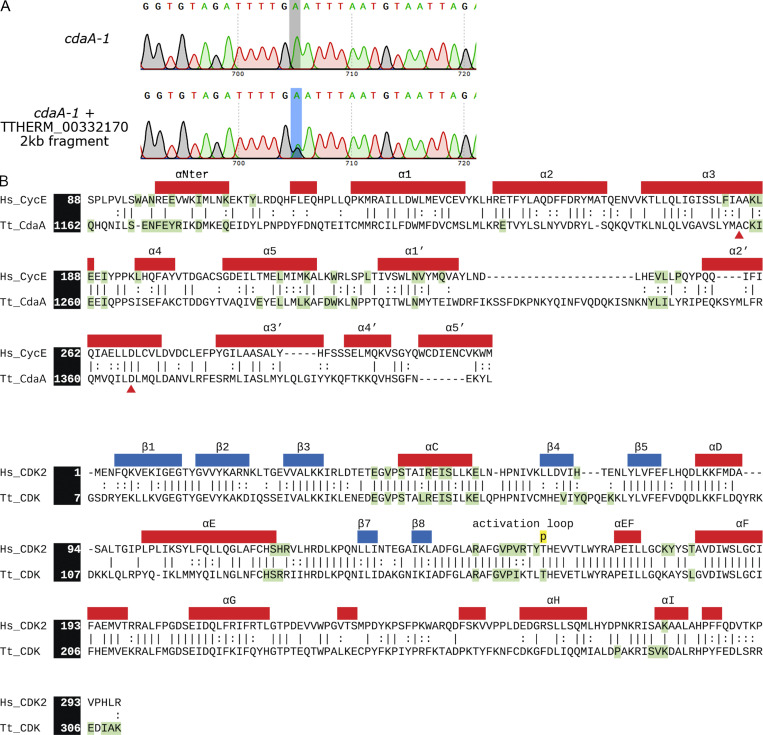
To test whether the A1256T substitution in TTHERM_00332170/CYC8 causes cdaA-1, we replaced the variant base with the wild-type base by DNA homologous recombination. Among the 107 of cdaA-1 cells biolistically transformed with a wild-type CDAA fragment and selected at 39°C, we isolated two proliferating clones; such clones did not appear among the mock-transformed cdaA-1 cells. The rescue clones contained dividing cells with proper cortical subdivisions (Fig. 2, C–F). Sanger sequencing of TTHERM_00332170/CYC8 in the rescued cells revealed both the variant and the wild-type base, consistent with partial gene replacement in the polyploid macronucleus (Fig. S2 A). Following the recommended nomenclature rules (Allen et al., 1998), we will refer to TTHERM_00332170/CYC8 gene as CDAA.
Figure S2.
TTHERM_00332170 encodes CdaA, a protein with a cyclin E domain that may form a complex with a CDK. (A) Sanger sequencing data of the PCR products obtained with primers that amplified a portion of the TTHERM_00332170/CYC8 coding region containing the candidate causal mutation (shaded). The top panel shows the corresponding sequence of the untransformed cdaA-1 mutant. The bottom panel shows the sequence amplified from one rescue clone. (B) Sequence alignments of cyclins (top) and CDKs (bottom) of H. sapiens and T. thermophila. Residues within 3.5 Å of the cyclin/CDK–binding interface are highlighted in green. Secondary structure information is based on a crystal structure of the human cyclin E1–CDK2 complex (PDB accession no. 1W98; Honda et al., 2005). The red triangles mark the amino acids mutated in the cdaA-1 and cdaA-4 proteins.
Typically, cyclins function by binding to and activating a cyclin-dependent kinase (CDK). We used homology-based modeling to predict the structure of a potential complex containing CdaA and Cdk1 of T. thermophila, a CDK similar to human CDK2 (Yan et al., 2016b), the binding partner of human cyclins E1 and E2 (Möröy and Geisen, 2004). As a template, we used the human cyclin E1–CDK2 complex (PDB accession no. 1W98); the regions of the two human proteins present in the structure share 51% and 72% sequence similarity with CdaA and Cdk1, respectively (Fig. S2 B). The model of CdaA fits well with that of human cyclin E1, except for a large insertion between the α1′ and α2′ helices (Fig. 2 G), which was predicted (Wang et al., 2016) to be flexible. The amino acids substituted in cdaA-1 and cdaA-4 are located within the cyclin domain and are highly conserved (Fig. S2 B). A1256 is conserved in all human cyclins except cyclin F. D1366 is conserved in human cyclins E1 and E2, and approximately half of other human cyclins have an acidic amino acid at this position. A1256 resides on the α3 helix and contributes to the hydrophobic packing against the α2 helix (Fig. 2 H, left panel). Based on computational mutagenesis (Park et al., 2016), A1256T destabilizes CdaA by 4.16 kcal/mol. By disrupting the packing interactions which stabilize the α3 helix, A1256T may impact the binding of the α3 helix to the αC helix of CDK1 (Fig. 2 G). D1366 resides on the α2′ helix, where it forms electrostatic interactions with R1221 and Y1225 on the α2 helix (Fig. 2 H, right panel). Like A1256, D1366 does not directly participate in the binding interface with CDK. Computational mutagenesis predicted that D1366N destabilizes CdaA by 2.71 kcal/mol. We conclude that the cdaA-1 and cdaA-4 mutations likely destabilize the CdaA cyclin domain, thereby also preventing the formation of the CdaA–CDK complex.
CdaA is expressed and spatially polarized in the cortex of dividing cells
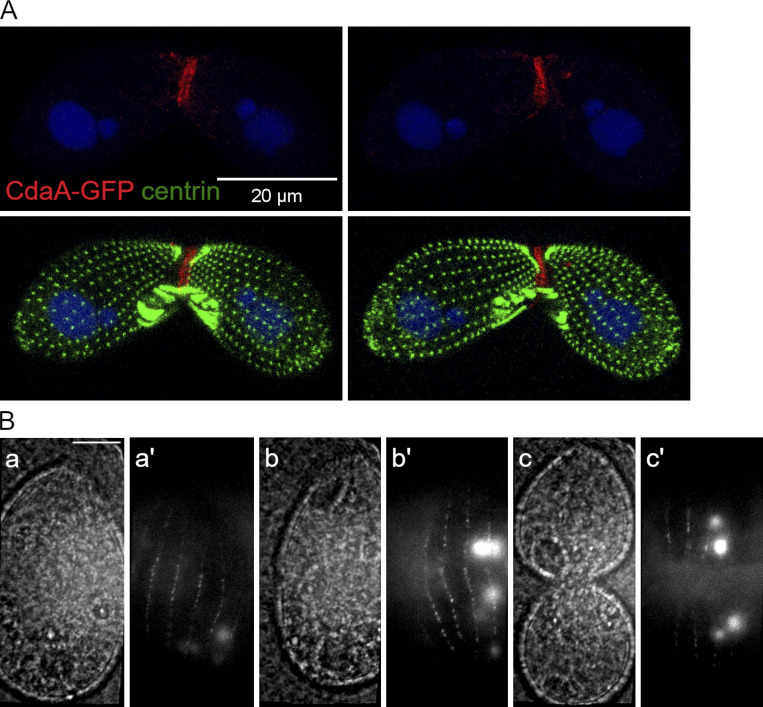
We engineered the CDAA gene to express a CdaA-GFP fusion under the native promoter. Unexpectedly, the CDAA mRNA was reported to be highly expressed only during conjugation, the sexual phase that T. thermophila cells can enter under nongrowing conditions (http://tfgd.ihb.ac.cn/search/detail/gene/TTHERM_00332170). Based on immunofluorescence, at 5 h after initiation of conjugation (corresponding to the peak of CDAA mRNA expression), there was a strong signal of CdaA-GFP along the junction between the mating partner cells (Fig. S3 A). However, no abnormalities were detected during conjugation between two cdaA-1 (micro- and macronuclear) homozygotes at either 29°C or 39°C, based on cytological and genetic criteria (results not shown). Thus, the function of CdaA during conjugation is either subtle or redundant or the cdaA-1 mutation does not affect CdaA during conjugation.
Figure S3.
CdaA-GFP localization in conjugating cells and vegetatively growing cells. (A) CdaA-GFP localizes to the junction of conjugating cells. The images show two sides of the same pair formed by a CdaA-GFP–expressing cell and a wild-type cell 5 h after induction of conjugation. The pair was stained with the anti-GFP (red), anti-centrin (green) antibodies and DAPI (blue). CdaA-GFP appears to be present on both the transgenic and nontransgenic side, indicating that CdaA exchanges between the mating partners. (B) TIRF imaging confirms that CdaA-GFP is present in the cell cortex in vivo. Dividing cells expressing CdaA-GFP were partially immobilized and imaged by TIRF microscopy (Jiang et al., 2015). Pairs of phase contrast and fluorescence images are shown for cells whose stages are prior or at the time of cortical subdivision before cytokinesis (a and a′), at the onset of cytokinesis (b and b′), and in advanced cytokinesis (c and c′). Scale bar, 10 μm.
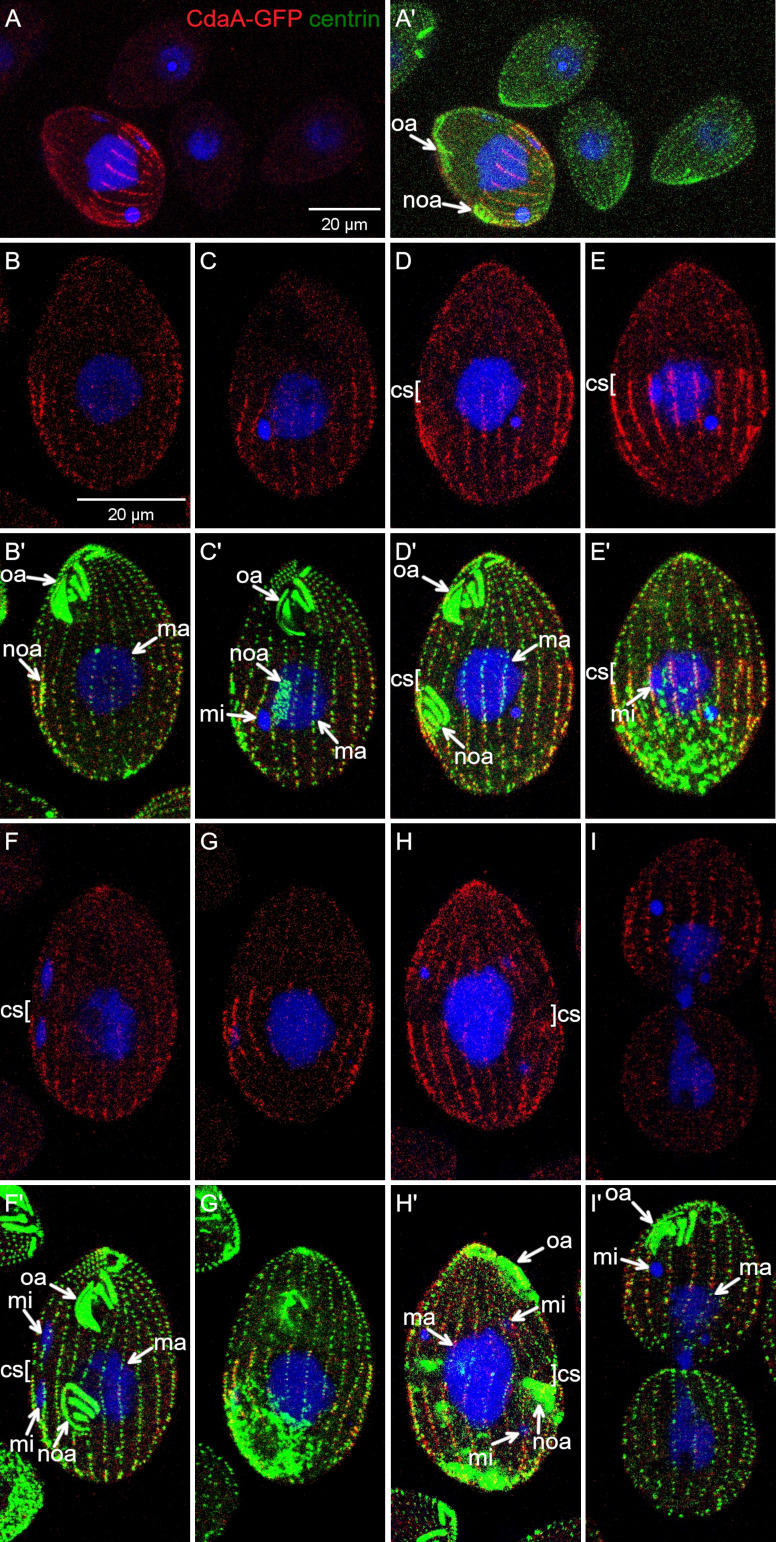
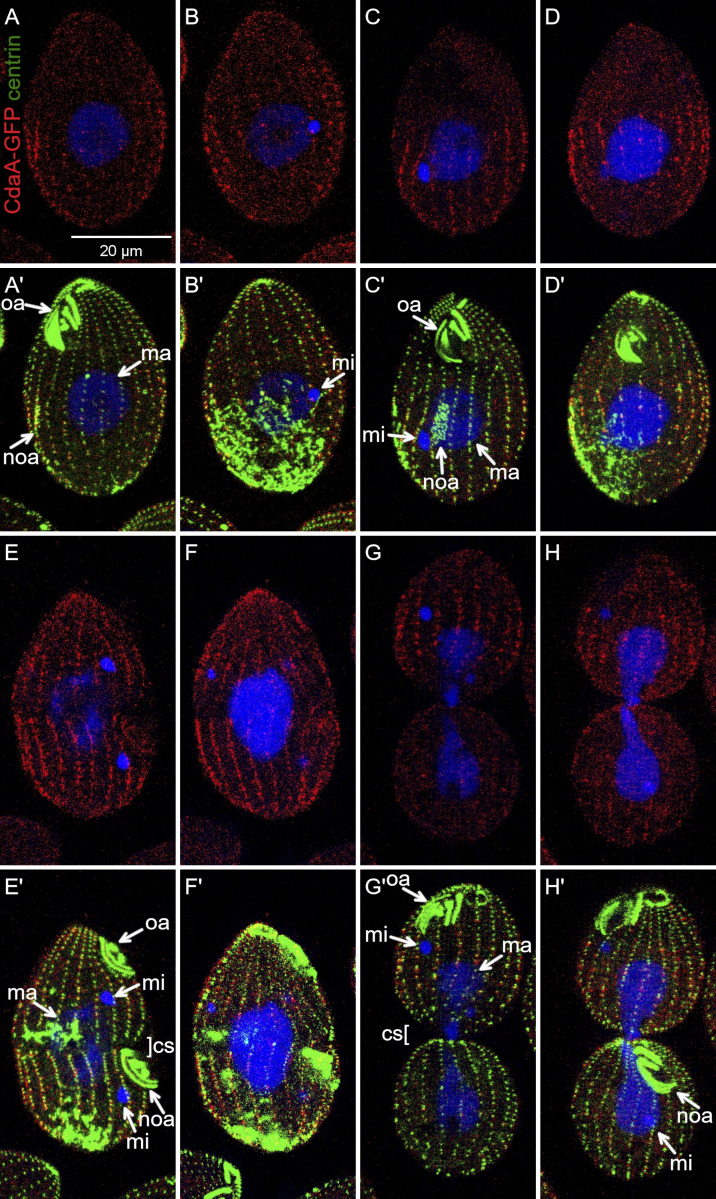
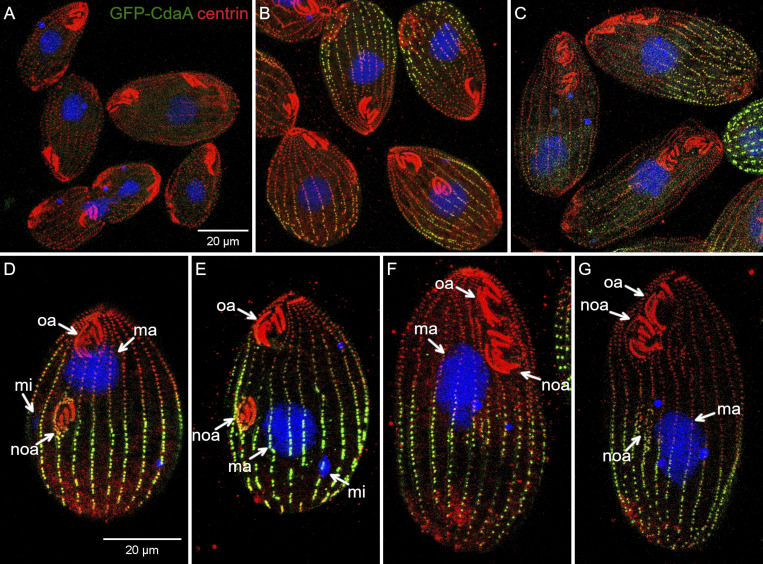
We could not detect CdaA-GFP in vegetatively growing cells by direct GFP fluorescence, indicating an extremely low expression level. Using polyclonal anti-GFP antibodies, CdaA-GFP was not detectable in the interphase cells but presented as longitudinal streaks in the dividing cells (Fig. 3, A and A′). Faint CdaA-GFP streaks were visible in the posterior half of early dividers (Fig. 3, B and B′; and Fig. S4, A–B′). In cells with a more advanced oral primordium, the CdaA-GFP streaks were prominent along the entire posterior cell half and around the entire cell circumference (Fig. 3, C and C′; and Fig. S4, C–D′). When the cortical subdivision formed, the anterior ends of the CdaA-GFP streaks coaligned with the basal bodies that were immediately posterior to the gaps in ciliary rows; at this stage, the signal intensity of CdaA-GFP was maximal (Fig. 3 D–G′). While at the stage of cortical subdivision CdaA-GFP is highly enriched in the posterior cell half; it is also detectable as a diffuse signal in the anterior cell half (Fig. 3, D–G′; and Fig. 3, A and A′; compare the dividing cell to the adjacent nondividing cells). Thus, the highly polarized pattern of CdaA-GFP is not a result of exclusion from the anterior cell half but rather is a consequence of preferential retention at the posterior cortex. At the onset of cytokinesis, the CdaA-GFP streaks uniformly covered most of the cell length, except for the fission zone and the old cell apex (Fig. 3, H and H′; and Fig. S4 E–F′). At late cytokinesis, the CdaA-GFP streaks remained visible in the anterior daughter (Fig. 3, I and I′; and Fig. S4, G–H′). A similar changing pattern of CdaA-GFP was detected in live cells by total internal reflection (TIRF) microscopy (Fig. S3 B).
Figure 3.
CdaA-GFP is spatially polarized in dividing cells. Confocal images of cells expressing CdaA-GFP stained with the anti-GFP (red), anti-centrin (green) antibodies and DAPI (blue). (A and A′) A field with multiple cells. Note that only the dividing cell has CdaA-GFP streaks. (B and B′) A cell in the early stage of cell division. The CdaA-GFP streaks of variable intensity are apparent throughout the posterior cell half. (C and C′) A cell in the intermediate stage of oral primordium differentiation. (D–E′) Two sides of the same cell in the early stage of cortical subdivision. (F–G′) Two sides of the same cell in an advanced stage of cortical subdivision. (H and H′) Early cytokinesis. (I and I′) Late cytokinesis. cs, cortical subdivision; ma, macronucleus; mi, micronucleus; noa, new oral apparatus (oral primordium); oa, oral apparatus.
Figure S4.
Confocal images of cells expressing CdaA-GFP under the native promoter stained with anti-GFP (red) and anti-centrin (green) antibodies and DAPI (blue). These images include and complement those in Fig. 3 by showing two sides of the same cells. cs, cortical subdivision; ma, macronucleus; mi, micronucleus; noa, new oral apparatus (oral primordium); oa, oral apparatus.
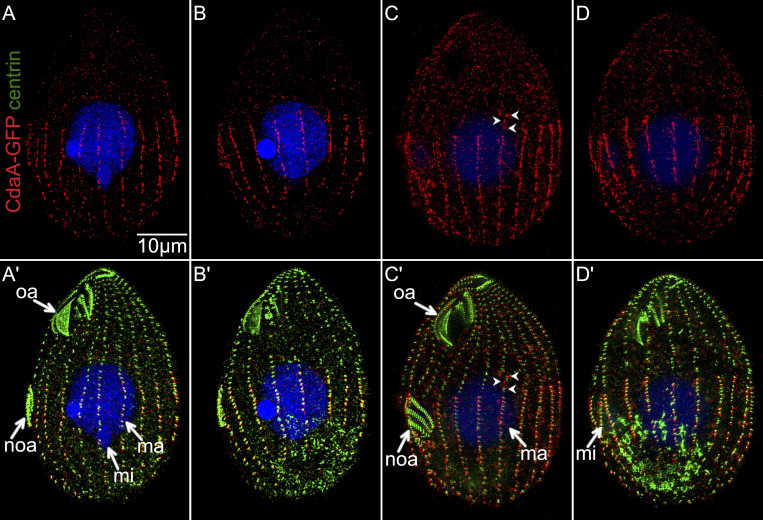
We used superresolution structured illumination microscopy (SR-SIM) to image CdaA-GFP at the critical stage of cortical subdivision (Fig. 4). At the early stage of cortical subdivision, in the rows that had already developed equatorial gaps, the streaks were ending at the basal bodies immediately posterior to the gaps (Fig. 4, A–B′). When the cortical subdivision was fully developed, all rows had gaps positioned anteriorly to the ends of CdaA-GFP streaks (Fig. 4 C–D′). Some gaps (and the corresponding ends of CdaA-GFP streaks) appeared to be offset by one or two basal body positions, giving the fission line a ragged appearance (Fig. 4). Possibly, the exact A/P positions of the CdaA-GFP streak ends and the associated gaps are resolved on a row-by-row basis. As cortical subdivision progresses, the CdaA-GFP signal increases in the anterior cell half, in some places highlighting the basal body rows (Fig. 4, C and D; compare to Fig. 4, A and B). Thus, the equalization of CdaA-GFP across most of the cell length that is prominent at cytokinesis (Fig. 3, H and H′) starts at the stage of late cortical subdivision.
Figure 4.
SR-SIM images of dividing cells expressing CdaA-GFP labeled with the anti-GFP (red) and anti-centrin (green) antibodies and DAPI (blue). (A–B′) Two sides of the same cell in the early stage of cortical subdivision. (C–D′) Two sides of the same cell in the late stage of cortical subdivision. In C, the arrowheads mark CdaA-GFP speckles in the anterior cell half along a basal body row. ma, macronucleus; mi, micronucleus; noa, new oral apparatus (oral primordium); oa, oral apparatus.
The A/P position of the division boundary is correlated with the anterior margin of the posterior cortical domain of CdaA
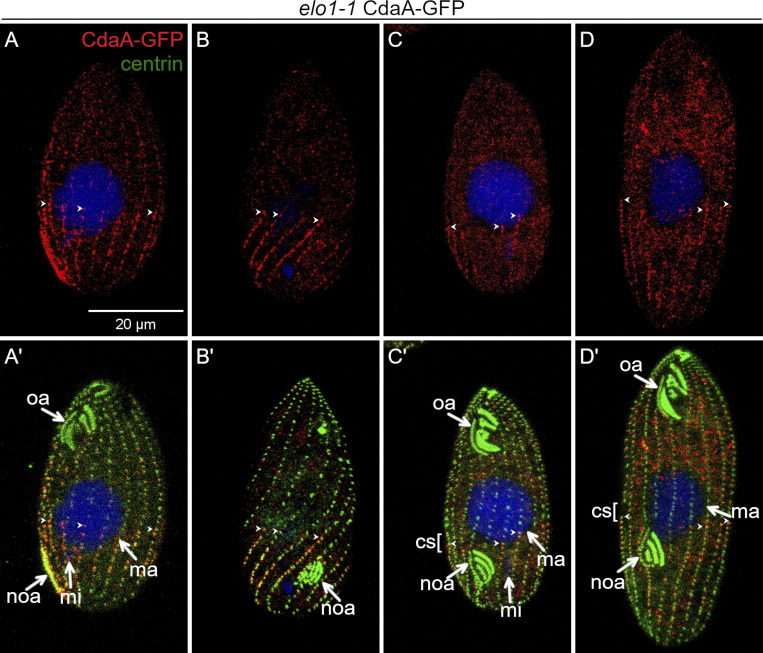
At the stage affected by the cdaA alleles, the initiation of cortical subdivision, gaps in the basal body rows form near the anterior ends of the CdaA-GFP streaks (Fig. 3, D–G′; and Fig. 4). The peri-equatorial alignment of the anterior ends of CdaA-GFP streaks occurs before any signs of cortical subdivision (Fig. 3, B–C′). Thus, the anterior ends of the CdaA-GFP streaks may guide the position of the forming cortical subdivision. We tested this model using the elo1-1 allele, which causes a posterior shift of the division boundary. In the elo1-1 background, before the formation of cortical subdivision, the anterior margin of the CdaA-GFP cortical domain was located abnormally close to the posterior cell end (Fig. 5, A–B′; compare with Fig. 3, B–C′). The elo1-1 cells entering division were highly variable in size, due to unequal divisions in the previous cell cycles. While the size of the posterior CdaA-GFP cortical domain scaled with the cell size, invariably, the cortical subdivision formed near the anterior ends of the CdaA-GFP streaks (Fig. 5, C–D′). Our observations support a model in which the cortical subdivision is activated along the preexisting anterior margin of the posterior CdaA cortical domain.
Figure 5.
The position of cortical subdivision correlates with the anterior margin of the posterior CdaA domain. (A–D′) Confocal images of elo1-1 mutant cells expressing CdaA-GFP stained with anti-GFP (red) and anti-centrin (green) antibodies and DAPI (blue). Examples of elo1-1 mutant cells before (A–B’) and during the formation of cortical subdivision (C–D’). (C–D′) Two elo1-1 cells with a cortical subdivision. The larger cell (D and D′) has a larger CdaA-GFP domain than the smaller cell (C and C′), but the cortical subdivision develops anteriorly to the anterior margin of CdaA-GFP. cs, cortical subdivision; mi, micronucleus; ma, macronucleus; noa, new oral apparatus (oral primordium); oa, oral apparatus. Arrowheads point to the anterior ends of some CdaA-GFP streaks.
CdaA and CdaI exclude each other from their cortical domains
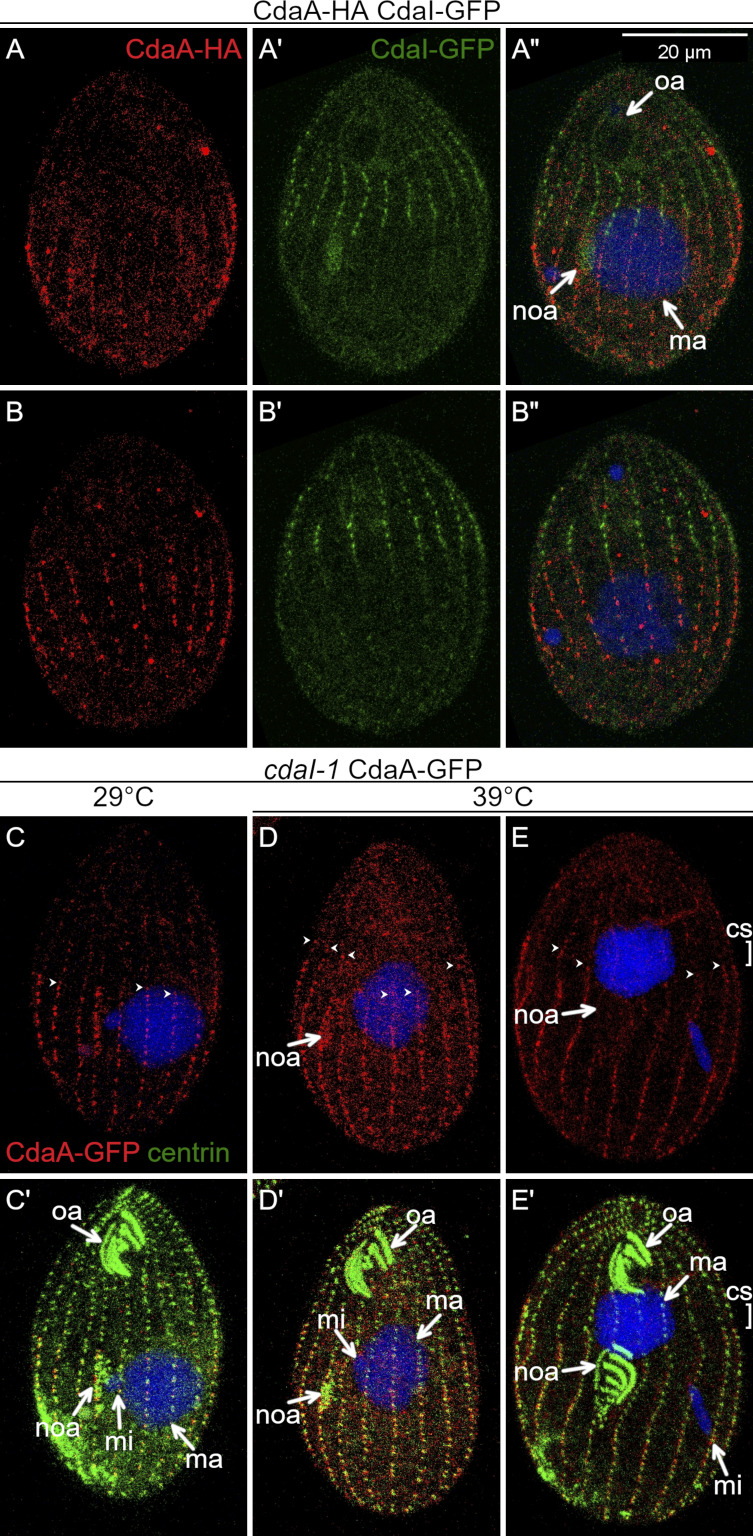
The formation of the CdaA streaks in the posterior cell half coincides with the formation of CdaI streaks in the anterior cell half and the cortical subdivision forms between the margins of CdaI and CdaA domains (Fig. 1 A). Double imaging of CdaI-GFP and CdaA-HA before the stage of cortical subdivision, revealed two nonoverlapping cortical domains, except that the oral primordium, while embedded inside the CdaA (posterior) domain, had a weak signal of CdaI-GFP (Fig. 6, A–B″). Mutations in either CdaA or CdaI compromise the position or course of cortical subdivision (Frankel, 2008; Frankel et al., 1976a, 1977, 1980; Jiang et al., 2017; Joachimiak et al., 2004). These associations indicate that CdaA and CdaI interact. We imaged CdaA-GFP in the background of cdaI-1 and CdaI-GFP in the background of cdaA-1. The cdaI-1 mutant cells divide normally at 29°C. At 39°C, the oral primordium develops at a correct A/P position but later shifts anteriorly, eventually ending up near the old oral apparatus. The cortical subdivision forms at an excessively anterior position, generating a small anterior and a large posterior daughter, respectively (see Fig. 10). In cdaI-1 cells grown at 29°C, the CdaA-GFP streaks had a normal pattern (Fig. 6, C and C′). At 39°C, before the cortical subdivision stage, the topology of CdaA-GFP was nearly normal except that the anterior ends of some CdaA-GFP streaks were abnormally extended into the anterior cell half (Fig. 6, D and D′). In cdaI-1 cells grown at 39°C, in which the cortical subdivision formed anteriorly to the displaced oral primordium, the CdaA-GFP streaks ended at the posterior edge of the displaced cortical subdivision (Fig. 6, E and E′). Thus, CdaI excludes CdaA-GFP from the anterior half of the dividing cell prior and during the formation of cortical subdivision.
Figure 6.
CdaI excludes CdaA-GFP from the anterior cortical domain. (A–B″) Prior to the cortical subdivision, CdaI and CdaA occupy complementary cortical domains. Two sides of the same cell coexpressing CdaI-GFP (green) and CdaA-HA (red); the fusion proteins are detected by immunofluorescence with anti-tag antibodies, and DNA is stained with DAPI (blue). (C–E′) CdaI excludes CdaA from the anterior cell half. The cells shown are cdaI-1 and express CdaA-GFP (detected with anti-GFP antibodies, red) and are stained with the anti-centrin (green) and DAPI (blue) after growth at either 29°C (C and C′) or 39°C (D–E′). (C and C′) An early divider (before the cortical subdivision) at 29°C. (D and D′) A cdaI-1 cell at the early stage of the oral primordium development, before its migration in the anterior direction. Note that the anterior ends of some of the CdaA-GFP streaks (arrowheads) are abnormally extended into the anterior cell half (compare with Fig. 3, B–C′). (E and E′) A cdaI-1 cell in which the oral primordium has already shifted in the anterior direction and the cortical subdivision has started to develop at that shifted position. The anterior ends of the CdaA-GFP streaks are immediately posterior to the shifted cortical subdivision. cs, cortical subdivision; ma, macronucleus; mi, micronucleus; noa, new oral apparatus (oral primordium); oa, oral apparatus. In C–E, the arrowheads show the anterior ends of some of the CdaA-GFP streaks.
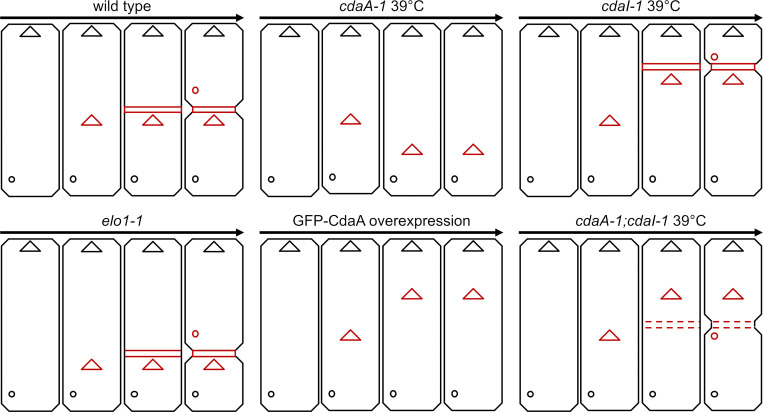
Figure 10.
A graphical summary of the cortical phenotypes of mutants analyzed. The positions of three new structures are shown in red: oral primordium (triangles), cortical subdivision (dashed or continuous horizontal bars), and new CVPs (circles). The parental oral apparatus and CVPs are shown in black. The arrows indicate the progression of time. Note that in the case of the single cdaA-1 mutant cells, we did not show the increase in the total size of these cells that is primarily caused by expansion of the area anterior to the oral primordium (see Table S1).
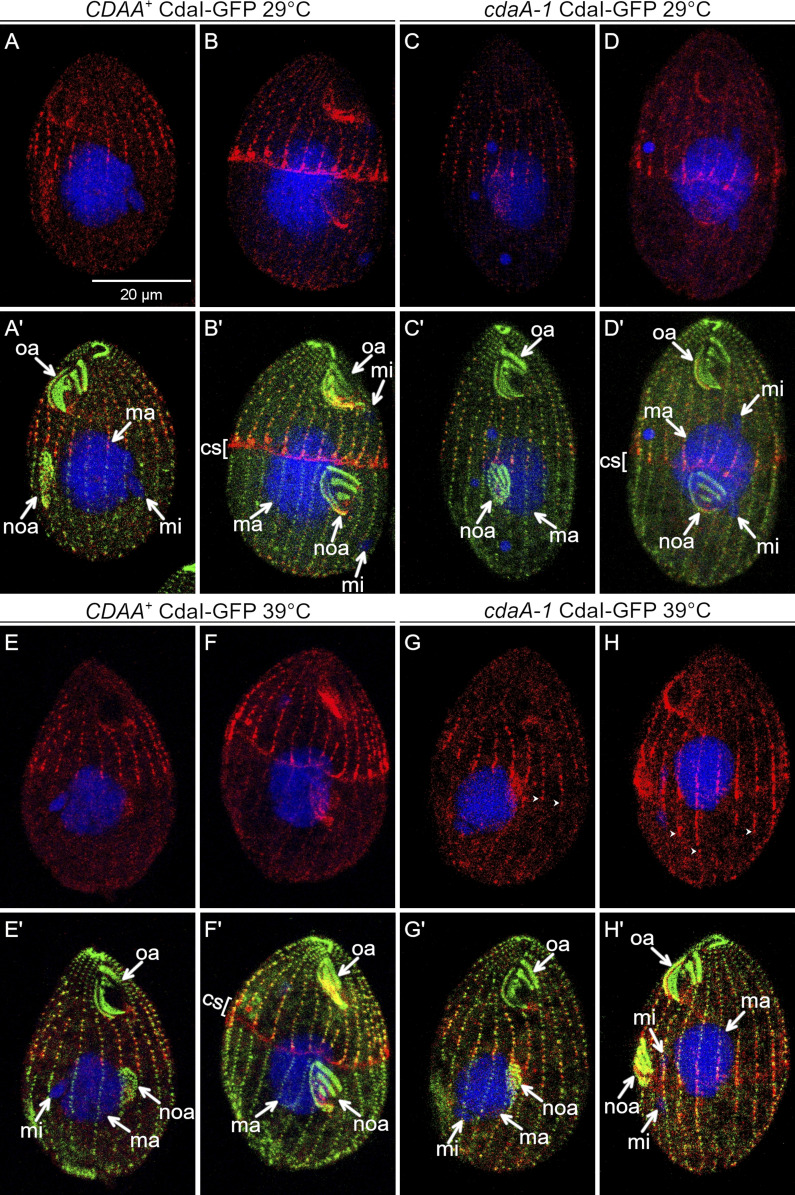
We then examined how cdaA-1 affects CdaI. As reported previously (Jiang et al., 2017), in wild-type (at 29°C and 39°C) or cdaA-1 cells at 29°C, CdaI-GFP first appeared in the anterior cell half during an intermediate stage of oral primordium development, as streaks ending anteriorly to the presumptive plane of cortical subdivision (Fig. 7, A, A′, C, C′, E, and E′). When the cortical subdivision formed, the CdaI-GFP signal became stronger at the posterior ends of the streaks, and CdaI-GFP spread laterally between the streaks, forming a thick band anteriorly to the cortical subdivision (Fig. 7, B, B′, D, D′, F, and F′). We will refer to this change as the “polarization of CdaI.” In cdaA-1 cells at 39°C before the cortical subdivision, the streaks of CdaI-GFP abnormally penetrated into the posterior cell half; in the cell shown in Fig. 7, G and G′, the posterior ends of several CdaI-GFP streaks are aligned with the posterior edge of the oral primordium, while in the wild type the streaks end near the anterior edge of the oral primordium (Fig. 7, E and E′). Because at this stage of normal development (judging by the stages of the oral primordium and micronuclear mitosis), the cortical subdivision is not present yet, the posterior expansion of CdaI-GFP is not due to a failure of cortical subdivision. At the later stage (at which the cortical subdivision is present under permissive conditions), the CdaI-GFP streaks penetrated more deeply into the posterior cell half and the polarization of CdaI streaks was not apparent (Fig. 7, H and H′). Thus, CdaA confines the CdaI streaks to the anterior cell half prior to and during the formation of cortical subdivision. To summarize, CdaA and CdaI mutually exclude each other from their own cortical domains.
Figure 7.
CdaA excludes the CdaI streaks from the posterior cortical domain. CdaI-GFP-expressing cells (detected with anti-GFP antibodies, red) were stained with anti-centrin antibodies (green) and DAPI (blue) after growth at either 29°C or 39°C. At 29°C, the pattern of CdaI-GFP is normal in both wild-type (A–D′) and cdaI-1 backgrounds (E–F′), except for a slight anterior displacement of the oral primordium and the division plane in wild-type background cells expressing CdaI-GFP, due to a partial loss of function of CdaI caused by addition of GFP (Jiang et al., 2017, 2019a). At 39°C in the cdaA-1 background, the CdaI-GFP streaks leak into the posterior half of the cell (G–H′). cs, cortical subdivision; ma, macronucleus; mi, micronucleus; noa, new oral apparatus (oral primordium); oa, oral apparatus. The arrowheads show the posterior ends of some CdaI-GFP streaks.
The phenotype of cdaA-1;cdaI-1 double mutants is consistent with CdaI activity inhibiting CdaA activity
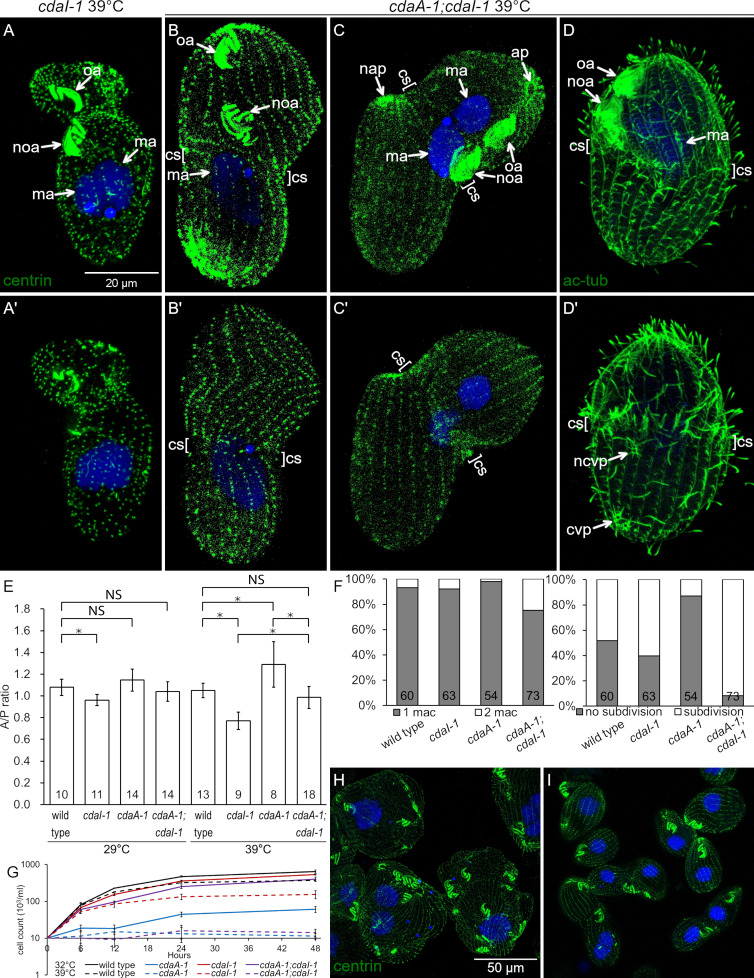
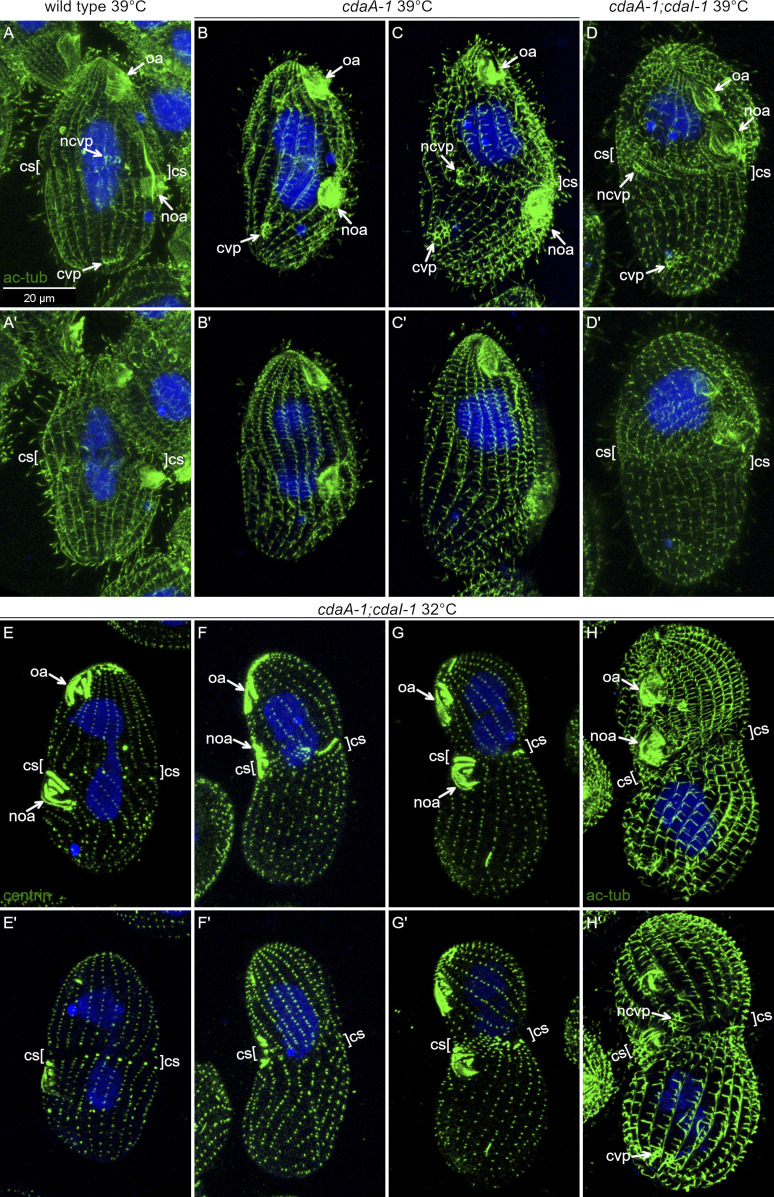
We further explored whether CdaI and CdaA interact by examining cdaA-1;cdaI-1 double mutants. The double mutants proliferated well at 29°C. After 3.5 h at 39°C, most of the cdaA-1;cdaI-1 mutants were arrested in cell division. Like the single cdaI-1 mutants (Jiang et al., 2017; Fig. 8, A and A′), most arrested double mutants had an anteriorly shifted oral primordium (Fig. 8, B–C′). Strikingly, while most single cdaA-1 mutants failed to develop the cortical subdivision (Fig. 1, J and K; and Fig. 8 F, right), most double mutants had at least a partial cortical subdivision (Fig. 8, B–D′, “cs”; and Fig. 8 F, right). Most single cdaA-1 mutants failed to undergo events subsequent to the cortical subdivision: cytokinesis and macronuclear amitosis (Fig. 1, G–K). In comparison to the cdaA-1 mutants, a higher proportion of double mutants contained two macronuclei, indicating an increased ability to complete amitosis (Fig. 8, C and C′; and Fig. 8 F, left). The new cell apex was occasionally visible in the forming posterior daughter of cdaA-1;cdaI-1 cells (Fig. 8, C and C′). While the new CVPs fail to form in the majority of cdaA-1 single mutants (Fig. S5, B and B′; compare with Fig. S5, A and A′), they were visible in most cdaA-1;cdaI-1 dividing cells (Fig. 8, D and D′; and Fig. S5, D and D′), except that their A/P positions were often abnormal (see next section). Thus, at 39°C, cdaI-1 partially suppresses the mutant phenotype of cdaA-1 in regard to the formation of cortical subdivision and execution of downstream events (macronuclear amitosis and assembly of structures associated with the new cell ends).
Figure 8.
Phenotypes of double mutants reveal interactions between CdaA and CdaI. (A–C′) Pairs of images showing two sides of the same cells stained with anti-centrin (green) and DAPI (blue) after growth at 39°C for 3 1/2 h (A-A′) A cdaI-1 cell. Note the anterior shift of both the oral primordium and the division plane. (B–C′) Double-mutant cdaA-1;cdaI-1 cells that are arrested in cell division; note an anterior shift of the oral primordium (noa). A cortical subdivision (cs) has developed at least partially. In the cell shown in C and C′ the cell division went further as compared with the cell shown in B and B′. The posterior presumptive daughter has developed an apex (nap) and the macronucleus has divided. (D and D′) Two sides of a double-mutant cell stained with the 6–11 B-1 antibody directed against acetyl-K40 α-tubulin that reveals cortical microtubules including those forming the CVPs. The cell has a pair of old CVPs (cvp) near the posterior end and a single new CVP (ncvp) located a short distance posterior to the cortical subdivision. (E) A graph that shows the average A/P ratios of wild-type and mutant dividing cells at 29°C or 39°C. For the cdaA-1/39°C measurements, we used the plane immediately anterior to the oral primordium as the division boundary. The numbers of cells measured are indicated. The error bars represent standard deviations. Asterisks indicate significant differences between datasets connected by brackets (*, P < 0.01, ANOVA single-factor test). (F) Graphs document the frequencies of macronuclear division (left) and cortical subdivision (right) in dividing cells grown at 39°C for 3.5 h. The numbers of scored cells are indicated. (G) Cell culture multiplication curves of strains with the indicated genotypes at either 32°C or 39°C. All data were obtained using strains homozygous for either cdaI-1 (strain UG-I-3), cdaA-1 (UG-A-2), or both alleles (UG-AI-1) derived from a single genetic background (see Table S2). Averages of three experiments are shown. The error bars represent SD. (H and I) cdaA-1 (H) and cdaA-1;cdaI-1 cells (I) grown for 28 h at 32°C and stained with the anti-centrin and DAPI. Note the nearly complete absence of cell division arrests in the double mutants. ap, cell apex; cvp, contractile vacuole pore; ma, macronucleus; nap, new cell apex in the posterior daughter; ncvp, new CVP; noa, new oral apparatus (oral primordium); oa, oral apparatus.
Figure S5.
CdaI and CdaA interact to position new structures. (A–D′) Effects of cdaA-1 and cdaI-1 mutations on positions of new CVPs. Cells were incubated at 39°C for 3 h and labeled with the monoclonal antibody 6–11 B-1 directed against acetyl-K40 α-tubulin (green) that labels ciliary and cortical microtubules, including those forming the CVPs. The nuclei are stained with DAPI (blue). (A and A′) A dividing wild-type cell. The new CVPs appear anteriorly to the cortical subdivision. (B and B′) A dividing cdaA-1 cell that failed to develop a cortical subdivision. The old CVPs are present but the new CVPs failed to form. (C and C′) A rare dividing cdaA-1 cell that has developed a partial cortical subdivision. The new CVPs are anterior and at the level of cortical subdivision. (D and D′) A double-mutant cdaA-1;cdaI-1 cell. The new CVPs are located at the level of or immediately posteriorly to the cortical subdivision. (E–H′) Double-mutant cdaA-1;cdaI-1 cells after 28-h incubation at 32°C labeled with either the anti-centrin (E–G′) or 6–11 B-1 anti-acetyl-K40 α-tubulin antibody (H and H′) and DAPI. (E and E′) A morphologically normal dividing cdaA-1;cdaI-1 cell. (F–H′). Examples of dividing cdaA-1;cdaI-1 cells with an anterior shift of the division plane. (F and F′) The fission furrow appears to cut through the oral primordium. (H and H′) A dividing cdaA-1;cdaI-1 cell with an anterior shift of the division plane. The CVPs form correctly in relation to the cortical subdivision (resembling cdaI-1 alone). cs, cortical subdivision; cvp, old CVP; ncvp, new CVP; noa, new oral apparatus (oral primordium); oa, oral apparatus.
Despite their increased ability to progress in cell division, at 39°C, most of the double mutants failed to complete cytokinesis and failed to multiply (Fig. 8 G), which is a terminal phenotype of cdaA-1 and not of cdaI-1 (Jiang et al., 2017). At an intermediate temperature of 32°C, the single cdaA-1 mutants multiplied extremely slowly (Fig. 8 G), and most had developed the monster morphology consistent with repeated division failures (Fig. 8 H). At the same temperature, the slow cell multiplication and cell division failures were nearly completely suppressed in the cdaA-1;cdaI-1 cells (Fig. 8, G and I). Because both cdaI-1 and cdaA-1 are likely loss-of-function alleles (Jiang et al., 2017; this study), these observations taken together indicate that CdaI activity (directly or indirectly) inhibits CdaA activity.
Loss of both CdaA and CdaI decouples the A/P positions of cortical structures
In the wild type, the oral primordium appears at a submedial position, the cortical subdivision forms anteriorly to the oral primordium, and the new CVPs form anteriorly to the cortical subdivision (see Fig. 10). At 39°C, cdaI-1 shifts all three new structures in the anterior direction but does not alter their relative positions (see Fig. 10). Strikingly, in the cdaA-1;cdaI-1 double mutants at 39°C, the relative positions of these three structures were uncoupled. While the oral primordium shifted anteriorly (as in cdaI-1), the cortical subdivisions formed posteriorly to the oral primordium, roughly along the cell equator (Fig. 8, B–D′; and Fig. S5, D–D′). To quantify this phenotype, we measured the “A/P ratio,” which is the length of the presumptive anterior daughter divided by the length of the presumptive posterior daughter (Fig. 8 E). In the wild type, the A/P ratio was ∼1 regardless of the temperature, indicating that the two presumptive daughters are of equal size. The A/P ratio was significantly decreased in cdaI-1 (detectable at 29°C and pronounced at 39°C; Fig. 8 E), reflecting the anterior shift in the division plane. At 29°C, the single cdaA-1 mutants had a slightly increased A/P ratio, but the difference lacked statistical support (P = 0.09). At 39°C, the position of the fission plane could not be determined in most cdaA-1 mutants due to the failure to form the cortical subdivision. When the position immediately anterior to the oral primordium was used as the presumptive division plane, then at 39°C the cdaA-1 cells had an increased A/P ratio (Fig. 8 E and Fig. 1 K; compare with Fig. 1 F). Interestingly, this change resulted from an enlargement of the cell region anterior to the oral primordium while the size of the remaining posterior region was unchanged (Table S1). In the double mutants at 39°C, the A/P ratio has normalized (Fig. 8 E). Thus, cdaA-1 suppresses the anterior shift of cortical subdivision caused by cdaI-1. This is consistent with inhibition of CdaI activity by CdaA activity in the context of the A/P positioning of the cortical subdivision. Because cdaA-1 does not suppress the anterior shift of the oral primordium caused by cdaI-1, in the double mutants, the relative positions of the two structures become uncoupled.
In the wild type, new CVPs form anteriorly to the cortical subdivision (see Fig. 10; and Fig. S5, A and A′). In the single cdaI-1 mutants, the positions of new CVPs shift anteriorly but remain in agreement with the displaced cortical subdivision (see Fig. 10). After 3 h at 39°C, the majority of the arrested cdaA-1 cells (86%; n = 50) lacked new CVPs (Fig. S5, B and B′). The few cdaA-1 cells that formed new CVPs also had a partial cortical subdivision (Fig. S5, C and C′). Likely, these cdaA-1 cells were approaching the stage of cortical subdivision at the onset of temperature shift. Among the few cdaA-1 cells that had developed new CVPs, these structures were either anterior or at the level of the cortical subdivision (Fig. S5, C and C′). In contrast, 68% (n = 50) of the similarly treated dividing cdaA-1;cdaI-1 double mutants had new fig8 CVPs. However, these structures were located either at the level of (76%) or posterior (24%) to the cortical subdivision (Fig. 8, D and D′; and Fig. S5, D and D′). Thus, at 39°C, cdaI-1 partially suppresses the defect in the assembly of new CVPs caused by cdaA-1. However, under these conditions, the position of the new CVPs relative to the cortical subdivision were often abnormal (see Fig. 10).
At the intermediate temperature of 32°C at which cdaI-1 largely rescued the cell division arrests conferred by cdaA-1, the defects in the positioning of the three new structures (oral primordium, cortical subdivision, and CVPs) were almost completely suppressed. A majority of the dividing cdaA-1;cdaI-1 cells formed an oral primordium at the correct submedial position and developed a proper cortical subdivision (Fig. S5, E and E′). The new CVPs appeared anteriorly to the cortical subdivision (Fig. S5, H and H′). In some dividing cdaA-1;cdaI-1 cells, the oral primordium and cortical subdivision were shifted toward the anterior cell end, which is the phenotype of cdaI-1 at 39°C (Fig. S5, G–H′). In other cells, the cortical subdivision formed at the level of the oral primordium and the fission furrow cut through the middle of the oral primordium (Fig. S5, F and F′). Thus, at 32°C, the loss of CdaA activity is nearly completely suppressed by a loss of CdaI in regard to the initiation of formation and positioning of new structures. Overall, the analyses of the double mutants reveal the importance of a balance between the CdaI and CdaA activities for the formation and correct A/P positioning of the new structures including the cortical subdivision and new CVPs.
Overexpression of CdaA phenocopies a loss of CdaI, consistent with CdaA activity inhibiting CdaI activity
To further test the importance of a balance between CdaA and CdaI activities, we overproduced GFP-CdaA using a cadmium-inducible promoter, MTT1p (Shang et al., 2002). After 3 h of overproduction, most cells were arrested in cell division, with an oral primordium but without a cortical subdivision (Fig. 9 B; compare with Fig. 9 A). Despite overexpression, GFP-CdaA was enriched in the posterior cell half (Fig. 9, D–F). Possibly, the shift from an asymmetrical pattern of CdaA (enriched in the posterior cell half) to a symmetrical one (present in both cell halves), which normally is initiated at the stage of advanced cortical subdivision (Fig. 4, B–B′), requires the cortical subdivision. After 6 h, most of the overproducing cells were abnormally large and had two oral apparatuses arranged in tandem near the anterior cell end (Fig. 9, C and G) resembling the cdaI-1 cells at 39°C. Unlike the cdaI-1 cells, the GFP-CdaA–overproducing cells did not develop the cortical subdivision anteriorly to the shifted oral primordium. However, cells carrying a stronger allele, cdaI-3, frequently fail to undergo cortical subdivision (Frankel, 2008; J. Frankel, unpublished data). Thus, overexpression of GFP-CdaA produces a close imitation of the loss of CdaI, consistent with CdaA activity inhibiting CdaI activity. Likely, a balance between the two activities is required for proper A/P positioning of the oral primordium and the formation of cortical subdivision.
Figure 9.
Overexpression of GFP-CdaA partially phenocopies a loss of CdaI. (A–C) Cells that contain a transgene for overexpression of GFP-CdaA under the cadmium-dependent MTT1 promoter at time = 0 (A) and after 3 (B) and 6 h (C) of exposure to 2.5 µg/ml cadmium chloride. The cells shown were labeled with anti-GFP (green) and anti-centrin (red) antibodies and DAPI (blue). After 3 h (B), cells accumulate in cell division (almost all cells have an oral primordium). (C) Cells that overproduce GFP-CdaA for 6 h become elongated and have two oral apparatuses near the anterior cell end. (D–G) Examples of individual overproducing cells at 3 h (D–F) or 6 h (G). ma, macronucleus; mi, micronucleus; noa, new oral apparatus (oral primordium); oa, oral apparatus.
Discussion
CdaA is a spatially polarized cyclin E
In a dividing ciliate, the formation of the division boundary at the cell’s equator is a key step in remodeling of the parental cell into two daughters. In T. thermophila, the conditional mutations in CDAA block the formation of the division boundary (Frankel et al., 1976b, 1977, 1980; Joachimiak et al., 2004; Kaczanowska et al., 1992, 1993, 1999). We find that CDAA encodes a cyclin E that accumulates in the posterior cell cortex shortly before the initiation of the formation of the division boundary, at its earliest stage of cortical subdivision.
CdaA may activate a CDK to phosphorylate a protein involved in the initiation of cortical subdivision. Okadaic acid partially suppresses the cdaA-1 phenotype (Buzanska and Wheatley, 1994), suggesting that the phosphorylation activity generated by the putative CdaA–CDK complex competes with dephosphorylation by an unspecified phosphatase. One potential substrate of a CdaA-dependent phosphorylation is Cmb1/p85, a protein that associates with the equatorial cortex, whose gel mobility changes in cdaA-1 cells at the restrictive temperature (Gonda et al., 1999; Ohba et al., 1986).
At the time of induction of cortical subdivision, CdaA is enriched in the posterior cell half but is depleted from the narrow strip of equatorial cortex where the cortical subdivision forms. The activity of CdaA within the posterior cortex may translate into inductive events immediately outside of the CdaA cortical domain. Our observations indicate that the induction of cortical subdivision requires a balance between the posterior CdaA and anterior CdaI. Both CdaA and CdaI are needed for the cortical subdivision to form at the proper time and position (this study and Frankel et al., 1977, 1980; Jiang et al., 2017). CdaA and CdaI may exclude not only each other from their own cortical domains but also unknown factors needed for the formation of the division boundary. Consequently, such factors may reach threshold concentrations only between the margins of the CdaA and CdaI domains along the cell’s equator.
A balance between CdaA and CdaI positions multiple structures along the A/P axis
In addition to their role in the formation of the cortical subdivision, a balance of CdaA and CdaI activities is required for the formation of new CVPs and their placement anterior to the cortical subdivision. Likely, CdaI and CdaA also interact to maintain the position of the oral primordium. The oral primordium appears at the onset of cell division before the cortical accumulation of CdaI and CdaA. As the oral primordium develops, the maintenance of its subequatorial position requires CdaI (Jiang et al., 2017); namely, cdaI-1 at 39°C causes an anterior migration of the oral primordium. While this phenotype of cdaI-1 is not modified by cdaA-1, overexpression of GFP-CdaA causes an anterior migration of the oral primordium, indicating that CdaA activity inhibits CdaI activity to maintain the A/P position of the oral primordium.
Intriguingly, while the relative positions of the three structures (oral primordium, cortical subdivision, and new CVPs) are preserved in the cdaI-1 mutants (despite their excessively anterior positions), they are decoupled in the double cdaA-1;cdaI-1 mutants (Fig. 10). CdaA may make nonequivalent contributions to the positioning of specific cortical structures. For example, CdaA may interact with additional components to position specific structures.
Evolutionary conservation of cortical antagonism
We show that in T. thermophila, CdaI (Hippo/Mst) and CdaA (cyclin E) are mutually antagonistic in respect to both their localizations and activities. Mutual antagonism is the hallmark of the Par protein networks that polarize animal cells. Par proteins segregate into opposite cortical domains (e.g., anterior and posterior) whose boundaries are maintained by inhibitory cross-phosphorylations (reviewed in Motegi and Seydoux, 2013). T. thermophila lacks orthologues of most of the Par network proteins, with the exception of CDC42 (TTHERM_00267910). Also, TTHERM_01017250 has weak similarity to PAR-1 (Kaczanowska et al., 2008). Despite the limited conservation of the Par network, the logic of cell polarization, based on cortical mutual antagonism, is conserved between animals and ciliates, lineages that have diverged from the common eukaryotic ancestor ∼1.5 billion years ago (Adl et al., 2012). Moreover, both ciliates and animals use Hippo signaling and cyclin E for cell polarization. While in animals Hippo signaling is primarily seen as acting downstream of the Par networks (reviewed in Ajduk and Zernicka-Goetz, 2016 and Richardson and Portela, 2017), Hippo signaling also contributes to the proper formation and maintenance of apicobasal polarization (Genevet et al., 2009; Hamaratoglu et al., 2009; Lee et al., 2019; Nantie et al., 2018). In addition to its canonical role in cell cycle progression, cyclin E is required for the establishment of cell polarity in Caenorhabditis elegans embryos (Cowan and Hyman, 2006) and Drosophila melanogaster neuroblasts (Berger et al., 2005, 2010; Bhat and Apsel, 2004). Cyclin E interacts with proteins that contribute to the apicobasal and planar cell polarities in Drosophila (Brumby et al., 2004). In T. thermophila (this study) and dividing neuroblasts of Drosophila (Berger et al., 2005), cyclin E is asymmetrically distributed among the presumptive daughter cells. Surprisingly, cyclins E were so far found only in Holozoa (animals and closely related unicellular species such as the filasterean Capsaspora owczarzaki), an apusozoan T. trahens, and ciliates (Cao et al., 2014; Stover and Rice, 2011; Suga et al., 2013; this study). Possibly, the association of cyclin E with cell polarity predates the emergence of Holozoa and ciliates from the common eukaryotic ancestor. However, we cannot exclude a possibility that ciliates gained cyclin E during convergent evolution or by horizontal gene transfer. In Drosophila, Hippo signaling promotes cell cycle arrest by reducing cyclin E expression (Harvey et al., 2003; Shimizu et al., 2008; Udan et al., 2003; Wu et al., 2003). It remains to be established whether, like in ciliates, in animals Hippo signaling and cyclin E are mutually antagonistic in the context of cell polarity and organelle positioning.
Ciliate models have potential to provide further insights into how cortical polarity domains form and generate positional information for organelles. In large ciliates, cortical domains can be manipulated using microsurgery. Some of the most insightful microsurgeries were done in Stentor by Vance Tartar (reviewed in Frankel, 1989 and Frankel and Whiteley, 1993). In one of Tartar’s experiments, the equatorial region containing the division plane was removed from the dividing Stentor and the remaining parts of the operated cell allowed to rejoin. The operated cells developed a new division zone along the heal line and completed their division (Tartar, 1967). We suggested above that the exclusionary activities of CdaI and CdaA concentrate factors needed for both the initiation of the division boundary and the execution of cell division. Likely Tartar’s operation of removing the equatorial fission zone left the Stentor’s CdaI and CdaA domains sufficiently intact to regenerate the cell division boundary. In another remarkable experiment, Tartar dissected the equatorial division zone and transplanted it into a “wrong” location in a different cell. As long as the recipient cell was also dividing, the transplanted cortical segment continued to function as the division zone regardless of its position (Tartar, 1968). Thus, experiments in ciliates show that cortical domains can be highly autonomous, capable of maintaining their activities and size. Further investigations in ciliate models could therefore shed light on how cortical domains self-regulate and how the information from these domains is translated into precise positioning of organelles, without cues from other cells.
Materials and methods
Strains and cell culture
All strains of T. thermophila used were either obtained from the Tetrahymena Stock Center (Cornell University, Ithaca, NY) or produced by crosses. To compare the phenotypes of the single and double cdaI-1 and cdaA-1 mutants, all genotypes were obtained from the same genetic background of a double heterozygote. The genotypes of all strains used are listed in Table S2. Cells were grown in the SPP medium (1% proteose-peptone, 0.2% dextrose, 0.1% yeast extract, and 0.003% EDTA ferric sodium salt) with antibiotics (SPPA; Gaertig et al., 2013; Gorovsky, 1973).
Identification of causal mutations for cdaA alleles using NGS
To map the causal mutation for cdaA-1, we used a comparative NGS approach of ACCA (Jiang et al., 2017). Strain IA104 (homozygous for cdaA-1) was crossed to the mapping strain CU427 (homozygous for the chx1-1 cycloheximide [cy] resistance allele in the micronucleus). After eight daily transfers, the F1 progeny clones of IA104 × CU427 were screened for assortment to cy sensitivity. A single cy-sensitive and highly fertile F1 was mated to the self-crossing strain B*VII. The self-cross progeny selection protocol used was short circuit genomic exclusion, which produces mostly homozygotes (Bruns et al., 1976), as described in detail elsewhere (Jiang et al., 2017). The F2 progeny of F1 × B*VII were selected with 15 µg/ml cy and tested for the cdaA-1 phenotype at 39°C overnight. 41 F2 clones with the cdaA-1 phenotype and an equal number of F2 clones with the wild-type phenotype were combined into separate pools. The pools were grown overnight in 25 ml SPPA to a late log phase and subjected to starvation in 60 mM Tris-HCl, pH 7.5, for 2 d at 30°C. Total DNA was extracted from each pool (Gaertig et al., 1994) and used to make genomic libraries using the Illumina Truseq primer adapters. The libraries were sequenced using Illumina HiSeq X to generate paired-end reads of 150 bp length at ∼90× genome coverage. The MiModD suite of bioinformatics tools (version 0.1.8; https://sourceforge.net/projects/mimodd/) was used to execute the ACCA variant mapping workflow as follows. The sequencing reads of the cdaA-1 and wild-type F2 pools were aligned to the macronuclear reference genome of the wild-type strain SB210 (GenBank assembly accession GCA_000189635; Eisen et al., 2006), and multisample variant calling was performed. The resulting variants were annotated for the predicted effects on the gene products, and the macronuclear coordinates were converted into the corresponding micronuclear coordinates (GenBank assembly accession no. GCA_000261185.1; Hamilton et al., 2016). For each variant, linkage scores were computed that contrast the allelic composition of the mutant with that of the wild-type pool. The linkage score values were plotted against the micronuclear coordinates along the five micronuclear chromosomes. This analysis revealed a spike in the ACCA signal on chromosome 4 at ∼28.9 Mb. In this region, within ∼3 Mb, there were >2,700 variants tightly cosegregating with cdaA-1. The cdaA-1 allele was isolated in the genetic background D while the reference genome (strain SB210) and the mapping strain (CU427) originate from the genetic background B (Cassidy-Hanley, 2012). To determine the extent of genetic variation between the B and D backgrounds, we sequenced the genome of a wild-type D background strain, D1968, using the SB210 genome for read alignment. Subtraction of variants observed in D1968 from those detected by ACCA eliminated all but three cdaA-1-linked variants within the interval of interest. To map the cdaA-4 allele, we used strain IA112, a homozygote for cdaA-4 originally isolated in the B background. Cy-resistant F1s were recovered from an outcross of IA112 to CU427. For unclear reasons, we were not able to isolate cy-sensitive assortants among the F1 progeny of IA112 × CU427. This anomaly precluded the use of the ACCA workflow for variant mapping, as this procedure requires drug-based selection of the relatively rare F2 short circuit genomic exclusion progeny. Instead, two fertile F1s (IA112 × CU427) were crossed to each other. The segregation ratio of phenotypes among the progeny indicated that these two F1s were cdaA-4/CDAA heterozygotes, as expected. 22 F2 progeny clones with the cdaA-4 phenotype (cell division arrest at 39°C) were pooled and subjected to Illumina sequencing as described above. The cdaA-4 F2 pool data and those obtained for the crossing strain CU427 were aligned to the macronuclear reference genome of SB210. The variant list produced by multisample variant calling was annotated for functional genomic effects and mapped to the corresponding micronuclear coordinates. The processed list was then filtered for well-covered, near-homozygous (≥80% frequency of the variant allele at sites with at least 10× coverage) variants specific to the mutant pool. The density of the retained variants along the micronuclear genome was plotted using MiModD’s SVD mapping mode. This led to identification of a cluster of eight variants closely linked to cdaA-4 on the micronuclear chromosome 4 at the position of 28.6 Mb, which is in approximately the same region as the interval linked to cdaA-1. An intersection of the variants linked to cdaA-1 with those linked to cdaA-4 revealed that each allele is linked to only a single variant within the coding region of the TTHERM_00332170/CYC8 gene.
Phylogenetic analyses
We used the published alignment of cyclin domains of the holozoan species including Homo sapiens, Nematostella vectensis, Trichoplax adhaerens, Amphimedon queenslandica, Monosiga brevicollis, and Salpingoeca rosetta (Cao et al., 2014), to which we added sequences of TTHERM_00332170/CYC8/CdaA and several potential orthologues in other ciliates using MAFFT v7.310 (Katoh and Standley, 2013). The potential ciliate orthologues of TTHERM_00332170/CYC8/CdaA were identified as “reciprocal best hits” based on Blast searches (Cao et al., 2014; Tatusov et al., 1997). Columns containing >50% insertions were removed from the alignment. Maximum likelihood phylogenies were constructed using IQ-TREE v1.6.11 (Nguyen et al., 2015). The optimal substitution model was determined to be LG+F+R5, based on the Bayesian information criterion as determined by ModelFinder (Kalyaanamoorthy et al., 2017). A consensus tree was constructed from 1,000 resamples using ultrafast bootstrap (Hoang et al., 2018). The resulting topology was rerooted and analyzed using ete3 (Huerta-Cepas et al., 2016). The human CABLES1 and CABLES2 proteins were assigned as the outgroup. The resulting tree is shown in Fig. S1 A. An expanded analysis (Fig. S1 B) included the above mentioned sequences supplemented by sequences of all predicted cyclin domains of T. thermophila (Stover and Rice, 2011; Yan et al., 2016a) and two nonciliate alveolates: Toxoplasma gondii (Alvarez and Suvorova, 2017) and Breviolum minutum (Cato et al., 2019).
Protein modeling
To model a T. thermophila CdaA/CDK complex, we used TTHERM_00411810/Cdk1 as a binding partner of TTHERM_00332170/CYC8/CdaA, based on the similarity of the patterns of mRNA expression of the two genes (Yan et al., 2016b) and the similarity of the amino acid sequence of Cdk1 to that of human CDK2, the main binding partner of human cyclin E1 (Wood and Endicott, 2018). Homology models of T. thermophila CdaA/Cdk1 were constructed using MODELLER v9.23 (Webb and Sali, 2016), and the structure of the H. sapiens Cyclin E1/CDK2 complex (PDB accession no. 1W98) as a template (Honda et al., 2005). The T. thermophila models were superimposed on the H. sapiens complex, and the energy was minimized with 15 cycles of Rosetta Relax (Nivón et al., 2013) with respect to the ref2015 score function (Park et al., 2016). The lowest energy model of 20 independent runs had an root-mean-square deviation of 1.86 Å compared with the human cyclin E1/Cdk2 complex (PDB accession no. 1W98). Computational mutagenesis was performed using cartesian_ddg (Park et al., 2016). Molecular graphics were rendered using PyMOL (Schrodinger, 2015). The secondary structures predictions were done using RaptorX-Property (Wang et al., 2016).
Genome editing in the macronucleus
To rescue the cdaA-1 phenotype, a 2-kb fragment of TTHERM_00332170/CYC8 was amplified from the wild-type genomic DNA (CU428) using primers: 5′-GATGTTTGCATGAGCC-3′ and 5′-GTTGAAGGTCAAATCC-3′, and introduced by biolistic bombardment (Bruns and Cassidy-Hanley, 2000; Dave et al., 2009) into 1-d-starved cdaA-1 (IA104) cells. A mock transformation without the PCR fragment was used as a negative control. The bombarded cells were grown in SPPA medium on the 96-well plates at 29°C for 2 d, replicated onto plates with fresh media, and incubated at the restrictive temperature (39°C) overnight, and the wells were inspected for proliferating cells.
To tag CDAA at the native locus, a DNA sequence encoding GFP was incorporated at the 3′ end of the TTHERM_00332170/CYC8/CDAA coding region (Stover et al., 2006) along with the BTU1 transcription terminator and neo5 marker (Jiang et al., 2019a). The required targeting plasmid was made by amplifying two 1.1-kb fragments of CDAA (using CU428 genomic DNA as template) with the primer pairs 5′-TATTGAGCTCCTTCCATTTCAGAG-3′, 5′-TATTCCGCGGTGAGCAGTATCTTTTCCTTA-3′, and 5′-CGATACCGTCGACCTCGATAACTATCTATCGATCTTAC-3′, 5′-CTAAAGGGAACAAAAGCTGGAGGCAAACCCTTCGCAGTT-3′ that were cloned on the sides of pGFP-BTU1-neo5 (Jiang et al., 2017). The resulting CDAA targeting fragment was introduced by biolistic bombardment into wild-type (CU428) cells, and transformants were selected with paromomycin 200 µg/ml.
Similarly, CDAA was tagged by incorporating a DNA sequence encoding an HA epitope at the 3′ end of the coding region followed by the BTU1 transcription terminator and the pac puromycin resistance gene marker (Iwamoto et al., 2014). The targeting plasmid was made by amplifying two 1.1 kb fragments of CDAA using the primer pairs: 5′-TATTGCATGCCTCCTTCCATTTCAGAG-3′; 5′-ATAAGGATCCTGAGCAGTATCTTTTCCTTA-3′, and 5′-GCTTATCGATACCGTCGACCTATCTATCGATCTTAC-3′; 5′-CTATAGGGCGAATTGGGTACGGCAAACCCTTCGCAG-3′ and cloning into pHA-BTU1-pur4 plasmid (TSC_PID00044 Tetrahymena Stock Center). The resulting targeting fragment was introduced into a CdaI-GFP–expressing strain (UG-CdaI-GFP; Table S2; Jiang et al., 2017) by biolistic bombardment, and transformants were selected with puromycin 200 µg/ml.
For overexpression of a wild-type CdaA, TTHERM_00332170/CYC8/CDAA locus was modified by addition of a sequence encoding GFP operating under the MTT1 promoter (Shang et al., 2002) at the 5′ end of the coding region with a linked neo5 marker. The neo5-MTT1-GFP fragment has been described previously (Jiang et al., 2019b). Two 1.1-kb fragments of CDAA, were amplified with the primer pairs 5′-GGCATGGATGAACTATACAAAATGTTTTCAAGTATAGCATC-3′, 5′-GCTGGGTACCGGGCCGCGCTTGTGATTACAAGCT-3′, 5′-TAGGGCGAATTGGAGCTCTATTTCAGTTTAGAAACC-3′, and 5′-AGCGGCCGCCACCGCGTGATTTCTTACTTGCTTGCT-3′ and subcloned on the sides of the neo5-MTT1-GFP fragment. The resulting targeting plasmid was used to replace ∼0.3 kb of the 5′-UTR and the translation initiation codon of CDAA with neo5-MTT1-GFP.
Microscopic imaging
Cells were fixed and stained with antibodies as described previously (Gaertig et al., 2013) with small modifications. 20 μl cell culture was placed on the coverglass and combined with an equal volume of 0.25% Triton X-100 and 1% PFA in the PHEM buffer (60 mM Pipes, 25 mM Hepes, 10 mM EGTA, and 2 mM MgSO4, pH 6.9). The sample was air-dried at 30°C, and the coverglass was washed three times with PBS and incubated with primary antibodies diluted in PBS supplemented with 3% BSA fraction V and 0.01% Tween-20. The primary antibodies used were: polyclonal anti-GFP (Rockland; 1:800 dilution), monoclonal anti-HA 16B12 (Covance;1:300), monoclonal anti-centrin 20H5 (EMD Millipore; 1:400; Salisbury et al., 1988), and monoclonal anti-acetyl K40 α-tubulin 6–11 B-1 (Sigma-Aldrich; 1:400; LeDizet and Piperno, 1991). The secondary antibodies were conjugated to either Cy3 or FITC (Rockland; 1:300). The nuclei were costained with DAPI (Sigma-Aldrich). The labeled cells were embedded in 90% glycerol, 10% PBS supplemented with 100 mg/ml DABCO (Sigma-Aldrich). All microscopic images were collected at the room temperature. Confocal images were collected on a Zeiss LSM 880 with Airyscan microscope using a 63× NA 1.4 Oil Plan-Apochromat DIC objective. SR-SIM imaging was done on an ELYRA S1 microscope equipped with a 63× NA 1.4 Oil Plan-Apochromat DIC objective. The SR-SIM images were captured using the iXon electron multiplying charge-coupled device camera (Andor) and the ZEN 2011 software with the SIM analysis module. The Z stacks were analyzed using Fiji/ImageJ and the Z Project method (Schindelin et al., 2012). Live cells were imaged on a TIRF microscope (Jiang et al., 2015; Lechtreck, 2013) with a 60× 1.49 NA TIRF objective. The TIRF images were captured using the Andor iXon X3 DU 897 electron multiplying charge-coupled device camera and analyzed using Fiji/ImageJ.
Statistical analyses
In dividing cells, the A/P ratio (length of the anterior subcell/length of the posterior subcell) was determined as described previously (Jiang et al., 2019a) using the plane of cortical subdivision or cytokinesis as the division boundary. For the cdaA-1 mutants at 39°C, we used the plane immediately anterior to the oral primordium as the division boundary. The data distribution was assumed to be normal, but this was not formally tested. An ANOVA single-factor test (Microsoft Excel) was used, and P < 0.01 was considered statistically significant.
Online supplemental material
Fig. S1 presents maximum likelihood phylogenies of cyclin domains and complements Fig. 2 I. Fig. S2 A contains the results of Sanger DNA sequencing of the coding region of TTHERM_00332170/CYC8 in the original cdaA-1 mutant and a rescue clone. Fig. S2 B contains sequence alignments of portions of T. thermophila and human proteins used to generate cyclin E/CDK models shown in Fig. 2 G. Fig. S3 documents the localization of CdaA in: conjugating cells using immunofluorescence (Fig. S3 A) and vegetatively growing cells using TIRF microscopy (Fig. S3 B). Fig. S4 documents the localization of CdaA in dividing cells and complements the images presented in Fig. 3. Fig. S5 documents the positions of new cortical structures in mutant cells. Table S1 contains length measurements of the anterior and posterior regions of dividing cells and complements the data shown in Fig. 8 E. Table S2 lists genotypes and sources of T. thermophila strains used in this study.
Supplementary Material
presents the lengths of presumptive daughters in the dividing T. thermophila cells in different backgrounds and at different temperatures.
lists the strains of T. thermophila used in the study.
Acknowledgments
We thank Donna Cassidy-Hanley (Cornell University) for valuable information about the D background strains, Mark Farmer (University of Georgia) for suggestions regarding evolution of cyclins, Karl Lechtreck (University of Georgia) for advice and access to the TIRF microscope, and Muthugapatti K. Kandasamy (Biomedical Microscopy Core, University of Georgia) for assistance with confocal and superresolution imaging.
This work was supported by National Institutes of Health grants R21HD092809 (J. Gaertig) and 5RO1GM114409 (N. Kannan); National Science Centre, Poland grants Opus13, 2017/25/B/NZ3/01609 (D. Wloga) and Opus15, 2018/29/B/NZ3/02443 (E. Joachimiak); and German Federal Ministry of Education and Research grant 031L0101C de.NBI-epi (to W. Maier).
The authors declare no competing financial interests.
Author contributions: J. Frankel and J. Gaertig conceived the project. Y.-Y. Jiang performed the genetic, imaging, and phenotypic studies in T. thermophila. W. Maier performed the analyses of NGS data. J. Frankel contributed to the analyses of morphological phenotypes. W. Yeung and N. Kannan performed the protein structure modeling and phylogenetic analyses. D. Wloga contributed to the phylogenetic studies. U.N. Chukka contributed to the confocal imaging and quantifications of morphological phenotypes. M. Choromanski performed the SR-SIM imaging. C. Lee contributed to the construction of strains expressing tagged proteins. E. Joachimiak contributed to the data visualization. Y.-Y. Jiang prepared the figures and tables. J. Gaertig wrote the manuscript. Y.-Y. Jiang, W. Maier, and W. Yeung wrote sections of the manuscript. Y.-Y. Jiang, W. Maier, M. Choromanski, E. Joachimiak, D. Wloga, W. Yeung, N. Kannan, and J. Frankel edited the manuscript. J. Gaertig, N. Kannan, W. Maier, D. Wloga, and E. Joachimiak secured the funding.
References
- Adl S.M., Simpson A.G., Lane C.E., Lukeš J., Bass D., Bowser S.S., Brown M.W., Burki F., Dunthorn M., Hampl V., et al. 2012. The revised classification of eukaryotes. J. Eukaryot. Microbiol. 59:429–493. 10.1111/j.1550-7408.2012.00644.x [DOI] [PMC free article] [PubMed] [Google Scholar]
- Ajduk A., and Zernicka-Goetz M.. 2016. Polarity and cell division orientation in the cleavage embryo: from worm to human. Mol. Hum. Reprod. 22:691–703. 10.1093/molehr/gav068 [DOI] [PMC free article] [PubMed] [Google Scholar]
- Allen S.L., Altschuler M.I., Bruns P.J., Cohen J., Doerder F.P., Gaertig J., Gorovsky M., Orias E., and Turkewitz A.. 1998. Proposed genetic nomenclature rules for Tetrahymena thermophila, Paramecium primaurelia and Paramecium tetraurelia. Genetics. 149:459–462. [DOI] [PMC free article] [PubMed] [Google Scholar]
- Alvarez C.A., and Suvorova E.S.. 2017. Checkpoints of apicomplexan cell division identified in Toxoplasma gondii. PLoS Pathog. 13 e1006483 10.1371/journal.ppat.1006483 [DOI] [PMC free article] [PubMed] [Google Scholar]
- Berger C., Pallavi S.K., Prasad M., Shashidhara L.S., and Technau G.M.. 2005. A critical role for cyclin E in cell fate determination in the central nervous system of Drosophila melanogaster. Nat. Cell Biol. 7:56–62. 10.1038/ncb1203 [DOI] [PubMed] [Google Scholar]
- Berger C., Kannan R., Myneni S., Renner S., Shashidhara L.S., and Technau G.M.. 2010. Cell cycle independent role of Cyclin E during neural cell fate specification in Drosophila is mediated by its regulation of Prospero function. Dev. Biol. 337:415–424. 10.1016/j.ydbio.2009.11.012 [DOI] [PubMed] [Google Scholar]
- Bhat K.M., and Apsel N.. 2004. Upregulation of Mitimere and Nubbin acts through cyclin E to confer self-renewing asymmetric division potential to neural precursor cells. Development. 131:1123–1134. 10.1242/dev.01014 [DOI] [PubMed] [Google Scholar]
- Brumby A., Secombe J., Horsfield J., Coombe M., Amin N., Coates D., Saint R., and Richardson H.. 2004. A genetic screen for dominant modifiers of a cyclin E hypomorphic mutation identifies novel regulators of S-phase entry in Drosophila. Genetics. 168:227–251. 10.1534/genetics.104.026617 [DOI] [PMC free article] [PubMed] [Google Scholar]
- Bruns P.J., and Cassidy-Hanley D.. 2000. Biolistic transformation of macro- and micronuclei. Methods Cell Biol. 62:501–512. 10.1016/S0091-679X(08)61553-8 [DOI] [PubMed] [Google Scholar]
- Bruns P.J., Brussard T.B., and Kavka A.B.. 1976. Isolation of homozygous mutants after induced self-fertilization in Tetrahymena. Proc. Natl. Acad. Sci. USA. 73:3243–3247. 10.1073/pnas.73.9.3243 [DOI] [PMC free article] [PubMed] [Google Scholar]
- Buzanska L., and Wheatley D.N.. 1994. Okadaic acid promotes cell division in synchronized Tetrahymena pyriformis and in the cell division-arrested (cdaA1) temperature-sensitive mutant of T. thermophila. Eur. J. Cell Biol. 63:149–158. [PubMed] [Google Scholar]
- Byrne B.C., Brussard T.B., and Bruns P.J.. 1978. Induced resistance to 6-methylpurine and cycloheximide in tetrahymena. I. Germ line mutants of T. thermophila. Genetics. 89:695–702. [DOI] [PMC free article] [PubMed] [Google Scholar]
- Cao L., Chen F., Yang X., Xu W., Xie J., and Yu L.. 2014. Phylogenetic analysis of CDK and cyclin proteins in premetazoan lineages. BMC Evol. Biol. 14:10 10.1186/1471-2148-14-10 [DOI] [PMC free article] [PubMed] [Google Scholar]
- Cassidy-Hanley D.M. 2012. Tetrahymena in the laboratory: strain resources, methods for culture, maintenance, and storage. Methods Cell Biol. 109:237–276. 10.1016/B978-0-12-385967-9.00008-6 [DOI] [PMC free article] [PubMed] [Google Scholar]
- Cato M.L., Jester H.D., Lavertu A., Lyman A., Tallent L.M., and Mitchell G.C.. 2019. Genome-Wide Analysis of Cell Cycle-Regulating Genes in the Symbiotic Dinoflagellate Breviolum minutum. G3 (Bethesda). 9:3843–3853. 10.1534/g3.119.400363 [DOI] [PMC free article] [PubMed] [Google Scholar]
- Cowan C.R., and Hyman A.A.. 2006. Cyclin E-Cdk2 temporally regulates centrosome assembly and establishment of polarity in Caenorhabditis elegans embryos. Nat. Cell Biol. 8:1441–1447. 10.1038/ncb1511 [DOI] [PubMed] [Google Scholar]
- Dave D., Wloga D., and Gaertig J.. 2009. Manipulating ciliary protein-encoding genes in Tetrahymena thermophila. Methods Cell Biol. 93:1–20. 10.1016/S0091-679X(08)93001-6 [DOI] [PubMed] [Google Scholar]
- Eisen J.A., Coyne R.S., Wu M., Wu D., Thiagarajan M., Wortman J.R., Badger J.H., Ren Q., Amedeo P., Jones K.M., et al. 2006. Macronuclear genome sequence of the ciliate Tetrahymena thermophila, a model eukaryote. PLoS Biol. 4 e286 10.1371/journal.pbio.0040286 [DOI] [PMC free article] [PubMed] [Google Scholar]
- Frankel J. 1989. Pattern Formation. Ciliate Studies and Models. Oxford University Press, New York. [Google Scholar]
- Frankel J. 2008. What do genic mutations tell us about the structural patterning of a complex single-celled organism? Eukaryot. Cell. 7:1617–1639. 10.1128/EC.00161-08 [DOI] [PMC free article] [PubMed] [Google Scholar]
- Frankel J., and Whiteley A.H.. 1993. Vance Tartar: a unique biologist. J. Eukaryot. Microbiol. 40:1–9. 10.1111/j.1550-7408.1993.tb04873.x [DOI] [PubMed] [Google Scholar]
- Frankel J., Jenkins L.M., and DeBault L.E.. 1976a Causal relations among cell cycle processes in Tetrahymena pyriformis. An analysis employing temperature-sensitive mutants. J. Cell Biol. 71:242–260. 10.1083/jcb.71.1.242 [DOI] [PMC free article] [PubMed] [Google Scholar]
- Frankel J., Jenkins L.M., Doerder F.P., and Nelsen E.M.. 1976b Mutations affecting cell division in Tetrahymena pyriformis. I. Selection and genetic analysis. Genetics. 83:489–506. [PMC free article] [PubMed] [Google Scholar]
- Frankel J., Nelsen E.M., and Jenkins L.M.. 1977. Mutations affecting cell division in Tetrahymena pyriformis, syngen 1. II. Phenotypes of single and double homozygotes. Dev. Biol. 58:255–275. 10.1016/0012-1606(77)90091-4 [DOI] [PubMed] [Google Scholar]
- Frankel J., Mohler J., and Frankel A.K.. 1980. Temperature-sensitive periods of mutations affecting cell division in Tetrahymena thermophila. J. Cell Sci. 43:59–74. [DOI] [PubMed] [Google Scholar]
- Frankel J., Nelsen E.M., and Martel E.. 1981. Development of the ciliature of Tetrahymena thermophila. II. Spatial subdivision prior to cytokinesis. Dev. Biol. 88:39–54. 10.1016/0012-1606(81)90217-7 [DOI] [PubMed] [Google Scholar]
- Fryd-Versavel G., Lemullois M., and Aubusson-Fleury A.. 2010. Maintaining cell polarity through vegetative cell pattern dedifferentiation: cytoskeleton and morphogenesis in the hypotrich ciliate Sterkiella histriomuscorum. Protist. 161:222–236. 10.1016/j.protis.2009.11.001 [DOI] [PubMed] [Google Scholar]
- Gaertig J., Thatcher T.H., Gu L., and Gorovsky M.A.. 1994. Electroporation-mediated replacement of a positively and negatively selectable beta-tubulin gene in Tetrahymena thermophila. Proc. Natl. Acad. Sci. USA. 91:4549–4553. 10.1073/pnas.91.10.4549 [DOI] [PMC free article] [PubMed] [Google Scholar]
- Gaertig J., Wloga D., Vasudevan K.K., Guha M., and Dentler W.L.. 2013. Discovery and functional evaluation of ciliary proteins in Tetrahymena thermophila. In Cilia, part B. Vol. 255 Marshall W.F., editor. 10.1016/B978-0-12-397944-5.00013-4 [DOI] [PMC free article] [PubMed] [Google Scholar]
- Genevet A., Polesello C., Blight K., Robertson F., Collinson L.M., Pichaud F., and Tapon N.. 2009. The Hippo pathway regulates apical-domain size independently of its growth-control function. J. Cell Sci. 122:2360–2370. 10.1242/jcs.041806 [DOI] [PMC free article] [PubMed] [Google Scholar]
- Gonda K., Nishibori K., Ohba H., Watanabe A., and Numata O.. 1999. Molecular cloning of the gene for p85 that regulates the initiation of cytokinesis in Tetrahymena. Biochem. Biophys. Res. Commun. 264:112–118. 10.1006/bbrc.1999.1354 [DOI] [PubMed] [Google Scholar]
- Gorovsky M.A. 1973. Macro- and micronuclei of Tetrahymena pyriformis: a model system for studying the structure and function of eukaryotic nuclei. J. Protozool. 20:19–25. 10.1111/j.1550-7408.1973.tb05995.x [DOI] [PubMed] [Google Scholar]
- Grimes G.W. 1973a Differentiation during encystment and excystment in Oxytricha fallax. J. Protozool. 20:92–104. 10.1111/j.1550-7408.1973.tb06009.x [DOI] [PubMed] [Google Scholar]
- Grimes G.W. 1973b Morphological discontinuity of kinetosomes during the life cycle of Oxytricha fallax. J. Cell Biol. 57:229–232. 10.1083/jcb.57.1.229 [DOI] [PMC free article] [PubMed] [Google Scholar]
- Hamaratoglu F., Gajewski K., Sansores-Garcia L., Morrison C., Tao C., and Halder G.. 2009. The Hippo tumor-suppressor pathway regulates apical-domain size in parallel to tissue growth. J. Cell Sci. 122:2351–2359. 10.1242/jcs.046482 [DOI] [PMC free article] [PubMed] [Google Scholar]
- Hamilton E.P., Kapusta A., Huvos P.E., Bidwell S.L., Zafar N., Tang H., Hadjithomas M., Krishnakumar V., Badger J.H., Caler E.V., et al. 2016. Structure of the germline genome of Tetrahymena thermophila and relationship to the massively rearranged somatic genome. eLife. 5 e19090 10.7554/eLife.19090 [DOI] [PMC free article] [PubMed] [Google Scholar]
- Harvey K.F., Pfleger C.M., and Hariharan I.K.. 2003. The Drosophila Mst ortholog, hippo, restricts growth and cell proliferation and promotes apoptosis. Cell. 114:457–467. 10.1016/S0092-8674(03)00557-9 [DOI] [PubMed] [Google Scholar]
- Hoang D.T., Chernomor O., von Haeseler A., Minh B.Q., and Vinh L.S.. 2018. UFBoot2: Improving the Ultrafast Bootstrap Approximation. Mol. Biol. Evol. 35:518–522. 10.1093/molbev/msx281 [DOI] [PMC free article] [PubMed] [Google Scholar]
- Honda R., Lowe E.D., Dubinina E., Skamnaki V., Cook A., Brown N.R., and Johnson L.N.. 2005. The structure of cyclin E1/CDK2: implications for CDK2 activation and CDK2-independent roles. EMBO J. 24:452–463. 10.1038/sj.emboj.7600554 [DOI] [PMC free article] [PubMed] [Google Scholar]
- Huerta-Cepas J., Serra F., and Bork P.. 2016. ETE 3: Reconstruction, Analysis, and Visualization of Phylogenomic Data. Mol. Biol. Evol. 33:1635–1638. 10.1093/molbev/msw046 [DOI] [PMC free article] [PubMed] [Google Scholar]
- Iwamoto M., Mori C., Hiraoka Y., and Haraguchi T.. 2014. Puromycin resistance gene as an effective selection marker for ciliate Tetrahymena. Gene. 534:249–255. 10.1016/j.gene.2013.10.049 [DOI] [PubMed] [Google Scholar]
- Jiang Y.Y., Lechtreck K., and Gaertig J.. 2015. Total internal reflection fluorescence microscopy of intraflagellar transport in Tetrahymena thermophila. Methods Cell Biol. 127:445–456. 10.1016/bs.mcb.2015.01.001 [DOI] [PMC free article] [PubMed] [Google Scholar]
- Jiang Y.Y., Maier W., Baumeister R., Minevich G., Joachimiak E., Ruan Z., Kannan N., Clarke D., Frankel J., and Gaertig J.. 2017. The Hippo Pathway Maintains the Equatorial Division Plane in the Ciliate Tetrahymena. Genetics. 206:873–888. 10.1534/genetics.117.200766 [DOI] [PMC free article] [PubMed] [Google Scholar]
- Jiang Y.Y., Maier W., Baumeister R., Joachimiak E., Ruan Z., Kannan N., Clarke D., Louka P., Guha M., Frankel J., and Gaertig J.. 2019a Two Antagonistic Hippo Signaling Circuits Set the Division Plane at the Medial Position in the Ciliate Tetrahymena. Genetics. 211:651–663. 10.1534/genetics.118.301889 [DOI] [PMC free article] [PubMed] [Google Scholar]
- Jiang Y.Y., Maier W., Baumeister R., Minevich G., Joachimiak E., Wloga D., Ruan Z., Kannan N., Bocarro S., Bahraini A., et al. 2019b LF4/MOK and a CDK-related kinase regulate the number and length of cilia in Tetrahymena. PLoS Genet. 15:e1008099 10.1371/journal.pgen.1008099 [DOI] [PMC free article] [PubMed] [Google Scholar]
- Joachimiak E., Kaczanowska J., Kiersnowska M., and Kaczanowski A.. 2004. Syndrome of the failure to turn off mitotic activity in Tetrahymena thermophila: in cdaA1 phenotypes. Acta Protozool. 43:291–301. [Google Scholar]
- Kaczanowska J., Buzanska L., and Frontczak M.. 1992. The influence of fission line expression on the number and positioning of oral primordia in the cdaA1 mutant of Tetrahymena thermophila. Dev. Genet. 13:216–222. 10.1002/dvg.1020130307 [DOI] [PubMed] [Google Scholar]
- Kaczanowska J., Buzanska L., and Ostrowski M.. 1993. Relationship between spatial pattern of basal bodies and membrane skeleton (epiplasm) during the cell cycle of Tetrahymena: cdaA mutant and anti-membrane skeleton immunostaining. J. Eukaryot. Microbiol. 40:747–754. 10.1111/j.1550-7408.1993.tb04470.x [DOI] [PubMed] [Google Scholar]
- Kaczanowska J., Joachimiak E., Buzanska L., Krawczynska W., Wheatley D.N., and Kaczanowski A.. 1999. Molecular subdivision of the cortex of dividing Tetrahymena is coupled with the formation of the fission zone. Dev. Biol. 212:150–164. 10.1006/dbio.1999.9362 [DOI] [PubMed] [Google Scholar]
- Kaczanowska J., Kaczanowski S., Kiersnowska M., Fabczak H., Tulodziecka K., and Kaczanowski A.. 2008. Acquisition of cell polarity during cell cycle and oral replacement in Tetrahymena. Int. J. Dev. Biol. 52:249–258. 10.1387/ijdb.072350jk [DOI] [PubMed] [Google Scholar]
- Kalyaanamoorthy S., Minh B.Q., Wong T.K.F., von Haeseler A., and Jermiin L.S.. 2017. ModelFinder: fast model selection for accurate phylogenetic estimates. Nat. Methods. 14:587–589. 10.1038/nmeth.4285 [DOI] [PMC free article] [PubMed] [Google Scholar]
- Katoh K., and Standley D.M.. 2013. MAFFT multiple sequence alignment software version 7: improvements in performance and usability. Mol. Biol. Evol. 30:772–780. 10.1093/molbev/mst010 [DOI] [PMC free article] [PubMed] [Google Scholar]
- Lechtreck K.F. 2013. In vivo imaging of IFT in Chlamydomonas flagella. Methods Enzymol. 524:265–284. 10.1016/B978-0-12-397945-2.00015-9 [DOI] [PubMed] [Google Scholar]
- LeDizet M., and Piperno G.. 1991. Detection of acetylated alpha-tubulin by specific antibodies. Methods Enzymol. 196:264–274. 10.1016/0076-6879(91)96025-M [DOI] [PubMed] [Google Scholar]
- Lee H., Kang J., Ahn S., and Lee J.. 2019. The Hippo Pathway Is Essential for Maintenance of Apicobasal Polarity in the Growing Intestine of Caenorhabditis elegans. Genetics. 213:501–515. 10.1534/genetics.119.302477 [DOI] [PMC free article] [PubMed] [Google Scholar]
- Möröy T., and Geisen C.. 2004. Cyclin E. Int. J. Biochem. Cell Biol. 36:1424–1439. 10.1016/j.biocel.2003.12.005 [DOI] [PubMed] [Google Scholar]
- Motegi F., and Seydoux G.. 2013. The PAR network: redundancy and robustness in a symmetry-breaking system. Phil. Trans. R. Soc. B. 368:20130010. [DOI] [PMC free article] [PubMed] [Google Scholar]
- Nantie L.B., Young R.E., Paltzer W.G., Zhang Y., Johnson R.L., Verheyden J.M., and Sun X.. 2018. Lats1/2 inactivation reveals Hippo function in alveolar type I cell differentiation during lung transition to air breathing. Development. 145 dev163105 10.1242/dev.163105 [DOI] [PMC free article] [PubMed] [Google Scholar]
- Nguyen L.T., Schmidt H.A., von Haeseler A., and Minh B.Q.. 2015. IQ-TREE: a fast and effective stochastic algorithm for estimating maximum-likelihood phylogenies. Mol. Biol. Evol. 32:268–274. 10.1093/molbev/msu300 [DOI] [PMC free article] [PubMed] [Google Scholar]
- Nivón L.G., Moretti R., and Baker D.. 2013. A Pareto-optimal refinement method for protein design scaffolds. PLoS One. 8 e59004 10.1371/journal.pone.0059004 [DOI] [PMC free article] [PubMed] [Google Scholar]
- Ohba H., Ohmori I., Numata O., and Watanabe Y.. 1986. Purification and immunofluorescence localization of the mutant gene product of a Tetrahymena cdaA1 mutant affecting cell division. J. Biochem. 100:797–808. 10.1093/oxfordjournals.jbchem.a121773 [DOI] [PubMed] [Google Scholar]
- Park H., Bradley P., Greisen P. Jr., Liu Y., Mulligan V.K., Kim D.E., Baker D., and DiMaio F.. 2016. Simultaneous Optimization of Biomolecular Energy Functions on Features from Small Molecules and Macromolecules. J. Chem. Theory Comput. 12:6201–6212. 10.1021/acs.jctc.6b00819 [DOI] [PMC free article] [PubMed] [Google Scholar]
- Richardson H.E., and Portela M.. 2017. Tissue growth and tumorigenesis in Drosophila: cell polarity and the Hippo pathway. Curr. Opin. Cell Biol. 48:1–9. 10.1016/j.ceb.2017.03.006 [DOI] [PubMed] [Google Scholar]
- Salisbury J.L., Baron A.T., and Sanders M.A.. 1988. The centrin-based cytoskeleton of Chlamydomonas reinhardtii: distribution in interphase and mitotic cells. J. Cell Biol. 107:635–641. 10.1083/jcb.107.2.635 [DOI] [PMC free article] [PubMed] [Google Scholar]
- Schindelin J., Arganda-Carreras I., Frise E., Kaynig V., Longair M., Pietzsch T., Preibisch S., Rueden C., Saalfeld S., Schmid B., et al. 2012. Fiji: an open-source platform for biological-image analysis. Nat. Methods. 9:676–682. 10.1038/nmeth.2019 [DOI] [PMC free article] [PubMed] [Google Scholar]
- Schrodinger L.L.C. 2015. The PyMOL Molecular Graphics System, Version 1.8.
- Shang Y., Song X., Bowen J., Corstanje R., Gao Y., Gaertig J., and Gorovsky M.A.. 2002. A robust inducible-repressible promoter greatly facilitates gene knockouts, conditional expression, and overexpression of homologous and heterologous genes in Tetrahymena thermophila. Proc. Natl. Acad. Sci. USA. 99:3734–3739. 10.1073/pnas.052016199 [DOI] [PMC free article] [PubMed] [Google Scholar]
- Shimizu T., Ho L.L., and Lai Z.C.. 2008. The mob as tumor suppressor gene is essential for early development and regulates tissue growth in Drosophila. Genetics. 178:957–965. 10.1534/genetics.107.081570 [DOI] [PMC free article] [PubMed] [Google Scholar]
- Slabodnick M.M., Ruby J.G., Dunn J.G., Feldman J.L., DeRisi J.L., and Marshall W.F.. 2014. The kinase regulator mob1 acts as a patterning protein for stentor morphogenesis. PLoS Biol. 12 e1001861 10.1371/journal.pbio.1001861 [DOI] [PMC free article] [PubMed] [Google Scholar]
- Stover N.A., and Rice J.D.. 2011. Distinct cyclin genes define each stage of ciliate conjugation. Cell Cycle. 10:1699–1701. 10.4161/cc.10.10.15548 [DOI] [PMC free article] [PubMed] [Google Scholar]
- Stover N.A., Krieger C.J., Binkley G., Dong Q., Fisk D.G., Nash R., Sethuraman A., Weng S., and Cherry J.M.. 2006. Tetrahymena Genome Database (TGD): a new genomic resource for Tetrahymena thermophila research. Nucleic Acids Res. 34:D500–D503. 10.1093/nar/gkj054 [DOI] [PMC free article] [PubMed] [Google Scholar]
- Suga H., Chen Z., de Mendoza A., Sebé-Pedrós A., Brown M.W., Kramer E., Carr M., Kerner P., Vervoort M., Sánchez-Pons N., et al. 2013. The Capsaspora genome reveals a complex unicellular prehistory of animals. Nat. Commun. 4:2325 10.1038/ncomms3325 [DOI] [PMC free article] [PubMed] [Google Scholar]
- Tartar V. 1956. Pattern and substance in Stentor. In Cellular Mechanisms in Differentiation and Growth. Rudnick D., editor. Princeton University Press [Google Scholar]
- Tartar V. 1961. The Biology of Stentor. Pergamon Oress, Elmsford, NY. [Google Scholar]
- Tartar V. 1967. Cell division after removal of the division line in Stentor. Nature. 216:695–697. 10.1038/216695a0 [DOI] [PubMed] [Google Scholar]
- Tartar V. 1968. Micrurgical experiments on cytokinesis in Stentor coeruleus. J. Exp. Zool. 167:21–36. 10.1002/jez.1401670103 [DOI] [PubMed] [Google Scholar]
- Tatusov R.L., Koonin E.V., and Lipman D.J.. 1997. A genomic perspective on protein families. Science. 278:631–637. 10.1126/science.278.5338.631 [DOI] [PubMed] [Google Scholar]
- Tavares A., Gonçalves J., Florindo C., Tavares A.A., and Soares H.. 2012. Mob1: defining cell polarity for proper cell division. J. Cell Sci. 125:516–527. 10.1242/jcs.096610 [DOI] [PubMed] [Google Scholar]
- Udan R.S., Kango-Singh M., Nolo R., Tao C., and Halder G.. 2003. Hippo promotes proliferation arrest and apoptosis in the Salvador/Warts pathway. Nat. Cell Biol. 5:914–920. 10.1038/ncb1050 [DOI] [PubMed] [Google Scholar]
- Wang S., Li W., Liu S., and Xu J.. 2016. RaptorX-Property: a web server for protein structure property prediction. Nucleic Acids Res. 44(W1). W430-5 10.1093/nar/gkw306 [DOI] [PMC free article] [PubMed] [Google Scholar]
- Webb B., and Sali A.. 2016. Comparative Protein Structure Modeling Using MODELLER. Curr Protoc Protein Sci. 86:2 9.1-2–9.37. [DOI] [PubMed]
- Wood D.J., and Endicott J.A.. 2018. Structural insights into the functional diversity of the CDK-cyclin family. Open Biol. 8 10.1098/rsob.180112 [DOI] [PMC free article] [PubMed] [Google Scholar]
- Wu S., Huang J., Dong J., and Pan D.. 2003. hippo encodes a Ste-20 family protein kinase that restricts cell proliferation and promotes apoptosis in conjunction with salvador and warts. Cell. 114:445–456. 10.1016/S0092-8674(03)00549-X [DOI] [PubMed] [Google Scholar]
- Yan G.X., Dang H., Tian M., Zhang J., Shodhan A., Ning Y.Z., Xiong J., and Miao W.. 2016a Cyc17, a meiosis-specific cyclin, is essential for anaphase initiation and chromosome segregation in Tetrahymena thermophila. Cell Cycle. 15:1855–1864. 10.1080/15384101.2016.1188238 [DOI] [PMC free article] [PubMed] [Google Scholar]
- Yan G.X., Zhang J., Shodhan A., Tian M., and Miao W.. 2016b Cdk3, a conjugation-specific cyclin-dependent kinase, is essential for the initiation of meiosis in Tetrahymena thermophila. Cell Cycle. 15:2506–2514. 10.1080/15384101.2016.1207838 [DOI] [PMC free article] [PubMed] [Google Scholar]
Associated Data
This section collects any data citations, data availability statements, or supplementary materials included in this article.
Supplementary Materials
presents the lengths of presumptive daughters in the dividing T. thermophila cells in different backgrounds and at different temperatures.
lists the strains of T. thermophila used in the study.


