Abstract
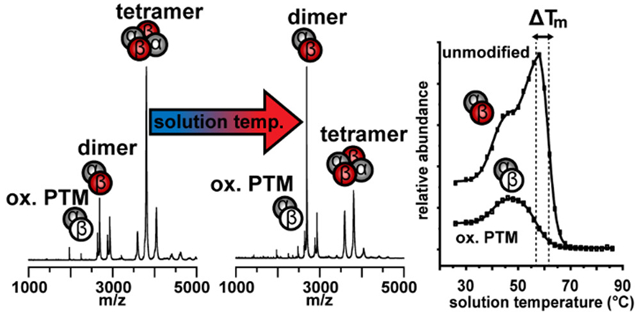
Thermally induced structural transitions of the quaternary structure of the hemoglobin tetramer (human) in aqueous solution (150 mM ammonium acetate) were investigated using a variable temperature electrospray ionization (vt-ESI) technique in combination with ion mobility spectrometry (IMS) and mass spectrometry (MS) measurements. At low solution temperatures (28 to ~40 °C), a heterotetrameric (α2β2) complex is the most abundant species that is observed. When the solution temperature is increased, this assembly dissociates into heterodimers (holo αβ forms) before ultimately forming insoluble aggregates at higher temperatures (>60 °C). In addition to the holo αβ forms, a small population of αβ dimers containing only a single heme ligand and having a dioxidation modification mapping to the β subunit are observed. The oxidized heterodimers are less stable than the unmodified holo-heterodimer. The Cys93 residue of the β subunit is the primary site of dioxidation. The close proximity of this post translational modification to both the αβ subunit interface and the heme binding site suggests that this modification is coupled to the loss of the heme and decreased protein stability. Changes in the charge state and collision cross sections of these species indicate that the tetramers and dimers favor less compact structures at elevated temperatures (prior to temperatures where dissociation dominates).
Graphical Abstract
INTRODUCTION
Recent work from our group and others has employed variable-temperature electrospray ionization (vT-ESI) with ion mobility spectrometry (IMS) and mass spectrometry (MS) techniques to characterize the thermal stability of peptides,1–5 proteins,6–9 and protein complexes.10–12 These studies provide evidence for populations of multiple distinct structures that vary with temperature. The combination of IMS (which provides information about conformer shape) with MS (which determines a protein’s charge state under different conditions) is especially well suited for determining the stoichiometry of protein complexes,13–16 identifying post-translational modifications,17–19 characterizing bound ligands,20–22 as well as determining thermochemistry and activation energies associated with specific types of structural transitions.11,9 Herein, we build upon earlier vT-ESI-IMS-MS work to examine the species involved in thermal denaturation of human hemoglobin A, a heterotetrameric complex. We find evidence for a specific oxidation event that appears to be associated with loss of one heme group along with a substantial decrease in the stability of the protein complex.
The quaternary structure of protein complexes are governed by a complex set of interactions between subunits, as well as the solvent.23,24 Slight perturbations in the environment can have major effects on protein structure, stability, and function.25 Because of this, chemical modification of specific residues can regulate complex formation and function26,27 as well as induce denaturation and aggregation.25,28 While the functional, native structure of many complexes have been explored in detail, subdomains and non-native forms of protein assemblies remain difficult to characterize.29–31
Below, we present studies that are aimed at exploring the stability of the quaternary structure and the influence of oxidation post-translational modifications (PTM) on the most common variant of human hemoglobin A (HbA). The native structure of HbA is a tetrameric complex composed of two α-subunits and two β-subunits (α2β2) that each bind a prosthetic heme group in the active site, which are responsible for O2 binding.32,33 The individual α and β-subunits are unstable when not complexed together, and the accumulation of free monomeric units is associated with oxidative damage and lysis of red blood cells in several genetic diseases, such as α and β thalassemia.34 The structure and function of HbA and related variants is especially well characterized as a result of nearly 60 years of pioneering structural biology dating back to the early work of Perutz and his collaborators.32,35–37 Because of this, HbA is not only fundamentally important biologically, it also serves as an important model system for testing new technologies and thus the structure, dynamics and function of this system continue to be refined.38,39 The vT-ESI-IMS-MS approach highlighted here provides a detailed new perspective on the stability of this complex.
EXPERIMENTAL SECTION
Sample Preparation.
For intact protein IMS-MS experiments, human hemoglobin A (Sigma-Aldrich, St. Louis, MO) was prepared in water (Omnisolv LC-MS grade, EMD Millipore, Billerica, MA), and desalted by overnight dialysis (Slide-A-Lyzer 10K MWCO, Thermo Scientific, Rockford, IL) against 150 mM ammonium acetate (pH 7.4). For MS analysis, samples were diluted to 15 μM (tetramer concentration) in 150 mM ammonium acetate (pH 7.4). Fifteen μM protein concentration was chosen for optimal signal-to-noise ratio Analyte solution was loaded into a borosilicate glass nano ESI (nESI) capillary (Sutter Instrument, Novato, CA) that was pulled to a fine point (~1−5 μm) using a Flaming/Brown micropipette puller (model P-97, Sutter Instrument, Novato, CA). If not otherwise stated, all reagents were purchased from Sigma-Aldrich (St. Louis, MO) in the highest purity available.
Identification of Sites of Post-Translational Modifications Using Bottom Up MS.
As we worked on this system we found evidence for a chemically modified form of the complex. In order to identify modifications and locate the positions of these sites, we digest the protein complex and carry out an LC-MS/MS analysis on the mixture of peptides that is created. This is essentially a “bottom-up” proteomics approach. A detailed description of the methods used for LC-MS/MS analysis are presented in the Supporting Information (SI).
Variable-Temperature Electrospray Ionization.
The temperature of the protein solution was controlled using a custom-fabricated heated nano ESI source, described previously.11 Briefly, the nESI emitter is housed in a thermally conductive boron nitride ceramic block which is heated by an embedded cartridge heater. The temperature is measured by a thermocouple probe embedded in the ceramic block near the tip of nESI emitter. The heated nESI source is mated to a SYNAPT G2 mass spectrometer (Waters Corporation, Milford, MA) with the source interlocks overridden to accommodate the modified nESI source. The SYNAPT G2 source pressure was increased slightly to ~5.0 × 10⁻³ mbar to aid in desolvation and transmission of intact protein complexes by partially closing the scroll pump backing the source region.40 Ion transmission optics voltages were optimized to minimize collisional activation. A detailed table of instrumental settings used is provided in the SI.41
Data Analysis.
IMS-MS data were extracted using TWIMextract software (University of Michigan, Ann Arbor, MI)42 and plotted using OriginPro 2018 (Originlab, North-hampton, MA). Midpoint melting temperatures (Tm) were determined by modeling the experimental abundance curves with a logistic function to generate a sigmoidal curve fit. In some cases, multiple transition temperatures are observed and modeled with separate regressions to obtain the midpoint values for each transition. An adjusted R2 value of 0.90 or greater was achieved for all models. Mass spectral peaks of each protonated ion charge state were integrated and normalized to the sum of all HbA and aggregate signals observed at each temperature. Additional details describing the data normalization are included in the SI. Reported Tm and uncertainties are the average value and standard deviation from triplicate measurements, respectively. The IMS drift time distributions were modeled with sets of Gaussian functions to determine the peak areas of each feature in the distributions. Peak areas from the Gaussian functions were normalized to the total drift time signal of all HbA, and aggregate signals at each temperature. Traveling wave IMS collision CCS values were estimated using the protocol described by Ruotolo et al.43 using human transthyretin (Sigma-Aldrich, St. Louis, MO) as a calibrant (N2 CCS values),44 and N2 as the IMS drift gas. CCS values of X-ray crystal structures were calculated using the IMPACT tool (University of Oxford, Oxford, United Kingdom).45 Theoretical CCS values for αβ dimers of HbA were calculated by removing two of the subunits in the deoxyHbA tetramer structure (pdb: 2dn2)33 to generate the desired αβ binding interfaces. Images of pdb structures were created using opensource PyMOL 1.6 software.46
RESULTS
Mass Spectrometry-Based Melting Studies.
Figure 1 shows mass spectra of HbA acquired at three different solution temperatures: 28, 56, and 64 °C. At ambient temperature (28 °C), the native α2β2 HbA tetramer is the most abundant species observed in the mass spectrum, appearing as three signals centered around the +17 charge state at m/z 3802. Additionally, a small population of αβ heterodimers is observed with charge states +11 and +12, accounting for ~22% of the total signal. We note that this small fraction of heterodimers is in agreement with a recent cryo-electron microscopy study that found that ~20% of particles corresponded to αβ heterodimers.39 As the solution temperature is increased, the populations shift to favor the dimer species, indicated by the changes in respective peak intensities. At 56 °C, the dimer species become the dominant signal observed in the mass spectrum. Also shown in Figure 1 are the relative abundances of the α2β2 and αβ species plotted as a function of temperature. These abundance plots report on the temperature-dependent equilibrium between tetramer and dimer. The plot also provides means for comparing the relative stabilities of the subunit binding interactions, as the tetramers “melt” to form dimers, and ultimately unstable monomers with increasing solution temperature. Relative stabilities of each species can be evaluated based on the midpoint melting temperatures (Tm) or formation temperatures (Tf) of each species, where a higher Tm or lower Tf indicates a more stable species. We note that the observed dissociation of tetramers to dimers occurs in solution, and not as a result of gas-phase activation (for which the products are the monomers). A comparison of gas-phase activation at three temperatures (25, 40, and 50 °C) shows no difference in the products formed, or energy thresholds required for dissociation (see SI).
Figure 1.
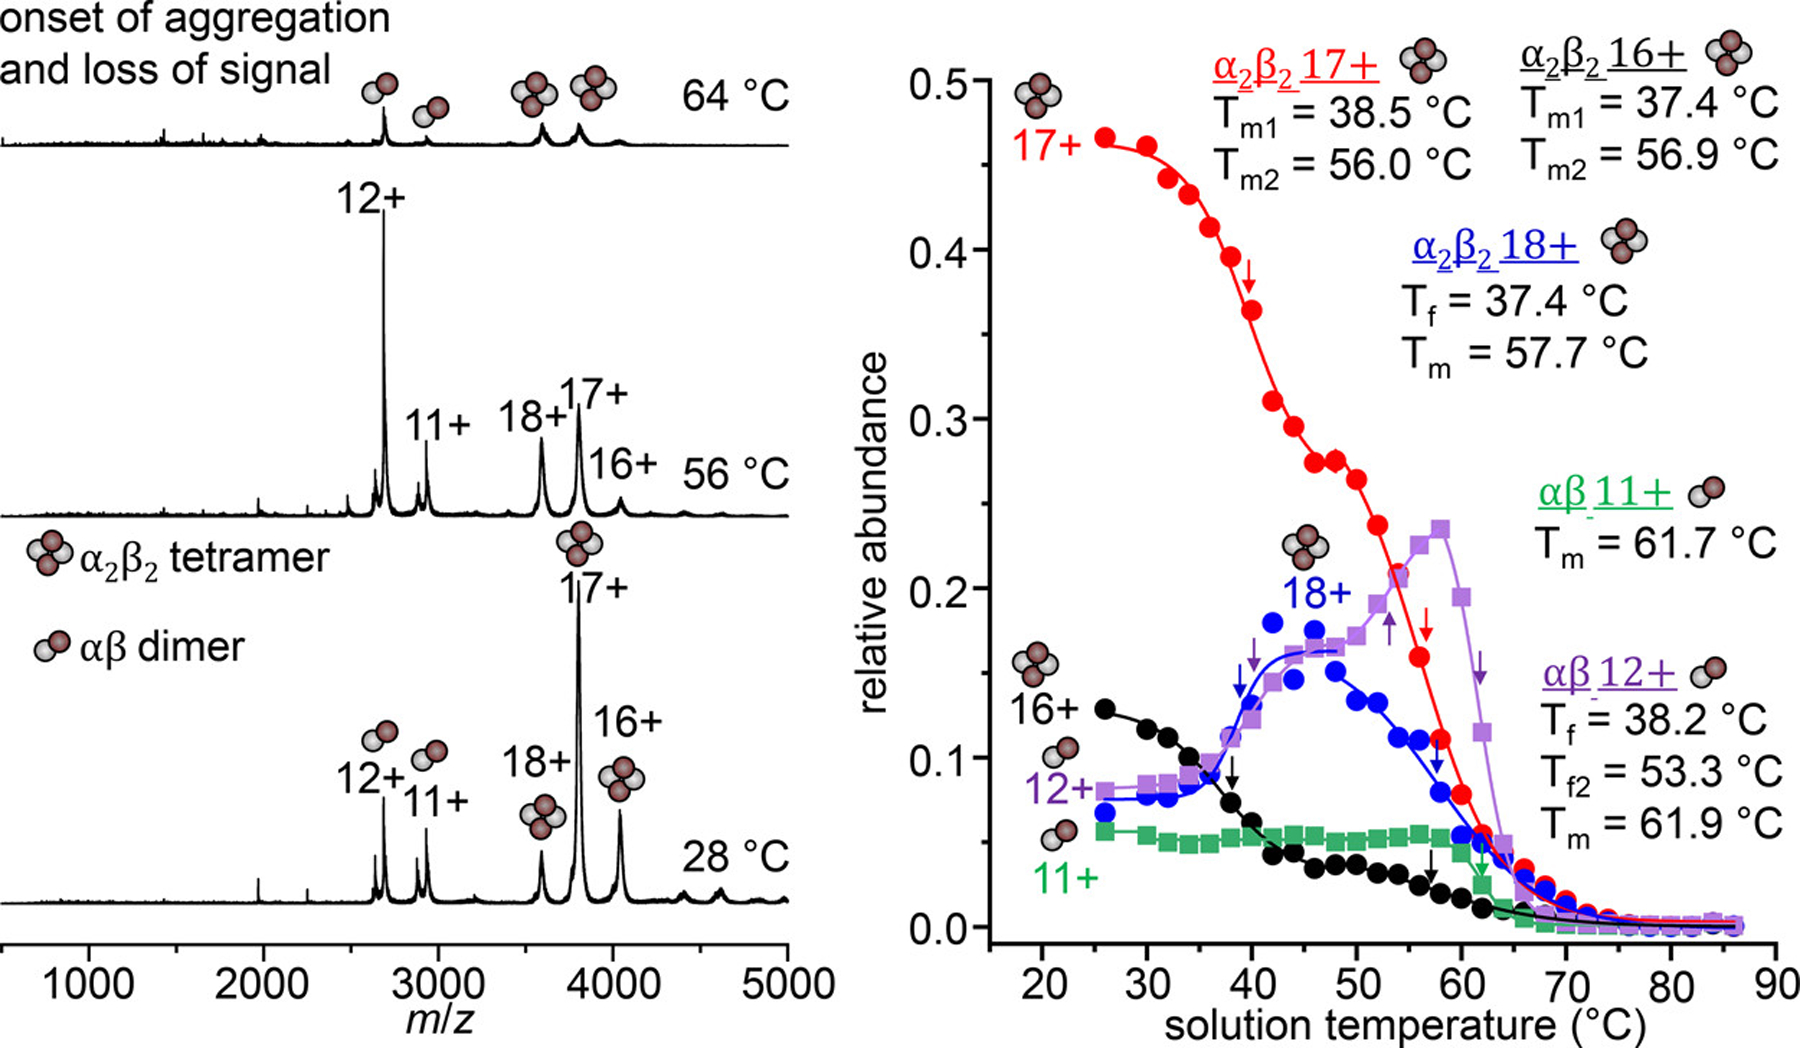
Representative vT-ESI mass spectra of HbA at 28 °C, 56 °C, and 64 °C (left). Tetramer and dimer species are indicated with symbols consisting of four or two spheres, respectively. Relative abundance curves of all α2β2 tetramers (circle symbols) and αβ dimers (square symbols) charge states (right) Midpoint Tm and Tf values determined from sigmoidal curve fits are listed under the respective oligomer charge states (color mapped to abundance plots). Positions of Tm and Tf are indicated on the abundance curves with colored arrows. Relative abundance values are normalized to the total abundance of all HbA signals at each temperature.
In addition to changes in subunit stoichiometry, we also observe a shift to higher charge states in both the tetramer and dimer species concomitant with increasing solution temperature (Figure 1). This increase in protein charge state is indicative of a structural change (i.e., unfolding) resulting in additional basic side chains becoming solvent exposed, and subsequently protonated during the ESI process.10,6,7,47 The abundance plots indicate that each species is biphasic: the first phase is observed between 26 and 50 °C, in which the +16, and +17 tetramer intensities decrease; the +18 species increases with temperature (Tf = 38.3 ± 2.1 °C). The intensity of the +12 dimer species also increases during this first phase (Tf = 38.1 ± 1.4 °C). This suggests that the structural changes occurring in the tetramer result in a less stable subunit binding interface, and increased dissociation into the dimer species. That the midpoint temperatures of melting and formation of each species occurs at or near physiological temperature (~37 °C) may not be be purely coincidental. Hemoglobin has a dynamic and flexible conformation that is allosterically regulated to tune its affinity for O2.48–52 Our measurements reflect this. In the second phase, between 50 and 58 °C, all three tetramer charge states undergo a second melting transition with Tm values between 56 and 57.7 ± 0.8 °C, while the +12 dimer species continues to form. At ~ 54 °C, the +12 dimer becomes more favorable than the tetramer. These Tm values of the tetramer dissociation are in good agreement with the Tm determined by circular dichroism spectroscopy, 56.5 °C (see SI). We note that during electrospray, the droplets undergo rapid evaporative cooling such that the final temperature of the protein is not the same as the temperature set by the vT-ESI device. This suggests that some degree of refolding may occur for reversible processes, however this is kinetically limited by the low temperature, and short lifetime of the droplets (~25−50 μs for nanoESI tips).53
It is interesting to note that we do not detect a significant population of free α or β monomers, even as both the tetramer and dimer species begin to dissociate at higher solution temperatures. This is likely due to the instability of the free subunits, which are prone to aggregation when not complexed by a chaperone or in complex with its counterpart subunit.54–56 At ~ 60 °C, the overall signal intensity of all species decreases and the sample solution begins to appear turbid; we attribute this to the formation of insoluble aggregates that are not amenable to ESI. While it would be beneficial to observe the dissociation to monomers directly, we can still make inferences and comparisons of the relative stability of the dimers based on the decay profiles and the Tm values derived from these profiles.
Effects of Oxidation Post-Translational Modifications.
In addition to the αβ dimer species, we observe a smaller subpopulation of dimers having mass difference of −584.2 Da as shown in Figure 2. This mass difference corresponds to an oxidized apo heterodimer species ; having lost one of the iron heme groups from an active site (Δm = −616.4 Da) and having gained a dioxidation PTM (Δm = +32.0 Da). Figure 2 shows a mass spectrum of the region containing the dimer species. The doublet peaks in the +11 and +12 charge states are identified as αβ dimers at m/z = 2930.8 and 2686.4, and the species at m/z = 2877.7 and 2637.9. Figure 2 also shows a plot of the abundances of these species as a function of the solution temperature, that report on the relative stabilities of each species. That each species behaves differently with respect to temperature suggests that they are reporting on unique structures originating from solution, with measurable differences in stability. Notably, the species have considerably lower midpoint Tm values than their unmodified αβ counterparts. For example, the +12 species has a midpoint Tm = 56.7 ± 0.4 °C, whereas the +12 αβ species has a Tm = 61.5 ± 0.2 °C (ΔTm = −4.8 °C) indicating that this modification has a destabilizing effect on αβ subunit binding. A similar trend is also observed in the +11 charge state, with the species having a ΔTm = −4.5 °C.
Figure 2.
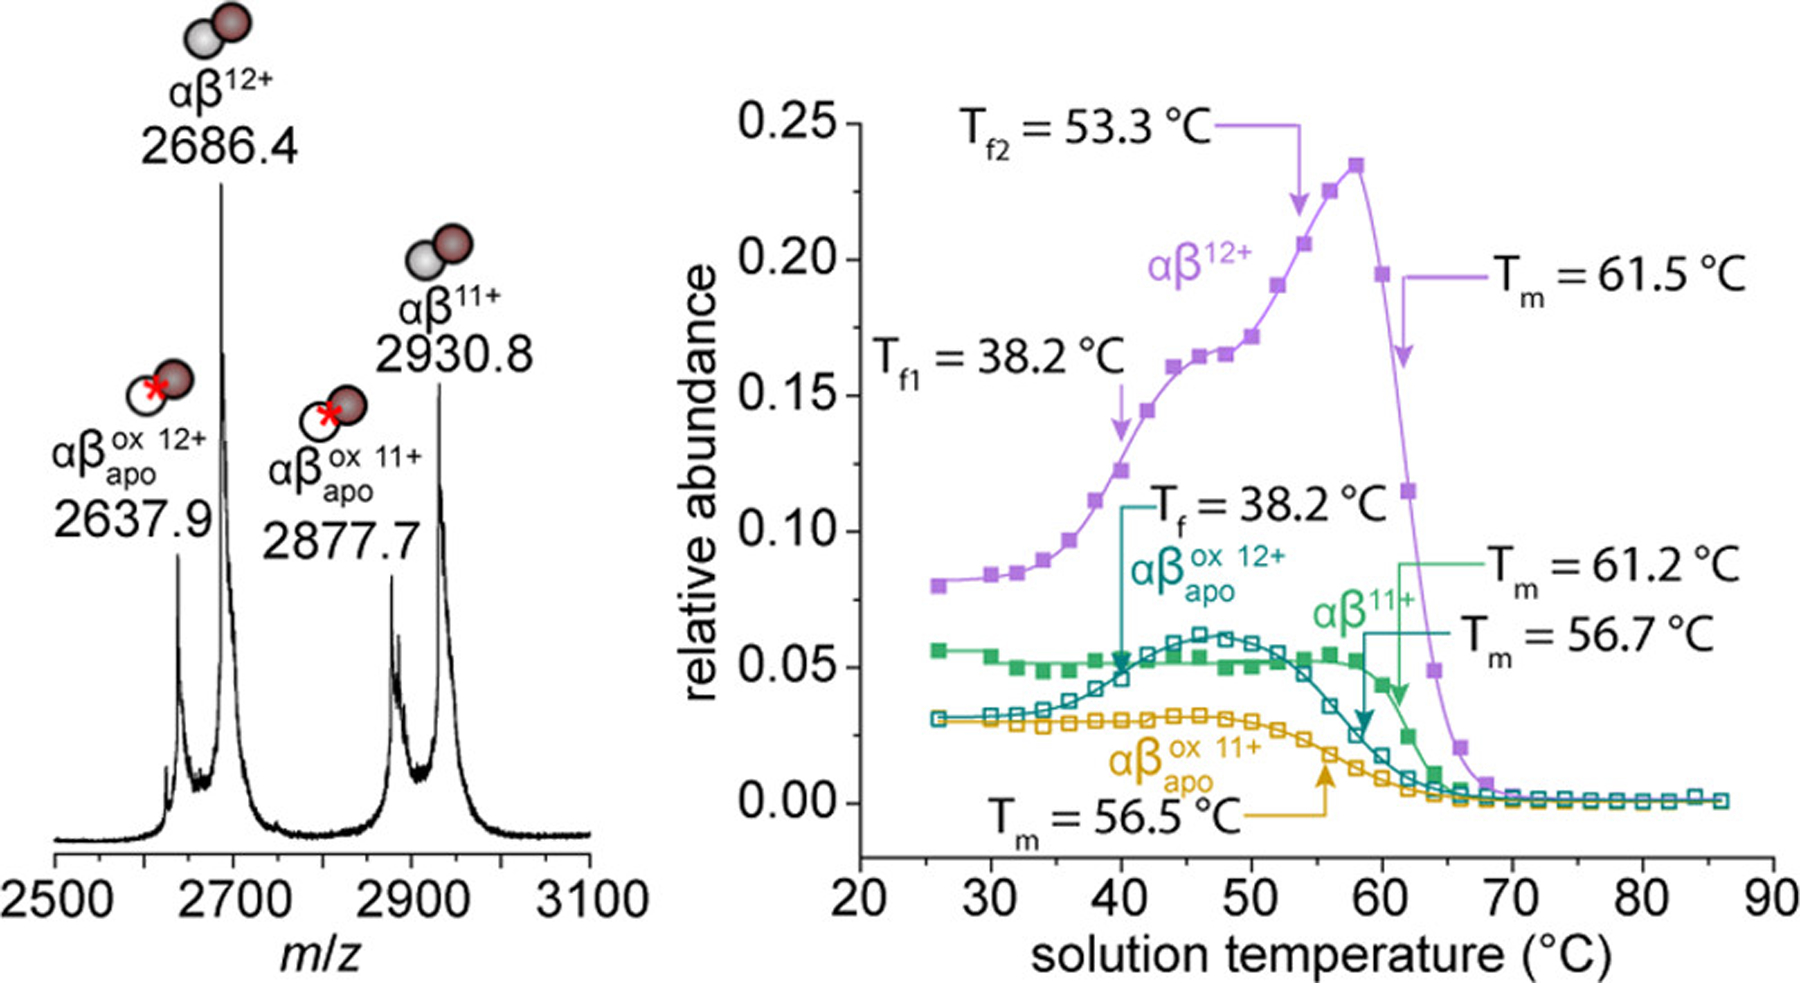
Mass spectrum showing presence of αβ dimers and dimer species at 28 °C (left). Relative abundance curves of each dimer species as a function of soluition temperature (right). Mean midpoint Tm and Tf values from three replicate analyses are shown indicated by colored arrows. Relative abundance values are normalized to the total abundance of HbA signal at each temperature.
To rationalize the decreased stability of the species, it is important to determine the location of the PTM and the local environment surrounding it. Figure 3 shows collision induced dissociation (CID) spectra of the intact αβ and dimer species from MS/MS experiments. Dissociation of the dimers into their constituent monomers by CID indicates that the modifications and heme losses are found entirely on the β-subunit. An aliquot of the sample was sequenced by trypsin digestion and LC-MS/MS, revealing that Cys93 of the β-subunit (β-Cys93) is the primary site of dioxidation modification (Figure 3). β-Cys93 is located along the αβ subunit interface, adjacent to the heme binding pocket. The heme group of oxygenated HbA (oxyHbA) can autoxidize to produce reactive oxygen species (ROS) such as H2O2 during periods of oxidative stress. H2O2 proceeds to react with additional oxyHbA to form ferrylhemoglobin (another strong oxidizing agent) leading to free radical degradation of the heme.57,58 The proximity of Cys93 to this redox “hotbed” and to the subunit interface provides some context to explain the decreased Tm values observed in the species. We also find evidence for a small population of dimers having lost a heme, but without the dioxidation modification, that have slightly lower Tm values than the αβ species, but not as low as the species (see SI). These data suggest that both loss of heme, and oxidative modification of β-Cys93 disrupts the dimer subunit binding interface, shifting the binding equilibrium in favor of biologically inactive dimers, and an increase in concentration of aggregation-prone monomer units. It is worth noting that β-Cys93 is known to be a “hot spot” for oxidation modifications in oxidatively stressed cells and in disease variants of Hb such as sickle cell disease.59,60 Additionally, β-Cys93 also plays an important role in vasodilation regulation by S-nitrosylation61 and is blocked upon irreversible dioxidation.
Figure 3.
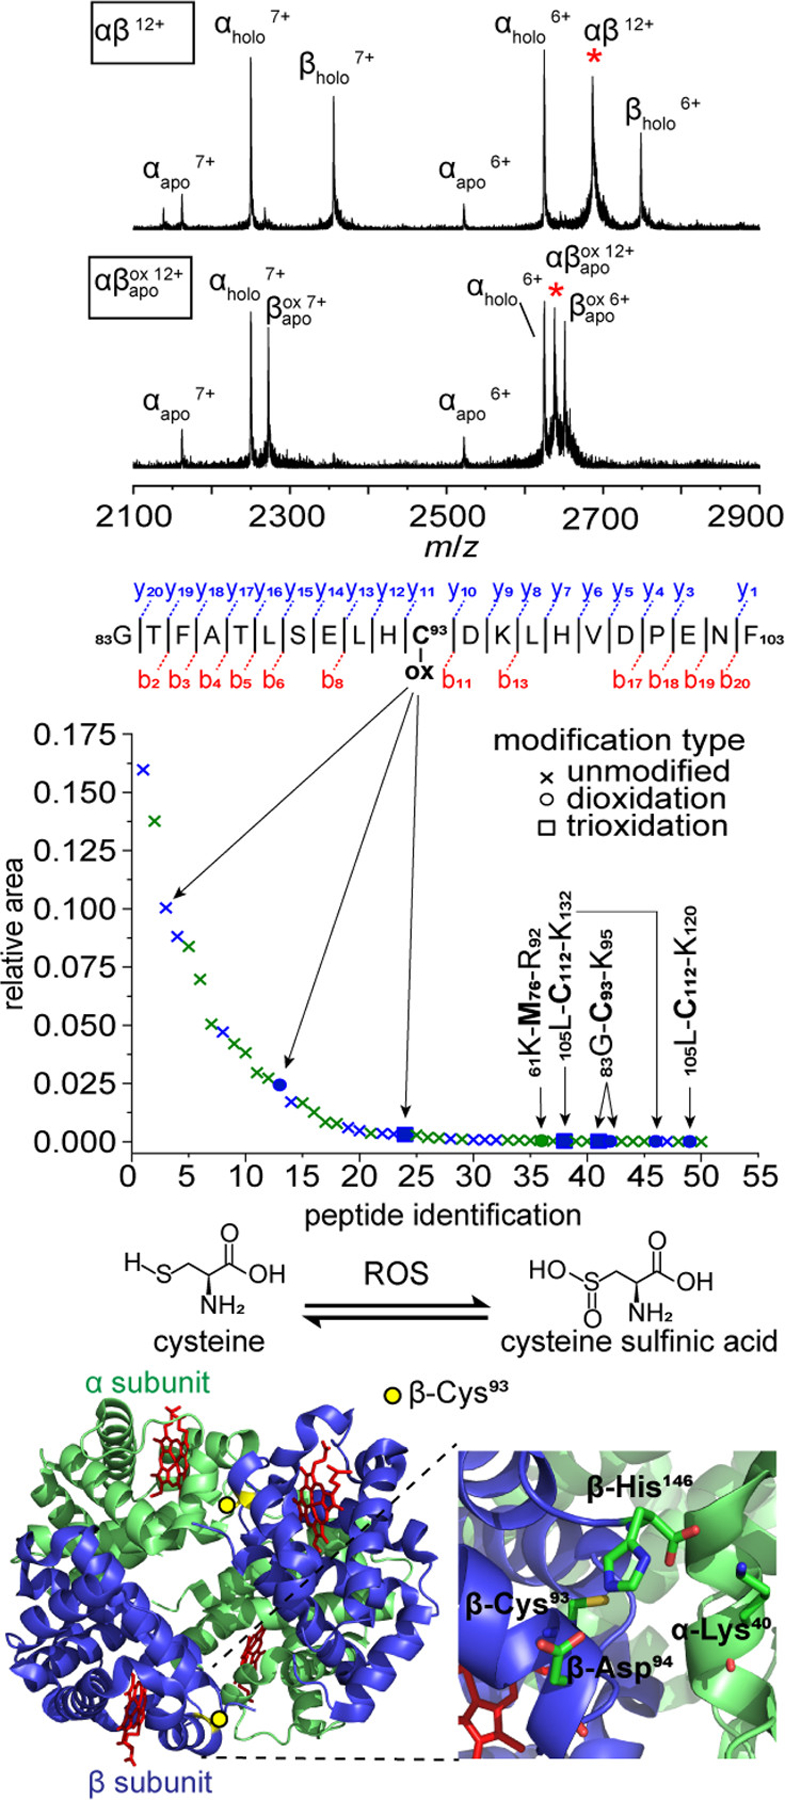
CID spectra showing dissociation of αβ, and dimers into monomer units (top). Selected dimer precursor ions are indicated by red asterisks. Collision energy was set to 50 V in the trap collision cell. LC-MS/MS sequence coverage of the highest intensity tryptic peptide with a dioxidation PTM, and relative quantitation of all detected oxidative PTMs from peptide spectral matches found (middle). Peptides originating from the α-subunit are shown in green, and those from the β-subunit are shown in blue. Modification sites are indicated in bold for all peptides detected with oxidation modifications. Reaction scheme for oxidative modification of cysteine by reactive oxygen species (ROS), and cartoon structure of HbA (pdb: 2dn2) (bottom). The location of β-Cys93 at the subunit interface is indicated by a yellow circle, and heme binding site shown in red. A zoomed view of the residues proximal to β-Cys93 are also shown (bottom).
Structural Characterization by Ion Mobility Spec-trometry.
The ion mobility measurement provides complementary structural information for each species observed in the MS data in the form of a drift time. Measured drift times can be converted to ion cross sections, values that are determined by the ion’s overall shape. The experimental CCS values are particularly useful when they are compared to atomic resolution structures and simulations.62 Figure 4 shows the CCS distributions of the +16, + 17, and +18 tetramer species, and an abundance profile of each feature as a function of solution temperature. Each of these species have two well-defined features; one at ~4320 Å2 which likely corresponds to the native structure, and a broad feature having a peak center at ~4600 Å2. Based on the crystal structure of deoxyHbA (pdb: 2dn2) the intact tetramer has a theoretical CCS of 4433 Å2. The difference between the measured CCS for the native structure and the calculated theoretical value likely arises from a slight compaction in the gas phase following removal of the solvent from the hollow cavity in the center of the complex. This compact “native-like” structure in the +16 and +17 charge states is indistinguishable based on CCS and Tm, having Tm values at 55.7 ± 0.6 and 55.6 ± 0.7 °C, respectively. We consider these species as a single structure emerging from solution, and group them together. The more elongated features in the +16 and +17 appear to have the same CCS, however they exhibit different melting behavior as can be seen in the shapes of the curves and differences in Tm. This unique thermal behavior provides evidence that these species are different structures in solution that emerge into the gas-phase with similar CCS values. Additionally, the +18 charge state has a slightly larger CCS (4360 Å2), but a very different melting profile than the +16 and +17 species and becomes more favorable between 28 and 40 °C, indicating that this is a more thermostable structure.
Figure 4.
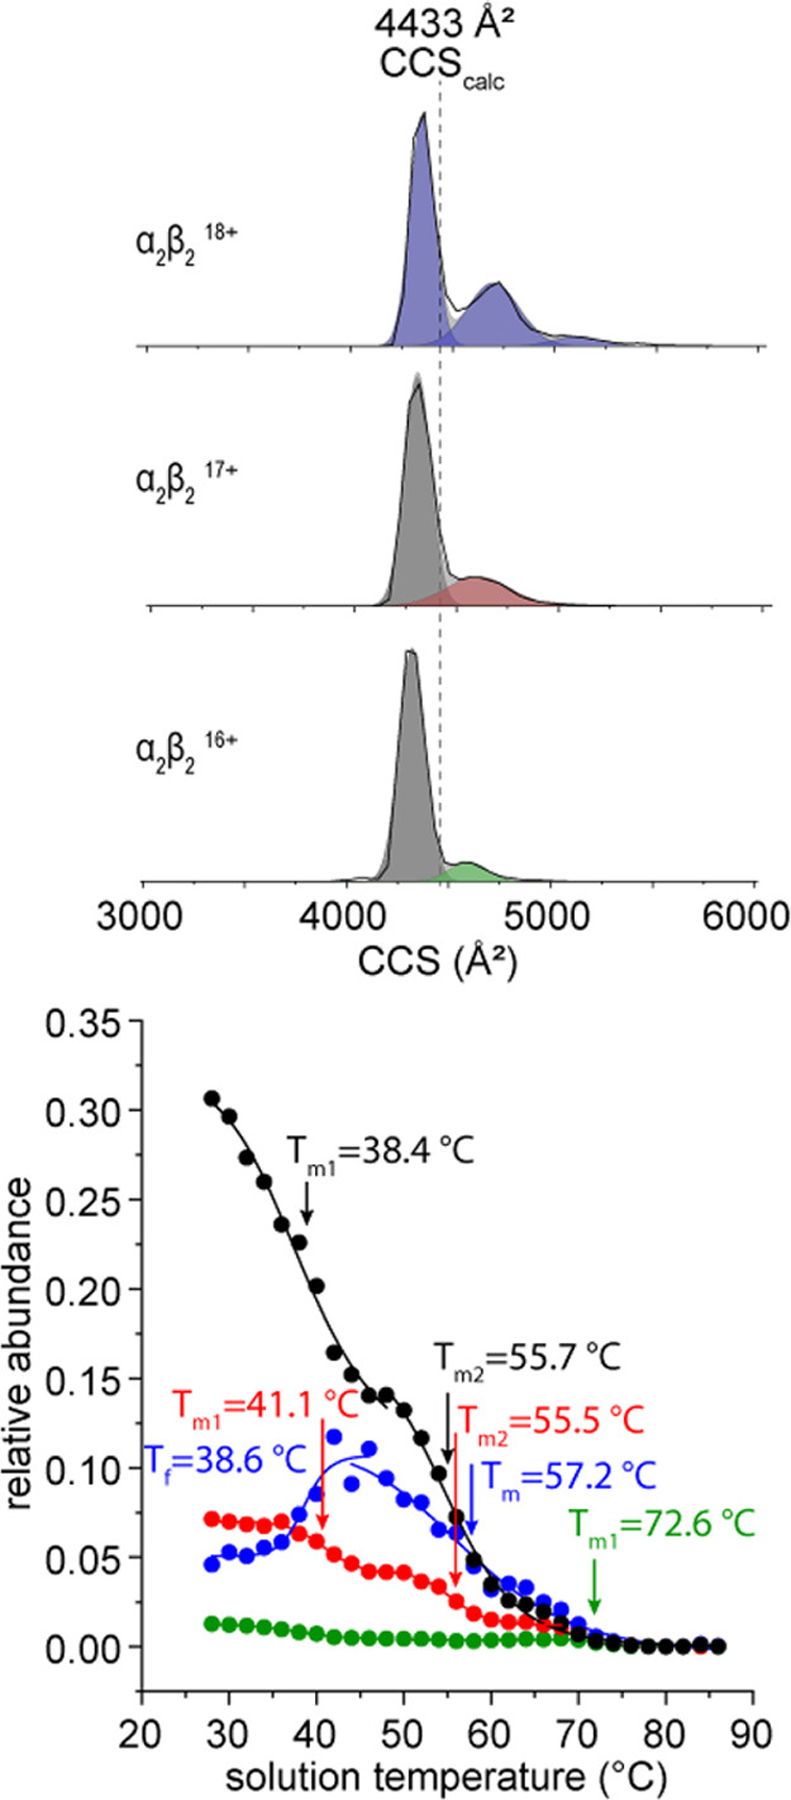
Normalized traveling wave CCS distributions of +16, + 17, and +18 HbA tetramers at 28 °C (top). The calculated CCS from the native structure (pdb: 2dn2) is shown as a dotted line. Melting profile plot of HbA tetramers plotted as the relative abundance of each conformer group as a function of solution temperature. Colored Gaussian functions are shown to indicate the peak areas included in relative abundance melting profiles. Species having the same temperature dependence are treated as a single structure coming from solution. Relative abundance values are normalized to the sum of all drift time signals at each temperature.
Above ~45 °C, the more stable +18 charge state species becomes less favorable leading to dissociation of the tetramer species to αβ dimers. Figure 5 shows a diagram of a potential dissociation pathway for the α2β2 tetramer in which two different asymmetric dimers can be formed depending on which binding interface is broken (subunit α1 bound to β1, or α1 bound to β2). The dimer with an α1β2 interface has a slightly larger theoretical CCS (3077 Å2) and includes β-Cys93 at the interface, whereas in the case of α1β1 (2936 Å2) the β-Cys93 residue is distal to the binding interface. The +11 αβ dimer CCS distribution shows two features with CCSs nearly identical to the calculated structures of the α1β2 and α1β1 dimers, as well as an additional compact feature centered about 2740 Å2. Interestingly, the dimers form essentially the same structures as their unmodified counterparts, albeit in slightly different ratios. By comparing the abundance of each of the features in the CCS distribution as a function of temperature, we can assess the relative stability of each conformer. Of the three features in the +11 charge state, the peak at 2940 Å2 that we tentatively assign as the α1β1 dimer is the most abundant at low temperatures. From the relative abundances of these peaks, we can infer that the α1β1 dimer is a more stable product, such that it is more favorable for tetramers to dissociate by cleaving the α1β2 and α2β1 interfaces (where β-Cys93 is located).
Figure 5.
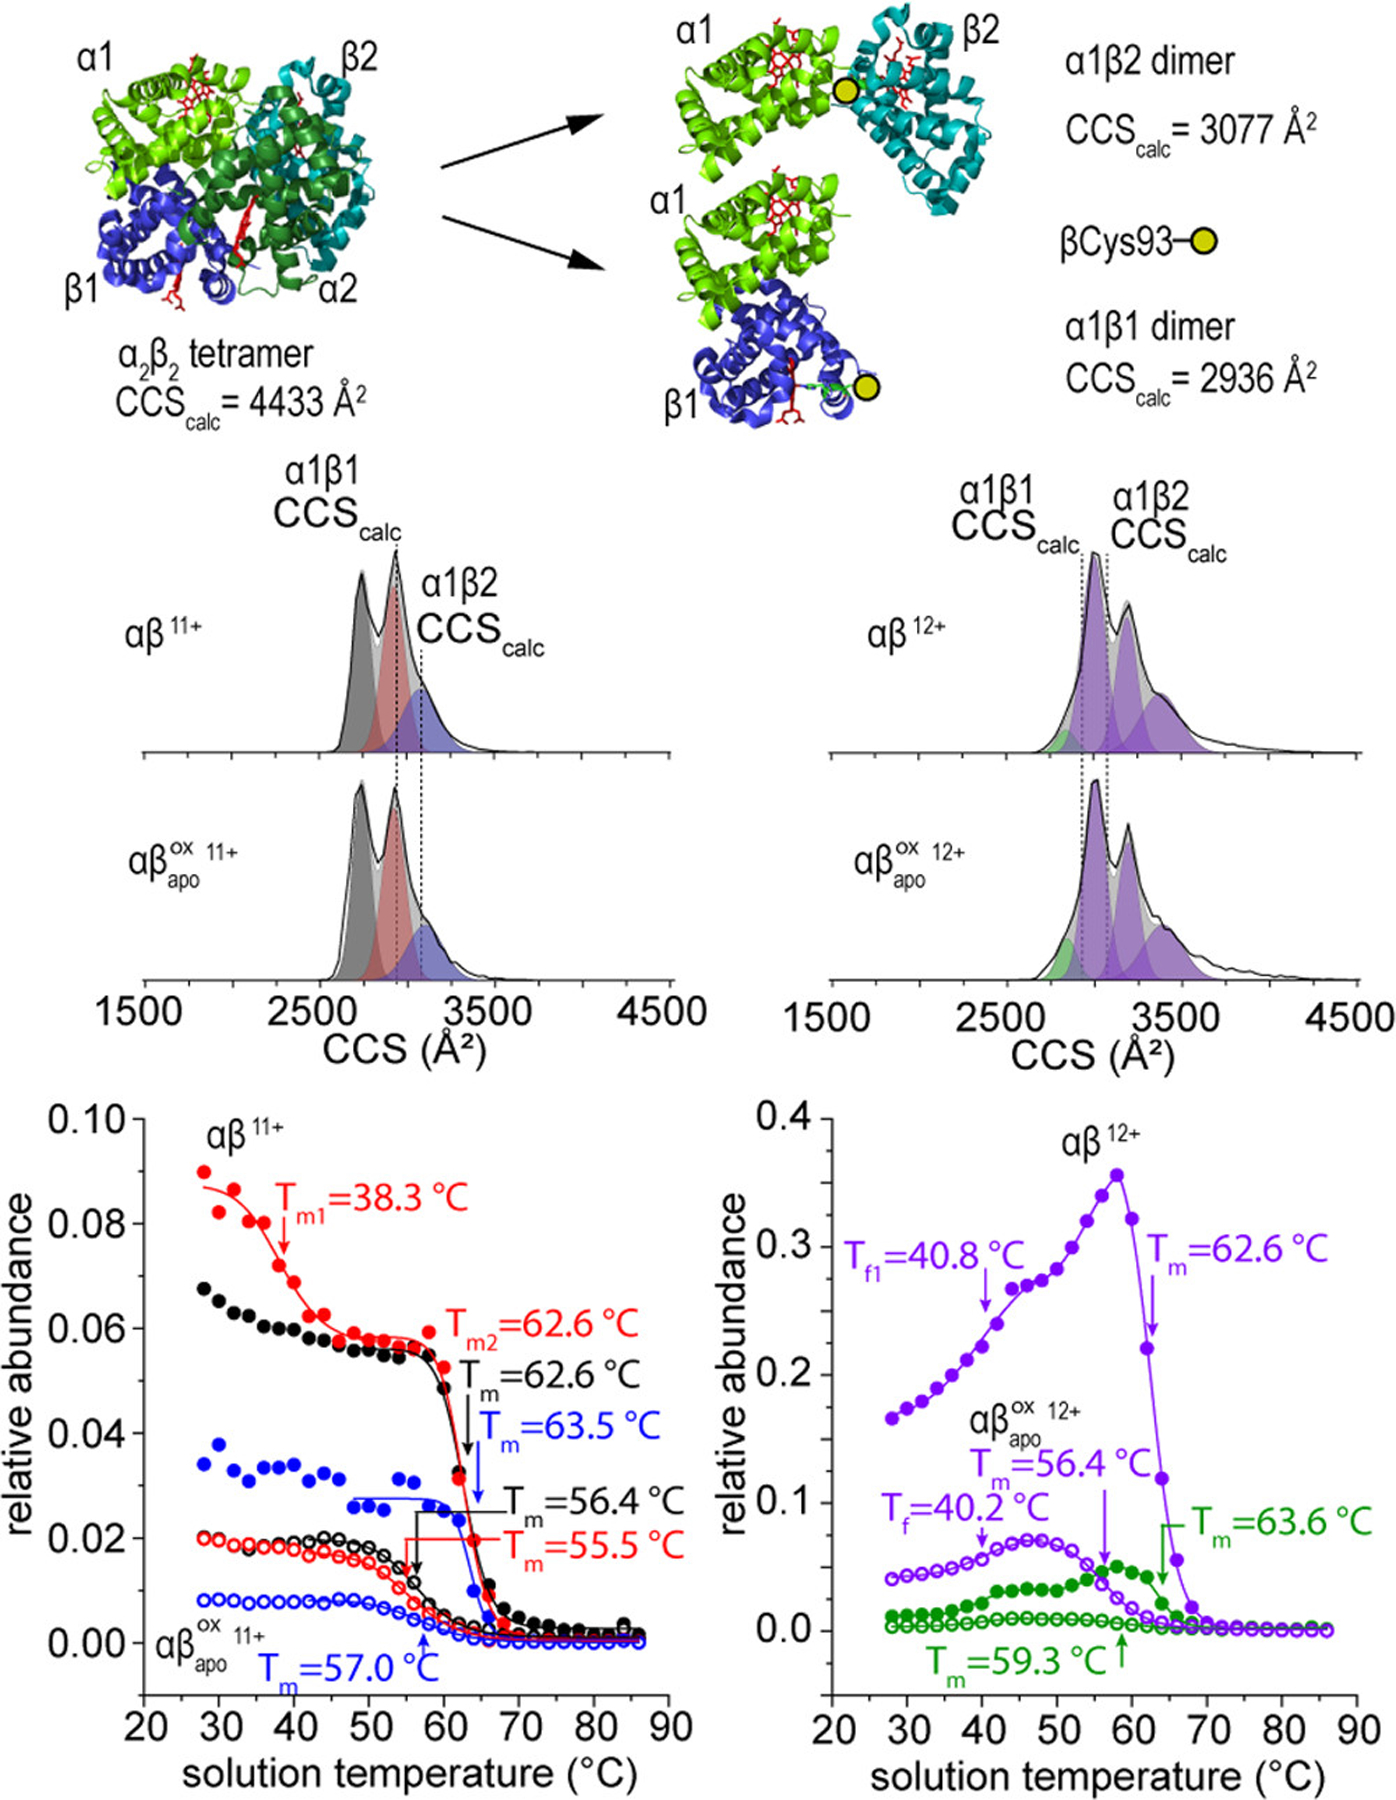
General pathway for dissociation of HbA tetramer into two asymmetric αβ dimers (top).Normalized traveling wave CCS distributions of the +11 (left) and +12 (right) charge states of the αβ and dimer species at 28 °C (middle). Calculated CCSs from atomic structures are shown as a dotted line. Relative abundance curves of αβ (filled circles) and dimer species (open circles) showing the changes in conformer abundances with increasing solution temperature (bottom). The relative abundance traces correspond to the peak areas indicated by the modeled Gaussian peaks of the same color in the CCS distributions. Relative abundance values are normalized to the sum of all drift time signals at each temperature.
In the population, the difference in melting temperatures between the α1β1 and α1β2 dimer is greater (ΔTm = 1.5 °C) than the unmodified αβ species, suggesting that dioxidation of βCys93 results in a more stable α1β2 dimer species. In the deoxy state, βCys93 is slightly out of interaction range (~4.1 Å) from the C-terminal histidine residue (see SI),33 which forms a critical salt bridge with Lys40 on the α1 subunit.63,64 Dioxidation of β-Cys93 results in a larger, negatively charged sulfinate side chain that can form a new salt bridge in solution with the C-terminal His146 residue of the β-subunit. An additional interaction at the α1β2 interface by oxidized β-Cys93 may explain the increased stability of this dimer relative to the α1β1. Remodeling of the quaternary structure at the α1β2 interface plays an important role in the allosteric regulation of HbA, as it rotates 13.2° relative to the other dimer in the transition between the tense T-state to the relaxed R-state.48–52 These data suggest that the network of allosteric interactions that permit conformational flexibility are sensitive to oxidative perturbations, which disrupts the ability of HbA to correctly assemble into its tetrameric form.
The CCS distribution for the +12 αβ dimer has three distinguishable features centered at (2990, 3200, and 3380 Å2) and one compact shoulder (2825 Å2). The experimental cross sections of +12 dimer do not resemble the calculated structures as closely as the +11 species, and its increase in abundance with temperature is suggests that this species is likely the result of a structural change that accommodates an additional positive charge. Although these features vary in CCS by as much as ~400 Å2, they all have essentially the same temperature dependence, with the exception of the compact shoulder peak. Because the melting transition curves are indistinguishable, we treat these species as different gas-phase structures originating from a single conformer type in solution. These observations indicate that the αβ dimers undergo elongation before dissociating into the aggregation prone monomer units.
CONCLUSIONS
We have investigated the thermal stability of HbA tetramers and dimers using vT-ESI-IMS-MS. The combination of vT-ESI with IMS-MS allows for the stabilities of multiple protein−protein interactions and the effects of post-translational modifications in HbA to be measured in a single experiment, as well as monitor changes in structure resulting from elevating the solution temperature. This study reveals evidence for a destabilizing effect caused by oxidation at Cys93 on the HbA β-subunit, which leads to an increase in α2β2 tetramer dissociation yielding nonfunctional αβ dimers, and presumably unstable monomers. In addition to the well characterized native structure of HbA, several populations of unique non-native structures which exist in equilibrium with the native species are observed and characterized. We find evidence for four unique tetramer structures based on CCS and melting behavior that are associated with a slight elongation of structure at increased solution temperatures. As these non-native forms have possible implications in disease, the vT-ESIIMS-MS approach is an attractive tool for characterization of these species that have thus far remained challenging to characterize in much detail.
Supplementary Material
ACKNOWLEDGMENTS
This work is supported in part by funds from the National Institutes of Health grants 5R01GM121751-03 (D.E.C., A.L., D.H.R.) and CHE-1707675 (DHR), the Robert and Marjorie Mann Graduate Research Fellowship (D.W.W. and S.A.R.), and the Dissertation Research Award (T.J.E.) from the Indiana University College of Arts and Sciences.
Footnotes
Supporting Information
The Supporting Information is available free of charge at https://pubs.acs.org/doi/10.1021/acs.analchem.9b05561.
Additional experimental conditions, IMS calibration data, circular dichroism melting data, temperature dependent collisional activation studies, MS/MS fragment spectra, and cartoon diagram of Cys93 local environment (PDF)
The authors declare no competing financial interest.
REFERENCES
- 1.Shi L; Holliday AE; Glover MS; Ewing MA; Russell DH; Clemmer DE J. Am. Soc. Mass Spectrom 2016, 27, 22–30. [DOI] [PMC free article] [PubMed] [Google Scholar]
- 2.Fuller DR; Conant CR; El-Baba TJ; Brown CJ; Woodall DW; Russell DH; Clemmer DE J. Am. Chem. Soc 2018, 140, 9357–9360. [DOI] [PMC free article] [PubMed] [Google Scholar]
- 3.Fuller DR; Conant CR; El-Baba TJ; Zhang Z; Molloy KR; Zhang CS; Hales DA; Clemmer DE Eur. J. Mass Spectrom 2019, 25, 73–81. [DOI] [PMC free article] [PubMed] [Google Scholar]
- 4.Conant CR; Fuller DR; El-Baba TJ; Zhang Z; Russell DH; Clemmer DE J. Am. Soc. Mass Spectrom 2019, 30, 919–931. [DOI] [PMC free article] [PubMed] [Google Scholar]
- 5.El-Baba TJ; Fuller DR; Hales DA; Russell DH; Clemmer DE J. Am. Soc. Mass Spectrom 2019, 30, 77–84. [DOI] [PMC free article] [PubMed] [Google Scholar]
- 6.El-Baba TJ; Woodall DW; Raab SA; Fuller DR; Laganowsky A; Russell DH; Clemmer DE J. Am. Chem. Soc 2017, 139, 6306–6309. [DOI] [PubMed] [Google Scholar]
- 7.Woodall DW; El-Baba TJ; Fuller DR; Liu W; Brown CJ; Laganowsky A; Russell DH; Clemmer DE Anal. Chem 2019, 91, 6808–6814. [DOI] [PMC free article] [PubMed] [Google Scholar]
- 8.Wang G; Bondarenko PV; Kaltashov IA Analyst 2018, 143, 670–677. [DOI] [PubMed] [Google Scholar]
- 9.Brown CJ; Woodall DW; El-Baba TJ; Clemmer DE J. Am. Soc. Mass Spectrom 2019, 30, 2438. [DOI] [PMC free article] [PubMed] [Google Scholar]
- 10.Benesch JLP; Sobott F; Robinson CV Anal. Chem 2003, 75, 2208. [DOI] [PubMed] [Google Scholar]
- 11.El-Baba TJ; Clemmer DE Int. J. Mass Spectrom 2019, 443, 93–100. [DOI] [PMC free article] [PubMed] [Google Scholar]
- 12.Wang G; Abzalimov RR; Kaltashov IA Anal. Chem 2011, 83, 2870–2876. [DOI] [PubMed] [Google Scholar]
- 13.Heck AJR Nat. Methods 2008, 5 (11), 927–933. [DOI] [PubMed] [Google Scholar]
- 14.Zhou M; Dagan S; Wysocki VH Angew. Chem., Int. Ed 2012, 51, 4336–4339. [DOI] [PubMed] [Google Scholar]
- 15.Blackwell AE; Dodds ED; Bandarian V; Wysocki VH Anal. Chem 2011, 83, 2862–2865. [DOI] [PMC free article] [PubMed] [Google Scholar]
- 16.Camacho IS; Theisen A; Johannissen LO; Díaz-Ramos LA; Christie JM; Jenkins GI; Bellina B; Barran P; Jones AR Proc. Natl. Acad. Sci. U. S. A 2019, 116 (4), 1116–1125. [DOI] [PMC free article] [PubMed] [Google Scholar]
- 17.Toby TK; Fornelli L; Kelleher NL Annu. Rev. Anal. Chem 2016, 9, 499–519. [DOI] [PMC free article] [PubMed] [Google Scholar]
- 18.Siuti N; Kelleher NL Nat. Methods 2007, 4, 817. [DOI] [PMC free article] [PubMed] [Google Scholar]
- 19.Li H; Nguyen HH; Ogorzalek Loo RR; Campuzano IDG; Loo JA Nat. Chem 2018, 10, 139. [DOI] [PMC free article] [PubMed] [Google Scholar]
- 20.Pacholarz KJ; Garlish RA; Taylor RJ; Barran PE Chem. Soc. Rev 2012, 41, 4335–4355. [DOI] [PubMed] [Google Scholar]
- 21.Gault J; Donlan JAC; Liko I; Hopper JTS; Gupta K; Housden NG; Struwe WB; Marty MT; Mize T; Bechara C; Zhu Y; Wu B; Kleanthous C; Belov M; Damoc E; Makarov A; Robinson CV Nat. Methods 2016, 13, 333. [DOI] [PMC free article] [PubMed] [Google Scholar]
- 22.Xie Y; Zhang J; Yin S; Loo JA J. Am. Chem. Soc 2006, 128, 14432–14433. [DOI] [PubMed] [Google Scholar]
- 23.Lo Conte L; Chothia C; Janin JJ Mol. Biol 1999, 285, 2177–98. [DOI] [PubMed] [Google Scholar]
- 24.Janin J Structure 1999, 7, R277–R279. [DOI] [PubMed] [Google Scholar]
- 25.Jubb HC; Pandurangan AP; Turner MA; Ochoa-Montaño B; Blundell TL; Ascher DB Prog. Biophys. Mol. Biol 2017, 128, 3–13. [DOI] [PubMed] [Google Scholar]
- 26.Pawson T; Nash P Genes Dev. 2000, 14, 1027–1047. [PubMed] [Google Scholar]
- 27.Nishi H; Hashimoto K; Panchenko AR Structure 2011, 19, 1807–1815. [DOI] [PMC free article] [PubMed] [Google Scholar]
- 28.Sengchanthalangsy LL; Datta S; Huang D-B; Anderson E; Braswell EH; Ghosh GJ Mol. Biol 1999, 289 (4), 1029–1040. [DOI] [PubMed] [Google Scholar]
- 29.Fersht AR Nat. Rev. Mol. Cell Biol 2008, 9 (8), 650–654. [DOI] [PubMed] [Google Scholar]
- 30.Englander SW; Mayne L Proc. Natl. Acad. Sci. U. S. A 2014, 111, 15873–15880. [DOI] [PMC free article] [PubMed] [Google Scholar]
- 31.Vendruscolo M; Paci E; Karplus M; Dobson CM Proc. Natl. Acad. Sci. U. S. A 2003, 100 (25), 14817–14821. [DOI] [PMC free article] [PubMed] [Google Scholar]
- 32.Perutz MF; Rossmann MG; Cullis AF; Muirhead H; Will G; North ACT Nature 1960, 185, 416–422. [DOI] [PubMed] [Google Scholar]
- 33.Park SY; Yokoyama T; Shibayama N; Shiro Y; Tame JR J. Mol. Biol 2006, 360, 690–701. [DOI] [PubMed] [Google Scholar]
- 34.Bunn HF Blood 1987, 69, 1–6. [PubMed] [Google Scholar]
- 35.Perutz MF Science 1963, 140 (3569), 863–869. [DOI] [PubMed] [Google Scholar]
- 36.Perutz M; Fermi G; Luisi B; Shaanan B; Liddington R Acc. Chem. Res 1987, 20 (9), 309–321. [DOI] [PubMed] [Google Scholar]
- 37.Finch JT; Perutz MF; Bertles JF; Döbler J Proc. Natl. Acad. Sci. U. S. A 1973, 70 (3), 718. [DOI] [PMC free article] [PubMed] [Google Scholar]
- 38.Schotte F; Cho HS; Soman J; Wulff M; Olson JS; Anfinrud PA Chem. Phys 2013, 422, 98–106. [DOI] [PMC free article] [PubMed] [Google Scholar]
- 39.Herzik MA Jr.; Wu M; Lander GC Nat. Commun 2019, 10, 1032. [DOI] [PMC free article] [PubMed] [Google Scholar]
- 40.Laganowsky A; Reading E; Hopper JTS; Robinson CV Nat. Protoc 2013, 8, 639. [DOI] [PMC free article] [PubMed] [Google Scholar]
- 41.Gabelica V; Shvartsburg AA; Afonso C; Barran P; Benesch JLP; Bleiholder C; Bowers MT; Bilbao A; Bush MF; Campbell JL; Campuzano IDG; Causon T; Clowers BH; Creaser CS; De Pauw E; Far J; Fernandez-Lima F; Fjeldsted JC; Giles K; Groessl M; Hogan CJ Jr; Hann S; Kim HI; Kurulugama RT; May JC; McLean JA; Pagel K; Richardson K; Ridgeway ME; Rosu F; Sobott F; Thalassinos K; Valentine SJ; Wyttenbach T Mass Spectrom. Rev 2019, 38 (3), 291–320. [DOI] [PMC free article] [PubMed] [Google Scholar]
- 42.Haynes SE; Polasky DA; Dixit SM; Majmudar JD; Neeson K; Ruotolo BT; Martin BR Anal. Chem 2017, 89, 5669–5672. [DOI] [PMC free article] [PubMed] [Google Scholar]
- 43.Ruotolo BT; Benesch JLP; Sandercock AM; Hyung S-J; Robinson CV Nat. Protoc 2008, 3, 1139. [DOI] [PubMed] [Google Scholar]
- 44.Bush MF; Hall Z; Giles K; Hoyes J; Robinson CV; Ruotolo BT Anal. Chem 2010, 82, 9557–9565. [DOI] [PubMed] [Google Scholar]
- 45.Marklund EG; Degiacomi MT; Robinson CV; Baldwin AJ; Benesch JL Structure 2015, 23, 791–799. [DOI] [PubMed] [Google Scholar]
- 46.PyMOL Molecular Graphics System https://sourceforge.net/projects/pymol/files/pymol/1.6/ (accessed November 13, 2019).
- 47.Kaltashov IA; Mohimen A Anal. Chem 2005, 77, 5370–5379. [DOI] [PMC free article] [PubMed] [Google Scholar]
- 48.Bohr C; Hasselbalch K; Krogh A Skand. Arch. Physiol 1904, 16, 402–412. [Google Scholar]
- 49.Perutz MF Nature 1970, 228, 726–739. [DOI] [PubMed] [Google Scholar]
- 50.Baldwin J; Chothia CJ Mol. Biol 1979, 129, 175–220. [DOI] [PubMed] [Google Scholar]
- 51.Monod J; Wyman J; Changeux JP J. Mol. Biol 1965, 12, 88–118. [DOI] [PubMed] [Google Scholar]
- 52.Perutz MF; Wilkinson AJ; Paoli M; Dodson GG Annu. Rev. Biophys. Biomol. Struct 1998, 27, 1–34. [DOI] [PubMed] [Google Scholar]
- 53.Xia Z; Williams ER Analyst 2019, 144 (1), 237–248. [DOI] [PubMed] [Google Scholar]
- 54.Bank AJ Clin. Invest 1968, 47, 860–866. [DOI] [PMC free article] [PubMed] [Google Scholar]
- 55.Kihm AJ; Kong Y; Hong W; Russell JE; Rouda S; Adachi K; Simon MC; Blobel GA; Weiss MJ Nature 2002, 417 (6890), 758–63. [DOI] [PubMed] [Google Scholar]
- 56.Krishna Kumar K; Dickson CF; Weiss MJ; Mackay JP; Gell DA Biochem. J 2010, 432 (2), 275–282. [DOI] [PMC free article] [PubMed] [Google Scholar]
- 57.Nagababu E; Rifkind JM Biochemistry 2000, 39 (40), 12503–12511. [DOI] [PubMed] [Google Scholar]
- 58.Nagababu E; Rifkind JM Biochem. Biophys. Res. Commun 1998, 247 (3), 592–596. [DOI] [PubMed] [Google Scholar]
- 59.Kassa T; Jana S; Strader MB; Meng F; Jia Y; Wilson MT; Alayash AI J. Biol. Chem 2015, 290, 27939–27958. [DOI] [PMC free article] [PubMed] [Google Scholar]
- 60.Strader MB; Kassa T; Meng F; Wood FB; Hirsch RE; Friedman JM; Alayash AI Redox Biol 2016, 8, 363–374. [DOI] [PMC free article] [PubMed] [Google Scholar]
- 61.Zhang R; Hess DT; Qian Z; Hausladen A; Fonseca F; Chaube R; Reynolds JD; Stamler JS Proc. Natl. Acad. Sci. U. S. A 2015, 112, 6425–6430. [DOI] [PMC free article] [PubMed] [Google Scholar]
- 62.Lanucara F; Holman SW; Gray CJ; Eyers CE Nat. Chem 2014, 6, 281. [DOI] [PubMed] [Google Scholar]
- 63.Silva MM; Rogers PH; Arnone AJ Biol. Chem 1992, 267, 17248–17256. [PubMed] [Google Scholar]
- 64.Dey S; Chakrabarti P; Janin J Proteins: Struct., Funct., Genet 2011, 79, 2861–2870. [DOI] [PubMed] [Google Scholar]
Associated Data
This section collects any data citations, data availability statements, or supplementary materials included in this article.


