

ABSTRACT
Online activity-based data can be used to aid infectious disease forecasting. Our aim was to exploit the converging nature of the tuberculosis (TB) and diabetes epidemics to forecast TB case numbers. Thus, we extended TB prediction models based on traditional data with diabetes-related Google searches. We obtained data on the weekly case numbers of TB in Germany from June 8th, 2014, to May 5th, 2019. Internet search data were obtained from a Google Trends (GTD) search for ‘diabetes’ to the corresponding interval. A seasonal autoregressive moving average (SARIMA) model (0,1,1) (1,0,0) [52] was selected to describe the weekly TB case numbers with and without GTD as an external regressor. We cross-validated the SARIMA models to obtain the root mean squared errors (RMSE). We repeated this procedure with autoregressive feed-forward neural network (NNAR) models using 5-fold cross-validation. To simulate a data-poor surveillance setting, we also tested traditional and GTD-extended models against a hold-out dataset using a decreased 52-week-long period with missing values for training. Cross-validation resulted in an RMSE of 20.83 for the traditional model and 18.56 for the GTD-extended model. Cross-validation of the NNAR models showed a mean RMSE of 19.49 for the traditional model and 18.99 for the GTD-extended model. When we tested the models trained on a decreased dataset with missing values, the GTD-extended models achieved significantly better prediction than the traditional models (p < 0.001). The GTD-extended models outperformed the traditional models in all assessed model evaluation parameters. Using online activity-based data regarding diabetes can improve TB forecasting, but further validation is warranted.
KEYWORDS: Tuberculosis, Diabetes, Google Trends, Surveillance, Forecasting
Tuberculosis (TB) is one of the 10 leading causes of death worldwide and the leading cause of death from a single infectious agent. The World Health Organization estimated 10 million cases of TB and 1.4 million TB-related deaths in 2018 [1]. Despite several improvements in disease control, tuberculosis diagnosis, treatment, and surveillance face many challenges, especially in the developing world. HIV coinfection [2] and diabetes [3,4] have a synergistic effect with TB infection, resulting in synergistic pandemics [5,6].
The possible synergy between TB and diabetes was observed several centuries ago [5,7]. Today, an extensive body of evidence supports the convergent nature of these two epidemics [4,5,8–11]. The convergence of these two diseases indicates a need for updated treatment, surveillance, and prevention strategies that should be considered in TB control programmes [10,12–14].
Much needed alternative TB surveillance methods could exploit this synergism. One potential approach is to use diabetes-related online activity data to forecast TB incidence.
In low- and middle-income countries, traditional epidemiological surveillance and data collection is challenging. Thus, using alternative online data to estimate disease activity would be an attractive option for infectious disease monitoring and prediction in these areas. However, exclusively using such data may lead to overfitting [15]. Therefore, we examined forecasting models of weekly TB case numbers based on traditional data (past TB incidence) extended with Google Trends search volumes. The applied methods, which we supplemented, were stochastic time series modeling (autoregressive‐integrated moving average models) [16] and neural network modeling, both of which are currently used in tuberculosis forecasting [17, 18, 19].
Methods
Data
Data on the weekly case numbers of TB in Germany from June 8th, 2014, to May 5th, 2019, were obtained from the database of the Robert Koch Institute, which is the national institute of infectious diseases in Germany, through the website SurvStat@rki 2.0 (https://survstat.rki.de/Content/Query/Create.aspx). A query was created on June 2nd, 2019, with ‘Tuberkulose’ as the disease (the German term for TB disease) and ‘Jahr und Meldewoche’ (year and week of notification) as the time units. Internet search data were obtained from Google Trends on June 2nd, 2019 (https://trends.google.com/trends/) by searching for ‘diabetes’ in Germany with the ‘last five years’ as the timespan category. The values were integers of the relative weekly search ‘volume’, where 100 represented the highest search number. The raw data of the training and validation sets are shown in Figure 1.
Figure 1.
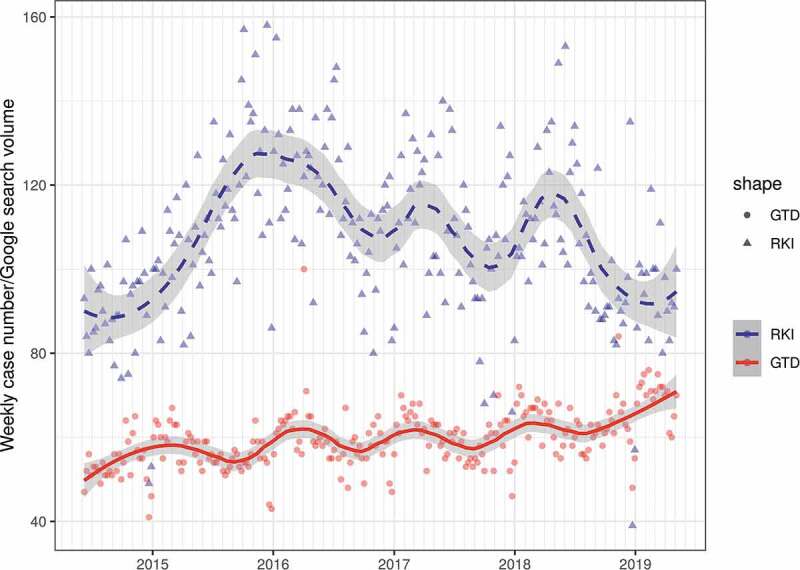
Weekly TB case numbers and diabetes-related Google search values. Weekly TB case numbers are shown as blue triangles; relative Google Trends search volumes are shown as red dots (RKI: Robert Koch Institute, GTD: Google Trends). Trends are illustrated with loess smoothers with 95% confidence bands (Weekly TB case numbers: dashed line, GTD: solid line)
Analytical methods
We performed additive time series decomposition on the weekly TB case numbers. An exploratory contemporaneous correlation between the Google Trends data (GTD) and the weekly TB case numbers was assessed with Kendall tau correlation.
First, we modeled the time series data using a seasonal autoregressive moving average (SARIMA) model with differentiation [20].
The selection of optimal components was performed automatically based on the corrected Akaike information criterion (AIC). This procedure was repeated with GTD entered as an external regressor. The models using only TB case numbers and the model extended with GTD were characterized and compared using the AIC values. Predictive performance was described using root-mean-square error (RMSE) and mean absolute percentage error (MAPE). Both models were internally validated (‘evaluation on a rolling forecasting origin’) [21] using 12 weeks as the rolling window and 1 for the forecasting horizon.
Machine learning methods are considered as an alternative to traditional methods in time series forecasting [22]. Thus, to evaluate our findings, in a second step, we established an autoregressive feed-forward neural network (NNAR) model using a single hidden layer with 4 hidden nodes and lagged inputs [23]. This procedure was repeated with the GTD data as an external regressor. We used 5-fold cross-validation to compare the predictive accuracy.
To test whether GTD could improve predictive performance with scarce data, we used a decreased time interval involving the case numbers of the first 52 weeks to train the SARIMA and NNAR models as described above (however, the SARIMA model with the lowest AIC was selected manually). Moreover, we randomly deleted 10 out of 52 observations to simulate a data-poor surveillance setting. Missing values were imputed using a Kalman smoother [24]. Predictions for the following 52 weeks were made, and the accuracy was compared with the result of the two-sided Diebold-Mariano test.
We performed all statistical analyses with R version 3.4.4 [25] using the forecast package version 8.4 [23]. The script and the dataset are available online (https://github.com/msulyok/Google-Trends-Tuberculosis), and detailed results are provided in the online Supplementary File.
Results
A clear trend or any relevant seasonality could not be identified in the weekly TB case numbers using additive decomposition. The Google search volume showed a weak contemporaneous correlation (τ = 0.1129; p = 0.009) with TB case numbers (Figure 1).
SARIMA models
The optimal model without GTD used single-fold differentiation with zero autoregression and 1 as the moving average order non-seasonally. The seasonal component consisted of zero differentiation, single autoregression and a zero-order moving average. The selected GTD-extended model had the same components.
The AIC favored the GTD-extended model. Measures of accuracy (RMSE and MAPE) also indicated a better performance by the GTD-extended model than by the traditional model.
The results of the applied internal validation method were in line with these findings; the validated RMSE of the traditional model was higher than that of the GTD-extended one. Especially in 2016, the traditional model showed a high positive error – this was more accurate with the GTD-extended version (Figure 2). The model characteristics are summarized in Table 1.
Figure 2.
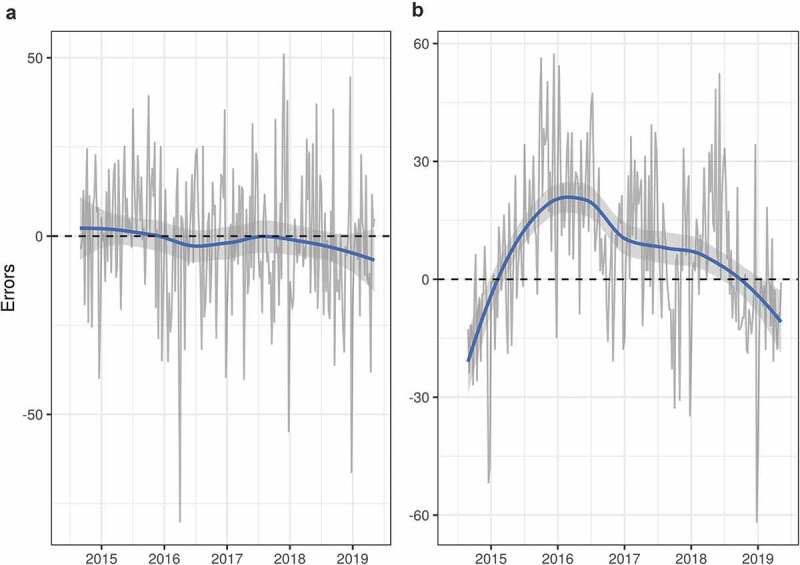
Cross-validation (evaluation on a rolling forecasting origin) errors. Errors of the Google Trends-extended SARIMA model (panel A) and of the traditional data-based SARIMA model (panel B). Loess smoothers with 95% CIs for both time series are shown in the same color. The closeness of the smoother (panel A) to the 0 error line indicates a better performance and validity of the GTD-extended SARIMA model
Table 1.
Comparison of the traditional and GTD-extended SARIMA models
| Without GTD Data | With GTD Data | |
|---|---|---|
| Optimal SARIMA | SARIMA (0,1,1) (1,0,0) [52] | SARIMA (0,1,1) (1,0,0) [52] |
| Corrected Akaike Information Criterion | 2142.4 | 2124.4 |
| Bayesian Information Criterion | 2152.94 | 2138.47 |
| RMSE | 15.55 | 14.99 |
| MAPE | 12.19 | 11.95 |
| RMSE (evaluated on a rolling forecast origin) | 20.83 | 18.56 |
Autoregressive neural networks
The neural network based on traditional data had an RMSE of 11.58 and an MAPE of 8.43. These numbers were slightly lower for the GTD-extended model (RMSE 10.94, MAPE 8.02), indicating a better performance as was the case for the SARIMA models.
Five-fold cross-validation revealed similar findings; the mean RMSE was 19.49 with the traditional data and 18.99 when extended with GTD (Table 2).
Table 2.
Measures of predictive accuracy of the autoregressive neural network models using cross-validation
| Model Based on Traditional Data (Mean, Standard Deviation) | GTD-Extended Model (Mean, Standard Deviation) | |
|---|---|---|
| Model | NNAR(5,1,4) [52] | NNAR(5,1,4)[52] with GTD |
| Measures of accuracy | ||
| Root-mean-square error | 19.49, 4.33 | 19, 3.27 |
| Mean error | −0.76, 2.9 | −0.82, 4.36 |
| Mean absolute error | 14.96, 2.44 | 14.95, 1.91 |
| Mean percentage error | 7.62, 21.7 | 3.41, 8.43 |
| Mean absolute percentage error | 23.12, 20.31 | 19.44, 13.76 |
| First-order autocorrelation coefficient | 0.07, 0.24 | 0.02, 0.18 |
| Theil´s U | 1.57, 0.75 | 1.49, 0.66 |
Simulating a data poor surveillance setting
When we simulated suboptimal surveillance data, both the AIC values and fitting parameters favored the GTD-extended SARIMA (1,1,1) over the traditional one (corrected AIC 412.53 vs. 419.1; RMSE 21.03 vs 23.09). The GTD-extended model also significantly outperformed the traditional one in predictive accuracy for the subsequent 52 weeks (DM-value: 3.38, p-value <0.009). The NNAR models showed very similar results; the GTD-extended model performed significantly better than the traditional model (DM-value: 5.9, p-value <0.001).
Estimates of all the models and residual diagnostics are shown in the Supplementary File.
Discussion
We found that using diabetes-related online data improved the forecasting accuracy of a model predicting TB case numbers with traditional data. Our models based on traditional data already provided a relatively accurate prediction. However, adding Google Trends volumes improved this accuracy. Overall, our findings showed that the well-described syndemic relationship between TB and DM can be exploited for TB prediction.
However, we should emphasize that these results do not imply a causal relation between diabetes and tuberculosis. The weak correlation is not surprising; online attention related to diabetes is probably attributable to some ‘general’ population-level diabetes awareness – a parameter that may exhibit relatively slow changes in the trend compared to relative sudden changes in the TB incidence. As shown in Figure 2, the traditional SARIMA model resulted in more errors in certain time periods with high-amplitude changes in incidence but the addition of GTD decreased these errors.
To the best of our knowledge, the only other previously published similar work used a syndromic approach to build a nonstationary dynamic system to predict TB cases. In that study, diabetes was one of the included search terms [26]. However, the model by Zhou et al. may raise similar concerns regarding overfitting, as was surfaced by GFT [15]. We intended to approach the problem differently. Instead of adding multiple regressors, our strategy was to add search volumes regarding only the keyword ‘Diabetes’ to avoid overfitting. Nevertheless, our approach may decrease sensitivity [27]. In contrast to previous studies employing similar modeling strategies to forecast other infectious diseases [27–30], we used cross-validation techniques instead of dataset splitting given the low number of observations.
When we simulated suboptimal surveillance data (with a decreased time interval and 19% missing values), we validated the results using a hold-out dataset. We showed that the predictions of both the GTD-extended SARIMA and the NNAR models were significantly better than those of the traditional models. This further supports the potential usage of such a modeling strategy in a developing, data-poor setting.
As mentioned previously, the convergence of the diabetes and TB epidemics has been well described in the literature [3,10,12,13,31-34]. Diabetes, estimated to affect 463 million individuals worldwide [35], may jeopardize sustainable TB development goals [14]; thus, solving related questions on prediction and prevention is urgent. Moreover, diabetes can adversely affect TB disease control, as it triples the risk of active and latent TB infection and is correlated with a poor treatment outcome in affected patients [36, 8, 9, 37, 38, 11]. Increasing industrialization and urbanization evoke metabolic diseases, and overcrowded housing and problematic sanitary conditions facilitate the TB burden [39].
As three out of four patients with diabetes live in low- or middle-income countries [35], alternative online data can be especially useful to supplement traditional methods in these settings. Interestingly, recent data also suggest that combining different keyword-related Google searches may improve the surveillance of type 2 diabetes [40] [39
As the number of diabetes patients is expected to rise in the future, the possible impact on TB will probably be even more pertinent than it is today. Incorporating these relatively slow changes in diabetes trends in prediction models may allow the optimization of even long-term strategies to fight TB. Improving TB forecasting would allow a better allocation of resources [18]. This includes medical services, such as medication allocation, diagnostic tools and education campaigns, or other forms of epidemiologic interventions.
Online activity-based data have been used to monitor and predict several infectious diseases.
The first attempt – Google Flu Trends (GFT) – used exclusively online data related to several highly correlated search terms. Despite the initial high expectations, GFT’s failure to accurately predict the 2013 epidemic led to the cancellation of that project [15] and a similar project, Google Dengue Trends. A possible reason for the failure was the belief that ‘Big Data’ can fully replace traditional surveillance. Using several highly correlated terms likely substantially overfitted the model [15].
Despite the failure of GFT, the number of studies utilizing Google searches has increased [41, 42, 43, 27, 28, 29, 44, 45, 30]. Several of these studies, rectifying mistakes made in GFT, used only online data to extend traditional methods.
The most important limitations of this study are the relatively low number of observations and the lack of external validation. The standard deviations of the cross-validated measures of accuracy of the NNAR models were relatively high, which suggests similarity in the performance of the neural network models. However, when we simulated data-poor surveillance settings, the difference was more pronounced in favor of the GTD-extended models. The causality between the outcome (TB case numbers) and the external regressor (GTD) is probably very indirect. However, the focus of this paper was on forecasting performance as opposed to modeling and understanding the complex relationship between diabetes and TB.
As future perspectives, external validation, spatial analyses, the use of other keywords or keyword combinations, the addition of regressors and the use of other modeling strategies should be pursued. Incorporating other environmental and socio-economic factors, such as population aging, would probably also advance TB forecasting [46].
To conclude, the GTD-extended models outperformed the traditional models in terms of predictive accuracy. Thus, using diabetes-relevant online activity-based data can improve TB forecasting, but further validation is warranted.
Supplementary Material
Acknowledgments
We are indebted to Falko Fend.
Funding Statement
This research did not receive any specific grant from funding agencies including public, commercial, or not-for-profit sectors.
Disclosure statement
Mihály Sulyok received a research grant (UKT-AKF Nr. 346-0-0) unrelated to the current project. We have no other conflicts of interest to declare.
Data availability statement
The script and the dataset are available online (https://github.com/msulyok/Google-Trends-Tuberculosis).
Supplementary material
The supplemental data for this article can be accessed here.
References
- [1].World Health Organization . (2019). Global tuberculosis report 2019. Cited [2019 October29]. Available from: https://www.who.int/tb/global-report-2019
- [2].Pawlowski A, Jansson M, Sköld M, et al. Tuberculosis and HIV co-infection. PLoS Pathog. 2012;8(2):e1002464. [DOI] [PMC free article] [PubMed] [Google Scholar]
- [3].Alebel A, Wondemagegn AT, Tesema C, et al. Prevalence of diabetes mellitus among tuberculosis patients in Sub-Saharan Africa: A systematic review and meta-analysis of observational studies. BMC Infect Dis. 2019;19(1):254. [DOI] [PMC free article] [PubMed] [Google Scholar]
- [4].Mushtaq A. Tuberculosis in diabetes: insidious and neglected. Lancet Respir Med. 2019;7(6):483. [DOI] [PubMed] [Google Scholar]
- [5].Dooley KE, Chaisson RE.. Tuberculosis and diabetes mellitus: convergence of two epidemics. Lancet Infect Dis. 2009;9(12):737–746. [DOI] [PMC free article] [PubMed] [Google Scholar]
- [6].Mayer KH, Dukes Hamilton C. Synergistic pandemics: confronting the global HIV and tuberculosis epidemics. Clinl Infect Dis. 2010;50(s3):S67–S70. [DOI] [PubMed] [Google Scholar]
- [7].Rajalakshmi S, Veluchamy G. Yugi’s pramegam and diebetes mellitus: an analogue. Bull Indian Inst Hist Med. 1999;29(1):83–87. [PubMed] [Google Scholar]
- [8].Faurholt-Jepsen D, Range N, PrayGod G, et al. Diabetes is a strong predictor of mortality during tuberculosis treatment: a prospective cohort study among tuberculosis patients from Mwanza, Tanzania. Trop Med Int Health. 2013;18(7):822–829. [DOI] [PubMed] [Google Scholar]
- [9].Faurholt-Jepsen D, Range N, Praygod G, et al. The role of diabetes co-morbidity for tuberculosis treatment outcomes: a prospective cohort study from Mwanza, Tanzania. BMC Infect Dis. 2012a;12(1):165. [DOI] [PMC free article] [PubMed] [Google Scholar]
- [10].Magee MJ, Salindri AD, Gujral UP, et al. Convergence of non-communicable diseases and tuberculosis: a two-way street? Int J Tuberculosis Lung Dis. 2018;22(11):1258–1268. [DOI] [PMC free article] [PubMed] [Google Scholar]
- [11].Sane Schepisi M, Navarra A, Altet Gomez MN, et al. Burden and characteristics of the comorbidity tuberculosis diabetes in europe: TBnet prevalence survey and case-control study. Open Forum Infect Dis. 2019;6:1. [DOI] [PMC free article] [PubMed] [Google Scholar]
- [12].Majumdar A, Wilkinson E, Rinu PK, et al. Tuberculosis-diabetes screening: how well are we doing? A mixed-methods study from North India. Public Health Action. 2019;9(1):3–10. [DOI] [PMC free article] [PubMed] [Google Scholar]
- [13].Nguyen DT, Graviss EA. Diabetic trends and associated mortality in tuberculosis patients in Texas, a large population-based analysis. Tuberculosis (Edinb). 2019;116S:S59–S65. [DOI] [PubMed] [Google Scholar]
- [14].Puchner KP, Rodriguez-Fernandez R, Oliver M, et al. Non-communicable diseases and tuberculosis: anticipating the impending global storm. Glob Public Health. 2019;14(9):1372–1381. [DOI] [PubMed] [Google Scholar]
- [15].Lazer D, Kennedy R, King G, et al. The parable of google flu: traps in big data analysis. Science. 2014;343(6176):1203–1205. [DOI] [PubMed] [Google Scholar]
- [16].Allard R. Use of time-series analysis in infectious disease surveillance. Bull World Health Organ. 1998;76(4):327–333. [PMC free article] [PubMed] [Google Scholar]
- [17].Liu Q, Li Z, Ji Y, et al. Forecasting the seasonality and trend of pulmonary tuberculosis in Jiangsu Province of China using advanced statistical time-series analyses. Infect Drug Resist. 2019;12:2311–2322. [DOI] [PMC free article] [PubMed] [Google Scholar]
- [18].Mao Q, Zhang K, Yan W, et al. Forecasting the incidence of tuberculosis in China using the seasonal auto-regressive integrated moving average (SARIMA) model. J Infect Public Health. 2018;11(5):707–712. [DOI] [PMC free article] [PubMed] [Google Scholar]
- [19].Wang Y, Xu C, Zhang S, et al. Temporal trends analysis of tuberculosis morbidity in mainland China from 1997 to 2025 using a new SARIMA-NARNNX hybrid model. BMJ Open. 2019;9(7):e024409. [DOI] [PMC free article] [PubMed] [Google Scholar]
- [20].Hyndman RJ, Athanasopoulos G. (2014). Forecasting: principles and practice. Cited [2019 October29]. Available from: https://Otexts.com/fpp2/
- [21].Hyndman RJ. (2016). Cross-validation for time series. Cited [2019 October29]. Available from: https://robjhyndman.com/hyndsight/tscv/
- [22].Makridakis S, Spiliotis E, Assimakopoulos V. Statistical and machine learning forecasting methods: concerns and ways forward. Plos One. 2018;13:e0194889. [DOI] [PMC free article] [PubMed] [Google Scholar]
- [23].Hyndman RJ, Khandakar Y. Automatic time series forecasting: the forecast package for R. J Stat Software. 2008;27:3. [Google Scholar]
- [24].Moritz S, Bartz-Beielstein T. imputeTS: time series missing value imputation in R. R J. 2017;9:207. [Google Scholar]
- [25].Core Team R. (2018). R: A language and environment for statistical computing. R foundation for statistical computing, Vienna, Austria. Cited [2019 Oct 29]. Available from: https://www.R-project.org/.
- [26].Zhou X, Ye J, Feng Y. Tuberculosis surveillance by analyzing google trends. IEEE Trans Biomed Eng. 2011;58:8. [DOI] [PubMed] [Google Scholar]
- [27].Kapitány-Fövény M, Ferenci T, Sulyok Z, et al. Can google trends data improve forecasting of lyme disease incidence? Zoonoses Public Health. 2019;66(1):101–107. [DOI] [PubMed] [Google Scholar]
- [28].Sulyok M, Richter H, Sulyok Z, et al. Predicting tick-borne encephalitis using google trends. Ticks Tick Borne Dis. 2019;101306. DOI: 10.1016/j.ttbdis.2019.101306 [DOI] [PubMed] [Google Scholar]
- [29].Teng Y, Bi D, Xie G, et al. Dynamic forecasting of zika epidemics using google trends. PloS One. 2017;12(1):e0165085. [DOI] [PMC free article] [PubMed] [Google Scholar]
- [30].Zhang Y, Milinovich G, Xu Z, et al. Monitoring pertussis infections using internet search queries. Sci Rep. 2017;7(1):10437. [DOI] [PMC free article] [PubMed] [Google Scholar]
- [31].Ugarte-Gil C, Alisjahbana B, Ronacher K, et al. Diabetes mellitus among pulmonary tuberculosis patients from 4 tuberculosis-endemic countries: the TANDEM study. Clin Infect Dis. 2019;ciz284. DOI: 10.1093/cid/ciz284 [DOI] [PubMed] [Google Scholar]
- [32].Al-Rifai RH, Pearson F, Critchley JA, et al. Association between diabetes mellitus and active tuberculosis: A systematic review and meta-analysis. Plos One. 2017;12(11):e0187967. [DOI] [PMC free article] [PubMed] [Google Scholar]
- [33].Baker MA, Lin -H-H, Chang H-Y, et al. The risk of tuberculosis disease among persons with diabetes mellitus: a prospective cohort study. Clinl Infect Dis. 2012;54(6):818–825. [DOI] [PubMed] [Google Scholar]
- [34].Cadena J, Rathinavelu S, Lopez-Alvarenga JC, et al. The re-emerging association between tuberculosis and diabetes: lessons from past centuries. Tuberculosis. 2019;116:S89–S97. [DOI] [PMC free article] [PubMed] [Google Scholar]
- [35].International Diabetes Federation . (2019). Diabetes Atlas 2019. Cited [2019 October29]. Available from: https://www.diabetesatlas.org/en/resources/
- [36].Baker MA, Harries AD, Jeon CY, et al. The impact of diabetes on tuberculosis treatment outcomes: a systematic review. BMC Med. 2011;9(1):81. [DOI] [PMC free article] [PubMed] [Google Scholar]
- [37].Lee M-R, Huang Y-P, Kuo Y-T, et al. Diabetes mellitus and latent tuberculosis infection: a systemic review and meta-analysis. Clinl Infect Dis. 2016;ciw836. DOI: 10.1093/cid/ciw836 [DOI] [Google Scholar]
- [38].Lönnroth K, Roglic G, Harries AD. Improving tuberculosis prevention and care through addressing the global diabetes epidemic: from evidence to policy and practice. Lancet Diabetes Endocrinol. 2014;2(9):730–739. [DOI] [PubMed] [Google Scholar]
- [39].Neiderud C-J . How urbanization affects the epidemiology of emerging infectious diseases. Infect Ecol Epidemiol. Sci Rep. 2015;5: DOI: 10.3402/iee.v5.27060. [DOI] [PMC free article] [PubMed] [Google Scholar]
- [40].Tkachenko N, Chotvijit S, Gupta N, et al. Google trends can improve surveillance of type 2 diabetes. Sci Rep. 2017;7(1):4993. [DOI] [PMC free article] [PubMed] [Google Scholar]
- [41].Alicino C, Bragazzi NL, Faccio V, et al. Assessing Ebola-related web search behaviour: insights and implications from an analytical study of google trends-based query volumes. Infect Dis Poverty. 2015;4:54. [DOI] [PMC free article] [PubMed] [Google Scholar]
- [42].Bragazzi NL, Mahroum N. Google trends predicts present and future plague cases during the Plague outbreak in Madagascar: infodemiological study. JMIR Public Health Surveill. 2019;5(1):e13142. [DOI] [PMC free article] [PubMed] [Google Scholar]
- [43].Gluskin RT, Johansson MA, Santillana M, et al. Evaluation of internet-based dengue query data: google Dengue trends. PLoS Negl Trop Dis. 2014;8(2):e2713. [DOI] [PMC free article] [PubMed] [Google Scholar]
- [44].Wang J, Zhang T, Lu Y, et al. Vesicular stomatitis forecasting based on google trends. PloS One. 2018;13(1):e0192141. [DOI] [PMC free article] [PubMed] [Google Scholar]
- [45].Yang S, Santillana M, Kou SC. Accurate estimation of influenza epidemics using google search data via ARGO. Proc Nat Acad Sci. 2015;112(47):14473–14478. [DOI] [PMC free article] [PubMed] [Google Scholar]
- [46].Ku -C-C, Dodd PJ. Forecasting the impact of population ageing on tuberculosis incidence. Plos One. 2019;14:e0222937. [DOI] [PMC free article] [PubMed] [Google Scholar]
Associated Data
This section collects any data citations, data availability statements, or supplementary materials included in this article.
Data Citations
- World Health Organization . (2019). Global tuberculosis report 2019. Cited [2019 October29]. Available from: https://www.who.int/tb/global-report-2019
- Hyndman RJ, Athanasopoulos G. (2014). Forecasting: principles and practice. Cited [2019 October29]. Available from: https://Otexts.com/fpp2/
- Hyndman RJ. (2016). Cross-validation for time series. Cited [2019 October29]. Available from: https://robjhyndman.com/hyndsight/tscv/
- Core Team R. (2018). R: A language and environment for statistical computing. R foundation for statistical computing, Vienna, Austria. Cited [2019 Oct 29]. Available from: https://www.R-project.org/.
- International Diabetes Federation . (2019). Diabetes Atlas 2019. Cited [2019 October29]. Available from: https://www.diabetesatlas.org/en/resources/
Supplementary Materials
Data Availability Statement
The script and the dataset are available online (https://github.com/msulyok/Google-Trends-Tuberculosis).