ABSTRACT
Exosomes, or small extracellular vesicles (sEVs), serve as intercellular messengers with key roles in normal and pathological processes. Our previous work had demonstrated that Dsg2 expression in squamous cell carcinoma (SCC) cells enhanced both sEV secretion and loading of pro-mitogenic cargo. In this study, using wild-type Dsg2 and a mutant form that is unable to be palmitoylated (Dsg2cacs), we investigated the mechanism by which Dsg2 modulates SCC tumour development and progression through sEVs. We demonstrate that palmitoylation was required for Dsg2 to regulate sub-cellular localisation of lipid raft and endosomal proteins necessary for sEV biogenesis. Pharmacological inhibition of the endosomal pathway abrogated Dsg2-mediated sEV release. In murine xenograft models, Dsg2-expressing cells generated larger xenograft tumours as compared to cells expressing GFP or Dsg2cacs. Co-treatment with sEVs derived from Dsg2-over-expressing cells increased xenograft size. Cytokine profiling revealed, Dsg2 enhanced both soluble and sEV-associated IL-8 and miRNA profiling revealed, Dsg2 down-regulated both cellular and sEV-loaded miR-146a. miR-146a targets IRAK1, a serine-threonine kinase involved in IL-8 signalling. Treatment with a miR-146a inhibitor up-regulated both IRAK1 and IL-8 expression. RNAseq analysis of HNSCC tumours revealed a correlation between Dsg2 and IL-8. Finally, elevated IL-8 plasma levels were detected in a subset of HNSCC patients who did not respond to immune checkpoint therapy, suggesting that these patients may benefit from prior anti-IL-8 treatment. In summary, these results suggest that intercellular communication through cell-cell adhesion, cytokine release and secretion of EVs are coordinated, and critical for tumour growth and development, and may serve as potential prognostic markers to inform treatment options.
Abbreviations
Basal cell carcinomas, BCC; Betacellulin, BTC; 2-bromopalmitate, 2-Bromo; Cluster of differentiation, CD; Cytochrome c oxidase IV, COX IV; Desmoglein 2, Dsg2; Early endosome antigen 1, EEA1; Epidermal growth factor receptor substrate 15, EPS15; Extracellular vesicle, EV; Flotillin 1, Flot1; Glyceraldehyde-3-phosphate dehydrogenase, GAPH; Green fluorescent protein, GFP; Head and neck squamous cell carcinoma, HNSCC; Interleukin-1 receptor-associated kinase 1, IRAK1; Interleukin 8, IL-8; Large EV, lEV; MicroRNA, miR; Palmitoylacyltransferase, PAT; Ras-related protein 7 Rab7; Small EV, sEV; Squamous cell carcinoma, SCC; Tissue inhibitor of metalloproteinases, TIMP; Tumour microenvironment, TME
KEYWORDS: Desmoglein, extracellular vesicles, interleukin, palmitoylation, carcinomas, xenograft
Introduction
The coordinated response of cell-to-cell and cell-to-microenvironment communication plays a critical role in biological processes including embryogenesis, maintenance of homoeostasis and pathological conditions [1]. During tumorigenesis, autocrine as well as paracrine signals from cancer cells enable growth, angiogenesis and metastasis. The three major forms of intercellular communication include direct cell-cell contacts, secretion of soluble regulatory factors such as cytokines, and the recently discovered release of specialised membranous extracellular vesicles (EVs) [2]. However, whether these modes of communication are interconnected is far more complex than previously understood. It is well established that cytokines, EVs and cell surface presentation of adhesion proteins play a role in tumorigenesis but how they modulate, in context of each other, is not known.
Desmoglein 2 (Dsg2) is a transmembrane component of desmosomal cell-cell adhesion structures, which provides tensile strength by linking the transmembrane adhesive components to the intermediate cytoskeletal keratin filaments [3]. Mutations in the human Dsg2 gene underlie some arrhythmogenic right ventricular cardiomyopathies [4]. Interestingly, in human pluripotent stem cells, Dsg2 is critical for self-renewal, embryonic body and teratoma formation, and mediates the epithelial-to-mesenchymal transition through a β-catenin/Slug pathway [5]. In mice, ablation of the Dsg2 gene results in loss of the trophectoderm layer in blastocysts and triggers embryonic lethality without affecting cell-cell adhesion [6]. Dsg2 is highly expressed in malignant epithelial cell lines and in the two most common skin cancers, basal cell carcinomas (BCCs) and SCCs [7,8]. Furthermore, Dsg2 promotes vasculogenic mimicry to increase tumour blood supply and is associated with poor prognosis in malignant melanoma [9,10]. Over-expression of Dsg2 also occurs in prostate and colon cancers, suggesting a role for Dsg2 in oncogenesis in a variety of epithelial-derived tumours [11]. In vitro, Dsg2 can activate multiple growth and survival signalling pathways, and enhances epithelial cell proliferation and migration [12,13]. Knockdown of Dsg2 in colonic epithelial carcinoma cells decreases proliferation and suppresses xenograft tumour growth in mice [14]. We have demonstrated that forced expression of Dsg2 in the epidermis of transgenic mice promotes epidermal hyperplasia and increases susceptibility to tumour development [12]. Furthermore, these transgenic mice provide several lines of evidence supporting a paracrine signalling role of Dsg2 including enhanced proliferation in a different cell compartment and activation of hedgehog signalling in the dermis [8,12]. Through Stat3, Dsg2 up-regulates Gli1 and Ptch1, target genes of the Hh signalling pathway and compound Dsg2/Ptc1+/lacZ mice have accelerated development of BCCs and SCCs and tumorigenesis in response to chemical carcinogens [8,15].
We recently demonstrated that Dsg2 regulates sEV biogenesis, increases their mitogenic content including EGFR and c-Src, and enhances their pro-proliferative effects on dermal fibroblasts [13]. EVs are secreted by virtually every cell type and are stratified by their size or their mechanism of biogenesis [16]. They are a diverse population, including sEVs such as exosomes (30–150 nm), and large EVs (lEVs) such as microvesicles (0.1–1 µm), apoptotic bodies (1–5 µm) and oncosomes (1–10 µm). These vesicles may contain various RNA species, DNA, proteins and lipid cargo that can be taken up by distant cell types and alter the phenotype of these recipients [17]. sEVs are becoming increasingly associated as impactful contributors to intercellular signalling systems that likely play a crucial role in tumorigenesis and metastasis via alteration of the tumour microenvironment (TME) [18]. One of the critical factors transported via sEVs that modulate these processes are microRNA (miRNAs). miRNAs are post-transcriptional regulators of protein translation that alter both pro- and anti-oncogenic pathways [19]. Understanding the complement of miRNA present in tumour-derived EVs, and their downstream targets, is crucial for the progression of our understanding of the TME and the development of novel therapeutic options.
In this study, we show that Dsg2 modulates sEV biogenesis in a palmitoylation-dependent manner by altering the sub-cellular localisation of proteins associated with membrane rafts and the endosomal processing pathway. The pro-oncogenic effect and tumorigenicity of Dsg2 correlate with sEV levels. Furthermore, we show that sEVs released in response to Dsg2 are enriched in cytokines, most notably the pro-chemotactic and -angiogenic factors, IL-8. Interestingly, in both cells and sEVs, RNAseq detected down-regulation of miR-146a in response to Dsg2, which has been shown to target IRAK1, possibly explaining this increase in IL-8 in SCC cells in response to Dsg2.
Materials and methods
Antibodies
Antibodies used for Western blotting: 6D8 Dsg2 (1:100); 10D2 Dsg2 (1:100); from Invitrogen (Carlsbad, CA), cluster of differentiation 63 (CD63; 1:1000), interleukin 8 (IL-8; 1:500); from Cell Signalling Technology (Danvers, MA), early endosome antigen 1 (EEA1; 1:1000), epidermal growth factor receptor substrate 15 (EPS15; 1:1000), flotillin 1 (Flot1; 1:1000), green fluorescent protein (GFP; 1:1000), cytochrome c oxidase IV (COX IV; 1:1000), glyceraldehyde-3-phosphate dehydrogenase, (GAPDH; 1:3000); from Santa Cruz Biotechnology (Santa Cruz, CA), CD9 (1:500); from LI-COR Biosciences (Lincoln, NE), goat anti-rabbit or -mouse Odyssey 800 (1:15,000) and 680 (1:20,000). Antibodies used for immunofluorescence: 10D2 Dsg2 (1:2); Flot1 (1:100); EEA1 (1:200); EPS15 (1:200); Rab7 (1:250, Cell Signalling Technology); from Molecular Probes (Eugene, OR), goat anti-rabbit and -mouse Alexa Fluor 488 and 594 (1:400).
Generation of Dsg2 mutant cell lines
The stop codon of the human Dsg2 cDNA was removed and sub-cloned into vector pEGFP-N1 (Clontech, Mountain View, CA) upstream of the GFP as previously described in detail [13,20,21]. For Dsg2cacs cDNA, two cysteine point mutations were generated using the QuikChange site directed mutagenesis kit (Stratagene, San Diego, CA) [20]. The mutated cDNAs were then sub-cloned into the retroviral expression vector LZRS-ms-neo and transfected into Phoenix cells to package retroviral particles. Human A431 (epidermoid skin carcinoma) or UM-SCC1 (oral SCC) cells were selected in medium containing G418 (500 µg/mL) after retroviral transduction. While these SCC cell lines express some endogenous levels of Dsg2, forced expression of higher levels of wild-type or mutant Dsg2 was possible using transfection of retrovirus expression constructs.
Cell culture
Cell lines were plated at 3 × 10⁶ cells per 100 mm dish in complete DMEM containing 10% FBS (Peak Serum, Fort Collins, CO) and P/S (Thermo Fisher, Waltham, MA) as previously described [13]. At 80% confluency, cells were cultivated in serum free media for 48 h. The conditioned media was then collected for EV purification. Cells were trypsinised and counted (Haemocytometer, Thermo Fisher). For drug treatment, cells were treated with 2-Bromopalmitate (50 µM, Sigma, St. Louis, MO), GW4869 (10 µM, Cayman Chemical, Ann Arbour) or Bafilomycin A1 (0.02 µM, Cayman Chemical) for 48 h in serum free medium and conditioned medium was collected for EV isolation and analysis.
Immunofluorescence
Cells grown on glass slides were washed in cold PBS, fixed in 4% PFA (Electron Microscopy Sciences, Hatfield, PA) for 15 min at room temperature (RT) and then permeabilised with 1% TX-100 in PBS for 5 min at RT. Cells were blocked in 5% normal goat serum (NGS), 0.1 M glycine, 0.02% TX-100 in PBS for 1 h at RT and incubated in 1° Ab in blocking buffer at 4°C overnight. Cells were washed in PBS and incubated in 2° Ab in blocking buffer for 1 h at RT. Following secondary incubation, cells were washed again in PBS and then incubated with DAPI (1:1000, Sigma) in PBS for 5 min. Cells were washed in PBS and mounted in Fluoromount-G (Southern Biotech, Birmingham, AL), and images were captured by A1R + Nikon confocal microscopy (Melville, NY).
Western blotting analysis
For Western blotting, cells were washed in ice-cold PBS and lysed with lysis buffer (10 mM Tris pH 7.5, 150 mM NaCl, 0.5 mM EDTA, 0.1% SDS, 1% deoxycholate, 1% TX-100) supplemented with PMSF (1 µM), protease inhibitor cocktail (Thermo Fisher) and phosphatase inhibitor cocktail (Thermo Fisher) and heated to 95°C for 10 min in Laemmli buffer. Proteins were resolved over SDS-PAGE (Bio-Rad Labs, Hercules, CA) and transferred to nitrocellulose membrane. Non-specific sites were blocked with blocking buffer (5% BSA in TBS) and incubated in primary antibodies in blocking buffer (5% BSA in TBST (TBS + 1% TX-100)) overnight at 4°C. Membranes were washed in TBST and incubated with secondary antibody in blocking buffer for 1 h. Infrared bands were visualised by LI-COR Odyssey imaging system (LI-COR Biosciences, Lincoln, NE).
Extracellular vesicle purification
EV purification was performed using sequential ultracentrifugation protocol [22]. Conditioned medium was collected and subjected to serial centrifugation at 300 × g (10 min), 16,000 × g (30 min), and then 120,000 × g (70 min; Ti45 rotor). The supernatant was aspirated and the sEV pellet washed 1× with ice-cold PBS, re-suspended in PBS and stored in −20°C. For iodixanol purification, the 120,000 × g pellet containing sEVs and co-contaminates was added to a 40% iodixanol solution, which was used as the bottom fraction of a 40%/30%/5% density gradient. Samples were centrifuged at 120,000 × g (Sorvall TH 641) O/N and 1 mL fractions were collected from the top for analysis.
Trypsin digestion
sEVs were incubated at 37°C for 20 min with 0.04% trypsin (Corning, Corning, NY) in a final volume of 12 µL. The reaction was stopped by heat inactivation in Laemmli buffer and samples were prepared for Western blotting.
Nanoparticle tracking analysis
EVs were analysed using the NanoSight NS300 (Malvern Instrument, Westborough, MA) for size, shape and concentration. NanoSight employs laser illumination to provoke light scattering and video capture of Brownian motion to determine the size distribution and concentration of particles in solution. EVs (diluted 1:250; ~107–109 particles/mL) were injected with a syringe pump (infuse = 20, Malvern Instrument) and recorded (3 × 30-second captures) to determine the mean size and concentration of nanoparticles in each sample.
Transfection with miR-146a mimic and inhibitor
SCC A431 cells were seeded into six well plates at 2 × 10⁵ cells per well in DMEM containing 10% FBS and cultured until 80% confluent. Cells were then cultivated in serum free media for 12 h. MISSION negative control miRNA (#HMC0002; Sigma-Aldrich), miR-146a-5p mimic (#HMI0228; Sigma-Aldrich) or miR-146a-5p inhibitor (#HSTUD0228; Sigma-Aldrich) were transfected into six wells for each cell line using Lipofectamine 2000 (Thermo Fisher) according to the manufacturer protocol. After 24 h, media was removed from cultures and cells were washed with ice-cold PBS. Triplicate wells of each treatment condition were lysed in either Trizol for total RNA isolation or RIPA buffer for cellular protein isolation and stored at −80°C for further analysis.
Tumour xenograft
A431 or UM-SCC1 cells over-expressing GFP, Dsg2/GFP or Dsg2cacs/GFP were established as described previously [20]. Cells were trypsinised and re-suspended in DMEM (1 × 10⁷ cells/mL) and injected (100 µL) subcutaneously into the flanks of Balb/c SCID mice (8–9 weeks of age). For sEV treatments, 20 µg of sEVs were injected at the time of tumour implantation. Tumour length and width were measured by caliper on a twice-weekly schedule beginning 7 days post-injection. Mice were also weighed to monitor general health. Experiments were to be terminated at 28 days post-injection, except where excessive tumour burden and decline in animal health necessitated termination at earlier time points. Animals were sacrificed, and the tumour tissue was collected and fixed in OCT or formalin for histology or immunohistochemistry. Note: all experiments conformed to the Thomas Jefferson University IACUC protocols and approval.
Murine blood plasma EV
Mice were sacrificed and blood collected by cardiac puncture with a 1 mL syringe coated with 0.5 M EDTA. Blood was then centrifuged at 2000 RPM for 20 min and plasma was further centrifuged at maximum speed for 10 min. EVs were purified using IZON Science LTD’s (Medford, MA) size exclusion chromatography columns according to the manufacturer’s protocol. The purified samples were collected in five 200 µL fractions and analysed using nanoparticle tracking analysis.
RNAseq
For miRNAseq, total RNA was harvested from A431 and A431-Dsg2/GFP cells and sEVs using the miRNeasy Kit according to manufacturer’s instruction (Qiagen, Germantown, MD). RNA quality (RIN) determination and sequencing was performed by Avera Health (Sioux Falls, SD). Reads were aligned to the Genome Reference Consortium Human Build 37 (GRCh37), and the expression values were calculated and analysed by Partek Genomics Suite (http://www.partek.com). miRNAs with expression of RPKM ≥ 1 were considered for further analysis. Analysis of variance (ANOVA) was performed between all cell lines. Heatmaps were created using Morpheus, https://software.broadinstitute.org/morpheus.
For gene expression in HNSCC tumour tissues, total RNA was isolated from HNSCC tumour tissues using RNeasy kits (Qiagen) and libraries were prepared using TruSeq Stranded Total RNA kit (Illumina, San Diego, CA) following manufacturer’s instructions. The final libraries were sequenced on NextSeq 500 using 75bp paired-end chemistry. Sequencing reads were aligned with the reference genome of Homo sapiens Ensembl Version GRCh38 and using information from the gene transfer format (.gtf) annotation from GENCODE version GRCh38.p12 using RSEM [23]. Using RSEM’s calculate-expression function, total read counts and normalised transcripts per million (TPM) were obtained. Batch effects or sample heterogeneity was tested before differential expression, using iSeqQC [24]. The DESeq2 package [25] in R/Bioconductor was used to analyse differential gene expression. Scatter plot analysis was used to assess the correlation of IL-8 and Dsg2 expression, and R2 value provided to measure goodness-of-fit.
Real-time PCR
For qPCR, total RNA was collected from cells and sEVs with the miRNeasy RNA Isolation Kit-Cell & Plant (Exiqon, VedBaek, Denmark) according to manufacturer’s protocol. cDNA construction of total RNA, including mature miRNAs, was performed with the Universal cDNA Synthesis Kit II (Exiqon) according to manufacturer’s suggestion employing 10 ng of cellular or EV RNA. qPCR was performed with ExiLENT SYBR Green Master Mix (Exiqon) on the ABI Prism 7900HT Sequence Detection System (Applied Biosystems, Foster City, CA). For mRNAs: IL-8 forward (5ʹ-GTG CAG TTT TGC CAA GGA GT-3ʹ); IL-8 reverse (5ʹ-TTA TGA ATT CTC AGC CCT CTT CAA AAA CTT CTC-3ʹ); IRAK1 forward (5ʹ-TCA-GCT-TTG-GGG-TGG-TAG-TG-3ʹ); IRAK1 reverse (5ʹ-TAG-ATC-TGC-ATG-GCG-ATG-GG-3ʹ); GAPDH forward (5ʹ-GGT GTG AAC CAT GAG AAG TAT G-3ʹ); GAPDH reverse (5ʹ-GAG TCC TTC CAC GAT ACC AAA G-3ʹ).
Cytokine antibody array
A431-GFP and -Dsg2/GFP cells were grown to confluency in 10 cm2 tissue culture dishes and then incubated in serum-free medium for 48 h. Large and sEVs were isolated from conditioned medium by sequential ultracentrifugation and used to analyse a panel of 120 cytokines and chemokines (C-series Human Cytokine Antibody Array C1000, AAH-CYT-1000-2; Raybiotech, Norcross, GA) according to manufacturer’s protocol. The quantification of dot intensity was performed in ImageJ following background subtraction, and the raw data normalised to the array-specific positive control dots.
HNSCC patients’ plasma IL-8
Blood samples were collected from patients with HNSCCs enrolled in a window of opportunity trial of Nivolumab and Tadalafil (NCT03238365) at Thomas Jefferson University Hospital approved by the Thomas Jefferson University Institutional Review Board. Blood was collected in EDTA collection tubes at baseline and surgery. Plasma was isolated following centrifugation at 300 × g for 20 min and was stored at −80°C. MILLIPLEX MAP Human Cytokine/Chemokine Magnetic Bead Panels (Millipore) were used to identify cytokines present in plasma collected from HNSCC patients. Samples were analysed in triplicate by a FlexMAP 3D (Luminex) and standard curves were generated for each cytokine and median fluorescent intensities were transformed into concentrations by five-point, non-linear regression. Treatment effects were assessed by a pathologist. Patients whose tumours exhibited > 20% pathologic treatment effect at the primary site were deemed responders (N = 10) and those with 20% > were labelled non-responders (N = 18).
Statistics
Results are mean ± SEM of at least three independent experiments performed in triplicates. Two-tailed Student’s t test was performed where needed. A mixed model analysis was carried out using Prism and either Tukey’s post hoc or Dunnett’s post hoc tests where appropriate for repeated measures ANOVA. P ≤ 0.05*; P ≤ 0.01**; P ≤ 0.001***.
Results
Characterisation of EVs
To study EVs, we adopted the standard isolation protocol using sequential ultracentrifugation to remove live cells and apoptotic bodies and to purify lEVs and sEVs from A431 SCC cells (Figure 1(a)). EVs were characterised by nanoparticle tracking analysis (NTA) showing significantly overlapping sized particles in both lEV and sEV preparations (Figure 1(b)). Focusing on sEVs, electron micrographs revealed intact vesicles from approximately 30 nm (left panel) to 100 nm (right panel) in diameter (Figure 1(c)). Western blotting analysis confirmed the enrichment of the tetraspanins CD63 and CD9 and the lipid raft protein Flot1 in sEVs as compared to total cell lysates (Figure 1(d)) [21]. The mitochondrial protein COX IV was completely absent from sEVs indicating an absence of cellular contaminants. These results confirmed previous findings that sequential ultracentrifugation is a viable method to isolate sEVs from SCC cells [21,26]
Figure 1.
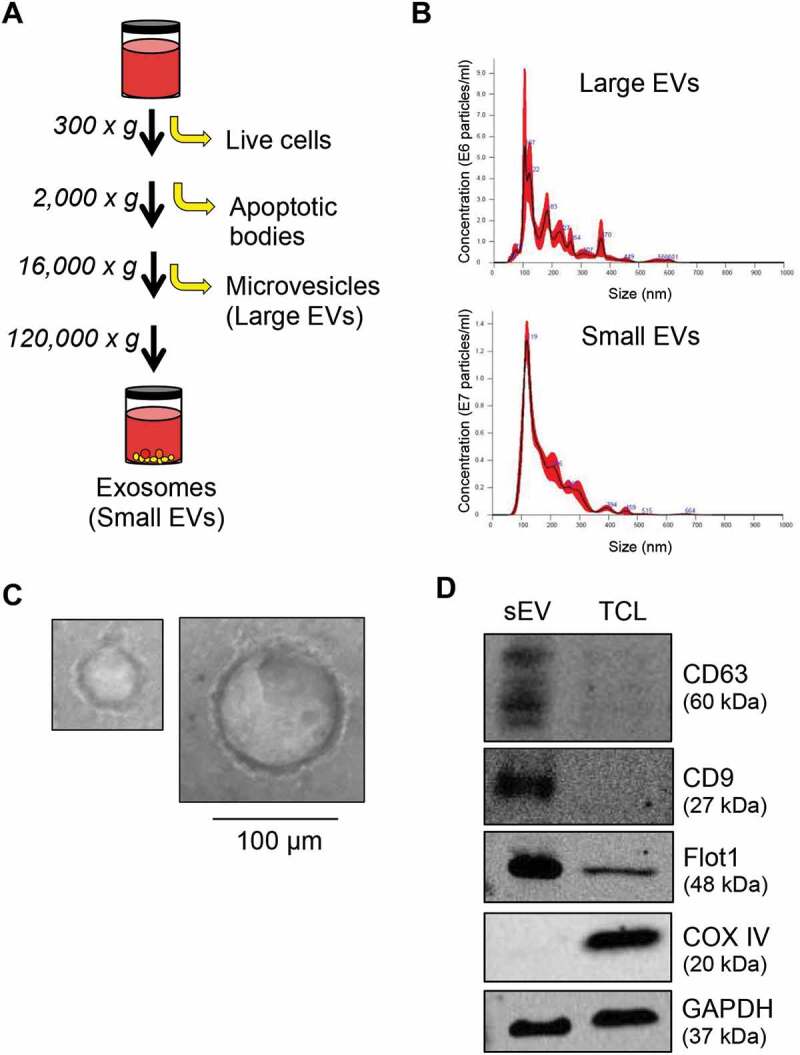
Characterisation of EVs by sequential ultracentrifugation. (A) Schematic diagram of the serial centrifugation steps used to isolate large and sEVs. (B) Dynamic light scattering measurement by nanoparticle tracking analysis (NTA) of EVs isolated from A431 SCC cells illustrating the concentration and size of particles present. (C) SEVs were loaded on a formvar carbon-coated EM mesh grid and imaged on a transmission electron microscope showing vesicles ranging in size from approximately 30 nm (left) to 100 nm (right). Scale bar, 100 µm. (D) Proteins from sEVs and total cell lysates (TLC) of A431 cells were resolved over SDS-PAGE and immunoblotted for the tetraspanin markers (CD63 and CD9), lipid raft-associated protein (Flot1), mitochondrial protein (COXIV) and GAPDH for equal loading.
Palmitoylation of Dsg2 modulates sEV release in SCC cells
Palmitoylation is a covalent attachment of the 16C-fatty acid, palmitate, to cysteine residues through thioester linkage, important for proper protein localisation, association with cellular membranes and lipid rafts, protein trafficking and desmosome assembly [20,27–30]. Disruption of palmitoylation has been implicated in several disease states including cancer and treatments that target palmitoylated proteins or palmitoylacyltransferases (PATs) have the potential therapeutic benefits [31]. We previously demonstrated that Dsg2 modulates EV release [21] and that palmitoylation of Dsg2 is critical for desmosome assembly, protein turnover and cell-cell adhesion [20]. However, whether palmitoylation of Dsg2 is necessary for EV release is unknown. Here we generated the cell lines stably expressing GFP and Dsg2/GFP by retroviral infection as previously described in detail [20] and confirmed that up-regulation of Dsg2 in SCC cells enhanced sEV release (Figure 2(e)). The effect of Dsg2 was abrogated when cells were treated with 50 µM 2-bromopalmitate, an irreversible inhibitor of PATs, which works through covalent attachment to the catalytic cysteine residue within the active site, thereby blocking the function of all cellular PATs (Figure 2(a)). These results suggest that protein palmitoylation plays a role in regulating sEV release. However, we could not rule out off-target effects on the other proteins critical for sEV biogenesis.
Figure 2.
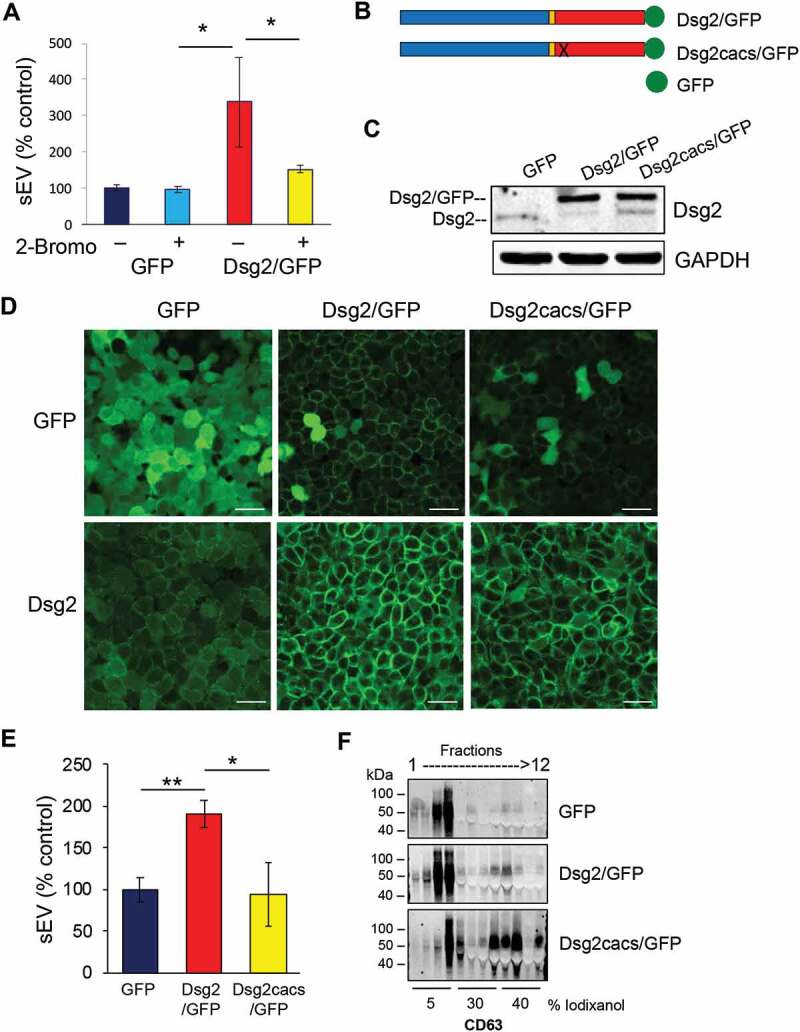
Loss of Dsg2 palmitoylation reduces EV release. (A) A431 SCC cells stably expressing GFP or Dsg2/GFP were treated with the vehicle control (DMSO) or 2-bromopalmitate (2-Bromo) (50 uM). After 18 h, conditioned medium was collected and sEVs isolated and counted by NTA. Values presented as percent control. GFP, 100 ± 7.9; GFP + 2-Bromo, 96.6 ± 8.6; Dsg2/GFP, 338.1 ± 123.7; Dsg2/GFP + 2-Bromo, 152.1 ± 10.7. N = 3. *P ≤ 0.05. (B) Schematic diagram showing the GFP, Dsg2/GFP and Dsg2cacs/GFP fusion constructs. Dsg2cacs/GFP contains the mutations C635A and C637S and was previously described to eliminate Dsg2’s palmitoylation [20]. (C) A431 SCC cells stably expressing GFP, Dsg2/GFP or Dsg2cacs/GFP as a palmitoylation deficient control. Cells were lysed and proteins resolved by SDS-PAGE and immunoblotted with antibodies against Dsg2 or GFP (endogenous Dsg2: lower 160 kD band; exogenous Dsg2/GFP or Dsg2cacs/GFP upper band: 190 kD). GAPDH for equal loading. (D) Immunofluorescence of A431-GFP, -Dsg2/GFP or -Dsg2cacs/GFP using antibodies against Dsg2 and GFP and imaged by confocal microscopy. Scale bar, 50 µm. (E) sEV production from A431 cells stably expressing GFP, Dsg2/GFP or Dsg2cacs/GFP. Values presented as percent control. GFP, 100 ± 14.7; Dsg2/GFP, 190.5 ± 16.0; Dsg2cacs/GFP, 94.9 ± 29.7. N = 17. *P ≤ 0.05; **P ≤ 0.01. (F) EVs isolated by ultracentrifugation were separated over iodixanol gradient and fractions collected and processed for Western blotting.
We recently identified the two cysteine residues (C635 and C637) in the juxtamembrane (intracellular anchor) domain of Dsg2 that, when mutated to alanine and serine (C635A/C637S; cacs), respectively, abrogates palmitoylation of Dsg2 [20]. Stable A431 SCC cell lines were generated over-expressing constructs of Dsg2 fused to monomeric enhanced GFP, Dsg2/GFP or Dsg2cacs/GFP (Figure 2(b)). Western blotting of total cell lysates showed the 160 kD endogenous Dsg2 protein in A431 cells expressing GFP (Figure 2(c)). An additional 190 kD band representing the Dsg2/GFP or Dsg2cacs/GFP fusion proteins was observed in those respective cells. Immunostaining for GFP confirmed cytoplasmic staining for GFP and cell-cell border staining for Dsg2/GFP and, to a lesser extent, Dsg2cacs/GFP (upper panels; Figure 2(d)). Anti-Dsg2 antibodies detected the endogenous Dsg2 in the GFP cells which was dramatically enhanced in Dsg2/GFP and Dsg2cacs/GFP cells (lower panels; Figure 2(d)). As anticipated, the Dsg2cacs/GFP cells displayed less distinct cell-cell border signals. The cytoplasmic GFP signal observed in the Dsg2/GFP or Dsg2cacs/GFP cells may result from cleavage of the GFP from Dsg2 or Dsg2cacs as the lower panels clearly show more Dsg2 and Dsg2cacs protein.
sEVs were collected from conditioned media of cells expressing GFP, Dsg2/GFP and Dsg2cacs/GFP and analysed by NTA showing the effect of Dsg2 on EV biogenesis was dramatically abrogated in cells expressing palmitoylation-deficient Dsg2cacs (Figure 2(e)). Willms et al. reported two different sub-populations of small EVs, low- and high-density, with distinct molecular composition and biological properties [32]. Here, by bottom-loading, density gradient separation we observed CD63 (sEV marker) predominantly in the low-density, 5% iodixanol fractions 3 and 4 (top and middle panels; Figure 2(f)). Loss of Dsg2 palmitoylation dramatically shifted CD63 into the high-density 30–40% iodixanol fractions 7–9 (lower panel; Figure 2(f)). These results suggest that palmitoylation of Dsg2 is essential for proper cargo loading into low-density sEVs and disturbing palmitoylation induces more high-density sEVs, while still reducing sEV biogenesis as a whole.
Dsg2 modulates sEV biogenesis through the endocytic pathway
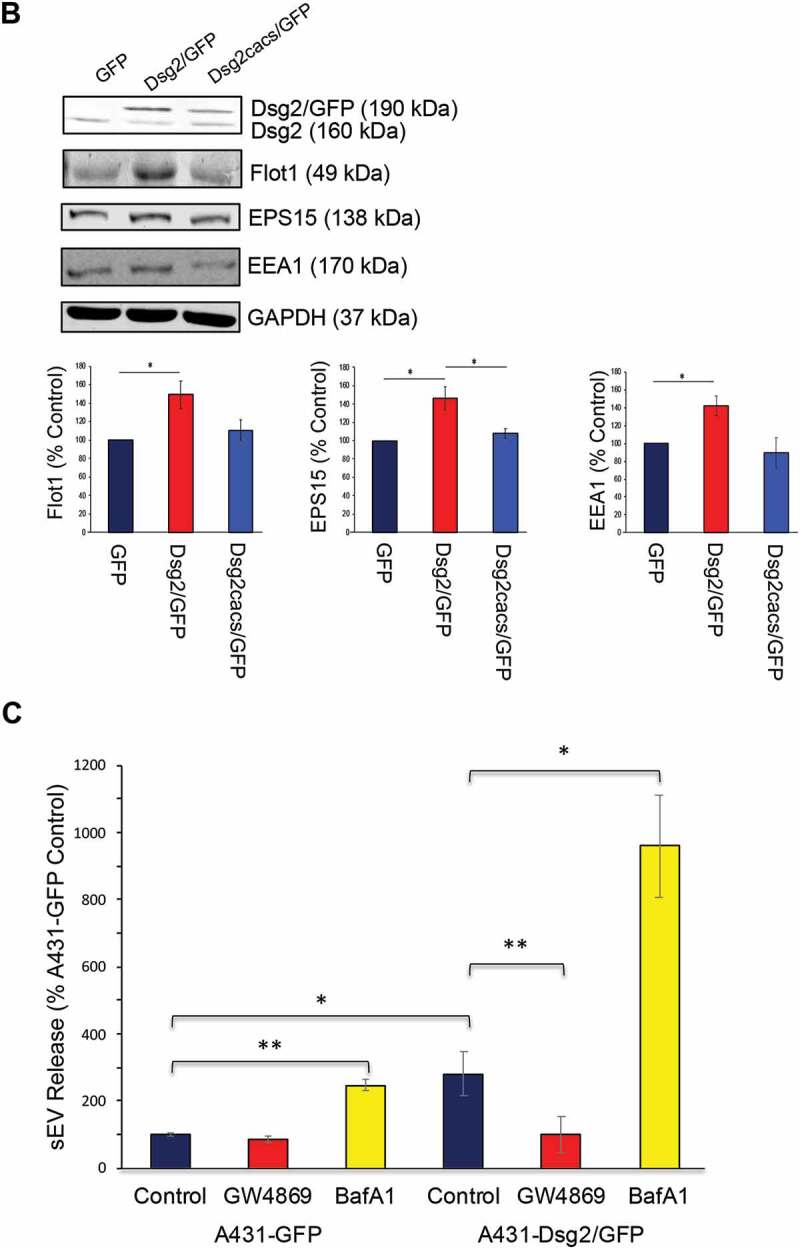
To further elucidate the mechanism by which Dsg2 promotes sEV release, we examined the effect of Dsg2 on the endocytic pathway. We first examined the effects of Dsg2 on Flot1, EPS15, EEA1 or Rab7. Flot1 is an integral membrane protein that forms discrete planar micro-domains in lipid rafts and is involved in endocytosis, signal transduction and the regulation of cytoskeletal elements [33]. Importantly, Flot1 localises to the plasma membrane and has been detected in early endosomes and EVs. Here, shown by immunofluorescence (Figure 3(a)) and immunoblotting (Figure 3(b)), Dsg2 increased not only the expression of Flot1 as shown in the graphs depicting quantitation of immunoblot band intensity, but also promoted membrane association. As previously mentioned, palmitoylation is important for proper protein localisation and association with cellular membranes and lipid rafts. As such, the loss of Dsg2 palmitoylation reduced the effect on Flot1 in Dsg2cacs/GFP expressing cells (Figure 3(a,b)) Similar results were observed with EPS15, a scaffolding adaptor protein associated with clathrin-coated pits, responsible for endocytosis of cargo from outside of the cell (Figure 3(a,b)). The effect of Dsg2 on EEA1, an early endosomal protein acting as a ligand for Rab5 binding to endocytic vesicles or Rab7, a late endosomal protein, was less pronounced (Figure 3(a,b)). It is important to appreciate the difference in Western blotting and immunofluorescence when interpreting this data. Immunofluorescence may have certain biases towards cell compartments such as the plasma membrane, while quantitation of Western blotting bands shows the total cellular levels. For this reason, the differential production of the endocytic markers is less apparent in the Western blot images in comparison to the immunofluorescence..
Figure 3.
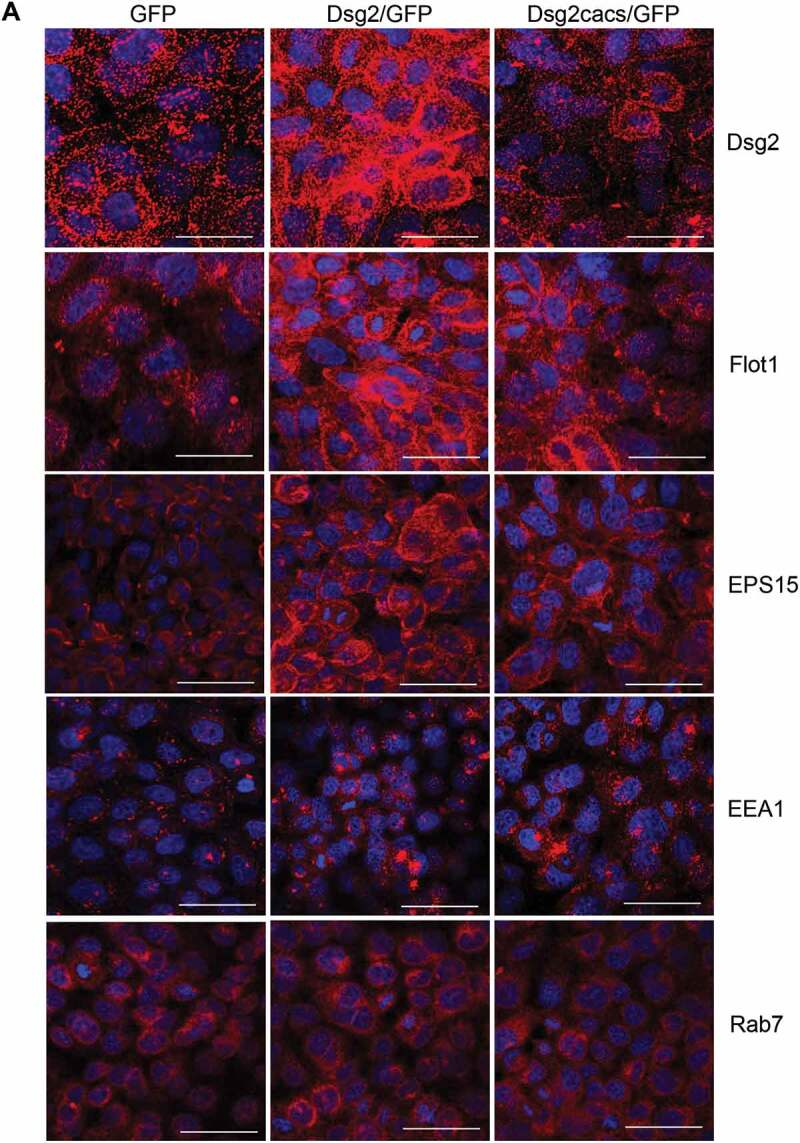
Dsg2 alters early endocytic pathways and endosomal trafficking. (A) A431 cells expressing GFP, Dsg2/GFP and Dsg2cacs/GFP were seeded, immunostained for Dsg2, Flot1, EPS15, EEA1 and Rab7 and then imaged by confocal microscopy. Note the sub-cellular localisation of Flot1, EPS15 and to some less extent EEA1 in the A431-Dsg2/GFP cells, which are reduced with the abrogation of Dsg2 function by the cacs mutation (A431-Dsg2cacs/GFP). Scale bar, 20 µm. *P ≤ 0.05. (B) Lysates of A431 cells expressing GFP, Dsg2/GFP or Dsg2cacs/GFP were resolved over SDS-PAGE and immunoblotted for Dsg2, endocytic pathway proteins (Flot1, EPS15, EEA1) and GAPDH. Western blot was quantified using ImageStudio and signals were normalised to the GFP cell line. N = 3. Flot1 (GFP, 100 ± 0.0; Dsg2/GFP, 148.9 ± 14.5; Dsg2cacs/GFP, 100.6 ± 11.0); EPS15 (GFP, 100 ± 0; Dsg2/GFP, 146.1 ± 12.5; Dsg2cacs/GFP, 108.2 ± 5.2); EEA1 (GFP, 100 ± 0; Dsg2/GFP, 142.3 ± 11.1; Dsg2cacs/GFP, 89.2 ± 17.1). (C) A431-GFP and A431-Dsg2/GFP cells were treated with GW489 and bafilomycin A1 for 48 h. sEVs were isolated and quantitated. A431-GFP (control, 100 ± 5.3; GW4869, 86.6 ± 10.8; BafA1, 247.1 ± 17.1); A431-Dsg2/GFP (control, 279.4 ± 65.5; GW4869, 99.9 ± 54.3; BafA1, 960.1 ± 153.0). N = 3. *P ≤ 0.05, **P ≤ 0.01.
Figure 3.
(continued)
To confirm that the endosomal pathway is involved in Dsg2-mediated sEV release, A431-GFP and A431-Dsg2/GFP cells were treated with the drug inhibitors GW4869 and Bafilomycin A1 (BafA1). sEVs were isolated and counted by NTA. GW4869 is a neutral sphingomyelinase inhibitor that blocks ceramide-mediated inward budding of multi-vesicular bodies (MVBs) and the fusion of MVBs to the plasma membrane to release sEVs. Here, GW4869 reduced sEV release (Figure 3(c)). BafA1, on the other hand, inhibits vacuolar-type proton ATPase (V-ATPase) preventing the acidification and fusion of the MVBs to the lysosomes and drives sEV release [34]. Treatment with BafA1 increased sEV release (Figure 3(c)). The effect was more dramatic with A431-Dsg2/GFP, as compared to A431-GFP cells. The results thus far suggest that Dsg2 modulates sEV release through membrane invagination and the endocytic pathway.
sEVs enhance SCC tumour development
To assess the effect of sEVs in xenograft tumour development, immunocompromised mice were injected subcutaneously with A431 cells over-expressing GFP, Dsg2/GFP or Dsg2cacs/GFP (Figure 4(a)). Over the course of 3–4 weeks, the Dsg2/GFP expressing cells developed significantly larger tumours than their GFP or Dsg2cacs/GFP expressing counterparts. Similar results were obtained using the head and neck SCC UM-SCC1 cells (Figure 4(b)). These findings suggest that Dsg2 enhanced tumour development in both cutaneous and head and neck SCCs. To rule out loss of Dsg2 expression in the non-palmitoylated Dsg2cacs/GFP cells, xenograft tissues were immunostained for GFP. We observed strong GFP signals in all xenografts demonstrating that the cells could maintain expression of the recombinant GFP or Dsg2 constructs throughout the duration of the experiment. Cytoplasmic staining was observed with A431-GFP xenografts while the A431-Dsg2/GFP xenografts showed distinct cell-cell border staining (Figure 4(c)). Similar to the in vitro results (Figure 2(c)), while the Dsg2cacs/GFP cells expressed high levels of the mutated Dsg2, the staining was less punctated at the cell border (Figure 4(c)). These results confirm that the cells retained their ability to express the transgene in vivo. Although we have observed increased proliferation in response to Dsg2 over-expression in vitro, the exact parameters allowing us to resolve the difference in growth rates between the cell lines were experimentally determined at very low cell densities (~5 × 10³ cells). Considering that our in vivo results are at densities ~3.5 orders of magnitude higher than these in vitro observations, we sought to explore other mechanisms to explain the difference in tumour growth.
Figure 4.
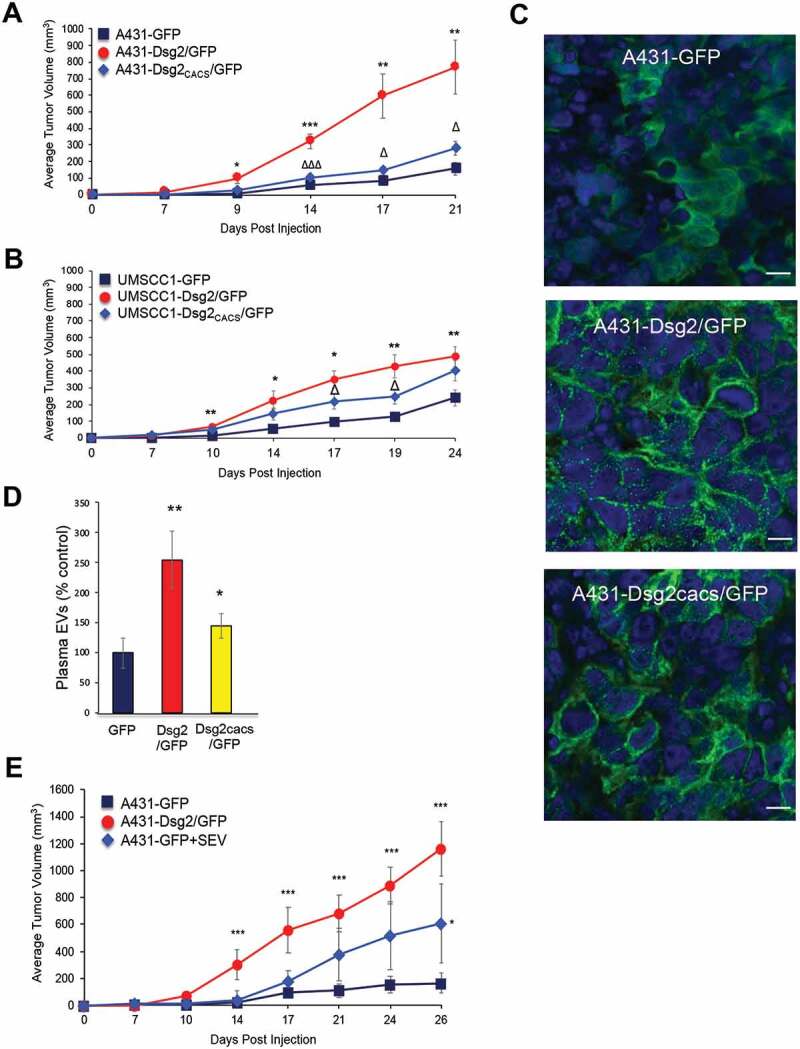
The pro-tumorigenic effect of Dsg2 is abrogated with loss of palmitoylation and rescued with EV treatment. (A) Immunocompromised Balb/c SCID mice were subcutaneously injected with 1 × 10⁶ of A431-GFP, -Dsg2/GFP or – Dsg2cacs/GFP cells. Tumour growth was measured, and average tumour volumes were calculated to determine the tumorigenicity for each cell line. N = 8, 13, 16, respectively. Tumour volume in mm3: Day 7 (GFP, 2.0 ± 1.4; Dsg2/GFP, 14.5 ± 4.8; Dsg2cacs/GFP, 2.2 ± 1.3); Day 9 (GFP, 7.5 ± 3.7; Dsg2/GFP, 96.3 ± 31.3; Dsg2cacs/GFP, 29.1 ± 9.4); Day 14 (GFP, 57.9 ± 19.0; Dsg2/GFP, 323.3 ± 45.3; Dsg2cacs/GFP, 104.4 ± 17.2); Day 17 (GFP, 81.3 ± 22.4; Dsg2/GFP, 596.2 ± 133.7; Dsg2cacs/GFP, 146.4 ± 25.8); Day 21 (GFP, 157.1 ± 39.8 Dsg2/GFP, 768.0 ± 162.5; Dsg2cacs/GFP, 279.5 ± 42.9). *, A431-Dsg2/GFP vs A431-GFP; Δ, A431-Dsg2/GFP vs A431-Dsg2cacs/GFP. (B) UM-SCC1 cells were used to establish lines over-expressing GFP, Dsg2/GFP or Dsg2cacs/GFP and injected subcutaneously in SCID mice to establish tumour xenografts in the flanks as described above. Tumour volume was measured weekly. Tumour volume in mm3: Day 7 (GFP, 4.1 ± 2.6; Dsg2/GFP, 16.4 ± 5.6; Dsg2cacs/GFP, 21.1 ± 5.5); Day 10 (GFP, 17.0 ± 3.9; Dsg2/GFP, 70.8 ± 11.6; Dsg2cacs/GFP, 47.7 ± 8.8); Day 14 (GFP, 56.8 ± 4.7; Dsg2/GFP, 227.4 ± 56.0; Dsg2cacs/GFP, 143.8 ± 34.9); Day 17 (GFP, 124.2 ± 25.0; Dsg2/GFP, 351.1 ± 53.6; Dsg2cacs/GFP, 224.1 ± 44.3); Day 19 (GFP, 147.1 ± 20.2; Dsg2/GFP, 429.1 ± 69.5; Dsg2cacs/GFP, 245.9 ± 43.9); Day 24 (GFP, 292.1 ± 56.0; Dsg2/GFP, 486.6 ± 59.0; Dsg2cacs/GFP, 410.6 ± 60.7). *, UM-SCC1-Dsg2/GFP vs UM-SCC1-GFP; Δ, UM-SCC1-Dsg2/GFP vs UM-SCC1-Dsg2cacs/GFP. N = 9, 16, 15, respectively. (C) Immunofluorescence of tumour sections derived from A431-GFP, -Dsg2/GFP and -Dsg2cacs/GFP xenografts in vivo showing sub-cellular localisation of Dsg2. Nuclei stained with DAPI (blue). Scale bar = 10 µm. (D) EVs were isolated by IZON size exclusion chromatography from blood plasma of mice in (A) and counted by NTA. Values presented as percent control. GFP, 100 ± 24.5; Dsg2/GFP, 255.1 ± 47.3; Dsg2cacs/GFP, 144.8 ± 20.5. *P ≤ 0.05; **P ≤ 0.01. (E) Immunocompromised Balb/c SCID mice were subcutaneously injected with 1 × 10⁶ of A431-GFP, A431-Dsg2/GFP or A431-GFP along with A431-Dsg2/GFP-derived sEVs. Tumour growth was measured, and average tumour volumes were calculated to determine the tumorigenicity of each cell line N = 5, 4, 7, respectively. Tumour volume in mm3: Day 7 (GFP, 2.4 ± 2.2; GFP + sEV, 11.4 ± 7.1; Dsg2/GFP, 11.4 ± 7.1); Day 10 (GFP, 6.4 ± 3.8; GFP + sEV, 11.4 ± 20.8; Dsg2/GFP, 69.4 ± 13.4); Day 14 (GFP, 19.1 ± 8.2; GFP+sEV, 40.3 ± 65.2; Dsg2/GFP, 303.8 ± 113.4); Day 17 (GFP, 96.2 ± 39.0; GFP+sEV, 181.7 ± 79.3; Dsg2/GFP, 558.0 ± 171.8); Day 21 (GFP, 109.9 ± 46.9; GFP+sEV, 377.5 ± 190.6; Dsg2/GFP, 683.1 ± 133.1); Day 24 (GFP152.7 ± 61.7; GFP+sEV, 516.0 ± 253.1; Dsg2/GFP, 891.2 ± 137.5); Day 26 (GFP, 165.0 ± 75.9; GFP + sEV, 608.2 ± 292.6; Dsg2/GFP, 1162.6 ± 201.5). *, A431-Dsg2/GFP vs A431-GFP; Δ, A431-Dsg2/GFP vs A431-Dsg2cacs/GFP; *P ≤ 0.05; **P ≤ 0.01.
Next, to assess whether the increased tumour volume correlates with sEV release, blood plasma was isolated from the xenografted mice upon the completion of experiments. sEVs were isolated by IZON qEV column chromatography according to the manufacturer’s instructions and sEVs counted by NTA. Similar to the in vitro findings in Figure 2(e), larger number of sEVs was detected in circulating plasma of mice carrying A431-Dsg2/GFP xenografts as compared to A431-GFP (Figure 4(d)). While the number of plasma sEVs in A431-Dsg2cacs/GFP mice was significantly higher than those with A431-GFP, it was significantly reduced compared to the A431-Dsg2/GFP (Figure 4(d)). To further demonstrate that the increase in tumour development is mediated through vesicles, sEVs were isolated from A431-Dsg2/GFP cells and co-injected with the A431-GFP cells in xenografts. Despite having been exposed to just a single dose of 20 µg sEVs, we observed a marked and significant increase in tumour size compared to the A431-GFP cells co-injected with a PBS volume control (Figure 4(e)). Thus far, the results suggest that Dsg2 enhances SCC tumour development possibly through sEV release and that a single dose of sEVs enhances the tumorigenic potential of the SCC cells.
Dsg2 enhances EV-bound cytokine release
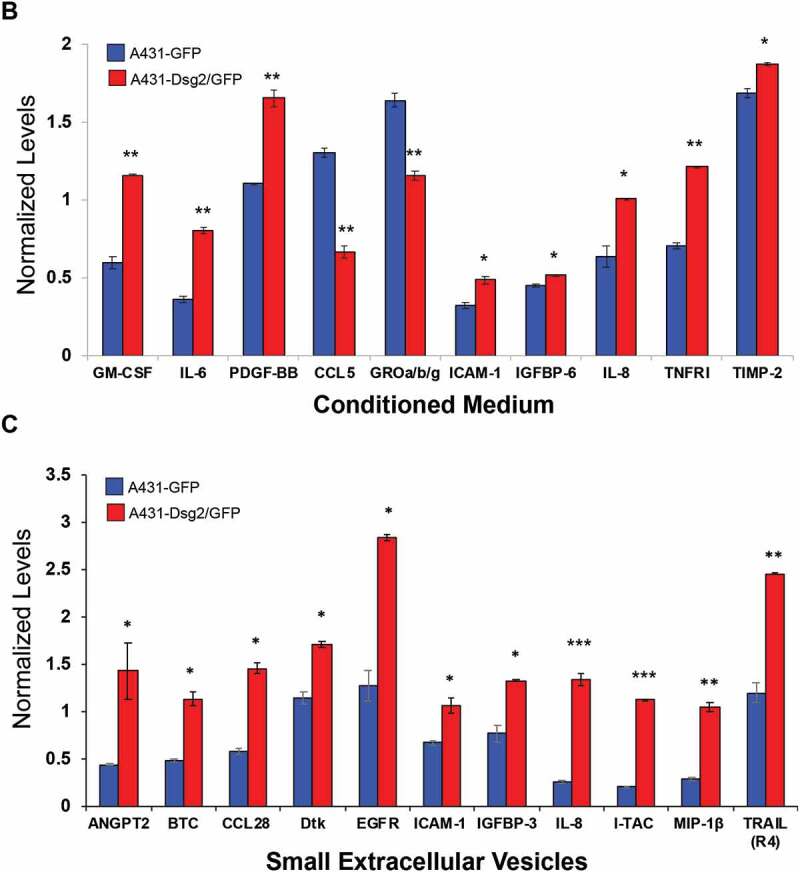
Cytokines are small molecular weight soluble factors with a wide range of biological functions and have been shown to play a critical role in tumour cell growth and progression, angiogenesis, and metastasis. To explore the alteration of cytokine release in response to Dsg2 expression and to elucidate the mechanism by which sEVs promote tumour development, we employed a human secretome antibody array using conditioned medium (contains all EVs), lEVs and sEVs isolated by ultracentrifugation from A431-GFP and A431-Dsg2/GFP cells (Figure 5(a)). Results were normalised to the array-specific negative (black boxes) and positive (blue boxes) control signal and plotted (Figure 5(b,c)). In response to Dsg2, the secretion of eight cytokines was up-regulated while two were down-regulated in the conditioned medium (Figure 5(b) and Table 1). No major changes in cytokines were observed in lEVs. However, in sEVs 11 cytokines were enhanced in response Dsg2 (Figure 5(c) and Table 2). EGFR as well as the ligand betacellulin (BTC) were markedly enriched in sEVs but not in the conditioned medium. On the other hand, the tissue inhibitor metalloproteinases 1 and 2 (TIMP1 and 2), highly involved in most cancers, were found at high levels in the control cells and TIMP2 was slightly enriched in the conditioned medium in response to Dsg2 (Figure 5(b,c)). However, both TIMP1 and 2 were significantly reduced in the sEV samples as compared to the conditioned medium (Figure 5(b,c)). Interestingly IL-8, a potent angiogenic and chemotactic factor known to play a role in tumour development and immune recruitment [35], was enriched in sEVs. These results suggest a mechanism of active sorting into sEVs, which served as our reasoning to pursue this further as a possible mechanism.
Figure 5.
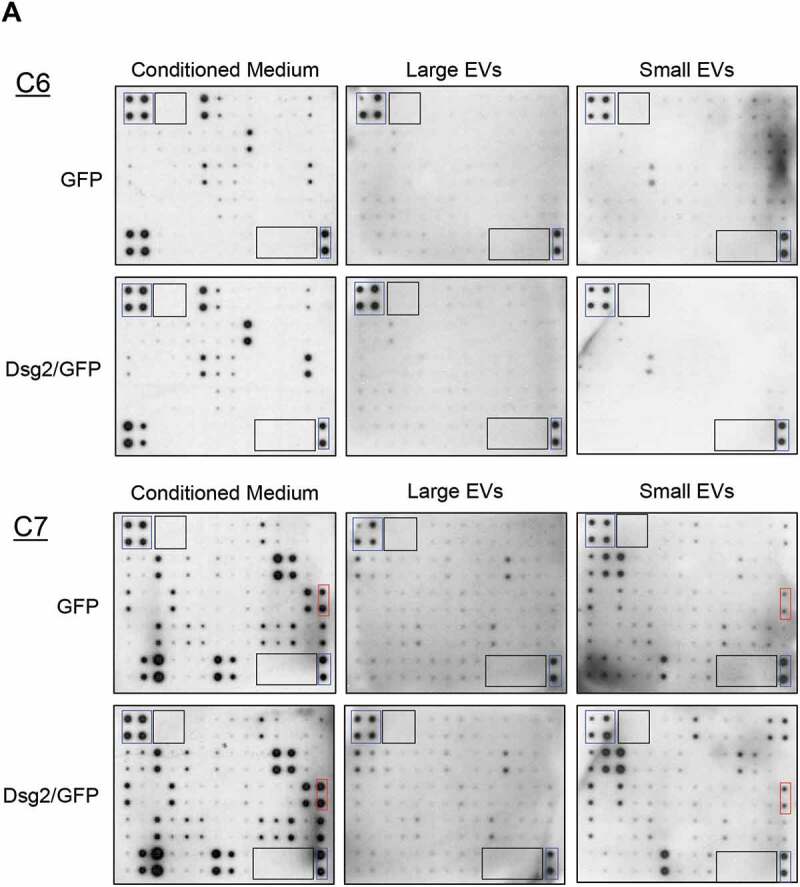
Dsg2 enhances the release of the pro-inflammatory cytokine IL-8 through EVs. (A) Human cytokine antibody array C6 and C7 were assayed with conditioned medium, large or sEVs harvested from A431-GFP and A431-Dsg2/GFP cells and processed according to the manufacturer’s protocol. Blue boxes, positive controls; black boxes, negative controls; red boxes, IL-8 signals. [(B) and (C)] Densitometry was performed on each cytokine by ImageJ software. Histogram bars represent the relative intensity value of each cytokine altered in response to Dsg2 (blue: A431-GFP; red: A431-Dsg2/GFP) from conditioned medium (B) or sEVs (C). Data were normalised to on-membrane positive control and depicted as relative abundance in samples ± SEM. N = 2.
Figure 5.
(countiued)
Table 1.
Changes in cytokines secreted by squamous carcinoma cells in response to Dsg2.
| Conditioned medium | |||
|---|---|---|---|
| Array protein | Class | Fold change | P value |
| IL-6 | Chemoattractant | 2.22 | 4.2E-3 |
| GM-CSF | Growth factor | 1.95 | 5.2E-3 |
| ICAM-1 | Adhesion molecule | 1.74 | 3.6E-2 |
| IGFBP-6 | Growth factor | 1.67 | 1.8E-2 |
| IL-8 | Chemoattractant | 1.57 | 3.3E-2 |
| PDGF-BB | Growth factor | 1.49 | 9.5E-3 |
| TNFRI | Cell surface receptor | 1.30 | 1.5E-3 |
| TIMP2 | Metalloproteinase inhibitor | 1.11 | 2.3E-2 |
| GROa/b/g | Chemoattractant | 0.76 | 1.2E-2 |
| CCL5 | Chemoattractant | 0.51 | 5.6E-3 |
Table 2.
Changes in cytokines associated with small extracellular vesicles secreted by squamous carcinoma cells in response to Dsg2.
| Small extracellular vesicles | |||
|---|---|---|---|
| Array protein | Class | Fold change | P value |
| I-TAC | Chemoattractant | 5.46 | 4.3E-4 |
| IL-8 | Chemoattractant | 5.36 | 8.3E-3 |
| MIP-1B | Chemoattractant | 3.56 | 9.6E-3 |
| ANGPT2 | Growth factor | 2.80 | 1.4E-2 |
| CCL28 | Chemoattractant | 2.52 | 1.1E-2 |
| BTC | Growth factor | 2.31 | 2.4E-2 |
| EGFR | Growth factor receptor | 2.22 | 2.2E-2 |
| TRAIL (R4) | TRAIL-binding protein | 2.05 | 4.2E-2 |
| IGFBP-3 | Growth factor | 1.73 | 1.3E-2 |
| Dtk | Receptor tyrosine kinase | 1.49 | 3.8E-2 |
| ICAM-1 | Adhesion molecule | 1.59 | 4.4E-2 |
To further confirm that IL-8 was present specifically in sEVs and not contaminant particles or protein aggregates, A431-Dsg2/GFP sEVs from ultracentrifugation were resolved over an iodixanol gradient to remove aggregate contaminants (Figure 6(a)). Proteins from the CD63 enriched fraction (*, Figure 6(a)) were harvested and incubated with the cytokine array to confirm the presence of IL-8. Recent evidence supports the presence of several cytokines including IL-8 on the surface of EVs, and therefore able to activate its receptors on recipient cells [36]. Here, to determine whether IL-8 was present on the surface of sEVs, iodixanol purified samples from fraction 4 (*, Figure 6(a)) were treated with trypsin, which degraded the surface IL-8 while maintaining EV integrity suggesting its location to be on the outside of the vesicles (Figure 6(c)). This is as opposed to GAPDH level, which was largely unchanged due to its localisation to the inside of sEVs.
Figure 6.
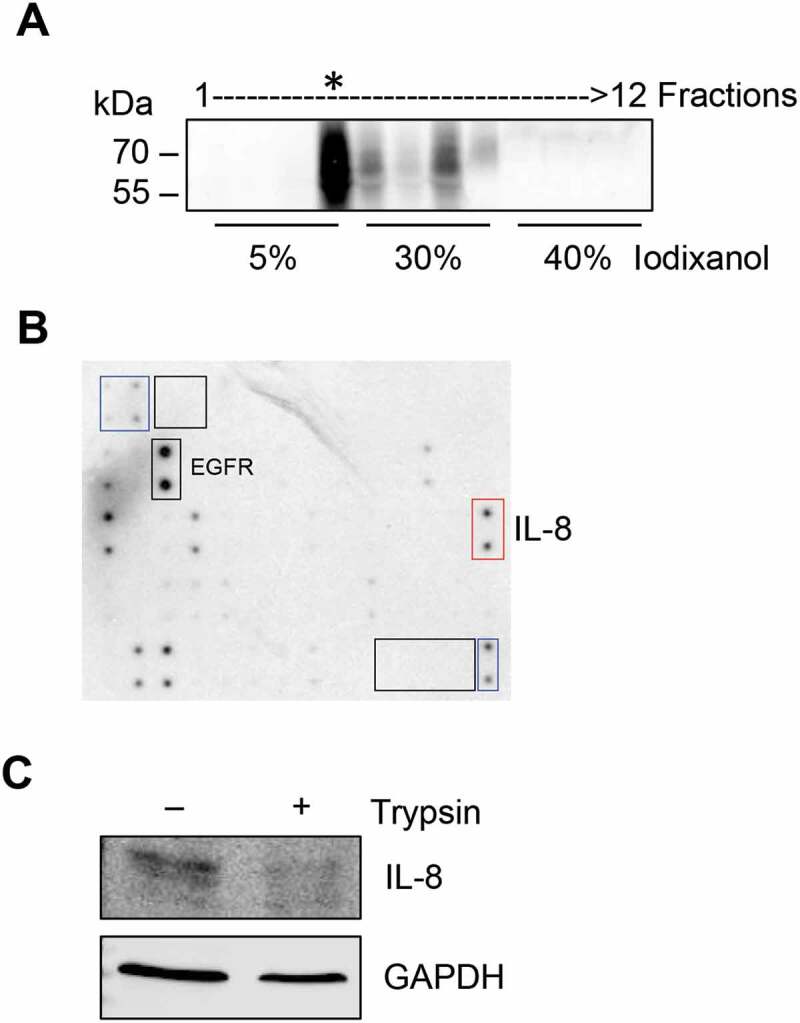
IL-8 is present on the surface of sEVs. (A) Conditioned medium derived from A431-Dsg2/GFP cells was used to isolate sEVs by sequential ultracentrifugation and iodixanol separation. Fractions were collected from the top and immunoblotted for CD63. (B) Fraction 4, enriched in CD63, was digested with trypsin (0.2%) and then subjected to Western blotting analysis for IL-8 and GAPDH.
Dsg2 regulates IL-8 by down-regulating miR-146a
miRNAs are small non-coding RNA molecules that are emerging as important regulators of diverse biological processes and miRNA-dependent regulation of the IL-8 gene has been reported in many pathological conditions including inflammation and cancer [37–41]. In addition, miR-146a modulates senescence and inflammation by targeting IL-8 [42,43]. To investigate the role of Dsg2 in the regulation of miRNAs, miRNA-sequencing (miRNA-Seq) on cellular and sEV-derived miRNAs from A431 and A431-Dsg2/GFP cells was performed. The results of the RNA-Seq analysis showed that 93 total cellular miRNAs were altered (50 up-regulated and 43 down-regulated) in response to Dsg2 (Figure 7(a) and Table 3). In sEVs, 19 miRNAs changed in response to Dsg2 with 16 up-regulated and 3 down-regulated. Of those, only 8 of the 19 were similar between the cells and sEVs, suggesting that some miRNAs were selectively and actively packaged into sEVs. Interestingly, miR146a-5p (miR146a) was the most down-regulated miRNA in response to Dsg2 at both the cellular level as well as in sEVs (Figure 7(a)). The mechanism by which Dsg2 modulates miRNAs remains to be determined.
Figure 7.
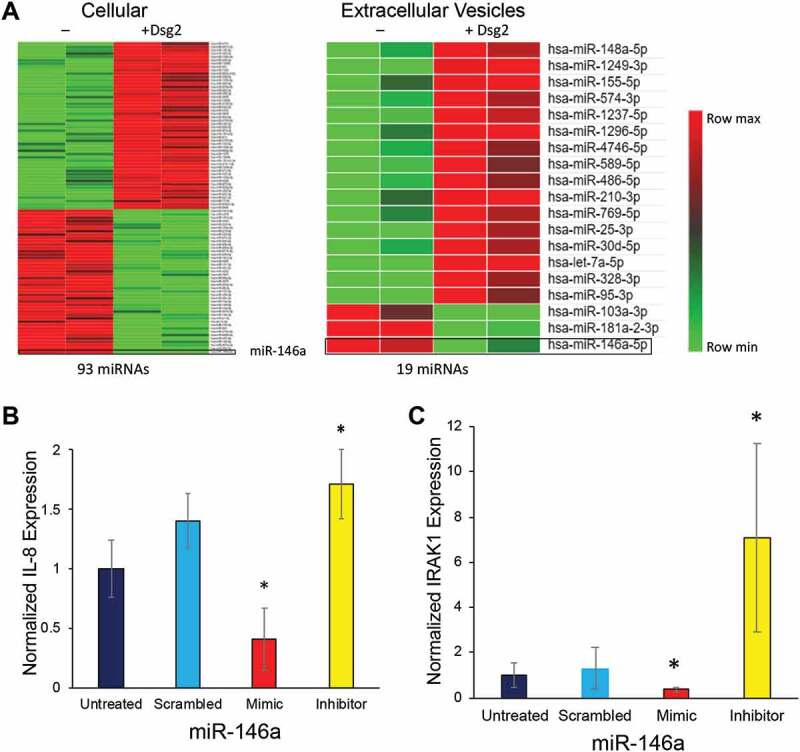
Dsg2 alters IL-8 and IRAK1 through miR-146a. (A) The expression of 93 total cellular and 19 EV miRNAs altered in response to Dsg2 detected by RNASeq (signal > 500 and P = 0.05) as reflected by log-normalised intensities. [(B) and (C)] SCC A341 cells were treated with scrambled control, miR-146a mimic or miR-146a inhibitor for 24 h and total RNA was isolated. RT-qPCR performed for IL-8 (B) and IRAK1 (C) and expression levels were normalised to GAPDH (N = 9). For IL-8: Untreated, 1.0 ± 0.2; Scramble, 1.4 ± 0.2; Mimic 0.4 ± 0.3; Inhibitor, 1.7 ± 0.1. For IRAK1: Untreated, 1.0 ± 0.5; Scramble, 1.3 ± 0.9; Mimic 0.35 ± 0.1; Inhibitor 7.1 ± 04.1.
Table 3.
Dsg2-dependent miRNA changes in cells and EVs. RNAseq data for miRNA expression in A431 SCC cells in response to Dsg2. Complete list of 93 cellular and 19 EV miRNAs modified in response to Dsg2.
| Cells |
Extracellular vesicles |
||||
|---|---|---|---|---|---|
| miRNA | P value | Fold change | miRNA | P value | Fold change |
| hsa-miR-4751 | 3.4E-02 | 3.494971 | hsa-miR-148a-5p | 2.6E-02 | 3.160165 |
| hsa-miR-3614-3p | 2.4E-02 | 3.457813 | hsa-miR-1249-3p | 8.0E-04 | 3.010493 |
| hsa-miR-155-5p | 1.6E-02 | 2.466088 | hsa-miR-155-5p | 5.5E-02 | 2.948538 |
| hsa-miR-489-3p | 4.7E-02 | 2.396844 | hsa-miR-574-3p | 2.6E-02 | 2.394957 |
| hsa-miR-1343-3p | 1.4E-02 | 2.178318 | hsa-miR-1237-5p | 7.7E-03 | 2.361985 |
| hsa-miR-335-3p | 2.2E-02 | 2.173783 | hsa-miR-1296-5p | 3.7E-02 | 2.329467 |
| hsa-miR-1268b | 1.7E-02 | 2.08478 | hsa-miR-4746-5p | 4.8E-02 | 2.265768 |
| hsa-miR-941 | 3.7E-03 | 2.015638 | hsa-miR-589-5p | 5.1E-02 | 2.114036 |
| hsa-miR-1303 | 4.3E-03 | 2.006902 | hsa-miR-486-5p | 4.1E-02 | 1.931873 |
| hsa-miR-550a-3-5p | 5.4E-02 | 1.988431 | hsa-miR-210-3p | 5.3E-02 | 1.905276 |
| hsa-miR-339-5p | 2.0E-02 | 1.978894 | hsa-miR-769-5p | 5.4E-02 | 1.547565 |
| hsa-miR-125b-5p | 3.7E-02 | 1.936007 | hsa-miR-25-3p | 1.4E-02 | 1.375542 |
| hsa-miR-345-5p | 1.5E-03 | 1.921073 | hsa-miR-30d-5p | 3.3E-02 | 1.301342 |
| hsa-miR-378a-5p | 5.2E-02 | 1.901527 | hsa-let-7a-5p | 0.0E + 00 | 1.265757 |
| hsa-miR-222-3p | 2.3E-02 | 1.859522 | hsa-miR-328-3p | 2.1E-02 | 1.172835 |
| hsa-miR-455-3p | 8.7E-03 | 1.854454 | hsa-miR-95-3p | 3.7E-02 | 1.132884 |
| hsa-miR-3935 | 4.4E-02 | 1.842817 | hsa-miR-103a-3p | 5.3E-02 | −1.10957 |
| hsa-miR-1268a | 3.3E-03 | 1.824421 | hsa-miR-181a-2-3p | 1.9E-03 | −1.60214 |
| hsa-miR-3158-3p | 1.6E-02 | 1.778372 | hsa-miR-146a-5p | 4.5E-02 | −7.72749 |
| hsa-miR-424-3p | 4.3E-02 | 1.763534 | |||
| hsa-miR-4530 | 2.4E-02 | 1.75379 | |||
| hsa-miR-3908 | 1.9E-02 | 1.738225 | |||
| hsa-miR-30d-5p | 4.0E-02 | 1.723596 | |||
| hsa-miR-4746-5p | 2.1E-02 | 1.711908 | |||
| hsa-miR-185-3p | 2.1E-02 | 1.70947 | |||
| hsa-miR-589-5p | 9.2E-03 | 1.703309 | |||
| hsa-miR-574-3p | 3.5E-02 | 1.671365 | |||
| hsa-miR-181a-5p | 2.9E-02 | 1.631138 | |||
| hsa-miR-614 | 2.9E-02 | 1.625194 | |||
| hsa-miR-4745-5p | 3.6E-02 | 1.621327 | |||
| hsa-miR-100-5p | 3.7E-02 | 1.600418 | |||
| hsa-miR-193b-3p | 3.2E-02 | 1.578689 | |||
| hsa-miR-6822-3p | 4.7E-02 | 1.558634 | |||
| hsa-miR-1275 | 2.2E-02 | 1.546801 | |||
| hsa-miR-1260b | 3.1E-02 | 1.53002 | |||
| hsa-miR-181a-2-3p | 1.3E-02 | 1.509715 | |||
| hsa-miR-218-1-3p | 3.3E-05 | 1.496705 | |||
| hsa-miR-1249-3p | 6.0E-03 | 1.493437 | |||
| hsa-miR-210-5p | 4.2E-02 | 1.480334 | |||
| hsa-miR-423-3p | 2.2E-02 | 1.457199 | |||
| hsa-miR-125a-3p | 2.2E-02 | 1.452636 | |||
| hsa-miR-4286 | 5.0E-02 | 1.416065 | |||
| hsa-miR-675-5p | 4.0E-02 | 1.398583 | |||
| hsa-miR-520g-5p | 1.2E-02 | 1.354219 | |||
| hsa-miR-483-3p | 1.1E-02 | 1.28771 | |||
| hsa-miR-937-3p | 5.4E-03 | 1.24022 | |||
| hsa-miR-221-3p | 3.6E-02 | 1.239406 | |||
| hsa-miR-17-5p | 5.1E-02 | 1.162815 | |||
| hsa-miR-548av-5p | 7.8E-03 | 1.157471 | |||
| hsa-miR-548k | 7.8E-03 | 1.157471 | |||
| hsa-miR-181d-5p | 2.2E-03 | −1.090434 | |||
| hsa-miR-4315 | 5.1E-03 | −1.093118 | |||
| hsa-miR-151a-3p | 2.7E-02 | −1.169172 | |||
| hsa-miR-4443 | 2.6E-02 | −1.244754 | |||
| hsa-miR-224-5p | 2.8E-02 | −1.255403 | |||
| hsa-miR-130a-3p | 2.8E-02 | −1.267563 | |||
| hsa-miR-218-5p | 4.5E-02 | −1.325368 | |||
| hsa-miR-452-5p | 5.2E-02 | −1.32573 | |||
| hsa-miR-27a-3p | 8.7E-03 | −1.378141 | |||
| hsa-miR-30b-5p | 5.5E-02 | −1.385742 | |||
| hsa-miR-26b-5p | 5.7E-03 | −1.409554 | |||
| hsa-miR-200a-3p | 4.2E-04 | −1.432015 | |||
| hsa-miR-6718-5p | 2.6E-02 | −1.436837 | |||
| hsa-miR-455-5p | 3.1E-02 | −1.503326 | |||
| hsa-miR-16-2-3p | 2.6E-02 | −1.512259 | |||
| hsa-miR-4283 | 2.8E-03 | −1.559243 | |||
| hsa-miR-141-3p | 7.3E-03 | −1.571711 | |||
| hsa-miR-30c-5p | 1.2E-02 | −1.624972 | |||
| hsa-miR-4322 | 3.9E-02 | −1.723357 | |||
| hsa-miR-7641 | 3.1E-02 | −1.723383 | |||
| hsa-miR-99a-5p | 2.1E-02 | −1.799487 | |||
| hsa-miR-4675 | 3.7E-05 | −1.815564 | |||
| hsa-miR-203a-3p | 8.3E-03 | −1.824814 | |||
| hsa-miR-98-5p | 8.7E-03 | −1.831834 | |||
| hsa-miR-101-3p | 1.5E-02 | −1.843259 | |||
| hsa-miR-454-3p | 1.4E-02 | −1.865915 | |||
| hsa-miR-29c-3p | 4.1E-02 | −1.909977 | |||
| hsa-miR-10a-3p | 1.1E-02 | −1.942635 | |||
| hsa-miR-194-5p | 1.5E-02 | −1.956922 | |||
| hsa-miR-10a-5p | 2.2E-03 | −1.968513 | |||
| hsa-miR-301b-3p | 3.7E-02 | −2.007348 | |||
| hsa-miR-19a-3p | 1.5E-02 | −2.043948 | |||
| hsa-miR-21-5p | 4.5E-02 | −2.049397 | |||
| hsa-let-7c-5p | 2.9E-02 | −2.054183 | |||
| hsa-miR-10b-5p | 2.3E-04 | −2.183278 | |||
| hsa-miR-944 | 1.1E-02 | −2.186209 | |||
| hsa-miR-374a-5p | 1.1E-05 | −2.355238 | |||
| hsa-miR-4664-5p | 3.4E-02 | −2.532697 | |||
| hsa-miR-497-5p | 2.8E-02 | −2.590796 | |||
| hsa-miR-192-5p | 3.0E-02 | −2.808976 | |||
| hsa-miR-301a-3p | 4.4E-03 | −2.928572 | |||
| hsa-miR-342-3p | 3.0E-05 | −4.24184 | |||
| hsa-miR-146a-5p | 1.0E-03 | −13.1954 | |||
While miR-146a does not directly target IL-8, it does inhibit IRAK1 and its ability to activate transcription of NFkB target genes such as IL-8, thereby regulating IL-8 expression [44,45]. To examine the direct effect of miR-146a on IL-8 and IRAK1, A431 cells were treated with miR-146a mimic or inhibitor, with scrambled miRNA as control. IL-8 (Figure 7(b)) and IRAK1 (Figure 7(c)) expression was analysed by qPCR. The miR-146a mimic decreased both IRAK1 and IL-8 expression while the inhibitor increased their expression levels suggesting that Dsg2 may modulate IL-8 expression through down-regulation of miR-146a.
Correlation between Dsg2 and IL-8 and responsiveness to immune checkpoint therapy
IL-8 and Dsg2 have been shown up-regulated in HNSCCs [21,46]. Here, we analysed the correlation between Dsg2 and IL-8 levels in 14 HNSCC tumour tissues using RNAseq showing a moderate Pearson correlation coefficient (R2 = 0.52; P = 0.0035) between Dsg2 and IL-8 expression (Figure 8(a)). To further establish the relevance of our current findings in an in vivo setting, we assessed the correlation of circulating blood levels of IL-8 and response to immune checkpoint therapy. Blood plasma was collected from HNSCC patients (n = 28) prior to treatment with the PD-1 inhibitor, Nivolumab and IL-8 level was measured by ELISA. Subsequent to treatment, patients were stratified according to clinical response to Nivolumab (red = non-responder and blue = responder) showing those who responded to the drug treatment had significantly lower levels of IL-8 as compared to those that did not show a positive response (Figure 8(b)). These results suggest that those with lower levels of circulating IL-8 responded better to immune checkpoint therapy.
Figure 8.
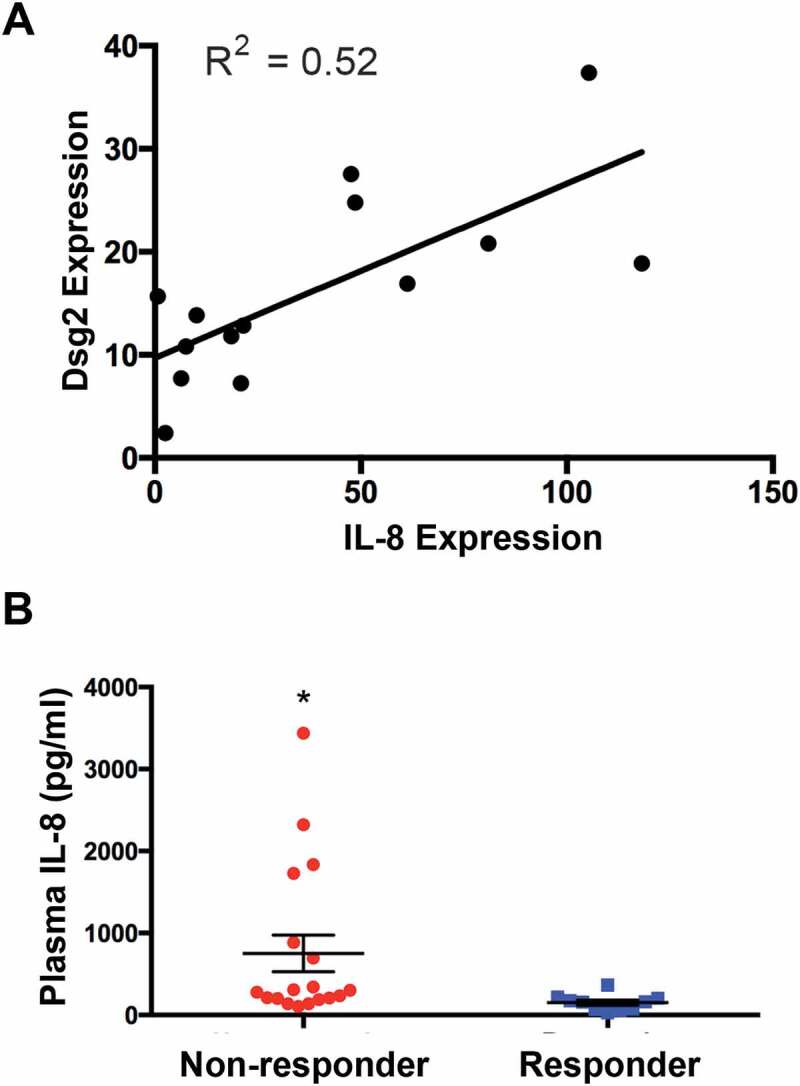
Relationship between tumoural Dsg2 and IL-8 and plasma IL-8 with responsiveness to check-point inhibitor treatment. (A) Gene expression in tumour tissues was determined by RNA seq (NextSeq 500 using 75bp paired-end chemistry at a depth of 50 million reads). Scatter plot analysis is used to assess the association of IL-8 and Dsg2. R2 value is provided to measure goodness-of-fit. (B) HNSCC patients (N = 28) were stratified according to clinical response: non-responders (red; N = 18) and responders (blue; N = 10). Plot shows baseline plasma levels of IL-8 analysed by ELISA. Non-responders, 753 ± 223; responders, 151 ± 32. Statistical significance was assessed using ANOVA (* = P < 0.008).
Discussion
Here we present evidence that the pro-oncogenic, stem cell marker Dsg2 promotes SCC development and progression through down-regulation of miR-146a, resulting in increased production of IL-8, packaged and released in sEVs (Figure 9). These findings are supported by clinical data showing that low plasma levels of IL-8 correlate with HNSCC patients’ responsiveness to immune checkpoint therapy.
Figure 9.
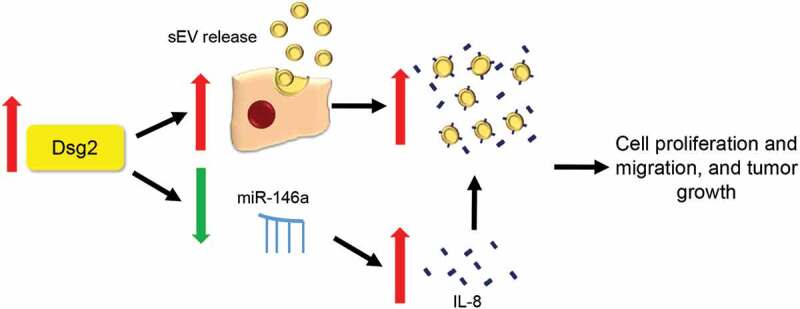
Schematic showing putative mechanism for increased tumorigenesis in SCC cells via Dsg2-dependent miR-146a down-regulation. During malignant transformation, up-regulation of Dsg2 promotes sEV release, down-regulation of miR-146a increases in IL-8 expression and secretion as soluble or sEV-bound form, which contributes to increase in cell proliferation and migration and tumour growth.
During sEV biogenesis, proteins are internalised through the plasma membrane into endocytic vesicles, which merge to form early endosomes and then are sorted for recycling, degradation or secretion [47]. The role of post-translational modifications of membrane proteins in this dynamic process is not fully understood. Palmitoylation is a reversible lipid modification that influences protein conformation and stability, protein-protein interaction and membrane trafficking. Protein palmitoylation is regulated by palmitoyl acyltransferases. Strong evidence supports a link between protein palmitoylation and EV biogenesis and many of these palmitoylated proteins are enriched in sEVs including Dsg2 [48–50]. Here we demonstrate that the palmitoylation state of Dsg2 is critical for trafficking of membrane raft proteins and early endosomal proteins (Figure 3(a)) and thereby modulates sEV release (Figure 2(d)). These results suggest that mutation at these cysteines affects the function of Dsg2 or other proteins and pathways in modulating sEV release. This study does not eliminate the likelihood of other conserved cysteines across different effector proteins that may also play a role in sEV biogenesis, nor does it rule out the possibility for cysteines to be modified in other ways (i.e. nitrosylation). Interestingly, Flot1 showed a congruent relationship with the palmitoylation of Dsg2, in its localisation to the cell borders in SCC cells (Figure 3(a)). The role of palmitoylation of Dsg2 in influencing lipid raft dynamics and exosome release still remains unclear.
Altered protein palmitoylation has been implicated in several disease states including cancer and approaches that target palmitoylated proteins and palmitoyl acyltransferases have the potential for therapeutic intervention [51]. Given that Dsg2 can promote activation of mitogenic signalling cascades and enhance tumorigenesis, palmitoylation may play a role in the ability of Dsg2 to promote these properties [8,13]. Although the relationship between EV biogenesis and Dsg2 palmitoylation remains unclear, it is proposed to be dependent on the ability of Dsg2 to interact with lipid raft proteins that have both signalling and structural manifestations. In xenograft models, Dsg2 promotes larger tumours (Figure 4(a,b)) and the effect was dramatically reduced with the cells over-expressing unpalmitoylated Dsg2 (i.e. Dsg2cacs). This was not due to the rate of cell growth as palmitoylation did not have an effect on cell proliferation. We previously showed that palmitoylation-deficient Dsg2 is unstable and is degraded by lysosomes more rapidly than WT Dsg2 [20]. However, some palmitoylation-deficient Dsg2, that is incorporated into desmosomes, remain relatively stable (Figure 4(c)). To our knowledge, this is the first demonstration of expression of an unpalmitoylated protein (Dsg2cacs) in the in vivo setting (Figure 4(c)).
In skin, sEVs are secreted by a variety of cell types including epithelial keratinocytes, stromal fibroblast and immune cells. While it is well known that sEVs contribute to tumour development and progression, it remains unclear the source of sEVs or its content that play a critical role during malignant transformation. While we cannot rule out the systemic effects on other cells, a single dose of sEVs derived from SCC cells over-expressing Dsg2 is capable of enhancing the tumorigenic potential of SCC cells in vivo (Figure 4(d)). As the number of clinical trials using sEVs are increasing each year, there is an urgent need to better understand their tissue-specific content to develop more targeted therapeutic treatments. Paracrine factors associated with sEVs become key players modulating the TME, including cytokines and miRNAs and their interplay is crucial for maintaining homoeostasis. Released during normal response to infection or wound repair, cytokines have the potential to inhibit cancer development. However, cancer cells have hijacked this system by expressing receptors that upon activation, can promote proliferation and survival.
The recent findings that cytokines are encapsulated or associated with sEVs allow the cell-cell communication systems to intertwine and facilitate cell stimulation. The cytokine array analysis here showed only two proteins (IL-8 and ICAM-1) overlapped between the conditioned medium (Figure 5(b)) and the sEVs (Figure 5(c)). This raises the possibility that 8 of the 10 cytokines altered by Dsg2 in the conditioned medium are soluble and not associated with sEVs. Conversely, 10 of the 12 proteins detected in sEVs may be EV-encapsulated (Figure 5(c)) and thereby not detected in the conditioned medium (Figure 5(b)). We propose that in response to Dsg2, ICAM-1 and IL-8 are up-regulated and bound to the surface of sEVs. ICAM-1 is up-regulated in many cancers including breast cancer and oral SCCs [52,53]. Furthermore, a membrane-associated form of ICAM-1 associates with exosomes and can inhibit leukocytes from binding to activated endothelial cells [54]. It is not clear from these results whether this is the full length ICAM-1 or soluble form of ICAM-1. Likewise, IL-8 is secreted by oral SCC cells and has been detected on the surface of exosomes [36,55]. These findings are in congruent with our results here that Dsg2-mediated up-regulation of IL-8 is associated with sEVs.
While IL-8 is found predominantly in the soluble form, we do not believe that this undermines the importance of our findings concerning IL-8 associated with sEVs. Here, we have shown that sEVs, which are already known to be powerful mediators of cell signalling, can now act as conduits for cytokine signalling. The active sorting of IL-8 onto the surface of vesicles ties IL-8 signalling to the plethora of potential targets and downstream functions of EVs. This effect was mediated by purified EV thus demonstrating that the effect can occur independent of the presence of soluble IL-8. Association with sEVs may increase the local concentration of IL-8 as well as protect it from degradation by circulating proteases.
The mechanism by which Dsg2 activates malignant transformation and oncogenesis remains to be determined. Here, RNAseq shows dramatic down-regulation of miR-146a (Figure 7(a)) which targets the interleukin-1 receptor-associated kinase 1 (IRAK1) (Figure 7(c)) [56]. IRAK1 belongs to the serine-threonine kinase family that is involved in Toll-like receptor and IL-1 signalling activation which promotes gene expression of IL-6 and IL-8. Thus, down-regulation of miR-146a as observed here in response to Dsg2, would promote IL-8 expression and release (Figure 7(b)). IL-8 is a pro-inflammatory cytokine that plays a critical role in tumour progression and metastasis and is up-regulated in many cancers including oral SCCs [44,46]. A correlation between expression of Dsg2 and IL-8 was observed in HNSCC tumours (Figure 8(a)), and in patients’ blood plasma, we detected varying levels of IL-8 (Figure 8(b)). Interestingly, patients with higher basal levels of IL-8 were less responsive to checkpoint inhibitor treatment (Nivolumab), suggesting that treatment with IL-8 or Dsg2 inhibitor to down-regulate IL-8 levels may significantly improve the response of patients to anti-PD-1 inhibitors.
Our data support previously unexplored roles of Dsg2, establishing this protein as a modulator of pro-inflammatory cytokines and the early endosomal pathway, thus impacting sEV release. In summary, the results obtained from this study elucidate a novel function of Dsg2 and shed new light on Dsg2’s ability to influence the tumour microenvironment via paracrine mechanisms. Through linking cytokine signalling to EV biology, we hope that future studies will build on our work and lead to novel therapies for SCCs, HNSCC and any cancers linked to Dsg2 dysregulation.
Disclosure statement
No potential conflict of interest was reported by the authors.
Author contributions
Conceptualisation: MGM
Data curation: JPF, BLH, MWH, JD, PJW, ALH, AL, UR
Formal analysis: JPF, BLH, MWH
Funding acquisition: MGM
Investigation: MGM
Methodology: JPF, BLH, MWH, JD, PJW, ALH
Project administration: MGM
Resources: MGM
Supervision: MGM
Validations: JPF, BLH, MWH, JD, PJW
Visualisation: JPF, BLH, MWH
Writing-original draft preparation: MGM, JPF, BLH, MWH
Writing-review and editing: MGM, JPF, BLH, MWH, ALH, PJW
References
- [1].Schwager SC, Taufalele PV, Reinhart-King CA.. Cell-cell mechanical communication in cancer. Cell Mol Bioeng. 2019;12(1):1–22. [DOI] [PMC free article] [PubMed] [Google Scholar]
- [2].Lee DD, Schwarz MA. Cell-cell communication breakdown and endothelial dysfunction. Crit Care Clin. 2020;36(2):189–200. [DOI] [PMC free article] [PubMed] [Google Scholar]
- [3].Najor NA. Desmosomes in human disease. Annu Rev Pathol. 2018;13:51–70. [DOI] [PubMed] [Google Scholar]
- [4].Pilichou K, Thiene G, Bauce B, et al. Arrhythmogenic cardiomyopathy. Orphanet J Rare Dis. 2016;11:33. [DOI] [PMC free article] [PubMed] [Google Scholar]
- [5].Théry C, Witwer KW, Aikawa E, et al. Minimal information for studies of extracellular vesicles 2018 (MISEV2018): a position statement of the international society for extracellular vesicles and update of the MISEV2014 guidelines. J Extracell Vesicles. 2018;7(1):1535750. [DOI] [PMC free article] [PubMed] [Google Scholar]
- [6].Eshkind L, Tian Q, Schmidt A, et al. Loss of desmoglein 2 suggests essential functions for early embryonic development and proliferation of embryonal stem cells. Eur J Cell Biol. 2002;81(11):592–598. [DOI] [PubMed] [Google Scholar]
- [7].Brennan D, Mahoney MG. Increased expression of Dsg2 in malignant skin carcinomas: A tissue-microarray based study. Cell Adh Migr. 2009;3(2):148–154. [DOI] [PMC free article] [PubMed] [Google Scholar]
- [8].Brennan-Crispi DM, Hossain C, Sahu J, et al. Crosstalk between Desmoglein 2 and Patched 1 accelerates chemical-induced skin tumorigenesis. Oncotarget. 2015;6(11):8593–8605. [DOI] [PMC free article] [PubMed] [Google Scholar]
- [9].Tan LY, Mintoff C, Johan MZ, et al. Desmoglein 2 promotes vasculogenic mimicry in melanoma and is associated with poor clinical outcome. Oncotarget. 2016;7(29):46492–46508. [DOI] [PMC free article] [PubMed] [Google Scholar]
- [10].Ebert LM, Tan LY, Johan MZ, et al. A non-canonical role for desmoglein-2 in endothelial cells: implications for neoangiogenesis. Angiogenesis. 2016;19(4):463–486. [DOI] [PMC free article] [PubMed] [Google Scholar]
- [11].Abulrob A, Giuseppin S, Andrade MF, et al. Interactions of EGFR and caveolin-1 in human glioblastoma cells: evidence that tyrosine phosphorylation regulates EGFR association with caveolae. Oncogene. 2004;23(41):6967–6979. [DOI] [PubMed] [Google Scholar]
- [12].Brennan D, Hu Y, Joubeh S, et al. Suprabasal Dsg2 expression in transgenic mouse skin confers a hyperproliferative and apoptosis-resistant phenotype to keratinocytes. J Cell Sci. 2007;120(Pt 5):758–771. [DOI] [PubMed] [Google Scholar]
- [13].Overmiller AM, McGuinn KP, Roberts BJ, et al. c-Src/Cav1-dependent activation of the EGFR by Dsg2. Oncotarget. 2016;7(25):37536–37555. [DOI] [PMC free article] [PubMed] [Google Scholar]
- [14].Kamekura R, Kolegraff KN, Nava P, et al. Loss of the desmosomal cadherin desmoglein-2 suppresses colon cancer cell proliferation through EGFR signaling. Oncogene. 2014;33(36):4531–4536. [DOI] [PMC free article] [PubMed] [Google Scholar]
- [15].Brennan-Crispi DM, Overmiller AM, Tamayo-Orrego L, et al. Overexpression of Desmoglein 2 in a mouse model of gorlin syndrome enhances spontaneous basal cell carcinoma formation through STAT3-mediated gli1 expression. J Invest Dermatol. 2019;139(2):300–307. [DOI] [PMC free article] [PubMed] [Google Scholar]
- [16].Colombo M, Raposo G, Théry C. Biogenesis, secretion, and intercellular interactions of exosomes and other extracellular vesicles. Annu Rev Cell Dev Biol. 2014;30:255–289. [DOI] [PubMed] [Google Scholar]
- [17].van Niel G, D’Angelo G, Raposo G. Shedding light on the cell biology of extracellular vesicles. Nat Rev Mol Cell Biol. 2018;19(4):213–228. [DOI] [PubMed] [Google Scholar]
- [18].Wendler F, Favicchio R, Simon T, et al. Extracellular vesicles swarm the cancer microenvironment: from tumor-stroma communication to drug intervention. Oncogene. 2017;36(7):877–884. [DOI] [PubMed] [Google Scholar]
- [19].Frixa T, Donzelli S, Blandino G. Oncogenic micrornas: key players in malignant transformation. Cancers (Basel). 2015;7(4):2466–2485. [DOI] [PMC free article] [PubMed] [Google Scholar]
- [20].Roberts BJ, Svoboda RA, Overmiller AM, et al. Palmitoylation of desmoglein 2 is a regulator of assembly dynamics and protein turnover. J Biol Chem. 2016;291(48):24857–24865. [DOI] [PMC free article] [PubMed] [Google Scholar]
- [21].Overmiller AM, Pierluissi JA, Wermuth PJ, et al. Desmoglein 2 modulates extracellular vesicle release from squamous cell carcinoma keratinocytes. Faseb J. 2017;31(8):3412–3424. [DOI] [PMC free article] [PubMed] [Google Scholar]
- [22].Théry C, Amigorena S, Raposo G, et al. Isolation and characterization of exosomes from cell culture supernatants and biological fluids. Curr Protoc Cell Biol. 2006;30(1):3.22.1–3.22.29 Chapter 3:Unit 3.22. [DOI] [PubMed] [Google Scholar]
- [23].Li B, Dewey CN. RSEM: accurate transcript quantification from RNA-Seq data with or without a reference genome. BMC Bioinformatics. 2011;12:323. [DOI] [PMC free article] [PubMed] [Google Scholar]
- [24].Kumar G, Ertel A, Feldman G, et al. iSeqQC: a tool for expression-based quality control in RNA sequencing. BMC Bioinformatics. 2020;21(1):56. [DOI] [PMC free article] [PubMed] [Google Scholar]
- [25].Love MI, Huber W, Anders S. Moderated estimation of fold change and’ ’ dispersion for RNA-seq data with DESeq2. Genome Biol. 2014;15(12):550. [DOI] [PMC free article] [PubMed] [Google Scholar]
- [26].Jeppesen DK, Hvam ML, Primdahl-Bengtson B, et al. Comparative analysis of discrete exosome fractions obtained by differential centrifugation. J Extracell Vesicles. 2014;3:25011. [DOI] [PMC free article] [PubMed] [Google Scholar]
- [27].Lewis JD, Caldara AL, Zimmer SE, et al. The desmosome is a mesoscale lipid raft-like membrane domain. Mol Biol Cell. 2019;30(12):1390–1405. [DOI] [PMC free article] [PubMed] [Google Scholar]
- [28].Roberts BJ, Johnson KE, McGuinn KP, et al. Palmitoylation of plakophilin is required for desmosome assembly. J Cell Sci. 2014;127(Pt 17):3782–3793. [DOI] [PMC free article] [PubMed] [Google Scholar]
- [29].Aicart-Ramos C, Valero RA, Rodriguez-Crespo I. Protein palmitoylation and subcellular trafficking. Biochim Biophys Acta. 2011;1808(12):2981–2994. [DOI] [PubMed] [Google Scholar]
- [30].Greaves J, Carmichael JA, Chamberlain LH. The palmitoyl transferase DHHC2 targets a dynamic membrane cycling pathway: regulation by a C-terminal domain. Mol Biol Cell. 2011. June 1;22(11):1887–1895. [DOI] [PMC free article] [PubMed] [Google Scholar]
- [31].Kumari S, Devi G, Badana A, et al. CD151-A striking marker for cancer therapy. Biomark Cancer. 2015;7:7–11. [DOI] [PMC free article] [PubMed] [Google Scholar]
- [32].Willms E, Johansson HJ, Mäger I, et al. Cells release subpopulations of exosomes with distinct molecular and biological properties. Sci Rep. 2016;6:22519. [DOI] [PMC free article] [PubMed] [Google Scholar]
- [33].Otto GP, Nichols BJ. The roles of flotillin microdomains–endocytosis and beyond. J Cell Sci. 2011;124(Pt 23):3933–3940. [DOI] [PubMed] [Google Scholar]
- [34].Savina A, Furlán M, Vidal M, et al. Exosome release is regulated by a calcium-dependent mechanism in K562 cells. J Biol Chem. 2003;278(22):20083–20090. [DOI] [PubMed] [Google Scholar]
- [35].David JM, Dominguez C, Hamilton DH, et al. The IL-8/IL-8R axis: a double agent in tumor immune resistance. Vaccines (Basel). 2016;4(3). [DOI] [PMC free article] [PubMed] [Google Scholar]
- [36].Fitzgerald W, Freeman ML, Lederman MM, et al. A system of cytokines encapsulated in extracellular vesicles. Sci Rep. 2018;8(1):8973. [DOI] [PMC free article] [PubMed] [Google Scholar]
- [37].Yu Z, Willmarth NE, Zhou J, et al. microRNA 17/20 inhibits cellular invasion and tumor metastasis in breast cancer by heterotypic signaling. Proc Natl Acad Sci USA. 2010;107(18):8231–8236. [DOI] [PMC free article] [PubMed] [Google Scholar]
- [38].Hu N, Zhang J, Cui W, et al. miR-520b regulates migration of breast cancer cells by targeting hepatitis B X-interacting protein and interleukin-8. J Biol Chem. 2011;286(15):13714–13722. [DOI] [PMC free article] [PubMed] [Google Scholar]
- [39].Keklikoglou I, Koerner C, Schmidt C, et al. MicroRNA-520/373 family functions as a tumor suppressor in estrogen receptor negative breast cancer by targeting NF-κB and TGF-β signaling pathways. Oncogene. 2012;31(37):4150–4163. [DOI] [PubMed] [Google Scholar]
- [40].He J, Qian X, Carpenter R, et al. Repression of miR-143 mediates Cr (VI)-induced tumor angiogenesis via IGF-IR/IRS1/ERK/IL-8 pathway. Toxicol Sci. 2013;134(1):26–38. [DOI] [PMC free article] [PubMed] [Google Scholar]
- [41].Fabbri E, Borgatti M, Montagner G, et al. Expression of microRNA-93 and interleukin-8 during pseudomonas aeruginosa-mediated induction of proinflammatory responses. Am J Respir Cell Mol Biol. 2014;50(6):1144–1155. [DOI] [PubMed] [Google Scholar]
- [42].Bhaumik D, Scott GK, Schokrpur S, et al. MicroRNAs miR-146a/b negatively modulate the senescence-associated inflammatory mediators IL-6 and IL-8. Aging (Albany NY). 2009;1(4):402–411. [DOI] [PMC free article] [PubMed] [Google Scholar]
- [43].Roos J, Enlund E, Funcke J-B, et al. miR-146a-mediated suppression of the inflammatory response in human adipocytes. Sci Rep. 2016;6:38339. [DOI] [PMC free article] [PubMed] [Google Scholar]
- [44].MAR SJ, Li Y, Zhou X, et al. Interleukin 6 and interleukin 8 as potential biomarkers for oral cavity and oropharyngeal squamous cell carcinoma. Arch Otolaryngol Head Neck Surg. 2004;130(8):929–935. [DOI] [PubMed] [Google Scholar]
- [45].Long J-P, Dong L-F, Chen -F-F, et al. miR-146a-5p targets interleukin-1 receptor-associated kinase 1 to inhibit the growth, migration, and invasion of breast cancer cells. Oncol Lett. 2019;17(2):1573–1580. [DOI] [PMC free article] [PubMed] [Google Scholar]
- [46].Chan L-P, Wang L-F, Chiang F-Y, et al. IL-8 promotes HNSCC progression on CXCR1/2-meidated NOD1/RIP2 signaling pathway. Oncotarget. 2016;7(38):61820–61831. [DOI] [PMC free article] [PubMed] [Google Scholar]
- [47].Alenquer M, Amorim MJ. Exosome biogenesis, regulation, and function in viral infection. Viruses. 2015;7(9):5066–5083. [DOI] [PMC free article] [PubMed] [Google Scholar]
- [48].Ko P-J, Dixon SJ. Protein palmitoylation and cancer. EMBO Rep. 2018. September 19;19(10). DOI: 10.15252/embr.201846666. [DOI] [PMC free article] [PubMed] [Google Scholar]
- [49].Romancino DP, Buffa V, Caruso S, et al. Palmitoylation is a post-translational modification of Alix regulating the membrane organization of exosome-like small extracellular vesicles. Biochim Biophys Acta Gen Subj. 2018;1862(12):2879–2887. [DOI] [PubMed] [Google Scholar]
- [50].Jimenez L, Yu H, McKenzie AJ, et al. Quantitative proteomic analysis of small and large extracellular vesicles (evs) reveals enrichment of adhesion proteins in small evs. J Proteome Res. 2019;18(3):947–959. [DOI] [PMC free article] [PubMed] [Google Scholar]
- [51].Resh MD. Palmitoylation of proteins in cancer. Biochem Soc Trans. 2017;45(2):409–416. [DOI] [PubMed] [Google Scholar]
- [52].Figenschau SL, Knutsen E, Urbarova I, et al. ICAM1 expression is induced by proinflammatory cytokines and associated with TLS formation in aggressive breast cancer subtypes. Sci Rep. 2018;8(1):11720. [DOI] [PMC free article] [PubMed] [Google Scholar]
- [53].Usami Y, Ishida K, Sato S, et al. Intercellular adhesion molecule-1 (ICAM-1) expression correlates with oral cancer progression and induces macrophage/cancer cell adhesion. Int J Cancer. 2013;133(3):568–578. [DOI] [PubMed] [Google Scholar]
- [54].Lee HM, Choi E-J, Kim JH, et al. A membranous form of ICAM-1 on exosomes efficiently blocks leukocyte adhesion to activated endothelial cells. Biochem Biophys Res Commun. 2010;397(2):251–256. [DOI] [PubMed] [Google Scholar]
- [55].Watanabe H, Iwase M, Ohashi M, et al. Role of interleukin-8 secreted from human oral squamous cell carcinoma cell lines. Oral Oncol. 2002;38(7):670–679. [DOI] [PubMed] [Google Scholar]
- [56].Chu B, Zhou Y, Zhai H, et al. The role of microRNA-146a in regulating the expression of IRAK1 in cerebral ischemia-reperfusion injury. Can J Physiol Pharmacol. 2018;96(6):611–617. [DOI] [PubMed] [Google Scholar]


