Abstract
Introduction: Nonalcoholic fatty liver disease (NAFLD) is associated with metabolic syndrome, which often includes obesity, diabetes, and dyslipidemia. Several studies in mice and humans have implicated the involvement of the gut microbiome in NAFLD. While cannabis may potentially be beneficial for treating metabolic disorders such as NAFLD, the effects of cannabis on liver diseases and gut microbiota profile are yet to be addressed. In this study, we evaluated the therapeutic effects of cannabis strains with different cannabinoid profiles on NAFLD progression.
Materials and Methods: NAFLD was induced by feeding mice a high-fat/cholesterol diet (HFCD) for 6 weeks. During this period, cannabis extracts were administrated orally at a concentration of 5 mg/kg every 3 days. Profile of lipids, liver enzymes, glucose tolerance, and gene expression related to carbohydrate lipid metabolism and liver inflammation were analyzed. The effect of cannabis strains on microbiota composition in the gut was evaluated.
Results: A cannabidiol (CBD)-rich extract produced an increase in inflammatory related gene expression and a less diverse microbiota profile, associated with increased fasting glucose levels in HFCD-fed mice. In contrast, mice receiving a tetrahydrocannabinol (THC)-rich extract exhibited moderate weight gain, improved glucose response curves, and a decrease in liver enzymes.
Conclusions: The results of this study indicate that the administration of cannabis containing elevated levels of THC may help ameliorate symptoms of NAFLD, whereas administration of CBD-rich cannabis extracts may cause a proinflammatory effect in the liver, linked with an unfavorable change in the microbiota profile. Our preliminary data suggest that these effects are mediated by mechanisms other than increased expression of the endocannabinoid receptors cannabinoid receptor 1 (CB1) and CB2.
Keywords: cannabis, NAFLD, metabolic syndrome
Introduction
Nonalcoholic fatty liver disease (NAFLD) is a major global health problem, with prevention and treatment a major challenge for world health services. Therapeutic approaches focus on lifestyle modification, with diet and exercise interventions remaining as the first lines of therapy.1
The high-fat/cholesterol diet (HFCD) has proven its utility as a model of fatty liver disease in mice. HFCD induces steatosis and inflammation, and increased levels of alanine aminotransferase, total cholesterol, and triglycerides within 6 weeks.2
The endocannabinoid system (ECS) is a complex physiological system that acts on metabolic pathways.3 There are two primary receptors, cannabinoid receptor 1 (CB1) and CB2, both G-protein-coupled membrane receptors that share a common signaling mechanism but differ in their tissue distribution and expression patterns. The most famous plant known to modulate the ECS is cannabis; it contains a variety of chemicals, including cannabinoids, which can undergo decarboxylation to produce their neutral form.4
In contrast with synthetic cannabinoids, studies have shown that natural cannabis extracts have beneficial effects in improving insulin sensitivity,5 inducing weight loss in diet-induced obese rats and protective effects on hyperglycemia in vivo.6 A paradox seems to exist among cannabis users, in which, although cannabis use is associated with increased appetite and calorie consumption, the risk of obesity7 and diabetes8,9 is reduced. A recent cross-sectional study revealed a strong relationship between cannabis use and reduced prevalence of NAFLD in patients.10,11
In this study, the HFCD in mice was used as a model to evaluate the effects of several cannabis strains on NAFLD development. To the best of our knowledge, this is the first study to examine the metabolic effects of oral administration of cannabis extracts in mice fed HFCD.
Materials and Methods
Cannabis plant extract preparation
Three varieties of cannabis plant were selected for the study based on the composition of the cannabinoids tetrahydrocannabinol (THC) and cannabidiol (CBD). Inflorescences of these three strains were dried at 19°C and 55% humidity for 2 weeks, followed by curing for 3 weeks in closed boxes in the dark. During the curing period, the boxes, kept at 20°C, were opened every day for 6 h. Ten grams of dry material was sampled from 10 different inflorescences for each strain, from 10 replicated plants per strain (CN1, CN2, and CN6) and ground in a coffee grinder (Moulinex, model A843) by a few short presses, until a uniform mixture was obtained. Three grams of ground material was mixed on a shaker for 90 min with 30 mL ethanol 99.9% analytical reagent and centrifuged. The supernatants were filtered and dried under reduced pressure using a rotary evaporator and were kept at −20°C until further use.
Decarboxylation
To convert the cannabinoids from their natural acidic state to their active neutral form, decarboxylation was performed. Dried extracts were heated in a ventilated oven for 30 min at 110°C. After decarboxylation, samples were redissolved in ethanol and chemical analysis of the cannabinoid content of the decarboxylated extracts was performed.
Cannabinoid analysis
Cannabinoid chemical analysis was performed using a Waters 2695 Separation Module with a Photodiode Array Detector together with a Quattro Micro Mass Spectrometer. Chromatographic separation was achieved using a Phenomenex Kinetex C18 column (2.6 μm, 150 mm×3 mm i.d.) and a binary gradient (solvent A: water with 0.1% formic acid, and solvent B: MeOH with 0.1% formic acid). Initial conditions were 65% B for 10 min, raised to 95% B over the next 20 min, held at 95% B for 15 min, decreased to 65% B over the next 5 min, and held at 65% B for 10 min for re-equilibration of the system. The flow rate was 0.2 mL/min and the column temperature was 30°C. Mass spectra acquisition was carried out in the electrospray ionization-positive ionization mode under the following conditions: capillary voltage −3.5 kV, cone voltage −45 V, extractor voltage −3 V, radio frequency lens −0.2 V, source temperature −120°C, desolvation temperature −350°C, and nitrogen flow rate of 700 L/h for desolvation, and 50 L/h cone gas. Quantification of the selected cannabinoids was performed using the single-ion monitoring (SIR) mode. Standard solutions of the selected cannabinoids were obtained from Sigma-Aldrich (Jerusalem, Israel). For each compound, serial dilutions were performed, and calibration curves generated for concentrations from 0.5 to 100 μg/mL using SIR of the molecular ion [M+H] (THC-315, tetrahydrocannabinolic acid-359, CBD-315, cannabidiolic acid-359, cannabigerol-317, cannabigerol acid-361, and cannabinol-311; Supplementary Fig. S1). Quantification of cannabinoids in the extracts was performed based on the external calibration curves. The plant extract from the CN1 strain was rich in CBD and the plant extract from the CN2 strain was rich in THC, while the plant extract from the CN6 strain contained similar concentrations of both phytocannabinoids.
Animals and diets
All experiments were approved by the Institutional Animal Care Ethics Committee of the Hebrew University of Jerusalem (AG-14922-2). Forty male C57BL/6J mice, 7–8 weeks old, were purchased from Harlan Laboratories (Jerusalem, Israel). Mice were randomly divided into five experimental groups: (1) Mice fed normal diet (ND, n=8). (2) Mice fed high-fat +1% (w/w) cholesterol +0.5% (w/w) cholate diet (HFCD, n=8). (3) Mice fed HFCD and administered CN1 plant extract (HFCD + CN1, n=8). (4) Mice fed HFCD and administered CN2 plant extract (HFCD + CN2, n=8). (5) Mice fed HFCD and administered CN6 plant extract (HFCD + CN6, n=8). All cannabis plant extracts were administered by oral gavage to mice at a concentration of 5 mg/kg body weight, every 3 days for 6 weeks as described above. Note: the amount (mg) of active ingredient was calculated, as shown in Table 1, and refers to the main cannabinoid in each cannabis plant extract strain.
Table 1.
Phytocannabinoid Content in Decarboxylated Cannabis Extracts
| CBGA (mg/mL) | CBG (mg/mL) | CBDA (mg/mL) | CBD (mg/mL) | Δ9-THCA (mg/mL) | Δ9-THC (mg/mL) | CBN (mg/mL) | |
|---|---|---|---|---|---|---|---|
| CN1 | — | 0.193 | 0.253 | 5.01 | — | — | 0.03 |
| CN2 | — | 0.149 | — | — | 2.57 | 5.00 | 0.22 |
| CN6 | — | 0.143 | 0.03 | 4.06 | 0.43 | 0.94 | 0.11 |
Δ9-THC, tetrahydrocannabinol; Δ9-THCA, tetrahydrocannabinolic acid; CBD, cannabidiol; CBDA, cannabidiolic acid; CBG, cannabigerol; CBGA, cannabigerol acid; CBN, cannabinol.
The diet compositions are presented in Table 2. The mice were housed in a controlled environment (12-h light/12-h dark cycle, 18–24°C) with ad libitum access to food and water.
Table 2.
Diet Composition
| Ingredients | ND |
HFCD |
||
|---|---|---|---|---|
| Gram | Kcal | Gram | Kcal | |
| Casein | 210 | 840 | 248 | 992 |
| L-Methionine | 3 | 12 | 4 | 16 |
| Corn starch | 500 | 2000 | 185 | 0 |
| Dextrose | 100 | 400 | 74 | 296 |
| Sucrose | 39.15 | 156.6 | 61 | 244 |
| Anhydrous milk fat | 20 | 180 | 0 | 0 |
| Lard | 20 | 0 | 260 | 2340 |
| Soybean oil | 20 | 180 | 48 | 432 |
| Cellulose | 35 | 0 | 50 | 0 |
| Cholesterol | 0 | 0 | 10 | 0 |
| Cholic acid | 0 | 0 | 5 | 0 |
| Mineral mix | 35 | 0 | 43 | 0 |
| Vitamin mix | 15 | 0 | 13 | 0 |
| Choline chloride | 2.75 | 0 | 3 | 0 |
| BHT | 0.014 | 0 | 0.014 | 0 |
| Total | 1000 | 3769 | 1000 | 4320 |
| Protein (% Kcal) | 23 | 23 | ||
| Carbohydrate (% Kcal) | 68 | 7 | ||
| Fat (% Kcal) | 10 | 64 | ||
| Kcal/g | 3.8 | 4.3 | ||
Oral glucose tolerance test
Oral glucose tolerance test (OGTT) was performed over 5 weeks of the experimental period. Before the OGTT, the mice were fasted for 8 h and given D-glucose (3 g/kg body weight) by gavage. Blood drawn from the tail tip at 0, 30, 60, and 120 min after the glucose loading was used to monitor glucose levels by a glucometer (Optimum Xceed).
Tissue collection
The mice were fasted for 12 h, weighed, and then sacrificed by isoflurane inhalation. Blood was collected from the vena cava, and plasma was obtained by centrifugation at 5000 g at 4°C for 10 min, and stored at −20°C. Adipose and liver tissue were removed, weighed, frozen in liquid nitrogen, and stored at −80°C. A small sample from the right lobe of each liver was placed in 4% formaldehyde for histological analysis. Ceca were removed and their contents collected for microbiota analysis. Analyses of serum lipid profiles for blood liver enzymes and metabolic profile were performed by American Laboratories (Herzliya, Israel) using standard kits. Plasma insulin levels were measured by the RAT/MOUSE Insulin ELISA Kit (cat. no. EZRMI-13K; Merck). Lipid quantification in liver tissue was carried out using Folch's method.12
Histological examination and grading
Histological slides were prepared by Patho-Lab (Rehovot, Israel). Live tissues were embedded in paraffin and serial sections (3–5 μm thick) were cut from each block and stained with hematoxylin and eosin. The histopathological examinations were performed by Prof. A. Nyska (www.nyska.net). Histopathological changes were scored by a board-certified toxicologic pathologist, using semiquantitative grading of five grades (0–4), taking into consideration the severity of the changes:13 Grade 0/No change seen, Grade 1/Minimal, Grade 2/Mild, Grade 3/Moderate, and Grade 4/Severe.
Protein extraction and Western blotting
Total protein was extracted from the liver tissue with standard lysis buffer. Lysates were centrifuged at 20,000 g for 15 min, and the protein concentration determined by the Bradford method. Samples were subjected to 7.5–10% sodium dodecyl sulfate-polyacrylamide gel electrophoresis and transferred onto nitrocellulose membranes. Blots were incubated with primary antibodies, anti-rabbit AMPK, pAMPK (Thr-172), AKT, pAKT (Cell Signaling Technology), anti-CB1, anti-CB2 (Abcam), and then, after several washes, with secondary goat antibodies (Jackson ImmunoResearch Laboratories, West Grove, PA). The immune reaction was detected by enhanced chemiluminescence, with bands being quantified by densitometry and expressed as arbitrary units. The band optical density was analyzed on an Image lab system (Bio-Rad) and normalized to lane total protein content as visualized with Ponceau S solution (Sigma-Aldrich, USA).14
Quantitative real-time PCR
Total RNA was isolated using Tri-Reagent (Sigma–Aldrich, Rehovot, Israel), according to the manufacturer's protocol. Complementary DNA (cDNA) was prepared with a High-Capacity cDNA Reverse Transcription Kit (Quanta BioSciences, Gaithersburg, MD). Quantitative real-time PCR was performed with the 7300 Real Time PCR System (Applied Biosystems, Foster City, CA), with specific primers. Quantitative changes in gene expression were determined by normalizing against 18S messenger RNA (mRNA). Primers used are listed in Table 3.
Table 3.
Primer Pairs for Quantitative Real-Time PCR
| Name | Reverse | Forward |
|---|---|---|
| 18S | 5′-CCTCAGTTCCGAAAACCAAC-3′ | 5′-ACCGCAGCTAGGAATAATGG-3′ |
| CD36 | 5′-AAAGGCATTGGCTGGAAGAA-3′ | 5′-TCCTCTGACATTTGCAGGTCTATC-3′ |
| iNOS | 5′-TCTCTGCTCTCAGCTCCAAG-3′ | 5′-AGCTCCCTCCTTCTCCTTCT-3′ |
| PEPCK | 5′-TGCAGGCACTTGATGAACTC-3′ | 5′-CAAACCCTGCCATTGTTAAG-3′ |
| PPARα | 5′-CTGCGCATGCTCCGTG-3′ | 5′-CTTCCCAAAGCTCCTTCAAAAA 3′ |
| TNFα | 5′-CCACAAGCAGGAATGAGAAGA-3′ | 5′-ACGTGGAACTGGCAGAAGAG-3′ |
iNOS, inducible nitric oxide synthase; PEPCK, phosphoenolpyruvate carboxykinase; PPARα, peroxisome proliferator-activated receptor alpha; TNFα, tumour necrosis factor alpha.
Metagenomics: 16S ribosomal RNA gene
The following protocol describes the two-step PCR-based method used for preparing samples for sequencing the variable V3 and V4 regions of the 16S rRNA gene. Bacterial DNA was extracted from the studied mice with the PureLink Genomic DNA Mini Kit (Invitrogen, Paisley, UK). Each sample was quantified with a Qubit 2.0 Fluorometer (Thermo Fisher Scientific, Waltham, MA) and diluted to a final concentration of 5 ng/μL in 10 mM Tris at pH 8.5. The 16S library preparation was carried out as described in Illumina 16S sample preparation guide with minor modifications—the PrimeSTAR HS DNA polymerase premix (Takara-Clontech, Mountain View, CA) was used instead of the PCR enzyme.
Statistical analysis
Values are presented as mean±standard error of the mean. Data were analyzed by unpaired two-tailed Student's t-test or by analysis of variance (one-way ANOVA) followed by the Tukey–Kramer honestly significant difference post hoc test. The significance level was p<0.05 for all analyses. The JMP 14 Pro software suites (SAS Institute, Cary, NC) were used for the analyses.
Results
Phytocannabinoid content of decarboxylated cannabis extract
CN1 contained 5 mg/mL of CBD, while CN2 contained 5 mg/mL of THC. CN6 contained an approximately equal amount of each of THC and CBD at a total concentration of 5 mg/mL (Table 1).
Effect of cannabis extracts in mice fed HFCD
Body weight gain, food intake, liver and adipose tissue weight
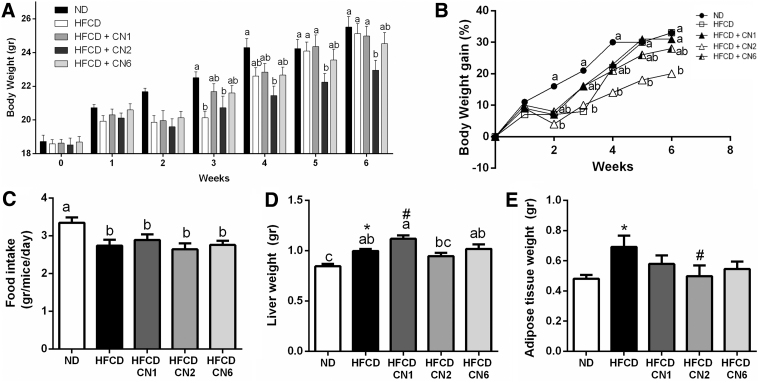
The group administered the CN2 extract exhibited a moderate weight gain starting from the 4th week and throughout the remainder of the experiment (Fig. 1A). All HFCD groups consumed less food than the ND group, both overall (Fig. 1C) and on a weekly basis throughout the experiment (Supplementary Fig. S2). Liver weights were determined (Fig. 1D). In comparison with the HFCD-only group, the CN1-treated group exhibited heavier liver tissue, while ND had significantly smaller liver tissue and the CN2-treated group showed a tendency toward decreased liver weight, although not statistically significant. Adipose tissue weight (Fig. 1E) was lower in the CN2-treated group compared with the HFCD-only group.
FIG. 1.
Effect of cannabis extract treatment on body weight gain, food intake, and liver tissue and adipose tissue weight in mice fed HFCD. Male C57BL/6J mice aged 7–8 weeks were fed HFCD. Mice were intubated three times a week with CN1 or CN2 or CN6 cannabis extracts in concentrations of 5 mg/kg for 6 weeks. (A) Body weight over experiment duration. (B) Body weight gain over experiment duration. (C) Average food intake per mouse per day over the experiment duration. (D) Liver weight of mice at sacrifice. (E) Adipose tissue weight of mice at sacrifice. All values are expressed as mean±SEM (n=8). Columns marked with different letters (a, b) are significantly different (p<0.05) according to the Tukey–Kramer post hoc test. *Different from ND. #Different from HFCD (p<0.05) according to Student's t-test. HFCD, high-fat/cholesterol diet; ND, normal diet; SEM, standard error of the mean.
Effect on glucose tolerance
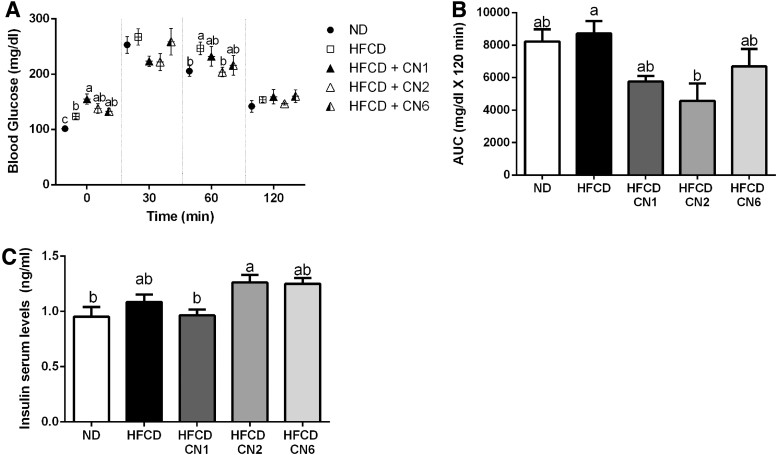
As seen in Figure 2A, fasting glucose levels were highest in the CN1-treated group. Thirty minutes following glucose loading, high levels of glucose levels were found in all groups. At 60 min, glucose levels were significantly lower in the ND and CN2 groups. Area-under-curve estimations for plasma glucose were lower in the CN2-treated group compared with HFCD only. The CN1- and CN6-treated groups exhibited a decrease in glucose levels, although not statistically significant.
FIG. 2.
Effect of cannabis extract treatment on glucose tolerance in mice fed high-fat atherogenic diet. Male C57BL/6J mice aged 7–8 weeks were fed HFCD. Mice were intubated three times a week with CN1 or CN2 or CN6 cannabis extracts in concentrations of 5 mg/kg body weight for 6 weeks. OGTT was performed at week 5 with blood sampled from mouse tail tips. (A) Glucose levels between 0 and 120 during OGTT. (B) Area under the curve of graph A. (C) Insulin serum levels at sacrifice. All values are expressed as mean±SEM (n=8). Columns and graphs marked with different letters (a, b) are significantly different (p<0.05) in the Tukey–Kramer post hoc test. AUC, area under the curve; OGTT, oral glucose tolerance test.
Effect on liver fat accumulation and histology
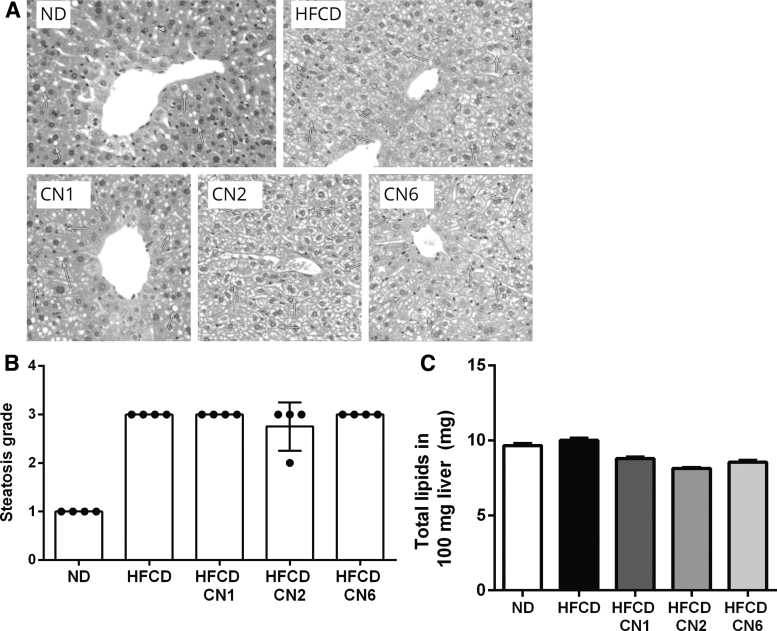
As seen in Figure 3A and 3B, HFCD induced hepatic steatosis and treatment with cannabis extracts produced no change in the steatosis severity (Fig. 3B) or in lipid fat accumulation in the liver (Fig. 3C).
FIG. 3.
Effect of cannabis extract treatment on liver histology and fat accumulation in the liver of mice fed HFCD. Male C57BL/6J mice aged 7–8 weeks were fed HFCD. Mice were intubated three times a week with CN1 or CN2 or CN6 cannabis extracts in concentrations of 5 mg/kg for 6 weeks. On the day of sacrifice, livers were collected and weighed. (A) Representative liver H&E staining. (B) Steatosis grade. (C) Total lipids extracted from 100 mg liver. All values are expressed as mean±SEM (n=8). Steatosis grade was scored by the study pathologist, using semiquantitative grading of four grades (0–3), taking into consideration the severity of the changes (0, no lesion; 1, minimal change; 2, mild change; 3, moderate change). H&E, hematoxylin and eosin.
Effect on serum lipid profile and liver enzymes
Total cholesterol and HDL-cholesterol levels were high in all HFCD groups compared with ND, with the CN6-treated group displaying a tendency toward decreased cholesterol (Table 4). Triglycerides were lowered in all HFCD groups compared with ND, with an increase observed in the CN6-treated group. Liver enzymes were elevated in all HFCD groups compared with ND, an indication of the development of liver injury. Compared with the untreated HFCD animals, serum glutamic-oxaloacetic transaminase (SGOT) and serum glutamic pyruvic transaminase (SGPT) were significantly lowered to a normal range in the CN2-treated group.
Table 4.
All Values Are Expressed as Mean±Standard Error of the Mean (n=5)
| ND | HFCD | HFCD, CN1 | HFCD, CN2 | HFCD, CN6 | |
|---|---|---|---|---|---|
| Cholesterol (mg/dL) | 124.71±5.23** | 153.25±5.1* | 143.63±5.41* | 145.14±7.9* | 140.12±4.24*,** |
| HDL cholesterol (mg/dL) | 98.5±6.23** | 124.63±4.1* | 118.36±9.02* | 119.19±7.38* | 114.14±3.45* |
| Triglycerides (mg/dL) | 89.62±6.23* | 67.63±4.48** | 61.75±5.05** | 56±3.12** | 70.13±3.55*,** |
| Alk Phos (μL/L) | 106.25±6.23* | 103.25±5.04*,** | 85±2.96** | 88.14±3.8*,** | 86.5±4.28** |
| SGOT (μL/L) | 52.62±6.23** | 72.38±5.66* | 62.71±2.1*,** | 58.43±2.27** | 59.88±1.98*,** |
| SGPT (μL/L) | 28.65±6.23** | 48±6.15* | 46±3.76*,** | 30.57±1.11** | 37.88±2.49*,** |
Values marked with different letters (*, **) are significantly different (p<0.05) in the Tukey–Kramer post hoc test.
Alk Phos, alkaline phosphatase; SGOT, serum glutamic-oxaloacetic transaminase; SGPT, serum glutamic pyruvic transaminase.
Effect on lipids and carbohydrate metabolism in liver
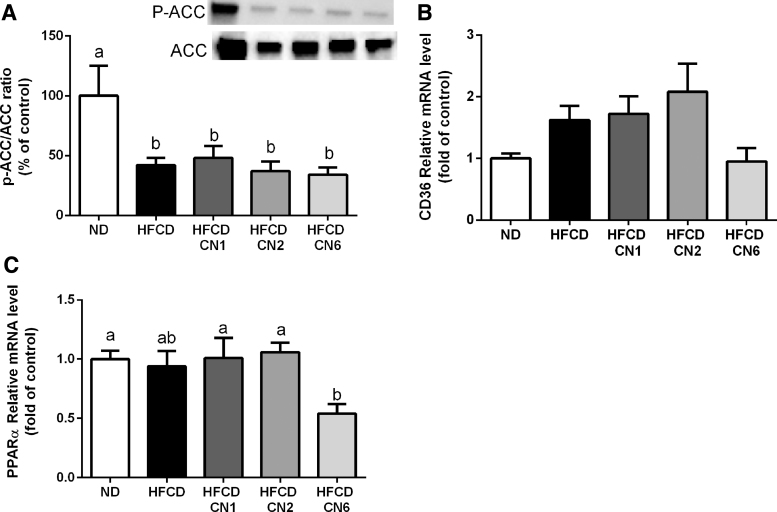
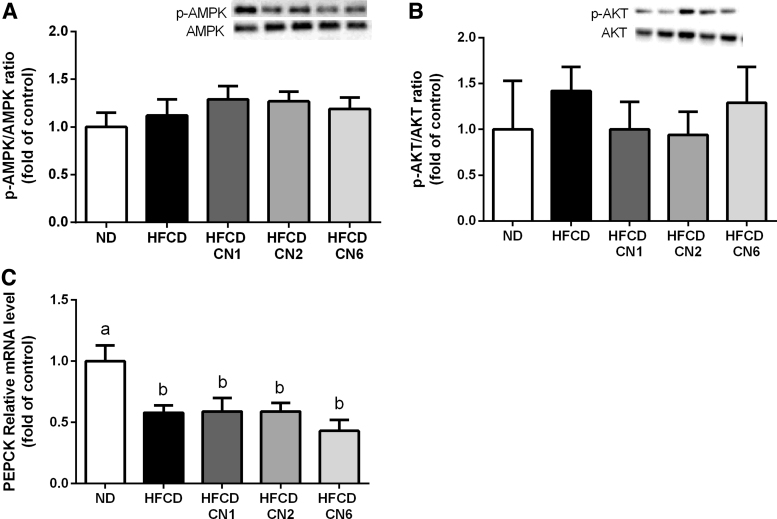
As determined at the gene level, the p-ACC/ACC ratio (Fig. 4A) decreased in all HFCD groups compared with ND. No change was seen in the expression of CD36 (Fig. 4B) between the groups. The peroxisome proliferator-activated receptor alpha (PPARα) gene expression (Fig. 4C) decreased in the CN6-treated group compared with the ND-, CN1-, and CN6-treated groups. The p-AMPK/AMPK and p-AKT/AKT ratio (Fig. 5A, B) remained unchanged in all treatment groups. mRNA expression of phosphoenolpyruvate carboxykinase (PEPCK) (Fig. 5C), which plays a significant role in gluconeogenesis, decreased in all HFCD groups compared with ND.
FIG. 4.
Protein and RNA expression of genes related to lipid metabolism in the liver. Male C57BL/6J mice aged 7–8 weeks were fed HFCD. Mice were intubated three times a week with CN1 or CN2 or CN6 cannabis extracts in concentrations of 5 mg/kg for 6 weeks. (A) p-ACC/ACC ratio expression relative to ND. (B) CD36 mRNA expression relative to ND. (C) PPARα mRNA expression relative to ND. All values are expressed as mean±SEM (n=8). Columns and graphs marked with different letters (a, b) are significantly different (p<0.05) in the Tukey–Kramer post hoc test. mRNA, messenger RNA; PPARα, peroxisome proliferator-activated receptor alpha.
FIG. 5.
Effect of cannabis extract treatment on carbohydrate metabolism in the liver of mice fed HFCD. Male C57BL/6J mice aged 7–8 weeks were fed HFCD. Mice were intubated three times a week with CN1 or CN2 or CN6 cannabis extracts in concentrations of 5 mg/kg for 6 weeks. (A) p-AMPK/AMPK ratio expression relative to ND. (B) p-AKT/AKT ratio expression relative to ND. (C) PEPCK mRNA level relative to ND. All values are expressed as mean±SEM (n=6–8). Columns marked with different letters (a, b) are significantly different (p<0.05) in the Tukey–Kramer post hoc test. PEPCK, phosphoenolpyruvate carboxykinase.
Effect on inflammatory genes and endocannabinoid receptor expression in liver
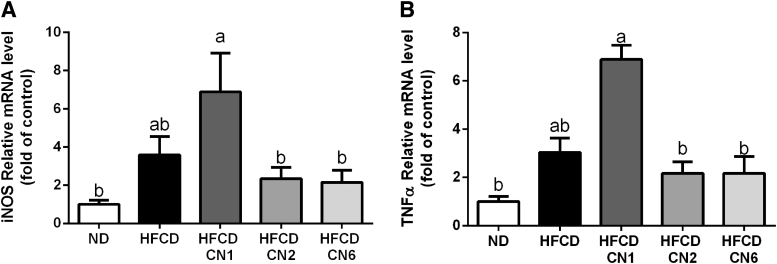
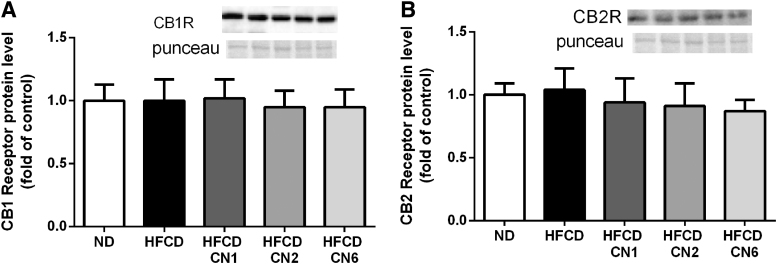
As seen in Figure 6, mRNA levels of both tumour necrosis factor alpha and inducible nitric oxide synthase genes were elevated in the CN1-treated group compared with ND, whereas the CN2- and CN6-treated groups exhibited decreased expression. None of the plant extracts affected the expression of the CB1 and CB2 receptors (Fig. 7).
FIG. 6.
Effect of cannabis extract treatment on inflammatory gene expression in liver of mice fed HFCD. Male C57BL/6J mice aged 7–8 weeks were fed HFCD. Mice were intubated three times a week with CN1 or CN2 or CN6 cannabis extracts in concentrations of 5 mg/kg for 6 weeks. (A) iNOS mRNA expression relative to ND. (B) TNFα mRNA expression relative to ND. All values are expressed as mean±SEM (n=6–8). Columns marked with different letters (a, b) are significantly different (p<0.05) in the Tukey–Kramer post hoc test. iNOS, inducible nitric oxide synthase; TNFα, tumour necrosis factor alpha.
FIG. 7.
Effect of cannabis extract treatment on endocannabinoid receptor expression in the liver of mice fed HFCD. (A) CB1 receptor protein expression relative to ND. (B) CB2 receptor protein expression relative to ND. Male C57BL/6J mice aged 7–8 weeks were fed HFCD. Mice were intubated three times a week with CN1 or CN2 or CN6 cannabis extracts in concentrations of 5 mg/kg for 6 weeks. All values are expressed as mean±SEM (n=6–8). CB, cannabinoid receptor.
Effect on gut microbiota profile
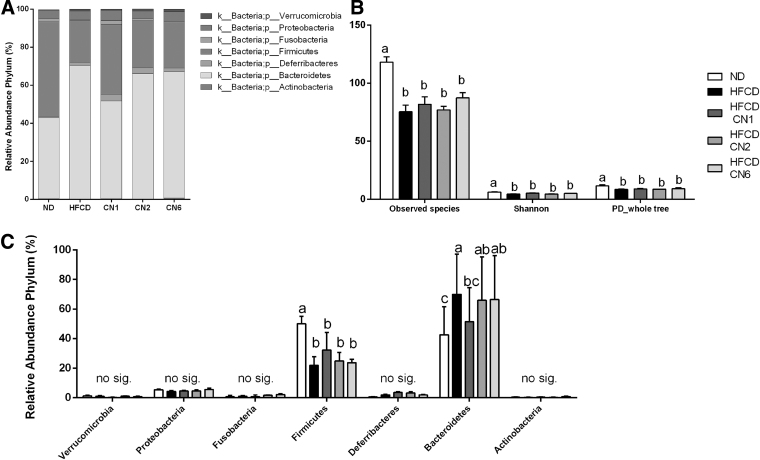
Microbiota composition following the treatments was evaluated at the phylum level (Fig. 8A). Firmicutes abundance (Fig. 8B) decreased statistically in all the HFCD groups compared with ND. The CN2- and CN6-treated groups exhibited a significant increase in the abundance of Bacteroidetes compared with ND, while the CN1-treated group exhibited a decrease compared with the HFCD-only group. In all other phyla groups studied, no significant change between treatment groups was observed (Fig. 8B).
FIG. 8.
Metagenomics applied to gut microbiota. (A) Relative abundance of phyla. (B) Alpha diversity observed species, Shannon index, and PD whole tree. (C) Columnar view of figure A. Male C57BL/6J mice aged 7–8 weeks were fed HFCD. Mice were intubated three times a week with CN1 or CN2 or CN6 cannabis extracts in concentrations of 5 mg/kg for 6 weeks. All values are expressed as mean±SEM (n=5). Columns marked with different letters (a, b) are significantly different (p<0.05) in the Tukey–Kramer post hoc test.
The observed species index (Fig. 8C), which reflects the amount of unique species in each group, decreased in all HFCD groups compared with ND. Alpha diversity is represented by community diversity (Shannon index) and phylogeny-based metrics (PD whole tree index). Shannon index and PD whole tree decreased in all HFCD groups compared with ND (Fig. 8C).
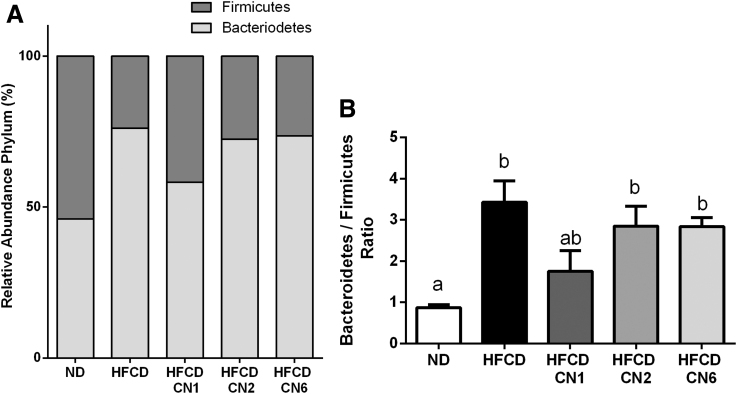
The relative abundance of Bacteroidetes to Firmicutes (Fig. 9A) and the ratio between them (Fig. 9B) were evaluated. The ratio increased significantly in all HFCD groups compared with ND, except for the CN1-treated group.
FIG. 9.
Bacteroidetes to Firmicutes ratio. (A) Relative abundance of Firmicutes and Bacteroidetes. (B) Bacteroidetes to Firmicutes ratio. Male C57BL/6J mice aged 7–8 weeks were fed HFCD. Mice were intubated three times a week with CN1 or CN2 or CN6 cannabis extracts in concentrations of 5 mg/kg for 6 weeks. All values are expressed as mean±SEM (n=5). Columns marked with different letters (a, b) are significantly different (p<0.05) in the Tukey–Kramer post hoc test.
Discussion
We present data showing that administration of a THC-rich extract resulted in the amelioration of NAFLD development, whereas a CBD-rich extract produced an increase in inflammatory related gene expression and poorer microbiota profile, associated with increased fasting glucose levels.
Amelioration of NAFLD in mice treated with CN2 (THC-rich extract) was associated with statistically significant improvement in the major parameters of NAFLD: that is, moderate weight gain, an improved glucose response curve, and a significant decrease in liver enzymes. Our results support prior reports where chronic administration of the THC-rich extract led to a decreased weight gain in mice fed a high-fat diet probably due to the inhibition of increased fat mass.15 Rats fed a Western diet and injected subcutaneously with an extract containing THC, CBD, and CBN reduced the deleterious effects of diet-induced obesity by reducing weight gain, specifically adipose tissue.16
In this study, none of the plant extracts affected food consumption, supporting previous studies.17,18 It has been reported that THC increases appetite and subsequent food intake.19 Our results did not confirm these findings. This contradiction may be explained by the lower concentrations of cannabinoids (i.e., THC and/or CBD) administered in our experiments. Studies show that the hyperphagic effects of THC are mostly acute and are absent after a few days of administration. THC administered orally at a dose of 2 mg/kg, increased appetite 1 h after administration although the animals subsequently compensated for their hyperphagia, so that 24-h intakes were similar to controls.20 A similar result was observed at concentrations of 0.1–1.8 mg/kg.21
The improved glucose response following CN2 administration was not accompanied with changes in insulin levels. Similarly, no changes were observed in p-AKT, suggesting that the effects are not mediated via insulin signaling. PEPCK expression was reduced in all HFCD groups regardless of treatment, with no change in p-AMPK/AMPK, making it difficult to unequivocally attribute the effect of CN2 (THC-rich) treatment on the regulation of gluconeogenesis and insulin signaling. Further experiments are required to elucidate the mechanism by which CN2 or alternatively THC treatment improves glucose response following a HFCD.
No changes where observed in phosphorylation of ACC, a key enzyme involved in the de novo synthesis of fatty acids in the liver. The CN6-treated group exhibited a tendency toward reduced expression of PPARα, indicating the downregulation of fatty-acid beta-oxidation. However, as we mentioned, we observed no changes in liver weight and fat percentage, suggesting that a longer treatment duration may be needed before the expected phenotype is observed.
Liver histology and fat percentage revealed that all groups fed HFCD showed severe steatosis and increased fat accumulation in the liver, regardless of treatment. Nevertheless, following CN2 treatment, mice exhibited lower SGOT and SGPT levels, leading to an improved NAFLD status.
It is well known that high levels of hepatic inflammatory gene expression are associated with hyperglycemia and NAFLD progression. Analysis of two proinflammatory factors showed that CN1 treatment significantly increased their expression. In contrast, CN2 or CN6 treatment decreased their expression, suggestive of a reduced inflammatory response. These findings support the importance of further research on the anti-inflammatory effects of THC-rich extracts in NAFLD.
Cannabis extracts used in our study produced no significant effect on the expression of CB1 and CB2 receptors in the liver. It is possible that the observed effects are not mediated via the cannabinoid receptors. However, it is also possible that extracts activate the cannabinoid receptors without affecting their expression. A study evaluating the effects of phytocannabinoids in NAFLD failed to explain that their effect is dependent on cannabinoid receptors.22 Further work is needed to clarify how cannabis extracts effect the ECS.
There are emerging data about the relationship between the ECS, microbiome composition, and obesity,15,23 yet very little is known about the effect of phytocannabinoids on the gut microbiota. We found that at the phylum level, Bacteroidetes and Firmicutes populations are most dominant in the gut. This is similar to previous findings in humans and mice.24 In other studies using an NAFLD model, the relative abundance of Bacteroidetes tended to be higher, and the Bacteroidetes/Firmicutes ratio was significantly elevated in non-alcoholic steatohepatitis patients.25,26 Our results show a high Bacteroidetes/Firmicutes ratio in all HFCD groups with a slight decrease observed in the CN1 group. Phylum-level analysis revealed a significantly lower abundance of Bacteroidetes in this group. Studies show that a decreased abundance of Bacteroidetes was negatively correlated with improved glucose homeostasis in rodents27 and in humans.28 These findings corroborate our observations that fasting glucose levels were higher in the CN1-treated group. Regarding alpha diversity parameters, the extracts produced no change compared with the HFCD group, indicating the inability of the tested extracts to affect the richness and variety of gut bacteria in an NAFLD model.
In summary, we demonstrated that in an HFCD murine model, a CBD-rich extract produced an increase in inflammatory liver gene expression and poorer microbiota profile, associated with increased fasting glucose levels. Treatment with a THC-rich extract alleviated NAFLD development. These drastically different responses highlight the importance of proper selection of the type of phytocannabinoids as well as the appropriate dose needed for optimal therapeutic efficacy.
The results of this study provide an indication that administration of certain strains of cannabis, preferably with a higher THC level, may be helpful in treating certain symptoms of metabolic syndrome, which include preventing the development and/or ameliorating the symptoms of NAFLD. However, to discover the complete mechanism behind these phenomena, further research is needed.
Supplementary Material
Abbreviations Used
- ACC
acetyl CoA carboxylase
- Alk Phos
alkaline phosphatase
- ANOVA
analysis of variance
- AUC
area under the curve
- CB1
cannabinoid receptor 1
- cDNA
complementary DNA
- ECS
endocannabinoid system
- H&E
hematoxylin and eosin
- HFCD
high-fat/cholesterol diet
- iNOS
inducible nitric oxide synthase
- mRNA
messenger RNA
- NAFLD
nonalcoholic fatty liver disease
- ND
normal diet
- OGTT
oral glucose tolerance test
- SEM
standard error of the mean
- SGOT
serum glutamic-oxaloacetic transaminase
- SGPT
serum glutamic pyruvic transaminase
- SIR
single-ion monitoring
Author Disclosure Statement
The authors declare no conflict of interest.
Funding Information
This work was funded by the chief scientist of the Israeli Ministry of Agriculture and Rural Development, Grant No. 15-05-0020, as well as the Israeli Ministry of Science and Technology.
Supplementary Material
Cite this article as: Assa-Glazer T, Gorelick J, Sela N, Nyska A, Bernstein N, Madar Z (2020) Cannabis extracts affected metabolic syndrome parameters in mice fed high-fat/cholesterol diet, Cannabis and Cannabinoid Research 5:3, 202–214, DOI: 10.1089/can.2020.0013.
References
- 1. Stefan N, Häring H-U, Cusi K. Non-alcoholic fatty liver disease: causes, diagnosis, cardiometabolic consequences, and treatment strategies. Lancet Diabetes Endocrinol. 2019;7:313–324 [DOI] [PubMed] [Google Scholar]
- 2. Matsuzawa N, Takamura T, Kurita S, et al. Lipid-induced oxidative stress causes steatohepatitis in mice fed an atherogenic diet. Hepatology. 2007;46:1392–1403 [DOI] [PubMed] [Google Scholar]
- 3. Simon V, Cota D. Mechanisms in endocrinology: endocannabinoids and metabolism: past, present and future. Eur J Endocrinol. 2017;176:R309–R324 [DOI] [PubMed] [Google Scholar]
- 4. Berman P, Futoran K, Lewitus GM, et al. A new ESI-LC/MS approach for comprehensive metabolic profiling of phytocannabinoids in Cannabis. Sci Rep. 2018;8:14280. [DOI] [PMC free article] [PubMed] [Google Scholar]
- 5. Ramlugon S, Levendal R-A, Frost CL. Time-dependent effect of phytocannabinoid treatments in fat cells. Phyther Res. 2018;32:1080–1089 [DOI] [PubMed] [Google Scholar]
- 6. Levendal R-A, Schumann D, Donath M, Frost CL. Cannabis exposure associated with weight reduction and β-cell protection in an obese rat model. Phytomedicine. 2012;19:575–582 [DOI] [PubMed] [Google Scholar]
- 7. Le Strat Y, Le Foll B. Obesity and cannabis use: results from 2 representative national surveys. Am J Epidemiol. 2011;174:929–933 [DOI] [PubMed] [Google Scholar]
- 8. Rajavashisth TB, Shaheen M, Norris KC, et al. Decreased prevalence of diabetes in marijuana users: cross-sectional data from the National Health and Nutrition Examination Survey (NHANES) III. BMJ Open. 2012;2:e000494. [DOI] [PMC free article] [PubMed] [Google Scholar]
- 9. Anthony OA. Brief report: cannabis smoking and diabetes mellitus results from meta-analysis with eight independent replication samples. Epidemiology. 2015;26:597–600 [DOI] [PMC free article] [PubMed] [Google Scholar]
- 10. Adejumo AC, Alliu S, Ajayi TO, et al. Cannabis use is associated with reduced prevalence of non-alcoholic fatty liver disease: a cross-sectional study. PLoS One. 2017;12:e0176416. [DOI] [PMC free article] [PubMed] [Google Scholar]
- 11. Kim D, Kim W, Kwak M-S, et al. Inverse association of marijuana use with nonalcoholic fatty liver disease among adults in the United States. Strnad P, ed. PLoS One. 2017;12:e0186702. [DOI] [PMC free article] [PubMed] [Google Scholar]
- 12. Folch J, Lees M, Sloane-Stanley GH. A simple method for the isolation and purification of total lipides from animal tissues. J Biol Chem. 1957;226:497–509 [PubMed] [Google Scholar]
- 13. Schafer KA, Eighmy J, Fikes JD, et al. Use of severity grades to characterize histopathologic changes. Toxicol Pathol. 2018;46:256–265 [DOI] [PubMed] [Google Scholar]
- 14. Sander H, Wallace S, Plouse R, et al. Ponceau S waste: ponceau S staining for total protein normalization. Anal Biochem. 2019;575:44–53 [DOI] [PMC free article] [PubMed] [Google Scholar]
- 15. Cluny NL, Keenan CM, Reimer RA, et al. Prevention of diet-induced obesity effects on body weight and gut microbiota in mice treated chronically with Δ9-tetrahydrocannabinol. Bartolomucci A, ed. PLoS One. 2015;10:e0144270. [DOI] [PMC free article] [PubMed] [Google Scholar]
- 16. Levendal R-A, Schumann D, Donath M, et al. Cannabis exposure associated with weight reduction and β-cell protection in an obese rat model. Phytomedicine. 2012;19:575–582 [DOI] [PubMed] [Google Scholar]
- 17. Fowler CJ. Plant-derived, synthetic and endogenous cannabinoids as neuroprotective agents. Non-psychoactive cannabinoids, “entourage” compounds and inhibitors of N-acyl ethanolamine breakdown as therapeutic strategies to avoid pyschotropic effects. Brain Res Brain Res Rev. 2003;41:26–43 [DOI] [PubMed] [Google Scholar]
- 18. Koch JE. Δ9-THC stimulates food intake in Lewis rats: effects on chow, high-fat and sweet high-fat diets. Pharmacol Biochem Behav. 2001;68:539–543 [DOI] [PubMed] [Google Scholar]
- 19. Bellocchio L, Mancini G, Vicennati V, et al. Cannabinoid receptors as therapeutic targets for obesity and metabolic diseases. Curr Opin Pharmacol. 2006;6:586–591 [DOI] [PubMed] [Google Scholar]
- 20. Williams CM, Rogers PJ, Kirkham TC. Hyperphagia in pre-fed rats following oral δ9-THC. Physiol Behav. 1998;65:343–346 [DOI] [PubMed] [Google Scholar]
- 21. Järbe TUC, DiPatrizio NV. Δ9-THC induced hyperphagia and tolerance assessment: interactions between the CB1 receptor agonist Δ9-THC and the CB1 receptor antagonist SR-141716 (rimonabant) in rats. Behav Pharmacol. 2005;16:373–380 [DOI] [PubMed] [Google Scholar]
- 22. Silvestri C, Paris D, Martella A, et al. Two non-psychoactive cannabinoids reduce intracellular lipid levels and inhibit hepatosteatosis. J Hepatol. 2015;62:1382–1390 [DOI] [PubMed] [Google Scholar]
- 23. Panee J, Gerschenson M, Chang L. Associations between microbiota, mitochondrial function, and cognition in chronic marijuana users. J Neuroimmune Pharmacol. 2018;13:113–122 [DOI] [PMC free article] [PubMed] [Google Scholar]
- 24. Ley RE, Backhed F, Turnbaugh P, et al. Obesity alters gut microbial ecology. Proc Natl Acad Sci USA. 2005;102:11070–11075 [DOI] [PMC free article] [PubMed] [Google Scholar]
- 25. Shtriker MG, Peri I, Taieb E, et al. Galactomannan more than pectin exacerbates liver injury in mice fed with high-fat, high-cholesterol diet. Mol Nutr Food Res. 2018;62:1800331. [DOI] [PubMed] [Google Scholar]
- 26. Sobhonslidsuk A, Chanprasertyothin S, Pongrujikorn T, et al. The Association of Gut Microbiota with nonalcoholic steatohepatitis in thais. Biomed Res Int. 2018;2018:1–8 [DOI] [PMC free article] [PubMed] [Google Scholar]
- 27. Dao T-MA, Waget A, Klopp P, et al. Resveratrol increases glucose induced GLP-1 secretion in mice: a mechanism which contributes to the glycemic control. PLoS One. 2011;6:e20700. [DOI] [PMC free article] [PubMed] [Google Scholar]
- 28. Karlsson FH, Tremaroli V, Nookaew I, et al. Gut metagenome in European women—supply. Nature. 2013;498:99–103 [DOI] [PubMed] [Google Scholar]
Associated Data
This section collects any data citations, data availability statements, or supplementary materials included in this article.


