ABSTRACT
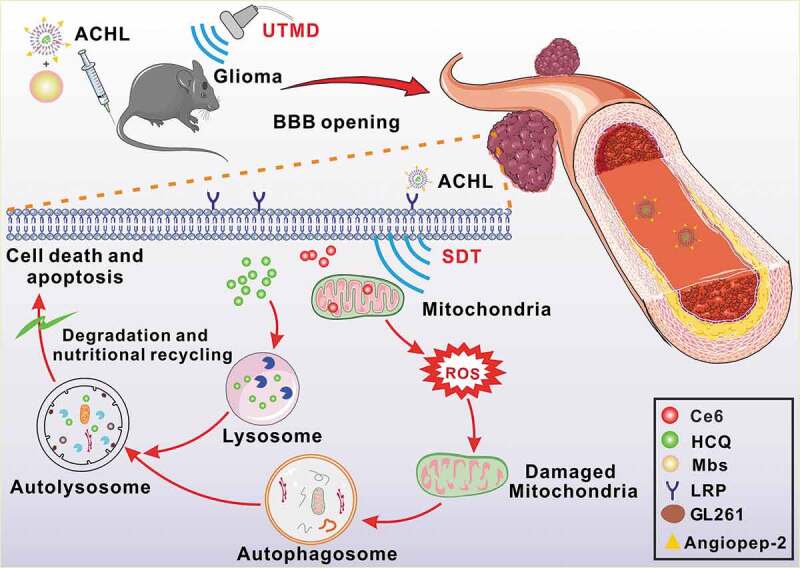
Limited penetration of chemotherapeutic drugs through the blood brain barrier (BBB), and the increased chemo-resistance of glioma cells due to macroautophagy/autophagy, result in high tumor recurrence and extremely limited survival of glioma patients. Ultrasound-targeted microbubble destruction (UTMD) is a technique of transient and reversible BBB disruption, which greatly facilitates intracerebral drug delivery. In addition, sonodynamic therapy (SDT) based on ultrasound stimulation and a sonosensitizer, can be a safe and noninvasive strategy for treating glioma. We innovatively designed a smart “all-in-one” nanosensitizer platform by incorporating the sonoactive chlorin e6 (Ce6) and an autophagy inhibitor-hydroxychloroquine (HCQ) into angiopep-2 peptide-modified liposomes (designated as ACHL), which integrates multiple diagnostic and therapeutic functions. ACHL selectively accumulated in the brain tumors during the optimal time-window of transient UTMD-mediated BBB opening. The nanosensitizer then responded to a second ultrasonic stimulation, and simultaneously unloaded HCQ and generated ROS in the glioma cells. The sonotherapy triggered apoptosis as well as MAPK/p38-PINK1-PRKN-dependent mitophagy, in which the antioxidant relieved the sonotoxicity and MAPK/p38 activation, while the inhibition of MAPK/p38 attenuated the progression toward mitophagy by compromising redistribution of PRKN. Moreover, HCQ blocking autophagosome degradation, augmented intracellular ROS production and resulted in an oxidative-damage regenerative loop. ACHL-SDT treatment using this construct significantly inhibited the xenograft-tumor growth and prolonged the survival time of tumor-bearing mice, exhibiting an improved therapeutic efficiency. All together, we demonstrated a precision sonotherapy with simultaneous apoptosis induction and mitophagy inhibition, which served as an intelligently strategic sense of working alongside, providing new insights into the theranostics of brain tumors.
Abbreviations
ACHL: Angiopep-2-modified liposomes loaded with Ce6 and hydroxychloroquine; ACL: Angiopep-2-modified liposomes loaded with Ce6; BBB: blood brain barrier; Ce6: chlorin e6; CHL: liposomes loaded with Ce6 and hydroxychloroquine; CL: liposomes loaded with Ce6; CNS: central nervous system; DDS: drug delivery system; EB: Evans blue; FUS: focused ultrasound; HCQ: hydroxychloroquine; LRP1: low density lipoprotein receptor-related protein 1; MAP1LC3/LC3: microtubule-associated protein 1 light chain 3; MAPK: mitogen-activated protein kinase; MBs: microbubbles; MTG: MitoTracker Green; MTR: MitoTracker Red; MTT: 3-(4,5-dimethylthiazol-2-yl)-2,5-diphenyltetrazolium bromide; PBS: phosphate-buffered saline; PDI: polydispersity index; PINK1: PTEN induced kinase 1; PRKN/parkin: parkin RBR E3 ubiquitin protein ligase; ROS: reactive oxygen species; SDT: sonodynamic therapy; SQSTM1: sequestome 1; TA: terephthalic acid; TEM: transmission electron microscopy; TUNEL: terminal deoxynucleotidyl transferase mediated dUTP nick-end labeling; US: ultrasound; UTMD: ultrasound-targeted microbubble destruction.
KEYWORDS: Blood brain barrier, mitophagy manipulation, nanosonosensitizer, orthotopic glioma, sonodynamic therapy
Graphical Abstract
Introduction
Glioblastoma, the most invasive primary central nervous system (CNS) tumor, has high morbidity, mortality and recurrence rate [1]. The median survival duration of glioma patients is less than 1 year, and the 5 year overall survival (OS) is a dismal 4% [2,3]. Glioma treatment is significantly restricted by the blood brain barrier (BBB), which apart from shielding the brain from potential neurotoxins, also impedes intracerebral delivery of chemotherapeutics [4]. In addition, autophagy also desensitizes the glioma cells to conventional therapies like surgery, chemotherapy and radiotherapy, thereby worsening patient prognosis [5,6]. Various strategies have been devised to improve BBB permeability to diagnostic and therapeutic compounds, such as conjugation of compounds with targeting ligands, modification of drug solubility or structure, direct intracerebral injection or intranasal administration [7,8]. Despite their potentials, these novel approaches have limited delivery efficiency and a high risk of adverse effects.
Ultrasound-targeted microbubble destruction (UTMD), a noninvasive technique that combines low-intensity focused ultrasound (FUS) with microbubbles (MBs) can transiently open the BBB with a high degree of spatial and temporal specificity [9]. FUS has been explored as a drug delivery platform for treating brain diseases [10] and involves in sonodynamic therapy (SDT) [11]. SDT relies on deep penetration of ultrasound (US) and tumor-specific accumulation of a sonosensitizer, has proved to be an effective, low-cost and safe anti-tumor therapy [12]. Our previous works on SDT have shown its anti-neoplastic effects on various cancers with great potential [13,14]. Studies also demonstrate significant therapeutic effects of SDT on glioma cells in vitro [15,16], while rarely focus on orthotopic gliomas.
The porphyrin derivative chlorin e6 (Ce6) is a second-generation sensitizer with potent acoustic activity, but its low bioavailability and poor delivery efficiency limit the overall therapeutic efficacy of SDT [17]. The nanosized sonosensitizers have been gradually emerging and greatly improved SDT outcomes [18]. The intensive sonoactivity of nanoCe6 remains unclear and deserves deep explorations. In addition, SDT often concomitantly initiates autophagic response during tumor cell apoptosis induction [19,20]. While, the role of autophagy in cancer therapies depends on the specified stimulus, the tumor cell type, severity of damage, and so on [21,22]. Most porphyrins have been reported to preferentially accumulate into mitochondria because of their specific porphyrin macrocycle structure and possible participation in heme anabolism [23]. It has also been reported that some porphyrins have high affinity with peripheral benzodiazepine receptor, which is an intracellular protein receptor located mainly on the outer mitochondrial membrane [24]. It is largely accepted that the primary reactive oxygen species (ROS) produced in SDT by the combination of a sonoactive porphyrin and US, would attack the biomolecules in the close vicinity of the sonosensitizer accumulation. Therefore, mitochondrion is usually a major target of sonotherapy. Then, the stimulated mitochondria will initiate the endogenously secondary mitochondrial ROS generation, which coordinates both the selective removal of mitochondria through mitophagy and the induction of cell apoptosis.
Mitophagy, or mitochondria-specific autophagy, refers to the selective elimination of dysfunctional or damaged mitochondria from stressed cells to ensure a healthy mitochondrial population [25]. Currently, a mechanism of mitophagy based on PINK1 (PTEN induced putative kinase 1) and PRKN/parkin (parkin RBR E3 ubiquitin protein ligase), is generally accepted [26]. When mitochondria are damaged and depolarized, PINK1 is stabilized on the outer membrane of mitochondria, leading to PRKN recruitment and facilitating impaired mitochondria for selective autophagic recognition [27]. Of note, recent researches indicate mitophagy protects cancer cells from extraneous stimuli like ROS or chemotherapy-induced apoptosis and death, thereby compromising the therapeutic outcome [28]. The ROS associated pathways such as MAPK (mitogen-activated protein kinase) and AMP-activated protein kinase (AMPK) have been identified to contribute to mitophagy [29]. However, the role of autophagy regulation differs in different types of tumor, and the interaction or conversion between mitophagy and apoptosis is complicated and not fully understood. Radogna F et al. recently reported that mitophagy as the key mechanism leading to failure of activation of the apoptotic pathway that increased resistance of chemotherapeutics [30]. Lin et al. showed that mitophagy was involved in tumor resistance to SDT by cleaning damaged mitochondria [31]. We also previously suggested that autophagy inhibition increased the SDT-induced cancer cell apoptosis [20]. Nevertheless, the mechanisms of how SDT induces mitophagy beyond damaged mitochondria remains unclear, and the role of mitophagy as well as the key molecules in execution of mitophagy have not been investigated in intractable gliomas.
Given the high-probability of autophagic self-protection in response to stresses, the potential synergistic anti-tumor effects of incorporating autophagy inhibitors into routine chemotherapy regimens are currently being explored in preclinical and clinical trials. The lysosomotropic agent hydroxychloroquine (HCQ) is the only clinically available autophagy inhibitor, but requires high doses that have serious side effects, thereby limiting its clinical application [32]. The toxic effects of HCQ can be minimized by encapsulating them in liposomal nanocarriers that have been successfully tested in targeting drugs to tumors [33]. Moreover, nanocarriers functionalized with angiopep-2, a specific ligand that can target LRP1 (low density lipoprotein receptor-related protein 1) on various tumors [34], are highly effective targeting delivery systems that increase antineoplastic drug accumulation in the tumors [35]. Taken together, a glioma targeting drug delivery system (DDS) that can effectively deliver Ce6 and HCQ across the BBB is urgently needed.
We designed an “all-in-one” nanosensitizer platform by incorporating Ce6 and HCQ into angiopep-2 peptide-modified liposomes (designated ACHL) for orthotopic glioma theranostics. An initial ultrasonic pulse (US1) destroyed the microbubbles and promoted the ACHL into the reversibly opened BBB, while a second ultrasonic stimulus (US2) generated the SDT effects. SDT-mediated mitophagy and its inhibition by HCQ were evaluated, along with the anti-glioma effects. We further showed that the MAPK/p38 signaling pathway contributed to the progression of mitophagy induced by nanoCe6-SDT. In summary, this is the first study to demonstrate a significant and synergistic anti-glioma effect of autophagic inhibition and SDT, using an “all-in-one” nanosensitizer.
Results
Characterization of the nano-sonosensitive DDS
DSPE-PEG2000-angiopep-2 was synthesized by conjugating DSPE-PEG2000-Mal with the cysteine residue of angiopep-2 peptide, as previously described [36]. The binding of cysteine residue and maleimide was confirmed by 1H NMR, which showed disappearance of the Mal peak, indicating that the Mal groups of DSPE-PEG2000-Mal were completely consumed by the sulfhydryl groups of angiopep-2 to form DSPE- PEG2000-angiopep-2 (Fig. S1A). The peptides reaction efficiency (PRE) was estimated by the reaction between cysteine residue and Ellman’s Reagent (DTNB) [37], as schematically shown in Fig. S1C. The sulfhydryl groups on the peptide react with DTNB to form TNB2- ions which can be tested spectrophotometrically at 412 nm. As shown in Fig. S1B, the reaction was completed 18 h later with approximate conjugation efficiency of 95%.
Liposomes are attractive DDS platforms on account of their biocompatibility, tumor accumulation ability and versatile loading capacities [38]. We formulated angiopep-2 loaded PEGylated liposomes using DSPC, DOPC, DSPE-mPEG2000 and cholesterol, and Ce6 and HCQ were respectively encapsulated into the hydrophobic lipid bilayer and hydrophilic core of the liposomes (Figure 1A). Altogether, we prepared four liposomal nano-sonosensitizers with Ce6: CL (liposomes loaded with Ce6), CHL (liposomes co-loaded with Ce6 and HCQ), ACL (angiopep-2 peptide-modified-liposomes loaded with Ce6), and ACHL (angiopep-2 peptide-modified-liposomes co-loaded with Ce6 and HCQ). The encapsulation efficiencies of Ce6 and HCQ in ACHL were 54.16 ± 2.19% and 63.21 ± 3.01% of their initial amounts respectively (Table 1). The average diameters of the CL, CHL, ACL and ACHL particles were 125.82 ± 2.09, 134.31 ± 2.63, 129.03 ± 2.48 and 143.74 ± 2.30 nm respectively (Figure 1C). The morphology of the different particles was observed by transmission electron microscopy (TEM), which showed a nearly spherical shape with favorable mono-dispersity (Figure 1B). No significant changes were seen in the diameter and particle size and polydispersity index (PDI) of the liposomal nanosensitizers over 7 d (Figure 1D and E), indicating their storage stability. In order to estimate the stability of ACHL in serum, which simulates the physiological state of the bloodstream, the liposomes were incubated in phosphate-buffered saline (PBS, KeyGEN Biotech Co. Ltd., KGB5001) containing 10%, 20% and 40% FBS. As shown in Figure 1F, no significant variation was seen in the particle sizes of ACHL after different incubation periods, indicating their potential stability in circulation.
Figure 1.
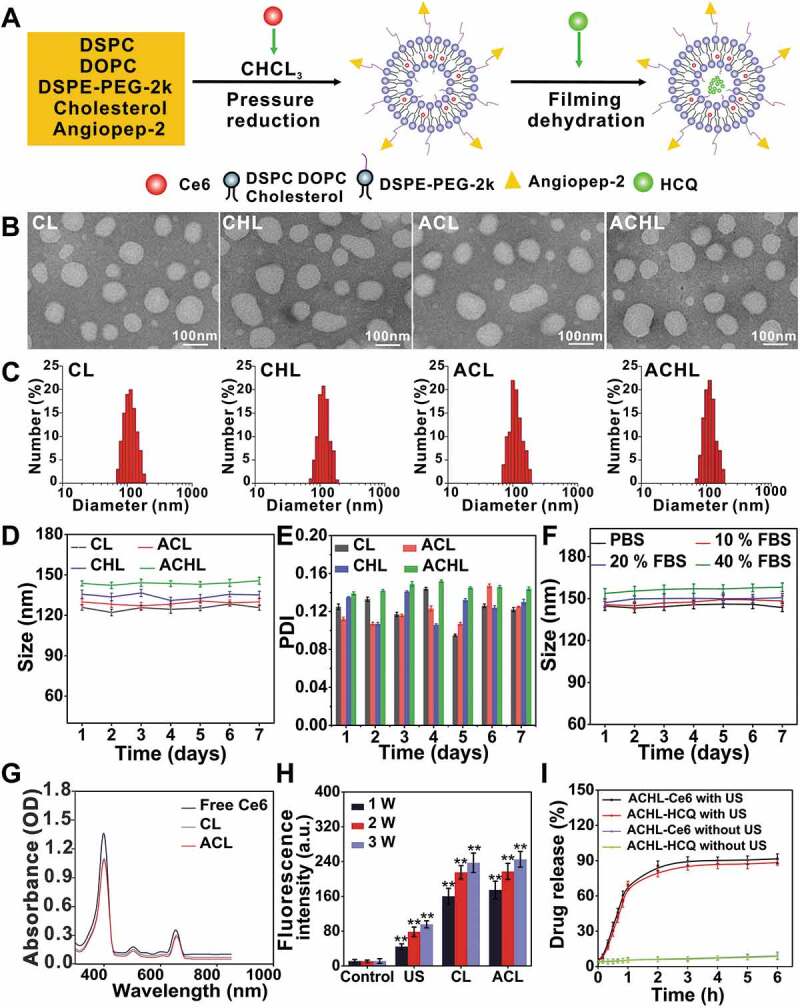
Synthesis and characterization of composite liposomes. (A) Illustration of the simple synthetic process of ACHL liposomes. (B) TEM images of different liposomes, scale bar: 100 nm. (C) Dynamic light scattering analysis of liposomes’ size distribution. (D and E) Changes of diameters and PDI distributions of liposomes after different storage time at 4°C. (F) Stability of ACHL in PBS buffer containing 10%, 20% and 40% fetal bovine serum after different storage time. (G) Absorption spectra of Ce6, CL, and ACL at 350–850 nm wavelength. (H) Evaluation the level of ·OH generation induced by US (load power of 1, 2, 3 W), using the TA method. (I) HCQ and Ce6 release from ACHL in the absence and presence of US (3 W, 60 s) in PBS (pH 7.4). Data are presented as mean ± SD of three independent assessments. **p < 0.01.
Table 1.
Size distribution, PDI, encapsulation efficiency (EE%), and drug loading (DL%) of different liposomes as assessed by DLS and spectrophotometry. (Data are mean ± SD, n = 3).
| Sample | Diameter (nm) |
PDI | EE(%)-Ce6 | EE(%)-HCQ | DL(%)-Ce6 | DL(%)-HCQ |
|---|---|---|---|---|---|---|
| CL | 125.82 ± 2.09 | 0.125 ± 0.003 | 82.46 ± 4.26 | – | 1.22 ± 0.04 | – |
| ACL | 129.03 ± 2.48 | 0.102 ± 0.009 | 77.63 ± 3.15 | – | 1.15 ± 0.02 | – |
| CHL | 134.31 ± 2.63 | 0.105 ± 0.03 | 66.74 ± 3.58 | 70.42 ± 2.88 | 0.99 ± 0.03 | 3.1 ± 0.07 |
| ACHL | 143.74 ± 2.30 | 0.104 ± 0.03 | 54.16 ± 2.19 | 63.21 ± 3.01 | 0.81 ± 0.04 | 2.8 ± 0.03 |
The absorption spectra of free Ce6, CL and ACL are shown in Figure 1G. Free Ce6 exhibited two strong absorption peaks at 403 nm and 654 nm that were virtually unaltered in the spectra of CL and ACL. Ce6 is an effective sonosensitizer that can significantly improve the acoustic cavitation effect. We use terephthalic acid (TA) to measure the hydroxyl radicals (·OH) in order to evaluate the level of cavitation [39]. The ·OH content of the CL and ACL suspensions increased following ultrasound exposure in an intensity-dependent manner, indicating a high level of cavitation (Figure 1H). Ultrasound-mediated release of Ce6 and HCQ from ACHL was measured using the following parameters: load power 3 W, frequency 1.0 MHz, and duration 60 s. As shown in Figure 1I, the rates of Ce6 and HCQ release were 69.45% and 67.53% within the first 1 h after US stimulation. During the next 5 h, Ce6 and HCQ in formulations maintained sustained releases until the end of the test. The drug leakage was lower than 10% within 6 h in the absence of US exposure. Drug release from ACHL in blood serum conditions is shown in Fig. S2A and B. After 48 h, the drug release from ACHL was lower than 15% in either 20% or 40% FBS. In short, we successfully developed a sono-sensitive liposomal DDS, wherein Ce6 boosted ROS generation for disrupting the liposome bilayer and triggering the local release of HCQ.
Angiopep-2 modified liposomes are selectively internalized by LRP1-expressing cells
To assess the potential selectivity of angiopep-2-modified liposomes, we tracked their uptake in the LRP1high GL261 glioma cells and bEND.3 endothelial cells, as well as the LRP1low NIH3T3 cells (Figure 2A and B), by measuring the red fluorescence of Ce6. As shown in Figure 2C and D, the Ce6 fluorescence intensity was significantly higher in the GL261 and bEND.3 cells compared to that in NIH3T3 cells, indicating that the angiopep-2-LRP1 binding was conducive to the internalization of ACL. Furthermore, intracellular ACL accumulation was time-dependent, peaking after 12 h of incubation. In addition, GL261 cells incubated with ACL exhibited significantly higher fluorescence compared to the cells incubated with either free Ce6 or CL (Figure 2E and F), further underscoring the brain tumor cell-targeting by angiopep-2 peptide. Based on these results, we hypothesized that the composite liposomes with Ce6 and HCQ would also be transported into glioma cells with the help of angiopep-2, and exhibit enhanced SDT.
Figure 2.
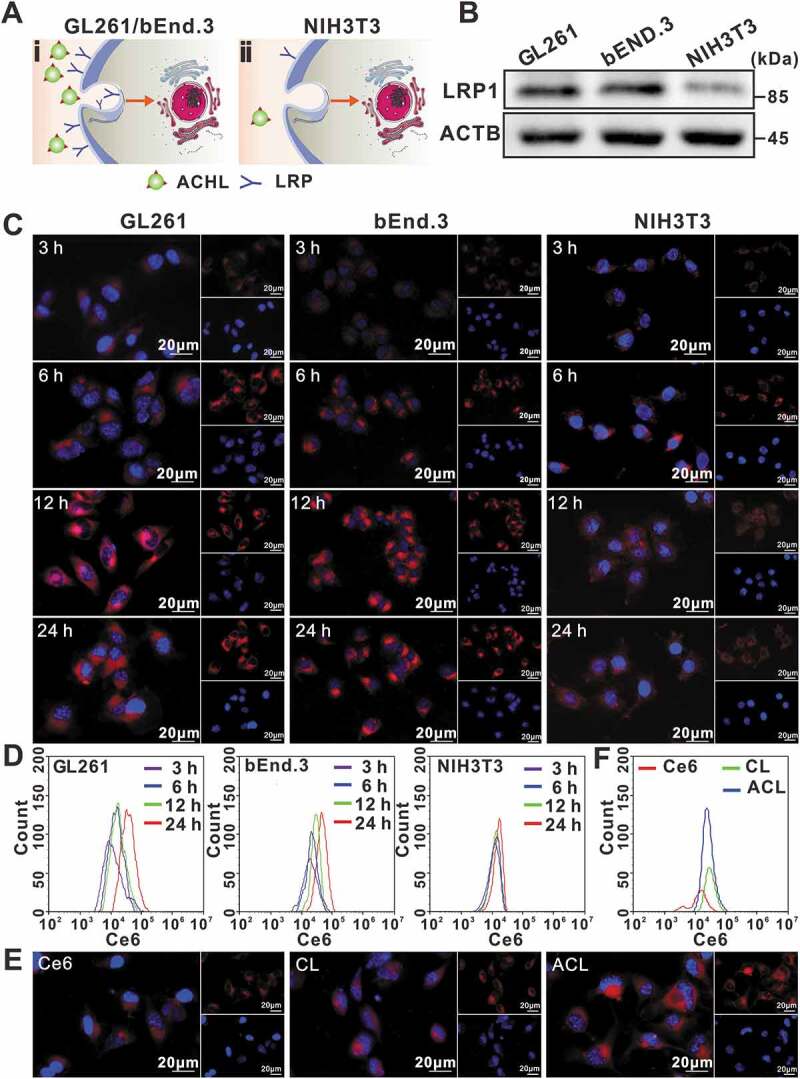
Cellular uptake of different liposomal formulations. (A) Schematic illustration of cells with LRP1 receptor at a high level on the cell surface (i), and relatively less LRP1 receptor (ii). (B) LRP1 expression levels in GL261, bEnd.3, and NIH3T3 cells, ACTB/β-actin was used as control. (C) Fluorescence microscope images of 3 h, 6 h, 12 h, 24 h cellular uptake of ACL in GL261, bEnd.3 and NIH3T3 cells. Nuclei were stained blue with DAPI, red fluorescence represented Ce6, scale bar: 20 µm. (D) Uptake of ACL by GL261, bEnd.3, and NIH3T3 cells, as measured by flow cytometry. (E) Representative fluorescence micrographs of GL261 cells treated for 12 h with free Ce6, CL and ACL (1 µg/mL Ce6 in each, scale bar: 20 μm). (F) Flow cytometry showing Ce6, CL and ACL in GL261 cells after 12 h incubation.
Ce6 preferentially accumulates in the mitochondria and enhances the cytotoxicity achieved with ultrasound stimulation
Notwithstanding the interactions of ligand-receptor, the liposomal drug delivery is very complicated. Liposomes can transport their cargos to cells by endocytosis, adsorption onto the cell surface, fusion with the cell membrane or lipid mixing mechanisms [40,41]. To determine the intracellular distribution of ACL in GL261 cells, we tracked the time-dependent subcellular localization of Ce6. As shown in Figure 3A, the time-dependent cellular uptake of Ce6 was shown and mainly overlapped with MitoTracker Green (MTG) after adding ACL, suggesting Ce6 mainly distributed onto mitochondria after liposomal delivery. Nevertheless, mitochondria are not the absolute accumulation sites of Ce6. Ce6 also partially corresponded with LysoTracker Green (LTG), as shown in Figure 3A. Therefore, we suppose the routes of liposomal Ce6 entering GL261 cells would be lipid membrane fusion and receptor-mediated endocytosis.
Figure 3.
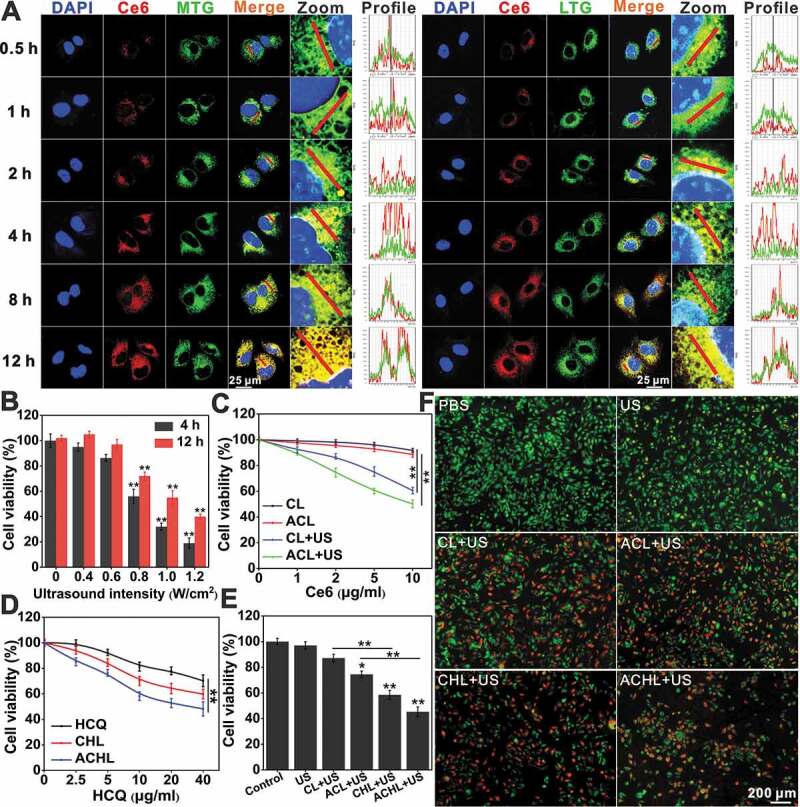
Subcellular localization and cell viability analysis of GL261 cells. (A) The time-dependent subcellular location of Ce6. Ce6 fluorescence (red), MTG (mitochondria probe) or LTG (lysosome probe) fluorescence (green), nuclear DAPI fluorescence (blue) were captured by confocal microscopy, scale bar: 25 µm. (B) GL261 cell viability after exposure to various ultrasound intensities at 4 h and 12 h by MTT assay. (C) After incubation with CL or ACL for 12 h, cells were exposed to US (0.6 W/cm2, 60 s) or not, then GL261 cell viability was measured at 4 h post treatment using MTT assay. (D) After incubation with HCQ, CHL and ACHL for 12 h, GL261 cells viability was detected by MTT assay. (E) After incubation with CL, AHL, CHL and ACHL for 12 h, GL261 cells viability was detected by MTT assay at 4 h post US treatment. (Ce6 = 2 µg/mL, HCQ = 5 µg/mL, US = 0.6 W/cm2). (F) Detection of cell survival by calcein AM/PI double staining of (E). Viable cells were stained green with calcein-AM, and damaged cells were stained red with PI. Scale bar: 200 µm. Data are presented as mean ± SD of three independent assessments. *p < 0.05, **p < 0.01.
The abundant accumulation of Ce6 in the mitochondria renders the glioma cells particularly vulnerable to SDT. To determine the cytotoxicity of the Ce6 and/or HCQ-loaded liposomes in GL261 cells, we tested their viability following ultrasonic stimulation, using parameters as previously described (Fig. S3A) [13]. As shown in Figure 3B, ultrasonic stimulation decreased the viability of glioma cells in an intensity-dependent manner, and 0.6 W/cm2 ultrasound radiation combined with CL/ACL showed synergistic SDT effects (Figure 3C). In contrast, neither CL nor ACL exhibited any significant cytotoxicity in the absence of an ultrasonic stimulus. Interestingly, ultrasound-triggered cytotoxicity was significantly greater when synergized with ACL compared to CL, indicating that higher Ce6 uptake due to angiopep-2 targeting resulted in superior SDT.
Furthermore, free HCQ, CHL and ACHL reduced cell viability in an HCQ dose-dependent manner, with greater toxicity of the liposomal-encapsulated compared to the free drug (Figure 3D). In addition, the survival of GL261 cells treated with CHL and ACHL were significantly lower compared to CL and ACL respectively, upon ultrasonic stimulation (Figure 3E). This indicates that HCQ aggravated the SDT effect, possibly by inhibiting the autophagy survival route and sensitizing the cells to SDT. Additionally, consistent with the higher ultrasound-triggered cytotoxicity of ACL vs CL, ACHL also showed stronger cytotoxic effects compared to CHL. Finally, cells exposed to ultrasound alone were not affected, whereas their viability progressively decreased when the Ce6 and/or HCQ loaded liposomes were added, with greater cytotoxic effects of ACHL/CHL compared to ACL/CL (Figure 3F). HCQ has been tested in preclinical and clinical trials either alone or in combination with other therapeutic agents, but high doses are accompanied by high cytotoxicity which limit its clinical use [42]. Loading HCQ in a nanocarrier can mitigate its adverse effects, since nanocarriers are known to improve the pharmacokinetic and pharmacodynamic properties of drugs while simultaneously enhancing targeted tumor delivery [33].
ACL-SDT initiates mitophagy in glioma cells
Mitophagy is a dynamic process that begins with engulfment of impaired mitochondria by an autophagic vesicles and ends with degradation in a lysosome. Recent studies show that ROS induced mitochondrial damage as main factor of SDT, which is also essential for the activation of mitophagy in an attempt to limit the propagation of oxidative damage and protect cells from mitochondrial apoptosis [31]. Thus, we tested whether intracellular ROS increased following ACL-SDT. As shown in Figure 4A, an abundant of ROS was observed post ACL+US treatment. Tumor cells reduce the number of mitochondria in response to elevated ROS level. As expected, both MTG and MitoTracker Red (MTR) staining showed the number of mitochondria decreased, and the mitochondrial morphology was visibly deformed (Fig. S4 and Figure 4B). Meanwhile, the cellular ATP level and the mitochondria membrane potential (MMP) also declined during loss of mitochondrial mass (Figure 4 C and D). To evaluate whether mitophagy was initiated by the synergy of ACL and ultrasonic stimulation, we simultaneously tracked autophagosomes/autolysosomes and mitochondria in the suitably treated glioma cells using Cyto-ID and MTR respectively [43]. As shown in Figure 4E, the red fluorescence signals of the labeled mitochondria strongly merged with the green fluorescence signals of the acidic organelles, indicating their co-localization. In addition, MTR-staining intensity was also used to quantify mitophagy, and as shown in Figure 4F, ACL-SDT-induced a significant decrease in fluorescence level compared to the untreated and the US or ACL-treated cells. Further, western blots showed that the inner mitochondrial membrane protein COX4I1/COX4 and the outer mitochondrial membrane protein TOMM20/TOM20 were degraded during loss of mitochondrial mass (Fig. 4G, 4H, 5A and 5B). Therefore, the observed mitochondrial structural changes and dysfunctions are proposed to be responsible for the mitophagy in the context of SDT.
Figure 4.
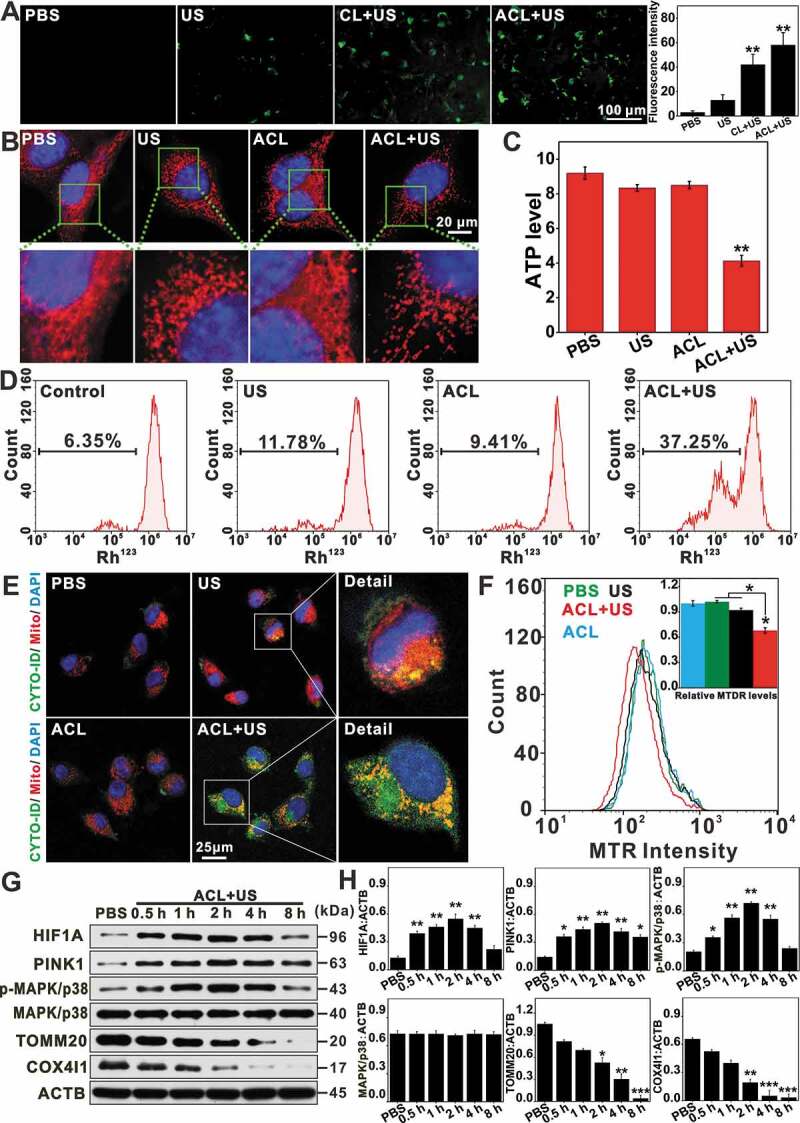
ACL-SDT initiated mitochondrial dysfunction and induced mitophagy in GL261 cells. (A) Fluorescence microscope was used to detect intracellular ROS with DCFH-DA at 0.5 h post treatment. The right channel indicates the average fluorescence intensity calculated from at least 10 fields of view per group, as represented in the left channel. (Green: stained with DCF, scale bar: 100 µm). (B) Images of MTR stained mitochondria were captured upon exposure to ACL-SDT, scale bar: 20 μm. (C) ATP level was measured in cells at 4 h post different treatments. (D) Mitochondrial membrane potential was evaluated at 1 h post treatment by employing Rh123 through flow cytometry. (E) After incubation with ACL for 12 h, the cells were sonicated, and co-localization of mitochondria and autophagic vacuoles was visualized by confocal microscopy. Mitochondria (red), autophagic vacuoles (green), nuclear DAPI (blue), scale bar: 25 µm. (F) MTR fluorescence values were measured by flow cytometry to reflect the mitochondrial staining changes. (G) Western blots show the indicated protein changes at different time points following ACL-SDT treatment (Ce6 = 2 µg/mL, US = 0.6 W/cm2). (H) Quantitative analysis for the indicated protein changes as compared with ACTB. Data are presented as mean ± SD of three independent assessments. *p < 0.05, **p < 0.01, ***p < 0.001.
Figure 5.
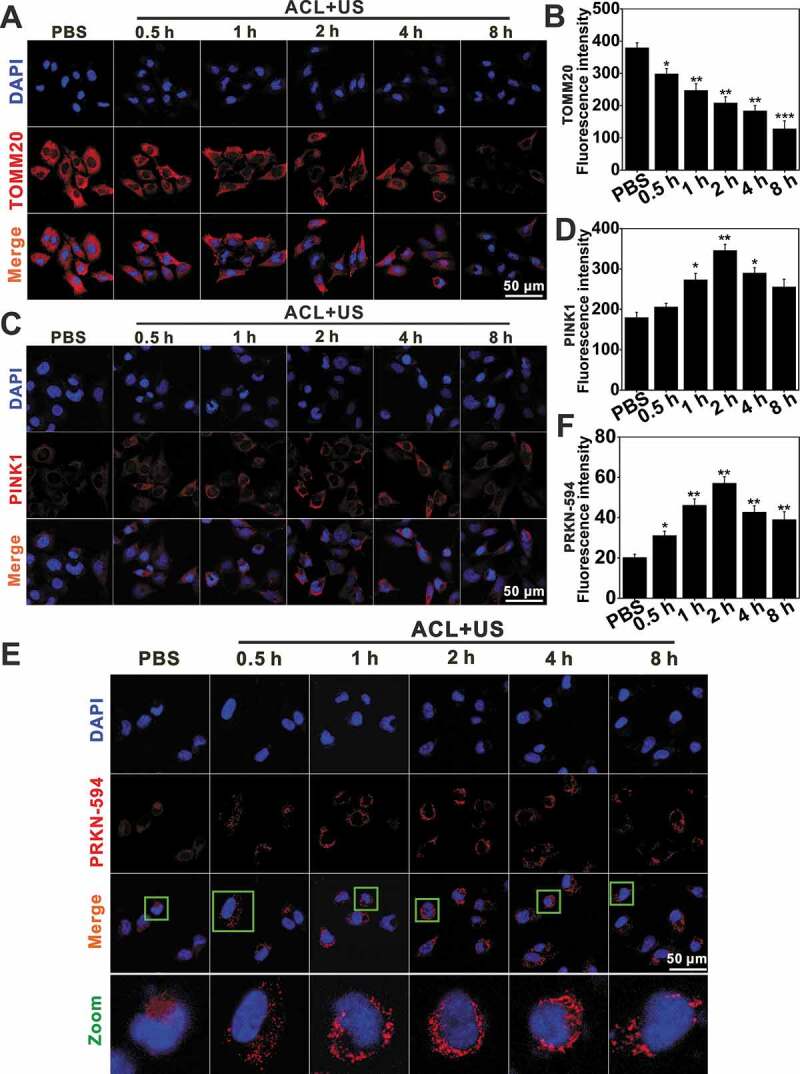
Mitophagy detection by immunofluorescence assay. Immunofluorescence of TOMM20 (A) and PINK1 (C) expression levels visualized by confocal microscopy, scale bar: 50 μm. (B and D) indicate the semi-quantifications of (A) and (C), respectively. At least 25 cells per experiment were analyzed. Quantitative analysis was from three independent experiments. (E and F) ACL-SDT-induced PRKN redistribution as observed by confocal microscopy. Representative images are shown in (E) with quantification data in (F), scale bar: 50 μm. At least 25 cells per experiment were analyzed. Quantitative analysis was from three independent experiments. (Ce6 = 2 µg/mL, US = 0.6 W/cm2) *p < 0.05, **p < 0.01, ***p < 0.001.
ROS-MAPK/p38-PINK1-PRKN-dependent signaling pathway is involved in ACL-SDT-induced mitophagy
We next evaluated the dependence of PINK1-PRKN in nanoCe6-mediated sonotherapy. Upon massive mitochondrial depolarization after ACL-SDT treatment, PINK1 selectively accumulated on the outer mitochondrial membrane as early as 0.5 h post treatment (Figure 5C and D), where it would phosphorylate and recruit both ubiquitin and PRKN. In this study, the obvious redistribution of PRKN occurred 1 h after exposure, peaked at 2 h and then gradually weakened (Figure 5E and F). Importantly, NAC partially reversed changes seen with ACL+US (Figure 6), suggesting ROS were responsible for mitophagy activation. The ACL+US-induced PINK1 and LC3-II accumulation and TOMM20 and COX4I1 degradation could be neutralized by the presence of NAC (Figure 6A and B). NAC also obviously decreased the cellular positive autophagic vesicles as determined by Cyto-ID staining (Figure 6D and E), and suppressed PRKN translocation to mitochondria induced by SDT (Figure 7B and D), suggesting ACL+US triggered PINK1-PRKN-dependent mitophagy via ROS in this study. Likewise, NAC reduced cellular ROS level (Figure 6C), neutralized the activation of cleaved CASP3/caspase-3 (Figure 6A and B), weakened apoptosis induction post SDT treatment (Figure 7A). Moreover, MAPKs pathways are usually involved in ROS induced cellular responses [44]. To assess whether ACL-SDT could activate MAPKs, the status of phosphorylation of MAPK/p38 and total MAPK/p38 were investigated by western blot. As shown in Figure 4G and H, MAPK/p38 phosphorylation was visibly increased in GL261 cell at 0.5 h post SDT, peaked at 2 h and then sustained at a higher level within 4 h. After that, the phosphorylation phenomenon gradually weakened. While, the total MAPK/p38 was not changed by SDT treatment. The phosphorylated MAPK/p38 was regulated by ROS generation, which showed significantly decreased phosphorylation by NAC (Figure 6A and B). Further, the pharmacological MAPK/p38 inhibition (SB 203,580) reduced mitophagic vacuolization (Figure 6D and E) and impaired PRKN accumulation (Figure 7B and D), thus aggravated the oxidative stress (Figure 6C) and apoptosis induction (Figure 7A) as well as cell toxicity (Figure 7C). The results suggest MAPK/p38 activation may precede and regulate PINK1/PRKN-mediated mitophagy. The related mechanisms of ROS-MAPK/p38-PINK1-PRKN-dependent mitophagy are proposed and shown in Figure 7E.
Figure 6.
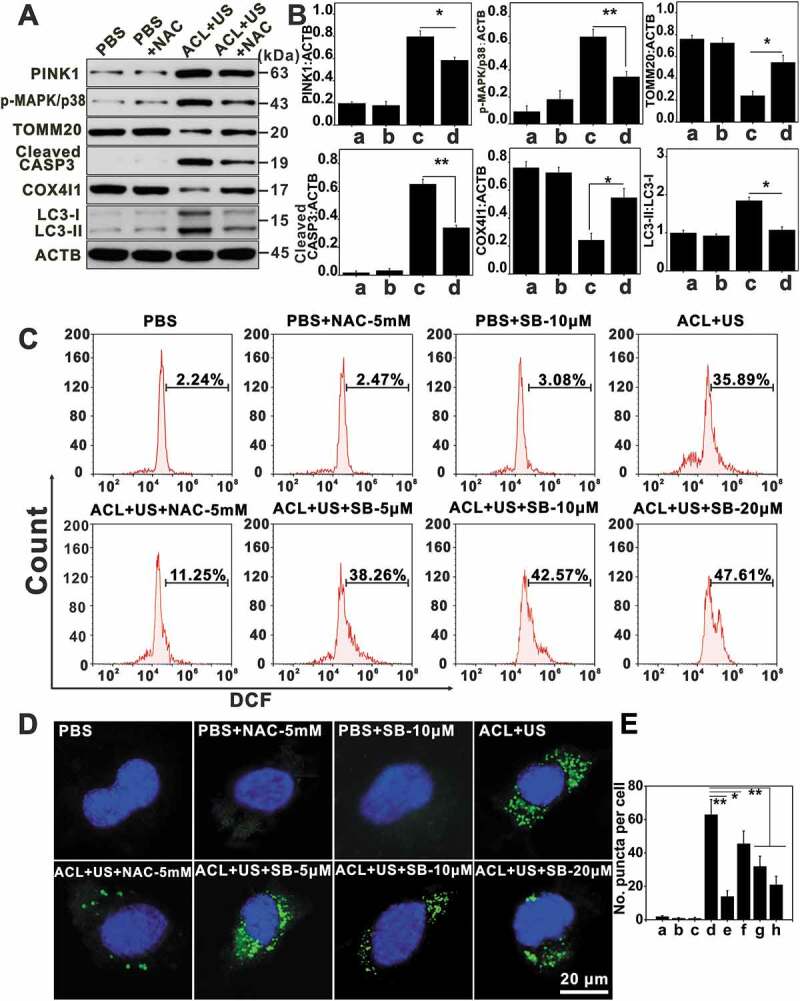
The potential mechanisms of ACL-SDT-induced mitophagy. GL261 cells were pretreated with NAC or SB 203,580 (SB) and then subjected to ACL-SDT. After ACL-SDT treatment 2 h, (A) western blots showed the indicated protein changes. (B) Quantitative analysis for the indicated protein level changes as compared with ACTB, data are presented as mean ± SD of three independent assessments. (a: PBS; b: PBS+NAC-5 mM; c: ACL+US; d: ACL+US+NAC-5 mM). (C) Detection of intracellular ROS with DCFH-DA at 0.5 h post different treatments in GL261 cells. (D) Confocal microscopy images of mitophagic vesicles visualized by Cyto-ID green staining. Mitophagic vesicles were stained green with Cyto-ID, nuclei were stained blue with DAPI, scale bar: 20 µm. (E) Quantification of (D), indicating Cyto-ID stained puncta. At least 25 cells per experiment were analyzed. Quantitative analysis was from three independent experiments. (a: PBS; b: PBS+NAC-5 mM; c: PBS+SB-10 μM; d:ACL+US; e: ACL+US+NAC-5 mM; f: ACL+US+SB-5 μM; g: ACL+US+SB-10 μM; h: ACL+US+SB-20 μM). (Ce6 = 2 µg/mL, US = 0.6 W/cm2) *p < 0.05, **p < 0.01.
Figure 7.
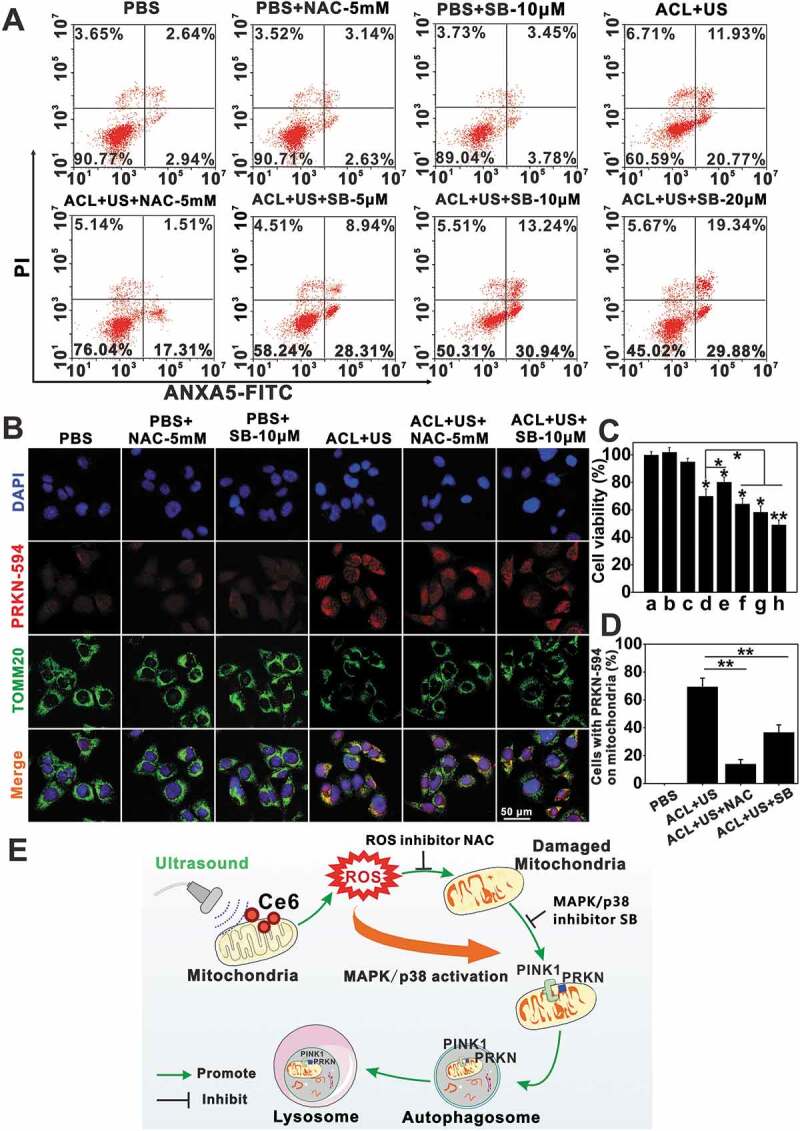
ROS-MAPK/p38-PINK1-PRKN-dependent mitophagy was involved in ACL-SDT. (A) At 2 h post treatment, GL261 cell apoptosis was detected using flow cytometry. (B) After ACL-SDT treatment 2 h, cells were fixed and subjected to immunofluorescent labeling with PRKN-594 (red), TOMM20 (mitochondrial marker, green), and nuclei (DAPI, blue). Scale bar: 50 µm. (C) Cell viability at 4 h post distinct treatment by MTT assay, data are presented as mean ± SD of three independent assessments. (a: PBS; b: PBS+NAC-5 mM; c: PBS+SB-10 μM; d:ACL+US; e: ACL+US+NAC-5 mM; f: ACL+US+SB-5 μM; g: ACL+US+SB-10 μM; h: ACL+US+SB-20 μM). (D) Quantification of PRKN-594 on mitochondria following treatments as described in (B), at least 25 cells per experiment were analyzed. Quantitative analysis was from three independent experiments. (E) The proposed mechanism for mitophagy activation by ACL-SDT. ROS generation by ultrasound activating liposomal Ce6 would be one of the key factors for mitochondrial dysfunction, and the subsequent phosphorylation of MAPK/p38 was regulated by ROS formation, which then triggered PINK1/PRKN mediated mitophagy. (Ce6 = 2 µg/mL, US = 0.6 W/cm2) *p < 0.05, **p < 0.01.
The innovative synergy between ACL-SDT and mitophagy inhibition in glioma cells
Tumor cells have evolved various strategies to avoid the effects of various treatments. One of the mechanisms is autophagy, which can protect tumor cells from apoptotic stimuli [45], and help develop resistance to chemotherapy, radiotherapy, immunotherapy and sonodynamic therapy [46]. To further determine the mitophagic flux in response to the different treatment modalities, we analyzed the expression levels of MAP1LC3/LC3 (microtubule-associated protein 1 light chain 3) and SQSTM1 (sequestosome 1). LC3 exists in cytosolic (LC3-I) and membrane-bound (LC3-II) forms, and an increase in the LC3-II:LC3-I ratio indicates autophagy [47]. As shown in Figure 8A and B, while an ultrasonic stimulation alone did not affect the mitophagic flux, the LC3-II/LC3-I ratio was significantly increased following exposure to CL/ACL. Furthermore, the amount of LC3-II was higher in the ACHL/CHL-treated compared to the CL/ACL-treated GL261 cells, indicating that HCQ blocked mitophagy and led to the accumulation of autophagosomes. In addition, the expression of SQSTM1 was also higher after ACHL-mediated SDT, indicating inhibition of endogenous protein degradation and an increase in the number of autophagic compartments. Electron microscopy is one of the best tools for investigating autophagy because it provides visualization of autophagosomes/autolysosomes that contain cytoplasmic materials and/or organelles at various stages of degradation. Figure 8E shows the targeting liposomal Ce6 plus US triggered cellular autophagic response which seemed to engulf the damaged mitochondria and the occurrence was more prominent by the presence of HCQ. The acidic autophagic vacuoles, another indicator of autophagy, were widespread in the SDT-treated (CL/ACL) cells, while the HCQ-loaded CHL/ACHL liposomes further increased the fluorescent punctate (Figure 9A and C), indicating that the autolysosome degradation pathway was inhibited in the presence of HCQ. The numerous mitophagy vacuoles are a result of the neutralization of lysosomal pH, which inhibit autolysosome degradation. The in situ distribution of LC3 in GL261 cells also showed similar trends, with more intense fluorescent punctate after CHL/ACHL compared to the CL/ACL-mediated SDT (Figs. 8F and 9B). We next performed the mCherry-GFP-LC3 assay in stably transfected GL261 cells. As shown in Figure 9D and E, control cells showed weak red and green fluorescence in which the merged yellow fluorescence diffused throughout the cytoplasm. While, the red puncta were visibly appeared in cells treated with CL/ACL+US because of the lysosomal quenching of the GFP fluorescence at acidic pH, indicating autophagy induction. Further, more obvious puncta appeared in yellow were presented in CHL+US and ACHL+US, in which the treatments simultaneously initiated autophagy and inhibited the distal degradation, thus increased the puncta accumulation. We also observed an increase in the number of puncta in angiopep-2-modified ACL/ACHL groups as compared with CL/CHL groups. The results are consistent with the aforementioned events, convincingly demonstrating mitophagy activation in the stimulated SDT conditions.
Figure 8.
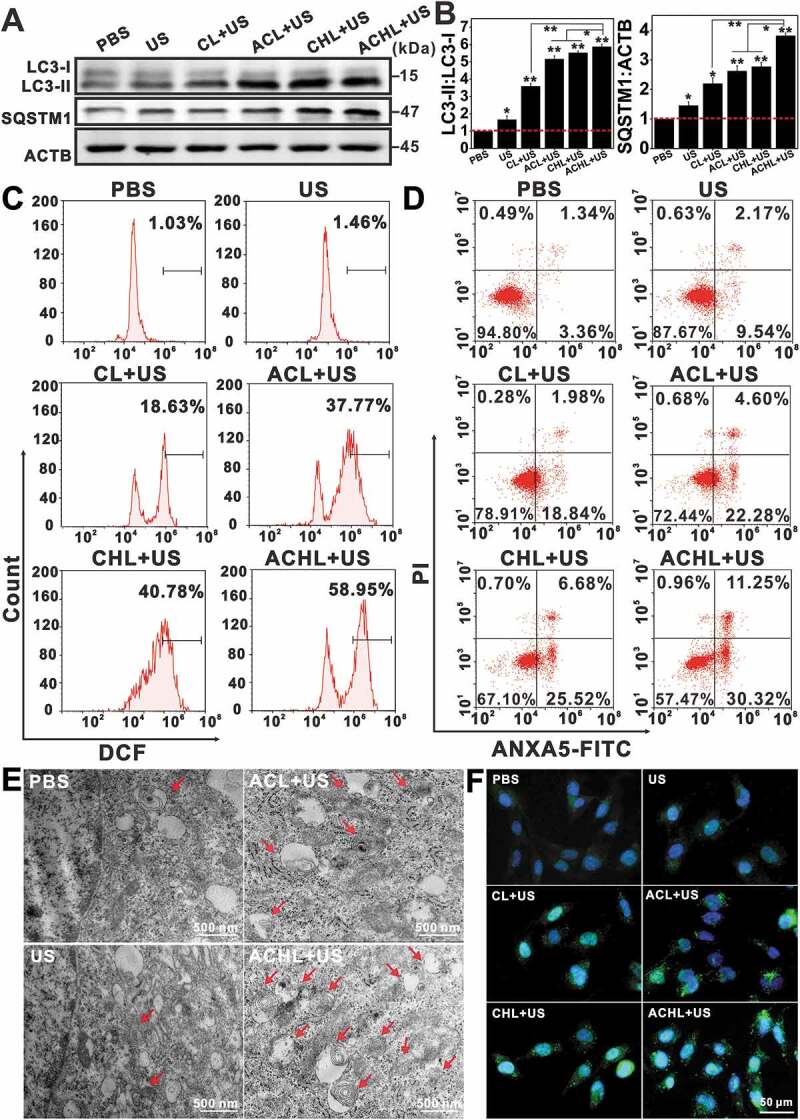
Evaluation of mitophagic vacuolization and the enhanced effects of ACHL-SDT. GL261 cells were seeded in cell culture dishes and cultured for 12 h. After incubation with the different liposome preparations for another 12 h, the cells were sonicated and cultured for 2 h, then subjected to different analysis. (A) Western blotting for LC3 and SQSTM1. (B) Quantification of the ratios of LC3-II:LC3-I and SQSTM1:ACTB in western blotting test, data are presented as mean ± SD of three independent assessments. (C) Detection of intracellular ROS with DCFH-DA at 0.5 h post different treatments in GL261 cells. (D) Apoptosis assessment at 2 h post different treatments using ANXA5-FITC-PI double-staining. (E) Representative electron micrographs of GL261 cells at 2 h post different treatments (Arrows: mitophagic vesicles, scale bar: 500 nm). (F) Changes of LC3 in GL261 cells visualized at 2 h by fluorescence microscope after different treatments, scale bar: 50 µm (LC3 were stained green with Anti-Rabbit IgG, nuclei were stained blue with DAPI). (Ce6 = 2 µg/mL, HCQ = 5 µg/mL, US = 0.6 W/cm2) *p < 0.05, **p < 0.01.
Figure 9.
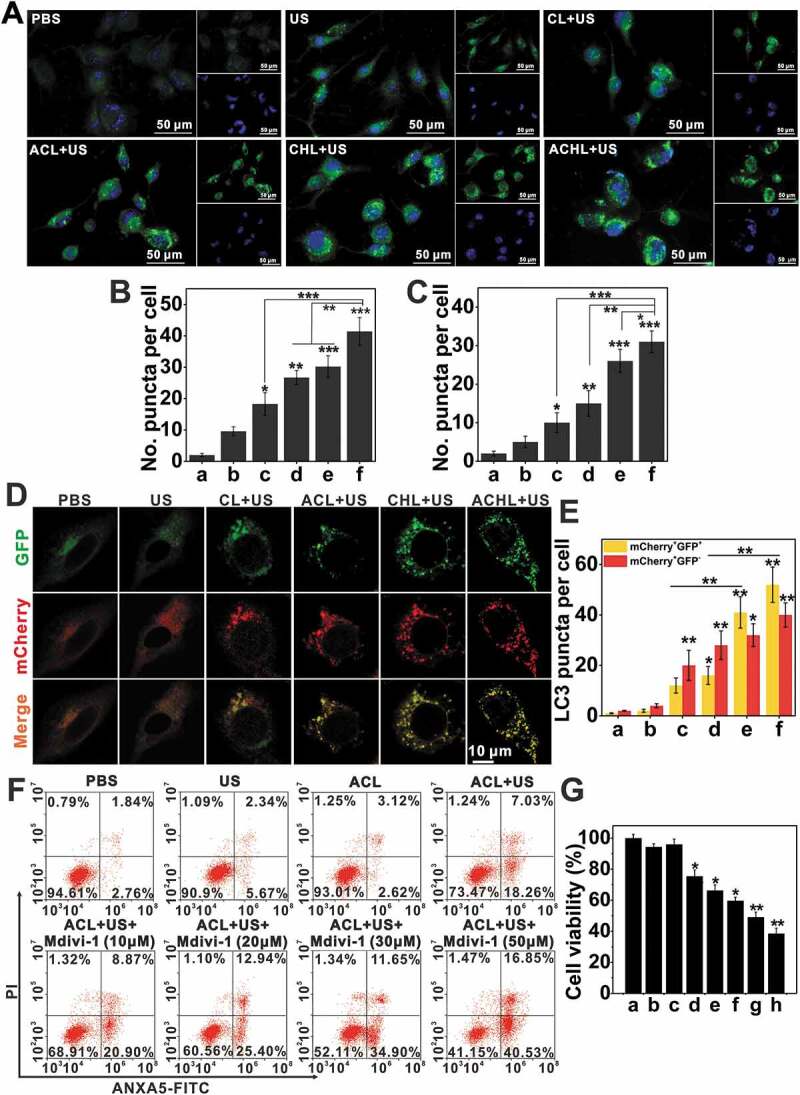
The synergy of ACL-SDT and autophagy inhibition. (A) Fluorescence microscope images of mitophagic vesicles visualized by Cyto-ID green staining at 2 h post different treatments. (Mitophagic vesicles were stained green with Cyto-ID, nuclei were stained blue with DAPI, scale bar: 50 µm). (B) Quantification of Cyto-ID green puncta in (A). (C) Quantification of LC3 green puncta as shown in Figure 8F. At least 25 cells per experiment were analyzed. Quantitative analysis was from three independent experiments. (a: PBS; b: US; c: CL+US; d: ACL+US; e: CHL+US; f: ACHL+US). (D) Representative epifluorescence images of GL261-mcherry-GFP-LC3 stable cells visualized by confocal microscopy at 2 h post different treatment. (E) The number of LC3-positive dots with mCherry+/GFP+ (yellow) and mcherry+/GFP− (red) was scored. At least 25 cells per experiment were analyzed. Quantitative analysis was from three independent experiments. (a: PBS; b: US; c: CL+US; d: ACL+US; e: CHL+US; f: ACHL+US) (F and G) GL261 cells were pretreated with Mdivi-1 and then subjected to ACL-SDT. After 2 h, cell apoptosis was assessed by flow cytometry (F), and cell viability was evaluated by MTT assay (G). Data are presented as mean ± SD of three independent assessments. (a: PBS; b: US; c: ACL; d:ACL+US; e: ACL+US+Mdivi-1 (10 μM); f: ACL+US+Mdivi-1 (20 μM); g: ACL+US+Mdivi-1 (30 μM); h: ACL+US+Mdivi-1 (50 μM); Ce6 = 2 µg/mL, HCQ = 5 µg/mL, US = 0.6 W/cm2) *p < 0.05, **p < 0.01, ***p < 0.001.
Increasing evidences show that the cellular damage caused by SDT is mediated by ROS [31], which primarily target the mitochondria. While, the initial sono-oxidative stress to mitochondria, would trigger the disruption of the reticular mitochondrial network and favor subsequent secondary mitochondrial ROS generation and mitophagy. As expected, CL+US and ACL+US respectively increased intracellular ROS levels to 18.63% and 37.77%, as measured by dichlorofluorescein (DCF) fluorescence (Figure 8C). Consistent with our results so far, ACHL significantly enhanced ROS levels to 58.95% in the GL261 cells under ultrasonic stimulation due to the targeted delivery via angiopep-2, as compared with 40.78% in CHL+US. The results suggest that the presence of HCQ blocked the degradation of autophagosomal contents, and therefore increased accumulation of the number of vesicles. Autophagy inhibition augmented the endogenous ROS production in dysfunctional mitochondria, and generated a positive feedback loop for ROS, which would further improve clearing of glioma cells. ANXA5/annexin V-FITC-PI staining showed significantly higher apoptosis rates in the cells treated with CHL/ACHL compared to CL/ACL in the presence of an ultrasonic trigger, due to the action of synergistic effects of HCQ and SDT (Figure 8D). Whereas, fewer apoptotic cells were seen in the absence of angiopep-2 targeting, underscoring the impact of targeted cellular uptake on the drug efficacy. Meanwhile, we also evaluated the inhibition of mitophagy using Mdivi-1 (Figure 9F, 9G and S5). ANXA5/annexin V-FITC-PI staining and MTT assay show that as the concentration of Mdivi-1 increased, the apoptosis rates and cytotoxicity increased accordingly, suggesting Mdivi-1 neutralized the adaptive mechanism of oxidative damage in tumor cells and markedly improved the effects of ACL-SDT. In conclusion, ACL-SDT-induced mitophagy served a protective function in GL261 cells, while blocking mitophagy greatly enhanced the therapeutic efficacy of sonotherapy against gliomas.
UTMD triggered BBB disruption in vitro and in vivo
BBB is a major physiological barrier to anti-glioma drugs [4], making it necessary to open the BBB transiently and reversibly during the therapeutic window. FUS with MBs disrupt the tight junction molecules with sub-millimeter precision, and result in vascular endothelial cell sonoporation, which enable delivery of large molecules including antibodies and growth factors to the CNS [9]. We used a well-established in vitro BBB model to evaluate UTMD-mediated BBB disruption (Figure 10A) [3]. Briefly, a certain amount of MBs was added to the cells followed by sonication (0.6 W/cm2, 60 s), and the ultrasound-triggered release of Ce6 from CL and ACL was measured. As shown in Figure 10B and C, ultrasonic stimulation resulted in significantly higher Ce6 release compared to the unstimulated controls, indicating that UTMD can disrupt the BBB in vitro. As expected, the fluorescence intensity was higher in the ACL- compared to the CL-treated cells.
Figure 10.
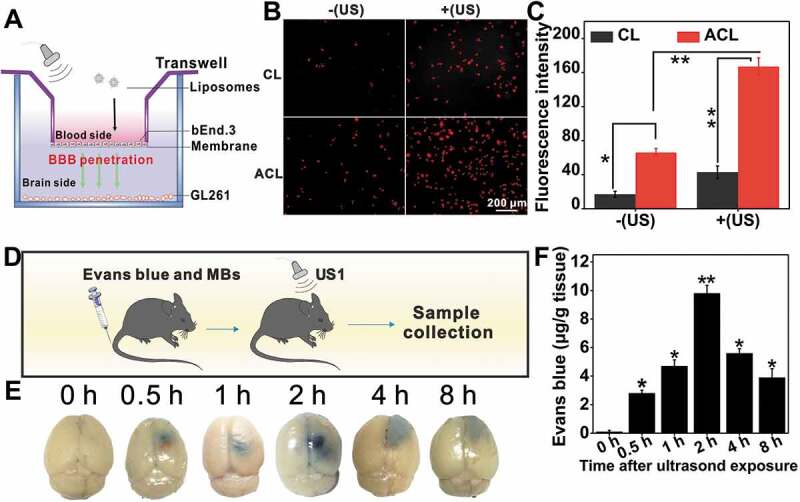
BBB opening in vitro and in vivo. (A) Illustration of the in vitro BBB model using a Transwell system to evaluate the penetration capability of ultrasound to across the endothelial monolayer. (B) The CL and ACL were added into the upper chambers of the Transwell at a Ce6 concentration of 1 μg/mL for incubation at 37°C for 12 h. Transporting efficiency of liposomes with or without US was measured by Inverted fluorescence microscope at 1 h, scale bar: 200 µm. (C) Quantification of the Ce6 fluorescence intensity with or without US, data are presented as mean ± SD (n = 12 images per group). (D) Illustration of UTMD-induced BBB opening in C57BL/6 mice. (E) Localized leakage of EB at various times after exposed to US. (F) The corresponding quantification of dye content in (E), data are presented as mean ± SD (n = 3 mice per group). *p < 0.05; **p < 0.01.
BBB opening in vivo was tracked using Evans blue (EB) [48]. As shown in Figure 10D-F, animal brains injected with MBs and exposed to US showed a time-dependent localized leakage of EB, indicating transient BBB opening in response to sonication. The gradual accumulation of EB in the brain resulted in optimal BBB permeability after 2 h. Due to its extravasation, EB accumulation decreased with the gradual closure of BBB and only a small amount was detected at 8 h. Based on these results, we injected the liposomes 2 h after UTMD to maximize their accumulation at the tumor site. UTMD could be a feasible and promising strategy for precision drug delivery in orthotopic gliomas.
In vivo glioma targeting and biodistribution
The in vivo delivery and penetration of different liposomes in the glioma tissues in the presence and absence of UTMD were tracked by labeling the liposomes with DIR, which exhibits strong fluorescence emission in the near-infrared region, instead of Ce6. As shown in Figure 11A and B, ultrasonic stimulation resulted in significantly higher DIR accumulation compared to the unstimulated controls. At 36 h post treatment, the fluorescence intensity of DL+US1 is 1.88 times higher than that in DL, and the fluorescence intensity of ADL+US1 is 3.33 folds of ADL, indicating that UTMD opening the BBB caused higher drug accumulation. Meanwhile, ADL is 1.41 times the fluorescence intensity of DL, and the fluorescence intensity of ADL+US1 is 4.69 folds of DL, suggesting UTMD combined with angiopep-2 can achieve more efficient drug enrichment. Examination of the sections of brains and main organs after 36 h showed selective accumulation of ADL in the brain (Figure 11C and D). Although angiopep-2-modified nanocarriers alone are likely to enhance nanoparticles delivery across the BBB, the enhancement is undoubtedly insufficient considering the high resistance of this barrier and the uncertain receptor-dependent expressions [35]. UTMD has shown great potentials in increasing the efficiency of nanoparticle-based drug delivery across biological barriers without causing cellular damages [10]. UTMD plus angiopep-2 could ensure resolving the first tissue obstacle and the secondary transmembrane transportation, offering an excellent technical cooperation platform for enhancing glioma-specific drug delivery.
Figure 11.
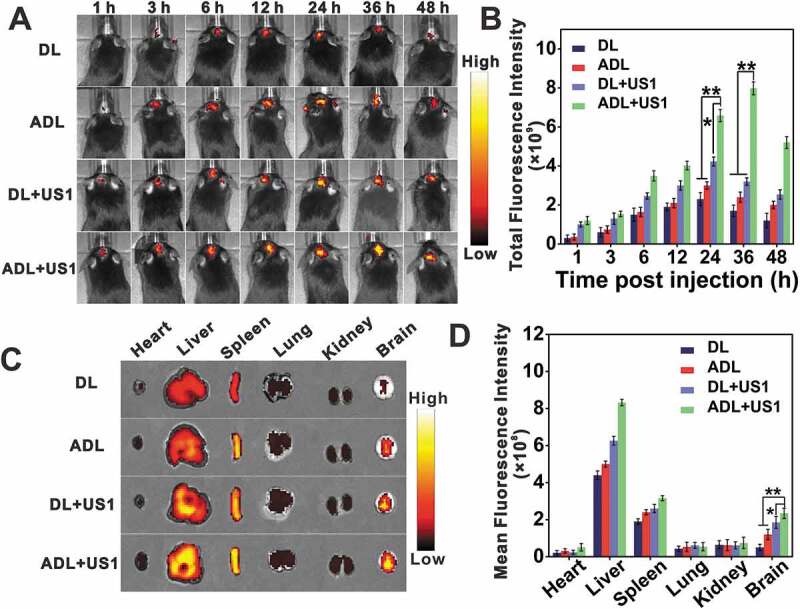
In vivo targeting efficiency of liposomes. C57BL/6 mice bearing GL261 tumors were injected with DIR-liposomes (DL) or Angiopep-2-DIR-liposomes (ADL), followed by ultrasonic pulse or not. (A) In vivo biodistribution of DIR encapsulated liposomes via intravenous injections. (B) Quantification of total fluorescence intensity of brains at different times after injection, data are presented as mean ± SD (n = 3 mice per group). (C) Ex vivo images of brains and other tissues at 36 h. (D) Quantification of the mean fluorescence intensity of brains and other tissues at 36 h, data are presented as mean ± SD (n = 3 mice per group). *p < 0.05, ** p < 0.01.
ACHL augments the anti-glioma effects of SDT by inhibiting autophagy
The synergistic anti-tumor effects of SDT and mitophagy inhibition were analyzed in vivo using an orthotopic GL261-luc model that was established in C57BL/6 mice by stereotactic intracranial injection of 2 × 10⁵ GL261-Luc cells into the cortex (Figure 12A) [49]. The mice were injected, 7, 12 and 17 d later, with the different liposomal formulations and sonicated as previously described (Fig. S3B) [25]. An initial pulse (US1) was given to open the BBB, followed by liposome injection and a second continuous pulse (US2) was given 36 h post administration to trigger drug release from the liposomes. Glioma growth was monitored via bioluminescence (Figure 12B) [50]. The bioluminescence intensity increased significantly in the untreated and only sonicated mice, while significant tumor growth inhibition was seen in mice injected with Ce6 and/or HCQ-loaded liposomes. In addition, the angiopep-2-labeled liposomes resulted in considerable glioma retardation by day 21 post-treatment, while the therapeutic effects of the non-targeted liposomes were slightly inferior (Figure 12C). Therefore, the combination of SDT and HCQ-mediated mitophagy inhibition abrogated tumor growth in vivo.
Figure 12.
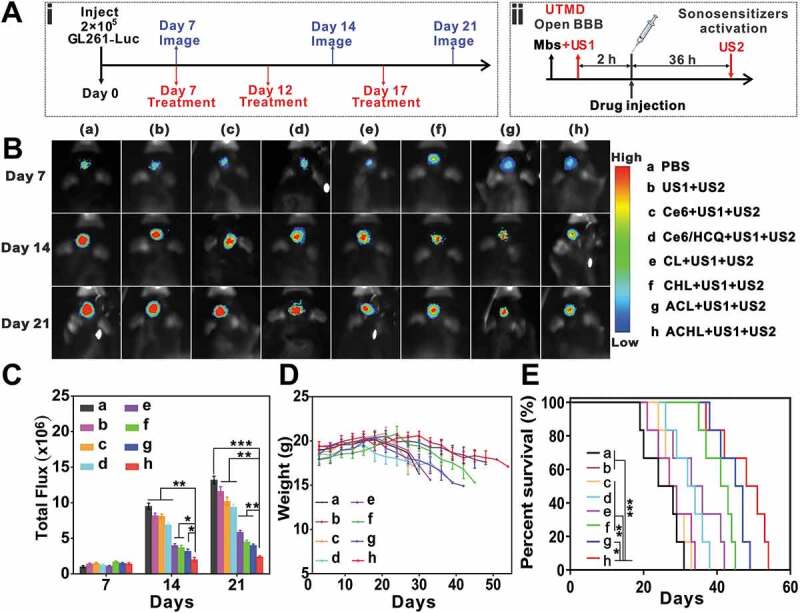
Anti-glioma efficacy in vivo. C57BL/6 mice were injected intra-cranially with GL261-luc cells to establish glioma xenografts. On days 7, 12 and 17 after implantation, an initial ultrasonic pulse (US1) was given to open the BBB, followed by liposomal injections at the dosage of 5 mg/kg Ce6 and 30 mg/kg HCQ. Thirty-six hours after drug administration, a continuous ultrasonic pulse (US2) was given for SDT. (A) Illustration of three repeats of sequential MBs injection, ultrasound implement and nanoparticle administration (i) and one SDT treatment procedure (ii). (B) Bioluminescent signal correlating to tumor growth over time. (C) Quantification of the tumor bioluminescence signal, data are presented as mean ± SD (n = 6 mice per group). (D) Body weight changes (n = 6 mice per group). (E) Survival time of GL261-bearing mice after different treatment, data are presented as mean ± SD (n = 6 mice per group). *p < 0.05, **p < 0.01, ***p < 0.001.
To further estimate the therapeutic efficacy of this treatment modality, the body weight and overall survival of the mice were also monitored (Figure 12D and E). The respective median survival durations of mice in the PBS, US1+ US2, Ce6+ US1+ US2, Ce6/HCQ+US1+ US2, CL+US1+ US2, CHL+US1+ US2, ACL+US1+ US2 and ACHL+US1+ US2 groups were 24, 28, 27.5, 33, 34.5, 40, 44 and 52 d. Compared to the untreated mice, the ACL+US1+ US2 and ACHL+US1+ US2 groups survived longer, and underwent slower body weight loss. This indicates that targeted inhibition of tumors significantly reduced toxicity to other organs.
Histopathological evaluation showed a significantly reduced demarcation between the glioma and normal tissues, as well as high cell-density glioma tissue in the untreated, sonicated-only and free drugs-treated groups. In contrast, the ACL+US1+ US2 and ACHL+US1+ US2 groups showed relatively sparse glioma tissues, indicating tumor growth inhibition (Figure 13A). In addition, terminal deoxynucleotidyl transferase mediated dUTP nick-end labeling (TUNEL) indicated significant apoptosis in the glioma tissues of ACL/ACHL-treated groups (Figure 13B and E), in addition to increased levels of LC3 (Figure 13C and F) and more numerous autophagic vesicles (Figure 13D) compared with the other groups. Finally, histological examination of the major organs (i.e., the heart, liver, spleen, lungs and kidney) showed negligible organ damage, implying good biosafety of the liposomal formulations (Fig. S6). To summarize, SDT as a noninvasive technique that can penetrate into the skull and target glioma cells upon activation of the sonosensitizer. Our nano-sonosensitizer platform showed excellent BBB-traversing and glioma-targeting abilities via UTMD and angiopep-2 peptide modification. The SDT effects were significantly enhanced by the autophagy inhibitor HCQ.
Figure 13.
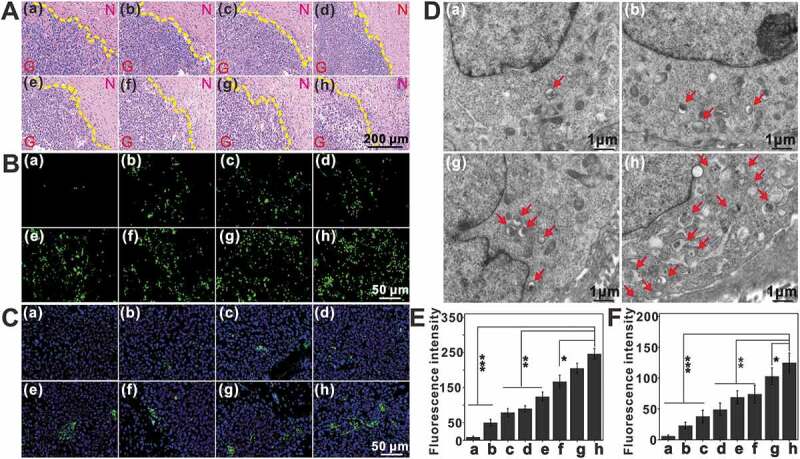
Assessment of tumor cell apoptosis and autophagic vesicles post treatment in situ. One day after the last injection, the brains from different groups were resected, and processed for tissue sections. (A) H&E staining revealed the damage of glioma tissues in each group. N: normal brain section. G: glioma section, scale bar: 200 μm. (B) TUNEL staining of glioma tissues, scale bar: 50 μm. (C) Changes of LC3 in glioma tissue visualized by fluorescence microscope after different treatment using DAPI counterstain, scale bar: 50 μm. (D) Representative electron micrographs of tumors after treatment, arrows indicate autophagic vesicles, scale bar: 1 μm. (E and F) Quantification of TUNEL (E) and LC3 (F) fluorescence intensity, data are presented as mean ± SD (n = 12 images per group). (a: PBS; b: US1+ US2; c: Ce6+ US1+ US2; d: Ce6/HCQ+US1+ US2; e: CL+US1+ US2; f: CHL+US1+ US2; g: ACL+US1+ US2; h: ACHL+US1+ US2) *p < 0.05, **p < 0.01, ***p < 0.001.
Discussion
Glioma is one of the most common and challenging malignant tumors in clinic. The particular tumor location, blood-brain barrier and complex tumor microenvironment cause glioma cells resistant to various treatments [51]. Meanwhile, autophagy contributes a lot to brain tumor growth and provides a tricky protection in response to different therapeutics [52]. Recently emerged SDT displays substantially executable space in glioma therapy because US has a unique advantage that can propagate through deep tissue and its energy can be focused specifically into the target with minimal effects on surrounding normal tissues [18]. In addition, the noninvasive and nonionizing features of US qualify repetitive stimuli and would not cause long-term cumulative effects [53]. Especially the rapid development of nanotechnology provides a new strategy to improve the bioavailability of sonosensitizer [51], enabling highly efficient and precise sonotheranostics.
In this work, we designed a smart nanosensitizer (ACHL) to address two main concerns regarding to i) a feasible and promising strategy for precision drug delivery in orthotopic gliomas, ii) the potentially synergistic mechanism of sonodynamic therapy and mitophagy inhibition. The developed nanoplatform integrated porphyrins’ multi-functions into ultrasound-responsive remedy. UTMD was applied for the first level of tissue targeting with the help of selective focus of US, then the second level of cell targeting was attained by angiopep-2 interaction with LRP1 that highly expressed on glioma cells. Finally, HCQ augmented the anti-tumor effects by inhibiting protective mitophagy induced by SDT, and the intracellular activities were evaluated from apoptosis, autophagy, and the interaction of both sides. Such multi-stage regulatable strategy achieved more efficient enrichment of nanotherapeutics. Therefore, the developed precise manipulation of mitophagy and noninvasive sonotherapy may offer an alternative strategy for glioma therapy with high efficiency and safety. The design concept of stepwise refinement would allow better SDT effects and the mechanically-based synergy.
The characteristic features of ACHL showed high stability under storage as well as in blood circulation. US exposure constantly stimulated both Ce6 and HCQ release, which involved a sonochemical and mechanical stress to disturb the stability of porphyrin liposomes [53]. Because of the high spatial and temporal controllability of US, the extracorporeal sonotherapy is of great promise in biomedicine. We previously investigated the US-responsive ability of porphyrin sensitizers, and found that SDT-induced ROS triggered concurrent autophagy during mitochondria-dependent apoptosis [54]. However, the way of ROS modulated autophagy-apoptosis crosstalk, as well as the autophagy inhibition enhancing SDT efficacy have been rarely concerned. The present study firstly identified mitophagy in response to ACL-SDT treatment. During the oxidative apoptosis induction, mitophagy was also activated since removal of harmful organelles is an early instinctive response that promotes cells survival through the adaption to stress [25]. It was observed a burst of ROS production followed by mitochondrial dysfunctions in GL261 cells. Mitochondria lost their tubular morphology and appeared as punctate structures, meanwhile, the cellular ATP level and the mitochondrial membrane potential (MMP) decreased significantly, implying the initiation of mitophagy after ACL-SDT treatment. Further TEM observation, fluorescence microscopy monitoring, western blotting assay, mCherry-GFP-LC3B fluorescence reporter, as well as the mitochondria mass evaluation all convincingly demonstrated ACL-SDT-induced mitophagy in the stimulated conditions. The most paradigmatic mitophagy pathway to date is mediated by PINK1/PRKN. Our results showed the ACL-SDT stabilized PINK1 on the outer mitochondrial membrane, which acted as a molecular sensor of mitochondrial damage, then promoted PRKN translocation from cytosol to mitochondria. The activated PRKN ubiquitylated outer mitochondrial membrane proteins and mediated efficient mitochondrial priming into autophagic machinery [55]. These suggest PINK1/PRKN pathway was involved in ACL-SDT-induced mitophagy in GL261 cells. Other mitophagy pathways may also exist concurrently which need to be explored in the future. Notably, the addition of NAC, could inhibit SDT-induced ROS generation and PINK1/PRKN mediated mitophagy, suggesting ROS were responsible for mitophagy activation in this study. This was consistent with others’ studies about mitophagy activation via oxidation [56,57]. Moreover, ROS are known to activate MAPKs, and MAPK/p38 has been shown to regulate a wide variety of cellular events, including cell survival and death [44,58]. Xue et al. reported that MAPK/p38 activation followed by ROS generation might be a core component in Ce6-phototherapy-induced autophagy [59]. In this study, after ACL-SDT treatment, the phosphorylation of MAPK/p38 significantly increased and could be attenuated by the antioxidant NAC, and the inhibition of MAPK/p38 using SB 203580 partially prevented SDT-induced mitophagy as well as PRKN translocation, suggesting ACL-SDT-induced mitophagy might be regulated by MAPK/p38 and could be PINK1/PRKN-dependent.
As mitophagy is a homeostatic process in which the damaged mitochondria are degraded, along with the recycling of digested products to sustain cellular metabolism [60]. In many established tumors, mitophagy acts as a self-defense mechanism to promote cancer cell survival after chemotherapy or radiation therapy [31]. Therefore, if this degradation pathway is inhibited to prevent its protective effect, it will be more conducive to the maximization of apoptosis. Yan et al. reported that inhibition of mitophagy by silencing BNIP3L enhanced the sensitivity of doxorubicin in colorectal cancer stem cells [61]. Zhou et al. pointed that a novel inhibitor liensinine could sensitize breast cancer cells to chemotherapy by mitophagy inhibition through DNM1L-mediated mitochondrial fission [62]. In the present study, inhibition of mitophagy using Mdivi-1 or inhibition of autophagy using HCQ neutralized the tumor cell adaptation in response to oxidative injury, and greatly improved the SDT therapeutic effect, indicating mitophagy played a protective role in ACL-SDT-induced cell stress. SDT-induced ROS can initiate autophagosome formation and autophagic degradation of damaged mitochondria. Accordingly, autophagy may also regulate ROS levels through several pathways, such as chaperone-mediated autophagy, mitophagy pathway, and SQSTM1 delivery pathway [63–65]. Inhibition of autophagy aggravated cellular ROS level because the dysfunctional mitochondria with loss of membrane potential couldn’t be successfully cleared, then amplified the leakage of electrons from respiratory chain and formation of endogenously secondary ROS [66]. In this sense, mitochondria became the target and source of ROS in ACHL-SDT. Suppression of the removal of damaged mitochondria would enhance oxidative damage and contribute to cell death. Besides, ACL-SDT triggered ROS generation also activated the other pathways such as HIF1A, then induced the transcription of LC3 and SQSTM1. SDT reaction consumed oxygen in tumors, and hypoxia induced mitophagy may be required to down-regulate oxidative phosphorylation to prevent ROS accumulation [67]. Thus, it is reasonable to propose autophagy inhibition cooperated with SDT to amplify the therapeutic effects in gliomas.
In animal orthotopic model, we performed twice sequential US exposure, in order to cross BBB in safety and get the maximum drug accumulation in glioma lesion as well as efficient sonodynamic reaction. HCQ was coloaded into the nanosonosensitizer for autophagy inhibition, because it has been approved by FDA in clinics [42]. Many studies suggest HCQ can augment the cytotoxicity of anticancer drugs in brain tumor cells. For instance, Wang et al. showed that HCQ augmented the anti-glioma effect of ZD6474 (a tyrosine kinase inhibitor), exhibiting a synergistically therapeutic outcome both in vivo and in vitro [68]. Our findings suggest that the combination of SDT and HCQ significantly inhibited tumor growth and prolonged the average survival time of glioma-bearing mice. The in situ suppression of autophagic vesicles’ degradation greatly enhanced tumor cells apoptosis and tissue destruction in vivo. To sum up, the possible mechanism by which autophagy inhibitor enhanced sonodynamic efficiency possibly because autophagy blockage could magnify oxidative damage and strengthen the apoptotic response.
In conclusion, in this study, we demonstrated that excessive ROS production by ACL-SDT could induce mitochondrial dysfunction and lead to MAPK/p38-PINK1-PRKN-dependent mitophagy. Mitophagy played a protective role under oxidative stress, and inhibition of the degradation pathway markedly potentiated SDT-induced cell apoptosis in glioma cells. The engagement of autophagy inhibitors in combination with noninvasive SDT therapy would be a promising anti-glioma strategy. The developed nanoplatform is expected to expand into other sonotheranostics in the future.
Materials and methods
Materials and antibodies
1,2-distearoyl-sn-glycero-3-phosphocholine (DSPC, LP-R4-076), dioleoylphosphatidylcholine (DOPC, LP-R4-070) and 1, 2-distearoyl-sn-glycero-3-phosphoethanolamine-N-(methoxy [polyethyleneglycol]-2000) (DSPE-mPEG2000, LP-R4-039) were purchased from Corden Pharma Switzerland LLC. 1, 2-distearoyl-sn-glycero-3-phosphoethanolamine-N-(maleimide [polyethyleneglycol]-2000) (DSPE-PEG2000-MAL, 880126) was purchased from Avanti Polar Lipids. Inc. Angiopep-2 (TFFYGGSRGKRNNFKTEEYC, MW 2404.66) was synthesized by GL Biochem Co. Ltd. (Shanghai, China). Chlorin e6 (C380285) was purchased from J&K Scientific Co. Ltd. BSA (A1933), Cholesterol (C3045), Evans blue (E2129), 3-(4,5-dimethylthiazol-2-yl)-2,5-diphenyltetrazolium bromide (MTT, M2128) and 2,7-dichlorodihydrofluorescein-diacetate (DCFH-DA, D6883) were purchased from Sigma-Aldrich. Hydroxychloroquine sulfate (H1306) was obtained from TCI Development Co. Ltd. DAPI (C1006), Ad-mCherry-GFP-LC3B (C3011) and ATP assay kit (S0026) were purchased from Beyotime Biotechnology (Shanghai, China). MitoTracker Green (M7514), MitoTracker Red (M22426) and LysoTracker Green (L7526) were purchased from Invitrogen. Cyto-ID Autophagy Detection Kit (ENZ-51,031) was purchased from Enzo Life Sciences. ANXA5/annexin V-FITC Apoptosis Detection Kit (KGA108) was obtained from KeyGEN Biotech Co. Ltd. Calcein-AM/PI Double Staining Kit (40747ES76) was obtained from Yeasen Biotech Co. Ltd. The following inhibitors and antibodies were obtained as indicated: NAC (Sigma-Aldrich, A8199), Mdivi-1 (MedChemExpress, HY-15,886), SB 203,580 (MedChemExpress, HY-10,256), MAP1LC3/LC3 (Abcam, ab51520), SQSTM1/p62 (Abcam, ab91526), TOMM20/TOM20 (Santa Cruz Biotechnology, sc-17764), PRKN/Parkin (Santa Cruz Biotechnology, sc-32282), PINK1 (Novus, BC100-494), COX4I1/COX4 (Cell Signaling Technology, 4D11-B3-E8), MAPK/p38 (Cell Signaling Technology, 9212), p-MAPK/p38 (Cell Signaling Technology, 9211), HIF1A/HIF-1α (Abcam, ab16066), cleaved-CASP3/caspase-3 (Cell Signaling Technology, 9661), LRP1 (Cell Signaling Technology, 64099), ACTB/β-actin (Cell Signaling Technology, 3700).
Cells and animals model
GL261 glioma cells genetically transformed with a firefly luciferase reporter gene (GL261-Luc) were kindly provided by Prof. Chengren Li (Army Medical University of Chinese PLA). Mouse brain endothelial microvascular cells bEnd.3, and mouse embryo fibroblasts NIH3T3 cells were obtained from the Cell Resource Center of Chinese Academy of Sciences, China. Both of them were maintained at 37°C with humidity and 5% CO2, cultured in Dulbecco’s modified Eagle’s medium (Thermo Fisher Scientific, 11,965,092) supplemented with 10% fetal bovine serum (Thermo Fisher Scientific, 10,099–141), penicillin-streptomycin (Thermo Fisher Scientific, 15,070,063) and 1 mM L-glutamine (Sigma-Aldrich, G5792).
Female C57BL/6 mice (4–6 weeks) weighing approximately 20 g were supplied by the Experimental Animal Center of the Fourth Military Medical University (Xi’an, China). To establish the orthotopic glioma-bearing mouse model, the mice were anesthetized with chloral hydrate (5%; Aladdin Reagent Co. Ltd., C104202) before starting the surgeries. 2 × 10⁵ GL261-Luc cells in 5 µL were slowly implanted into the right striatum of C57BL/6 mice at 0.6 mm anterior and 1.8 mm lateral to the bregma at a depth of 3.5 mm from the brain surface using a stereotactic fixation device (Stoelting 51725, Zenda Inc., Shanghai, China). After 7 d tumor implantation, the mice were imaged to confirm the establishment of the glioma model using Xenogen IVIS Lumina II system (Perkin Elmer, Waltham, MA, USA). The animal experiments were performed in accordance with the National Institute of Health’s Guide for the Care and Use of Laboratory Animals and were approved by the Institutional Animal Care and Use Committee of Shaanxi Normal University (Xi’an, China).
Ultrasound apparatus
A cell-based therapeutic ultrasound apparatus (Sheng Xiang High Technology Co. Ltd., Shenzhen, China) was employed for in vitro experiments, the ultrasonic parameters were set as follows: US intensity of 0.6 W/cm2, frequency of 1.0 MHz, duty cycle of 20%, and duration time of 60 s. For in vivo studies, a home-made focused US transducer was utilized. For BBB test, mice were narcotized by chloral hydrate and injected with 20 µL MBs through the tail vein, and immediately subjected to sonication (frequency: 1.0 MHz, duty cycle: 20%, ultrasound power: 1 W, burst interval time: 1 s, duration time: 60 s). For in vivo SDT stimulus, at the optimal time-window, glioma-bearing mice were narcotized and then treated with continuous sonication (frequency: 1.0 MHz, ultrasound power: 1 W, duration time: 60 s).
Synthesis of DSPE-PEG2000-Angiopep-2
DSPE-PEG2000-angiopep-2 was synthesized via the conjunction between the DSPE-PEG2000-Mal and the cysteine residue on the angiopep-2 peptide. Briefly, Cys-angiopep-2 and DSPE-PEG2000-Mal were mixed in organic solvent (chloroform (Tianjin Tianli Chemical Reagent Co. Ltd.): methanol (Aladdin Reagent Co. Ltd., M116115), 2:1 [v/v]) with a molar ratio of 1:1.5, and then incubated for 24 h in darkness at 37°C with triethylamine (J&K Scientific Co. Ltd., 432,915) as catalyst under argon. The Ellman’s reagent (Aladdin Reagent Co. Ltd., 047885) was used to monitor reaction progress. After the Cys-angiopep-2 was completely consumed, the mixture was dialyzed against water to remove excess reagents. Then the product was freeze-dried and stored at −20°C for further use. The chemical composition was confirmed by 1H NMR (AscendTM 600 MHz, Bruker, Germany). The Ellman’s reagent was utilized to assess the peptides conjugation efficiency at 412 nm. The peptides reaction efficiency (PRE) was calculated with the formula: (OD Peptide-OD DSPE-PEG2000-Peptide)/(OD Peptide-OD Blank) × 100%.
Preparation of nano-sonosensitizers and microbubbles
Microbubbles (MBs) were prepared by the film-rehydration method [25]. Briefly, DSPC and DSPE-mPEG2000 were dissolved in chloroform at a molar ratio of 9:1, then rotary evaporation was used to remove the chloroform until a thin lipid film formed, followed by drying in a vacuum. The lipid film was hydrated with a mixed solution (0.1 M tris-buffer (Sigma-Aldrich, 11,814,273,001): propylene glycol (Sigma-Aldrich, V900115): glycerol solution (Sigma-Aldrich, 49,781), 8:1:1 [v/v]) and sub-packaged into penicillin bottles. The gas in the vials was subsequently replaced with perfluoropropane gas (C3F8), and the solution was violently vibrated with a mechanical vibration instrument for 45 s before use.
Co-encapsulated liposomes with Ce6 and HCQ (CHL) were prepared as previously described [61]. Briefly, DSPC, DOPC, DSPE-mPEG2000 and cholesterol were dissolved in chloroform at the molar ratio of 55:2:5:38, followed by the addition of a defined amount of Ce6. The organic solvent was removed under a nitrogen flow to form a thin lipid film, which was kept in vacuum for 4 h, and then subsequently hydrated in 0.1 M citrate buffer (pH 3.6; 0.1 M citric acid: 0.1 M sodium citrate, 68.5:31.5 [v/v]) for 10 min in a water bath at 65°C. The lipid mixture was then freeze-thawed in liquid nitrogen for 10 cycles, and then extruded through a polycarbonate membrane (Avanti Polar Lipids. Inc., 610,005) using a mini-extruder (Avanti Polar Lipids. Inc., 610,000). A pH gradient between the internal and external phases was formed by adjusting the external phase pH to 7.2 using alkali. Then HCQ was added to the pH gradient liposomes and incubated for 30 min at 55°C. The free Ce6 and HCQ were removed through a Sephadex G-50 column (Sigma-Aldrich, G5080).
The angiopep-2 modified liposomes co-encapsulating Ce6 and HCQ (ACHL) were prepared by the same method using the aforementioned component ratio of 55:2:2.5:2.5:38 (DSPC/DOPC/DSPE-mPEG2000/DSPE-mPEG2000-angiopep-2/cholesterol). To prepare CL and ACL, HCQ was not added after lipid film hydration. To prepare DIR loaded liposomes, DIR was added to lipid mixture before film-forming. All liposomes were stored in tight containers at 4°C in the dark until use.
Characterization of the nano-sonosensitive DDS
The PDI of different nano-sonosensitizers (CL, CHL, ACL and ACHL) were measured using a laser particle size analyzer (Delsa Nano C, Beckman, Germany). The morphological features of different liposomal formulations were examined under a TEM (HT-7700, Hitachi, Japan). Briefly, 10 µL nanocarriers were dropped onto a copper grid and dried at room temperature, negatively stained with 1% phosphotungstic acid (Sigma-Aldrich, 79,690), and observed after air-drying. The concentrations of Ce6 and HCQ were determined spectrophotometrically after the liposomes were disrupted with 1% Triton X-100 (KeyGEN Biotech Co. Ltd., KGF011). Their respective encapsulation efficiencies (EE%) were then calculated as (Wencap/Wtotal) × 100%, where Wencap represents amount of drugs in the liposome suspension after dialysis, and Wtotal is the quantified amount of drugs in the liposome suspension before dialysis. The stability of liposomes was estimated by monitoring particle size and PDI continuously for 7 d at 4°C (n = 3 batches). To estimate the stability of liposomes in the bloodstream, their particle sizes were monitored as described above in a saline solution containing 10%, 20% or 40% FBS, which physiologically mimics the plasma. Finally, the absorption spectra of ACL, CL and free Ce6 were measured with a resolution of 1 nm using multivolume spectrophotometer system (Epoch, Bio Tek, USA).
Ultrasound triggered drug-release and cavitation estimation
We initially investigated the ultrasonic cavitation using TA dosimetry [58]. Nonfluorescent TA (Sigma-Aldrich, 185,361) could reacts with ·OH to form a fluorescent 2-hysroxyterephthalate ions (HTA). As we previously mentioned, TA solution (1 × 10⁻⁴ M) was subjected to US treatment with CL and ACL in the dark for 60 s when load power (LP) indicated 1, 2, and 3 W. Immediately after sonication, a fluorescence photometer was utilized to determine the fluorescence of HTA (λex = 310 nm, λem = 426 nm).
The amounts of Ce6 and HCQ released from ACHL under ultrasonic stimulation were analyzed by dialysis. Briefly, 0.5 mL of each liposome suspension was placed in the focal zone of the ultrasound transducer and sonicated for 60 s, then transferred to a dialysis bag of molecular weight cutoff 3500 (Shanghai yuanye Bio-Technology Co. Ltd., SP132592) in 300 mL PBS. Dialysis was performed at 37°C for 12 h with continuous shaking at 150 × g, and the dialyzate retained in the bag was ruptured with 1% Triton X-100. The concentrations of Ce6 and HCQ were quantified by spectrophotometry.
Intracellular tracking and cellular uptake of sonosensitizers
GL261, bEnd.3 and NIH3T3 cells were incubated with 1 μg/mL Ce6 for different durations, labeled with DAPI, and observed under a fluorescence microscope. To track sonosensitizers uptake, GL261 cells were seeded in 35 mm cell culture dishes at the density of 1 × 10⁴/mL and incubated 12 h with free Ce6, CL and ACL (1 µg/mL Ce6 in each). The uptake of the sonosensitizers was observed as above.
To further evaluate the subcellular distributions of Ce6, GL261 cells were seeded on glass coverslips at the density of 1 × 10⁴ cells/mL and incubated with ACL harboring 1 µg/mL Ce6 for 0.5, 1, 2, 4, 8 and 12 h. After washing the cells thrice with PBS, MTG and LTG were added to label the mitochondria and lysosomes respectively. The stained cover slips were observed under a confocal microscope (Model TCS SP8, Leica, Germany) after fixing with paraformaldehyde (Sigma-Aldrich, 158,127) and counterstaining with DAPI for 10 min.
Cytotoxicity and apoptosis assays
For in vitro functional assays, GL261 cells were seeded in 35 mm cell culture dishes at the density of 1 × 10⁵ cells/mL and cultured for 12 h. After incubation with different liposome preparations for another 12 h, the cells were sonicated and cultured for the stipulated durations. The cytotoxicity was determined after each treatment by MTT assay or calcein-AM/PI double staining. Apoptosis was evaluated by ANXA5/annexin V-FITC and PI and detected by flow cytometry (NovoCyteTM, ACEA Biosciences Inc., CA, USA).
Determination of intracellular ROS
Intracellular ROS level was detected by flow cytometry and fluorescence microscopy with DCFH-DA as the protocol reported previously [24]. Briefly, 10 μM DCFH-DA before treatment for 30 min was added, and at 0.5 h post different treatment, cells were collected for fluorescence intensity of DCF detection.
Detection of mitochondrial membrane potential and ATP production
Mitochondrial membrane potential was measured using a cationic dye, rhodamine 123 (Rh123; Beyotime Biotechnology, C2007). Briefly, cells were harvested and incubated with 1 μg/ml Rh123 at 37°C for 30 min, then samples were washed with PBS and immediately detected by flow cytometry. Cellular ATP production was measured by ATP Assay Kit. Briefly, protein extracts were suspended in standard reaction buffer containing luciferin and luciferase according to the manufacturer’s instructions, and luminescence read at 560 nm.
MitoTracker and Cyto-ID staining
Cells were seeded on glass coverslips at the density of 1 × 10⁴ cells/mL, suitably treated cells were stained with 100 nM MTR at 37°C for 30 min, or stained with Cyto-ID Green (Enzo Life Sciences, ENZ-51,031-0050) in medium containing 10% serum at 37°C for 30 min. After counterstaining with DAPI for 10 min, the cells were observed under a confocal microscope. To detect MTR staining by flow cytometry, the suitably treated cells were harvested and re-suspended in complete medium with 10 nM MTR, and incubated for 20 min at room temperature. At least 5,000 cells were acquired per sample and the fluorescence intensity was quantified.
Western blotting
Suitably treated cells were collected and lysed with cell lysis buffer (KeyGEN Biotech Co. Ltd., KGP703) containing protease inhibitors (KeyGEN Biotech Co. Ltd., KGP603). The protein concentration was determined by BCA assay (Sigma-Aldrich, QPBCA), and 20 μg proteins per sample was separated by SDS-PAGE (4%-12%). The protein bands were transferred onto polyvinylidene difluoride membranes (Millipore Corporation, IPVH00010), and incubated overnight with the primary antibodies at 4°C. The membranes were washed thrice with TBST (Sigma-Aldrich, 91,414), and incubated with fluorescent secondary antibodies for 1 h at 37°C. The fluorescent bands were detected using the Odyssey infrared imaging system (9120, Li-Cor Biosciences; USA).
Transmission electron microscopy
Mitophagy was observed by TEM as previously described [33]. Differentially treated GL261 cells were washed and fixed with 2.5% glutaraldehyde (Sigma-Aldrich, G5882) for 1 h. GL261 glioma tissues were excised from the mice and promptly fixed for 12 h. The cell pellets or tissues were then fixed with 1% osmium tetroxide (Sigma-Aldrich, 75,632) in 0.1 M PBS for 40 min. After rinsing with PBS, the cells or tissues were dehydrated through an increasing gradient of alcohol (30, 50, 70, 80, 90, 95 and 100%, 30 min each time). Ultrathin sections were cut and stained with uranium acetate and lead citrate. The stained sections were observed under a TEM at 80 kV.
Ad-mCherry-GFP-LC3B transfection assays
GL261 cells were seeded in 35 mm cell culture dishes until they reached 60%-70% confluence and then transfected with Ad-mCherry-GFP-LC3B adenovirus at 30 multiplicity of infection for 24 h at 37°C. Following the indicated treatments, the cells were observed under a confocal microscope.
Immunofluorescence
Treated cells were washed twice with PBS, fixed with 4% paraformaldehyde, and permeabilized with 0.5% Triton X-100. After blocking with 1% BSA at room temperature for 1 h, the cells were incubated overnight with following primary antibodies: Rabbit polyclonal LC3B, mouse monoclonal TOMM20, mouse monoclonal Alexa Fluor® 594-PRKN, rabbit polyclonal PINK1; and with the following secondary antibodies: mouse and/or rabbit DyLight 488 or 594 (Abbkine, A23210, A23410-1, A23220-1, A23420-1). After counterstained with DAPI for 15 min, the stained cells were observed under a confocal microscope.
BBB opening in vitro and in vivo by UTMD
For the in vitro BBB study, BBB model was established according to our previous report [31]. Briefly, bEnd.3 cells were seeded on the upper chambers at a density of 1 × 10⁴ cells/well in 24 well Transwell (Corning 3422, NY), GL261 cells were plated on the basal side of the insert at a density of 2 × 10³ cells/well, and then both of them allowed to adhere in a humidified incubator at 37°C with 5% CO2. After co-incubation for 5 d, these models were used for experiments. For sonication group, 5 µL MBs were diluted in culture medium of per well and then subjected to sonication (0.6 W/cm2, 60 s). After ultrasound treatment, the CL and ACL were added into the upper chambers of the Transwell at a Ce6 concentration of 1 μg/mL for incubation at 37°C for 12 h. The fluorescence intensity of GL261 cells in the basolateral compartment was estimated by Inverted Fluorescence microscope (DMi8 automated, Carl Zeiss, Germany).
As for the in vivo BBB test, BBB permeability was conducted by EB extravasation into brain tissue. Mice were narcotized by chloral hydrate (300 mg/kg), 20 µL MBs and EB (2%, 4 mL/kg) were intravenously injected via the tail vein, immediately after injection mice were treated with pulse-triggered focused ultrasound. At various preset time points, mice were anesthetized, sacrificed and infused with heparinized saline until a colorless infusion liquid was acquired. Subsequently, the dyed brain was immediately removed and then incubated in formamide (100 mg/mL; Sigma-Aldrich, F9037) at 60°C for 24 h. The degree and volume of EB extravasation in the brain was then determined by spectrophotometrically at 620 nm and calculated based on EB standards.
In vivo brain targeting and bio-distribution
To demonstrate the pharmacokinetics of nano-sonosensitizers in vivo, DIR (Yeasen Biotech Co. Ltd., 40757ES25) was used to label liposomes due to its strong red fluorescence in the NIR region. In this experiment, DIR was used instead of Ce6 to evaluate angiopep-2-DIR-liposomes (ADL) and DIR-liposomes (DL) targeting effects under UTMD or without UTMD respectively by IVIS Spectrum Imaging System.
For UTMD group, glioma bearing mice was injected with MBs and immediately subjected to sonication (frequency: 1.0 MHz, duty cycle: 20%, ultrasound power: 1 W, burst interval time: 1 s, duration time: 60 s) to open the BBB, and injected with the DIR-labeled liposomes (DL or ADL; 3 mice each group, 10 µg DIR/mouse) via the tail vein. And non-UTMD treated glioma mice were just injected with DL or ADL. The mice were imaged 1, 3, 6, 12, 24, 36 and 48 h after injection with the IVIS imaging system. After 36 h, four mice from each group were euthanized, and their major organs were harvested for ex vivo imaging.
In vivo therapeutic regimen
C57BL/6 mice were injected intra-cranially with 2 × 10⁵ GL261-luc cells to establish glioma xenografts. Six days after implantation, the mice were randomized into 8 groups (n = 7) according to the treatment modality, and on days 7, 12 and 17 after implantation, accordingly received PBS, US1+ US2, Ce6+ US1+ US2, HCQ+US1+ US2, CL+US1+ US2, CHL+US1+ US2, ACL+US1+ US2 and ACHL+US1+ US2. The dosages of Ce6 and HCQ were 5 mg/kg and 30 mg/kg respectively. An initial ultrasonic pulse (US1) was given (frequency: 1.0 MHz, duty cycle: 20%, US power: 1 W, burst interval time: 1 s, duration time: 60 s) to open the BBB, followed by liposomal injections. Thirty-six hours after drug administration, a continuous ultrasonic pulse (US2) was given (frequency: 1.0 MHz, US power: 1 W, duration time: 60 s) for SDT.
The mice were intraperitoneally injected with D-luciferin (150 mg/kg) on day 7, 14 and 21 post-implantation and the bioluminescence of the gliomas was imaged with the IVIS spectrum optical imaging system. One day after the last injection, mouse from each group was sacrificed, and their brains and other organs (heart, liver, spleen, lung and kidney) were resected, and processed for preparing paraffin sections. The tissue sections were stained with hematoxylin and eosin (H&E; Beyotime Biotechnology, C0105) and TUNEL according to standard protocols. The body weight of the mice was regularly monitored, and survival was analyzed using the Kaplan-Meier method.
Statistical analysis
SPSS 23.0 software (SPSS Inc., Chicago, USA) was used for statistical analysis. All data are expressed as the mean ± standard deviation (S.D.). Differences among the groups were analyzed by one-way ANOVA. A value of p < 0.05 was considered to be of significance. *p < 0.05, **p < 0.01, ***p < 0.001.
Supplementary Material
Correction Statement
This article has been republished with minor changes. These changes do not impact the academic content of the article.
Funding Statement
This work was supported by National Natural Science Foundation of China [81972900,81571834, 81872497], the Natural Science Foundation of Shaanxi Province [2019JZ-13, 2017KJXX-78], the Natural Science Foundation of Guangdong Province [2017A030313651], and the Fundamental Research Funds for the Central Universities [GK201802002, 16QNGG012].
Disclosure statement
No potential conflict of interest was reported by the authors.
Supplementary Material
Supplementary data for this article can be accessed here.
References
- [1].Lapointe S, Perry A, Butowski NA.. Primary brain tumours in adults. Lancet. 2018;392:432–446. [DOI] [PubMed] [Google Scholar]
- [2].Kim JS, Shin DH, Kim JS.. Dual-targeting immunoliposomes using angiopep-2 and CD133 antibody for glioblastoma stem cells. J Control Release. 2018;269:245–257. [DOI] [PubMed] [Google Scholar]
- [3].Xue J, Zhao Z, Zhang L, et al. Neutrophil-mediated anticancer drug delivery for suppression of postoperative malignant glioma recurrence. Nat Nanotechnol. 2017;12:692–700. [DOI] [PubMed] [Google Scholar]
- [4].Lin T, Zhao P, Jiang Y, et al. Blood-brain-barrier-penetrating albumin nanoparticles for biomimetic drug delivery via albumin-binding protein pathways for antiglioma therapy. ACS Nano. 2016;10:9999–10012. [DOI] [PubMed] [Google Scholar]
- [5].Apel A, Herr I, Schwarz H, et al. Blocked autophagy sensitizes resistant carcinoma cells to radiation therapy. Cancer Res. 2008;68:1485–1494. [DOI] [PubMed] [Google Scholar]
- [6].Dolma S, Selvadurai HJ, Lan X, et al. Inhibition of dopamine receptor D4 impedes autophagic flux, proliferation, and survival of glioblastoma stem cells. Cancer Cell. 2016;29:859–873. [DOI] [PMC free article] [PubMed] [Google Scholar]
- [7].Zhang H, Wang T, Qiu W, et al. Monitoring the opening and recovery of the blood-brain barrier with noninvasive molecular imaging by biodegradable ultrasmall Cu2-xSe nanoparticles. Nano Lett. 2018;18:4985–4992. [DOI] [PubMed] [Google Scholar]
- [8].Lipsman N, Meng Y, Bethune AJ, et al. Blood-brain barrier opening in Alzheimer’s disease using MR-guided focused ultrasound. Nat Commun. 2018;9:2336. [DOI] [PMC free article] [PubMed] [Google Scholar]
- [9].Gorick CM, Sheybani ND, Curley CT, et al. Listening in on the microbubble crowd: advanced acoustic Monitoring for Improved control of blood-brain barrier opening with focused ultrasound. Theranostics. 2018;8:2988–2991. [DOI] [PMC free article] [PubMed] [Google Scholar]
- [10].Landhuis E. Ultrasound for the brain. Nature. 2017;551:257–259. [DOI] [PubMed] [Google Scholar]
- [11].Yeshurun L, Azhari H. Non-invasive measurement of thermal diffusivity using high-intensity focused ultrasound and through-transmission ultrasonic imaging. Ultrasound Med Biol. 2016;42:243–256. [DOI] [PubMed] [Google Scholar]
- [12].Gonzales J, Nair RK, Madsen SJ, et al. Focused ultrasound-mediated sonochemical internalization: an alternative to light-based therapies. J Biomed Opt. 2016;21:78002. [DOI] [PMC free article] [PubMed] [Google Scholar]
- [13].Li Y, An H, Wang X, et al. Ultrasound-triggered release of sinoporphyrin sodium from liposome-microbubble complexes and its enhanced sonodynamic toxicity in breast cancer. Nano Res. 2017;11:1038–1056. [Google Scholar]
- [14].Wang X, Wang Y, Wang P, et al. Sonodynamically induced anti-tumor effect with protoporphyrin IX on hepatoma-22 solid tumor. Ultrasonics. 2011;51:539–546. [DOI] [PubMed] [Google Scholar]
- [15].Dai S, Xu C, Tian Y, et al. In vitro stimulation of calcium overload and apoptosis by sonodynamic therapy combined with hematoporphyrin monomethyl ether in C6 glioma cells. Oncol Lett. 2014;8:1675–1681. [DOI] [PMC free article] [PubMed] [Google Scholar]
- [16].Chen L, Cong D, Li Y, et al. Combination of sonodynamic with temozolomide inhibits C6 glioma migration and promotes mitochondrial pathway apoptosis via suppressing NHE-1 expression. Ultrason Sonochem. 2017;39:654–661. [DOI] [PubMed] [Google Scholar]
- [17].Zhu P, Chen Y, Shi J. Nanoenzyme-Augmented cancer sonodynamic therapy by catalytic tumor oxygenation. ACS Nano. 2018;12:3780–3795. [DOI] [PubMed] [Google Scholar]
- [18].Sun Y, Wang H, Wang P, et al. Tumor targeting DVDMS-nanoliposomes for an enhanced sonodynamic therapy of gliomas. Biomater Sci. 2019;7:985–994. [DOI] [PubMed] [Google Scholar]
- [19].Wang X, Liu Q, Wang Z, et al. Role of autophagy in sonodynamic therapy-induced cytotoxicity in S180 cells. Ultrasound Med Biol. 2010;36:1933–1946. [DOI] [PubMed] [Google Scholar]
- [20].Wang X, Wang P, Zhang K, et al. Initiation of autophagy and apoptosis by sonodynamic therapy in murine leukemia L1210 cells. Toxicol In Vitro. 2013;27:1247–1259. [DOI] [PubMed] [Google Scholar]
- [21].Levy JMM, Towers CG, Thorburn A. Targeting autophagy in cancer. Nat Rev Cancer. 2017;17:528–542. [DOI] [PMC free article] [PubMed] [Google Scholar]
- [22].Dewaele M, Maes H, Agostinis P. ROS-mediated mechanisms of autophagy stimulation and their relevance in cancer therapy. Autophagy. 2010;6:838–854. [DOI] [PubMed] [Google Scholar]
- [23].Mojzisova H, Bonneau S, Vever-Bizet C, et al. Cellular uptake and subcellular distribution of chlorin e6 as functions of pH and interactions with membranes and lipoproteins. Biochim Biophys Acta. 2007;1768:2748–2756. [DOI] [PubMed] [Google Scholar]
- [24].Furre IE, Shahzidi S, Luksiene Z, et al. Targeting PBR by hexaminolevulinate-mediated photodynamic therapy induces apoptosis through translocation of apoptosis-inducing factor in human leukemia cells. Cancer Res. 2005;65:11051–11060. [DOI] [PubMed] [Google Scholar]
- [25].Palikaras K, Lionaki E, Tavernarakis N. Mechanisms of mitophagy in cellular homeostasis, physiology and pathology. Nat Cell Biol. 2018;20:1013–1022. [DOI] [PubMed] [Google Scholar]
- [26].Xiao B, Goh JY, Xiao L, et al. Reactive oxygen species trigger Parkin/PINK1 pathway-dependent mitophagy by inducing mitochondrial recruitment of Parkin. J Biol Chem. 2017;292:16697–16708. [DOI] [PMC free article] [PubMed] [Google Scholar]
- [27].Wang Y, Nartiss Y, Steipe B, et al. ROS-induced mitochondrial depolarization initiates PARK2/PARKIN-dependent mitochondrial degradation by autophagy. Autophagy. 2012;8:1462–1476. [DOI] [PubMed] [Google Scholar]
- [28].Viale A, Pettazzoni P, Lyssiotis CA, et al. Oncogene ablation-resistant pancreatic cancer cells depend on mitochondrial function. Nature. 2014;514:628–632. [DOI] [PMC free article] [PubMed] [Google Scholar]
- [29].Xiao B, Deng X, Lim GGY, et al. Superoxide drives progression of Parkin/PINK1-dependent mitophagy following translocation of Parkin to mitochondria. Cell Death Dis. 2017;8:e3097. [DOI] [PMC free article] [PubMed] [Google Scholar]
- [30].Radogna F, Cerella C, Gaigneaux A, et al. Cell type-dependent ROS and mitophagy response leads to apoptosis or necroptosis in neuroblastoma. Oncogene. 2016;35:3839–3853. [DOI] [PubMed] [Google Scholar]
- [31].Song L, Huang Y, Hou X, et al. PINK1/Parkin-mediated mitophagy promotes resistance to sonodynamic therapy. Cell Physiol Biochem. 2018;49:1825–1839. [DOI] [PubMed] [Google Scholar]
- [32].Cook KL, Warri A, Soto-Pantoja DR, et al. Hydroxychloroquine inhibits autophagy to potentiate antiestrogen responsiveness in ER+ breast cancer. Clin Cancer Res. 2014;20:3222–3232. [DOI] [PMC free article] [PubMed] [Google Scholar]
- [33].Li Y, Lin TY, Luo Y, et al. A smart and versatile theranostic nanomedicine platform based on nanoporphyrin. Nat Commun. 2014;5:4712. [DOI] [PMC free article] [PubMed] [Google Scholar]
- [34].Van RI, Mastrobattista E, Storm G, et al. Comparison of five different targeting ligands to enhance accumulation of liposomes into the brain. J Control Release. 2011;150:30–36. [DOI] [PubMed] [Google Scholar]
- [35].Sun X, Pang Z, Ye H, et al. Co-delivery of pEGFP-hTRAIL and paclitaxel to brain glioma mediated by an angiopep-conjugated liposome. Biomaterials. 2012;33:916–924. [DOI] [PubMed] [Google Scholar]
- [36].Endo-Takahashi Y, Ooaku K, Ishida K, et al. Preparation of Angiopep-2 peptide-modified bubble liposomes for delivery to the brain. Biol Pharm Bull. 2016;39:977–983. [DOI] [PubMed] [Google Scholar]
- [37].Han W, Yin G, Pu X, et al. Glioma targeted delivery strategy of doxorubicin-loaded liposomes by dual-ligand modification. J Biomater Sci Polym Ed. 2017;28:1695–1712. [DOI] [PubMed] [Google Scholar]
- [38].Carter KA, Shao S, Hoopes MI, et al. Porphyrin-phospholipid liposomes permeabilized by near-infrared light. Nat Commun. 2014;5:3546. [DOI] [PMC free article] [PubMed] [Google Scholar]
- [39].Liu Y, Wang P, Liu Q, et al. Sinoporphyrin sodium triggered sono-photodynamic effects on breast cancer both in vitro and in vivo. Ultrason Sonochem. 2016;31:437–448. [DOI] [PubMed] [Google Scholar]
- [40].Torchilin VP. Recent advances with liposomes as pharmaceutical carriers. Nat Rev Drug Discov. 2005;4:145–160. [DOI] [PubMed] [Google Scholar]
- [41].Ma N, Ma C, Li C, et al. Influence of nanoparticle shape, size, and surface functionalization on cellular uptake. J Nanosci Nanotechnol. 2013;13:6485–6498. [DOI] [PubMed] [Google Scholar]
- [42].Wang Y, Shi K, Zhang L, et al. Significantly enhanced tumor cellular and lysosomal hydroxychloroquine delivery by smart liposomes for optimal autophagy inhibition and improved antitumor efficiency with liposomal doxorubicin. Autophagy. 2016;12:949–962. [DOI] [PMC free article] [PubMed] [Google Scholar]
- [43].Lima S, Takabe K, Newton J, et al. TP53 is required for BECN1- and ATG5-dependent cell death induced by sphingosine kinase 1 inhibition. Autophagy. 2018;14:942–957. [DOI] [PMC free article] [PubMed] [Google Scholar]
- [44].Dolado I, Swat A, Ajenjo N, et al. p38alpha MAP kinase as a sensor of reactive oxygen species in tumorigenesis. Cancer Cell. 2007;11:191–205. [DOI] [PubMed] [Google Scholar]
- [45].Moreau K, Ravikumar B, Renna M, et al. Autophagosome precursor maturation requires homotypic fusion. Cell. 2011;146:303–317. [DOI] [PMC free article] [PubMed] [Google Scholar]
- [46].Levy JM, Thompson JC, Griesinger AM, et al. Autophagy inhibition improves chemosensitivity in BRAF(V600E) brain tumors. Cancer Discovery. 2014;4:773–780. [DOI] [PMC free article] [PubMed] [Google Scholar]
- [47].Ma X, Wu Y, Jin S, et al. Gold nanoparticles induce autophagosome accumulation through size-dependent nanoparticle uptake and lysosome impairment. ACS Nano. 2011;5:8629–8639. [DOI] [PubMed] [Google Scholar]
- [48].Zhao B, Chen Y, Liu J, et al. Blood-brain barrier disruption induced by diagnostic ultrasound combined with microbubbles in mice. Oncotarget. 2018;9:4897–4914. [DOI] [PMC free article] [PubMed] [Google Scholar]
- [49].Wang Y, Huang N, Li H, et al. Promoting oligodendroglial-oriented differentiation of glioma stem cell: a repurposing of quetiapine for the treatment of malignant glioma. Oncotarget. 2017;8:37511–37524. [DOI] [PMC free article] [PubMed] [Google Scholar]
- [50].Li J, Chen L, Du L, et al. Cage the firefly luciferin! - a strategy for developing bioluminescent probes. Chem Soc Rev. 2013;42:662–676. [DOI] [PubMed] [Google Scholar]
- [51].Tang W, Fan W, Lau J, et al. Emerging blood-brain-barrier-crossing nanotechnology for brain cancer theranostics. Chem Soc Rev. 2019;48:2967–3014. [DOI] [PubMed] [Google Scholar]
- [52].Shen J, Zheng H, Ruan J, et al. Autophagy inhibition induces enhanced proapoptotic effects of ZD6474 in glioblastoma. Br J Cancer. 2013;109:164–171. [DOI] [PMC free article] [PubMed] [Google Scholar]
- [53].Wang X, Yan F, Liu X, et al. Enhanced drug delivery using sonoactivatable liposomes with membrane-embedded porphyrins. J Control Release. 2018;286:358–368. [DOI] [PubMed] [Google Scholar]
- [54].Su X, Wang X, Zhang K, et al. ERK inhibitor U0126 enhanced SDT-induced cytotoxicity of human leukemia U937 cells. Gen Physiol Biophys. 2014;33:295–309. [DOI] [PubMed] [Google Scholar]
- [55].Zhang Y, Xi X, Mei Y, et al. High-glucose induces retinal pigment epithelium mitochondrial pathways of apoptosis and inhibits mitophagy by regulating ROS/PINK1/Parkin signal pathway. Biomed Pharmacother. 2019;111:1315–1325. [DOI] [PubMed] [Google Scholar]
- [56].Kim I, Lemasters JJ. Mitophagy selectively degrades individual damaged mitochondria after photoirradiation. Antioxid Redox Signal. 2011;14:1919–1928. [DOI] [PMC free article] [PubMed] [Google Scholar]
- [57].Wang Y, Nartiss Y, Steipe B, et al. ROS-induced mitochondrial depolarization initiates PARK2/PRKN-dependent mitochondrial degradation by autophagy. Autophagy. 2012;8:1462–1476. [DOI] [PubMed] [Google Scholar]
- [58].García-Cano J, Roche O, Cimas FJ, et al. p38MAPK and chemotherapy: we always need to hear both sides of the story. Front Cell Dev Biol. 2016;4:69. [DOI] [PMC free article] [PubMed] [Google Scholar]
- [59].Xue Q, Wang P, Wang X, et al. Targeted inhibition of p38MAPK-enhanced autophagy in SW620 cells resistant to photodynamic therapy-induced apoptosis. Lasers Med Sci. 2015;30:1967–1975. [DOI] [PubMed] [Google Scholar]
- [60].Basit F, van Oppen LM, Schockel L, et al. Mitochondrial complex I inhibition triggers a mitophagy-dependent ROS increase leading to necroptosis and ferroptosis in melanoma cells. Cell Death Dis. 2017;8:e2716. [DOI] [PMC free article] [PubMed] [Google Scholar]
- [61].Yan C, Luo L, Guo CY, et al. Doxorubicin-induced mitophagy contributes to drug resistance in cancer stem cells from HCT8 human colorectal cancer cells. Cancer Lett. 2017;388:34–42. [DOI] [PubMed] [Google Scholar]
- [62].Zhou J, Li G, Zheng Y, et al. A novel autophagy/mitophagy inhibitor liensinine sensitizes breast cancer cells to chemotherapy through DNM1L-mediated mitochondrial fission. Autophagy. 2015;11:1259–1279. [DOI] [PMC free article] [PubMed] [Google Scholar]
- [63].Li L, Tan J, Miao Y, et al. ROS and autophagy: interactions and molecular regulatory mechanisms. Cell Mol Neurobiol. 2015;35:615–621. [DOI] [PMC free article] [PubMed] [Google Scholar]
- [64].Scherz-Shouval R, Elazar Z. Regulation of autophagy by ROS: physiology and pathology. Trends Biochem Sci. 2011;36:30–38. [DOI] [PubMed] [Google Scholar]
- [65].Li Q, Yin Y, Zheng Y, et al. Inhibition of autophagy promoted high glucose/ROS-mediated apoptosis in ADSCs. Stem Cell Res Ther. 2018;9:289. [DOI] [PMC free article] [PubMed] [Google Scholar]
- [66].Vera-Ramirez L, Vodnala SK, Nini R, et al. Autophagy promotes the survival of dormant breast cancer cells and metastatic tumour recurrence. Nat Commun. 2018;9:1944. [DOI] [PMC free article] [PubMed] [Google Scholar]
- [67].Wu H, Chen Q. Hypoxia activation of mitophagy and its role in disease pathogenesis. Antioxid Redox Signal. 2015;22:1032–1046. [DOI] [PubMed] [Google Scholar]
- [68].Jarauta V, Jaime P, Gonzalo O, et al. Inhibition of autophagy with chloroquine potentiates carfilzomib-induced apoptosis in myeloma cells in vitro and in vivo. Cancer Lett. 2016;382:1–10. [DOI] [PubMed] [Google Scholar]
Associated Data
This section collects any data citations, data availability statements, or supplementary materials included in this article.


