eLife logoLink to eLife
. 2020 Sep 9;9:e56973. doi: 10.7554/eLife.56973

Genetic variation in the social environment affects behavioral phenotypes of oxytocin receptor mutants in zebrafish

Diogo Ribeiro 1, Ana Rita Nunes 1, Magda Teles 1, Savani Anbalagan 2,3, Janna Blechman 2, Gil Levkowitz 2, Rui F Oliveira 1,4,5,
Editors: Peggy Mason6, Catherine Dulac7
PMCID: PMC7481002  PMID: 32902385

Abstract

Oxytocin-like peptides have been implicated in the regulation of a wide range of social behaviors across taxa. On the other hand, the social environment, which is composed of conspecifics that may vary in their genotypes, also influences social behavior, creating the possibility for indirect genetic effects. Here, we used a zebrafish oxytocin receptor knockout line to investigate how the genotypic composition of the social environment (Gs) interacts with the oxytocin genotype of the focal individual (Gi) in the regulation of its social behavior. For this purpose, we have raised wild-type or knock-out zebrafish in either wild-type or knock-out shoals and tested different components of social behavior in adults. GixGs effects were detected in some behaviors, highlighting the need to control for GixGs effects when interpreting results of experiments using genetically modified animals, since the genotypic composition of the social environment can either rescue or promote phenotypes associated with specific genes.

Research organism: Zebrafish

Introduction

Social genetic effects (aka indirect genetic effects) occur when the phenotype of an organism is influenced by the genotypes of conspecifics. Previous work has highlighted the major potential evolutionary consequences of social genetic effects (Moore et al., 1997; Wolf et al., 1998), with evidence for such effects to be present both in interactions between related (e.g. mothers and offspring Champagne and Meaney, 2006; Wilson et al., 2004) and unrelated individuals (e.g. sexual displays (Petfield et al., 2005), aggression Wilson et al., 2011; Sartori and Mantovani, 2013; Santostefano et al., 2017). More recently, the importance of social genetic effects for health and disease has also been recognized (Baud et al., 2017), which may explain the pervasiveness of the social environment as a mortality risk in humans (Holt-Lunstad et al., 2010; Holt-Lunstad et al., 2015). Interestingly, the potential consequences of social genetic effects for the interpretation of research results using genetically modified organisms (GMO) has been greatly neglected. GMOs have been widely used in behavioral neuroscience to investigate the causal role of candidate genes and behavioral phenotypes. Typically Knock-in and Knock-out transgenics and mutants have been used to causally link the gain or loss of behavioral function to a specific gene (Huang and Zeng, 2013). In recent years, the development of genome editing techniques, such as CRISPR-Cas9-and TALEN-induced mutations, have increased the interest in this approach and opened the door to studying the genetic basis of behavior in non-model organisms (Hsu et al., 2014).

However, most studies using GMO in behavioral neuroscience have ignored the potential contribution of the genotypic composition of the social environment to the behavioral phenotype studied. This is because it has been assumed that if the genetic background of these mutants is identical and their environment has been kept constant, any phenotypic differences must come from the genetic manipulation. However, when GMOs are incrossed or visually screened at a very young age (e.g. using reporter genes, GFP) and thereafter raised and housed together until used in experiments, changes in their behavior might be affected by the divergent genotypic composition of social environments experienced by these mutants. In other words, modified behavior might be a result of growing with their peer mutants, rather than the canonical social environment provided by wild-type conspecifics. Such problem is particularly relevant when studying social behavior. Thus, given the rising interest in the study of social behavior in model organisms from worms to higher vertebrates, an assessment of the potential effect of the interaction between the genotype of the individual (Gi) and the genotypic composition of its social environment (Gs), on the behavioral phenotype of interest in GMOs used in social neuroscience is crucial.

Despite the wide variety of species-specific social behaviors, a wealth of evidence has implicated the paralog nonapeptides vasopressin (VP) and oxytocin (OXT) and their receptors in the regulation of different aspects of social behavior across vertebrates (Donaldson and Young, 2008; Goodson and Thompson, 2010), suggesting a genetic toolkit role (sensu evo-devo, i.e. ancient genes highly conserved among taxa that control the same biological process) for these nonapeptides in social behavior. Nonapeptides are an ancestral neuropeptide family found both in vertebrates and invertebrates, that derived from a VP-like peptide, and that evolved along two parallel clades of VP- and OXT-like peptides from the duplication of the VP gene in early jawed fish (ca. 500 Mya). Both peptides have been implicated in the regulation of behavior and physiology across different taxa, with VP being more involved in aggression and agonistic behaviors and OXT-like peptides consistently acting in affiliative behaviors and species-specific social behaviors across diverse taxa (i.e. sexual behavior, social interactions) (Stoop, 2012; Goodson, 2013). Despite this wealth of evidence on the direct genetic effects of OXT on social behavior, social genetic effects (i.e. GixGs effects) of OXT genotypes have never been studied.

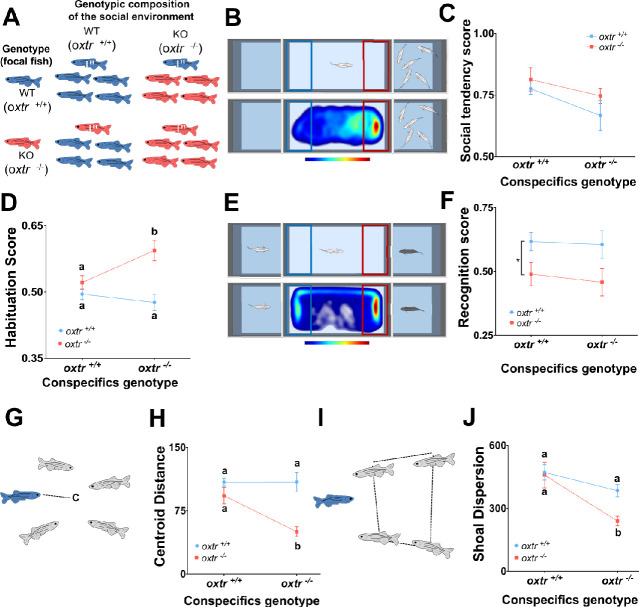
In this study, we aimed to provide a proof of principle for GixGs effects in behavioral phenotypes observed in GMO by assessing the occurrence of such effects in a knockout line for the OXT receptor in zebrafish, a commonly used model species in behavioral neuroscience (Orger and de Polavieja, 2017), which forms social groups (aka shoals, Miller and Gerlai, 2007; Miller and Gerlai, 2012) and expresses a rich repertoire of social behavior (Zebrafish Neuroscience Research Consortium et al., 2013; Nunes et al., 2017). For this purpose, we studied the GixGs interaction in the effects of the OXT gene (oxtr) in different aspects of social behavior, by raising individual zebrafish of the WT (oxtr(+/+)) or knock-out genotype (oxtr(-/-)) in different social environments (i.e. oxtr(+/+) shoal or oxtr(-/-) shoal; Figure 1A). Since sociality encompasses motivational, cognitive and collective behavioral traits, we have selected a set of tests that aim to characterize these different aspects at a fundamental level: (Moore et al., 1997) the social preference and social habituation tests assess the motivation to approach conspecifics, and how it varies with the repeated access to conspecifics; (Wolf et al., 1998) the social recognition test, which provides an insight into the ability of zebrafish to discriminate between conspecifics based on one-trial learning; and (Champagne and Meaney, 2006) tests of shoaling behavior that assess how well the focal individual is able to integrate itself into an unfamiliar shoal and what influence it has on the behavior of the other shoal members.

Figure 1. Genetic variation in the social environment affects zebrafish social behavior.

Figure 1.

The contribution of the individual genotype (Gi), the genotype of conspecifics in the social group (Gs) and the interaction between the two (GixGs) to the expression of behavioral phenotypes in zebrafish was assessed by raising oxytocin receptor mutant fish and wild types (focal fish marked with *) in shoals of either mutants or wild types (A). Social preference, measured by the time fish spend near a shoal vs. empty in a choice test (B, upper panel), showed a marginally significant effect of Gs (C; Source data file Figure 1—source data 1). Social habituation, which consisted on a consecutive social preference test exhibited a GixGs effect (D; Source data file Figure 1—source data 2). Social recognition, measured as the discrimination between a novel and a familiar conspecific (E, upper panel), shows a pure G effect (F; Source data file Figure 1—source data 3). Social integration, measured as distance to the centroid of the shoal (G), showed a GixGs effect (H; Source data file Figure 1—source data 4). Social influence, measured by the cohesion of the remaining shoal members (I), also showed a marginally significant GixGs effect (J; Source data file Figure 1—source data 5). Heatmaps show the spatial distribution of a representative oxtr(+/+) individual fish raised in a oxtr(+/+) group, during the entire trial, for both social preference (B, lower panel) and social recognition (E, lower panel). Data is presented as mean ± standard error of the mean (SEM). Sample sizes are nine for heterogeneous groups (i.e. focal individual with different genotype from the remaining individuals in the shoal; mutant focal in WT shoals and WT focal in mutant shoals) and 15 for homogeneous groups (i.e. focal individual with the same genotype of the remaining individuals in the shoal; mutant focal in mutant shoals and WT focal in WT shoals). Different letters indicate significant differences (p<0.05) between treatments as assessed by Tukey post-hoc tests following a two-way ANOVA (D,H,J; see Table 1). An asterisk indicates a Gi main effect in F.

Figure 1—source data 1. Effects of individual and conspecifics genotype on Social Preference.
Figure 1—source data 2. Effects of individual and conspecifics genotype on social habituation.
Figure 1—source data 3. Effects of individual and conspecifics genotype on social recognition.
Figure 1—source data 4. Effects of individual and conspecifics genotype on social integration.
Figure 1—source data 5. Effects of individual and conspecifics genotype on social influence.

Results and discussion

Adult zebrafish, like many other social animals, express a tendency to approach and interact with conspecifics (social preference, Figure 1BEngeszer et al., 2004). Here, we show that there was no significant effect of either genotype or GixGs interaction on social preference, but there was a marginally significant main effect of Gs (Table 1; Figure 1C). When fish were presented for a second time to a shoal to measure social habituation (i.e. expected reduction in social preference), we found a GixGs interaction, where oxtr(-/-) individuals raised in oxtr(-/-) shoals express enhanced social habituation (F1,44 = 5.642, p=0.022; Figure 1D). Thus, social motivation in zebrafish seems to be influenced by the genotype of conspecifics rather than by the genotype of the individual. Hence, the increased social habituation in oxtr(-/-) fish does not seem to be due to reduced social motivation, but rather to an heightened habituation to the stimuli, suggesting that the observed GixGs interaction effect is related to changes in single-stimulus learning mechanisms in mutant fish rather than to changes in social motivation.

Table 1. Effect of genotype of the focal individual (Gi), genotype of conspecifics present in its social environment (Gs) and the interaction between the two (GixGs) on zebrafish social behavior was assessed using a two-way ANOVA.

~ indicates marginally significant, *p<0.05, **p<0.01, ***p<0.001. (Source data files Figure 1—source datas 15).

Social preference
d.f. Mean squares F Significance Partial η2
Gi 1 0.023 1.731 0.195 0.038
Gs 1 0.050 3.788 0.058~ 0.079
Gi x Gs 1 0.001 0.049 0.825 0.001
Error 44 0.013
Habituation
d.f. Mean squares F Significance Partial η2
Gi 1 0.058 13.927 0.001 ** 0.240
Gs 1 0.008 1.936 0.171 0.042
Gi x Gs 1 0.024 5.642 0.022 * 0.114
Error 44 0.004
Social recognition
d.f. Mean squares F Significance Partial η2
Gi 1 0.213 7.600 0.008 ** 0.147
Gs 1 0.005 0.189 0.666 0.004
Gi x Gs 1 0.001 0.041 0.841 0.001
Error 44 0.028
Social group integration
d.f. Mean squares F Significance Partial η2
Gi 1 39.486 24.370 <0.001 *** 0.356
Gs 1 12.565 7.755 0.008 ** 0.150
Gi x Gs 1 12.811 7.907 0.007 ** 0.152
Error 44 1.620
Social group dispersion
d.f. Mean squares F Significance Partial η2
Gi 1 174.366 4.309 0.044 * 0.089
Gs 1 657.221 16.240 <0.001 *** 0.270
Gi x Gs 1 122.980 3.039 0.088 0.065
Error 44 40.469

When we tested social recognition, which is a form of social memory needed for individuality in social interactions (i.e. differential expression of social behavior depending on identity of interacting individual), that is known to be modulated by oxytocin both in mammals and zebrafish (Ferguson et al., 2000; Ribeiro et al., 2020), we observed that oxtr(-/-) individuals exhibit a deficit in acquisition and retention of social recognition irrespective of the social environment (oxtr(-/-) or oxtr(+/+)) in which they were raised (F1,44 = 7.600, p=0.008; Figure 1F). Thus, in contrast to social motivation, social memory seems to rely on the individual’s genotype. This result is in accordance with a recent study from our lab (Ribeiro et al., 2020) that has shown a deficit in one-trial recognition memory of both conspecifics and objects in oxt(-/-) fish, suggesting that this deficit is not specific to the social domain but is rather a general domain cognitive deficit.

Given that social behavior of zebrafish mainly occurs in the context of shoaling we have also investigated two shoaling behavior parameters: social integration and social influence. Social integration assesses how well the focal individual integrates in the social group (aka shoal), and is measured by its average distance to the centroid of the shoal (Figure 1G,H). A GixGs interaction was found for social integration, where oxtr(-/-) individuals raised in oxtr(-/-) shoals exhibit a significantly lower social integration than oxtr(-/-) individuals raised in oxtr(+/+) shoals; in contrast, oxtr(+/+) individuals exhibit high levels of social integration irrespective of the shoal type in which they were raised (Table 1; Figure 1H). Social influence assesses how the focal individual affects the shoaling behavior of the remaining shoal members, by measuring the shoal dispersion as defined by the perimeter of the other shoal members (Figure 1I,J). The presence of a single WT (oxtr(+/+)) individual in a oxtr(-/-) shoal was enough to increase its dispersion, whereas the presence of a single oxtr(-/-) individual in a oxtr(+/+) shoal did not affect its dispersion (Table 1; Figure 1J). In summary, we show that distinct components of social behavior are differentially affected by the genetic composition of the social environment versus the oxtr genotype of the focal individual. Social preference shows a marginally significant influence of the genotype of conspecifics. Social recognition exhibited a pure effect of the individual genotype. And clear GixGs interactions were observed in the cases of social habituation and social integration. Social influence had a major contribution of the social environment, which is also the case, to a lesser extent, with social preference. Thus, we demonstrated that genetic variation in the social environment interacts with individual genotype during the developmental acquisition of social behavior. In other words, variation in the genotypes present in the social environment can revert particular phenotypes associated with specific genes. These results are in line with reported interactions between other aspects of the social environment and oxytocin receptor genotype in the determination of social behavior phenotypes in human populations (Thompson et al., 2011; Wade et al., 2015; McQuaid et al., 2013). Our results suggest that more caution is needed in the interpretation of studies using transgenic or mutant individuals that are raised in cohorts of the same genotype, and that some phenotypes observed in transgenic or mutant lines may in fact result from GixGs interactions.

Materials and methods

Key resources table.

Reagent type
(species) or resource
Designation Source or reference Identifiers Additional
information
Genetic reagent, TL (Danio rerio) oxtr mutant line Nunes et al., 2020 ZDB-ALT-190830–1
Commercial assay or kit NucleoSpin Tissue MACHEREY-NAGEL # 740952.50 For oxtr mutant genotyping
Sequence-based reagent sense 5’-TGCGCGAGGAAAACTAGTT-3’ Sigma For oxtr mutant genotyping
Sequence-based reagent antisense 5’-AGCAGACACTCAGAATGGTCA-3’ Sigma For oxtr mutant genotyping
Software, , algorithm SPSS 25.0 SPSS RRID:SCR_002865
Software, , algorithm Imagej (Fiji) Schindelin et al., 2012 RRID:SCR_003070
Software, , algorithm Ethovision XT 11.5 Noldus Technology www.noldus.com/ethovision
Software, , algorithm GraphPad Prism version 6.0 c GraphPad software, San Diego, California, USA www.graphpad.com
Other B and W mini surveillance camera Henelec 300B Acquisition rate of 30 fps
Other Webcameras Logitech HD C525 Acquisition rate of 30 fps

Zebrafish lines and maintenance

Zebrafish were raised and bred according to standard protocols and all experimental procedures were approved by the host institution, Instituto Gulbenkian de Ciência, and by the National Veterinary Authority (DGAV, Portugal; permit number 0421/000/000/2013). OXTR mutant zebrafish line (ZFIN ID: ZDB-ALT-190830–1) was generated and provided by Dr. Gil Levkowitz (Weizmann Institute of Science) using a TALEN-based genome editing system. The characterization of this line has been described in Nunes et al., 2020.

All the experimental groups were formed at 4 days post-fertilization, based on the genotype of the progenitors, before they imprint for olfactory and visual kin recognition (Gerlach et al., 2008; Hinz et al., 2013). To evaluate genotype-environment effects, fish were raised in groups according to the experimental design in Figure 1A and both female and males tested in adulthood (3 months old). Sample sizes varied between nine for heterogeneous groups (i.e. focal individual with different genotype from the remaining individuals in the shoal) and 15 for homogeneous groups (i.e. focal individual with the same genotype of the remaining individuals in the shoal). The smaller sample size of heterogeneous groups is due to the need of genotyping all individuals in these groups to single out the focal individual.

Genotyping

At 3 months old, 1-week before the behavioral screenings, genomic DNA was extracted from adult fin clips using the HotSHOT protocol (Meeker et al., 2007). All group members were fin clipped at different fin locations, to allow their identification while being maintained together. The genomic region of interest was amplified by PCR and sequenced to identify the focal fish in each group. The following primers were used: sense 5’-TGCGCGAGGAAAACTAGTT-3’, antisense 5’-AGCAGACACTCAGAATGGTCA-3’.

Behavioral assays

Video acquisition

Fish were in a tank placed on top of an infrared lightbox and video-recorded either from above (shoal preference and social recognition tests) or laterally (group behaviour tests). Video acquisition was done with software Pinnacle Studio 14 (Corel Corporation, Ottawa, Canada). Shoal preference, social habituation and social recognition analyses were performed with EthoVision video tracking system (Noldus Information Technologies, Wageningen, The Netherlands) and group behavior analyses were done with the open source FIJI image-processing package (Schindelin et al., 2012).

Social preference and social habituation

The social preference test assesses the individual’s sociability by observing the interactions between conspecifics (Ribeiro et al., 2020): a focal fish was placed in a central compartment (30 × 15×10 cm) of a three-compartment tank, separated by transparent and sealed partitions. A shoal of unfamiliar fish was placed in one of the lateral compartments (15 × 10×10 cm), while the other contained only water. To avoid any side bias, the stimuli were balanced across trials. After an acclimatization period (10 min), the focal fish was released from a start box and allowed to explore the tank, while its behavior was video-recorded for 10 min. The time spent by the focal fish near (less than two body lengths) each compartment was quantified and used to calculate the social preference score (SP = Time near shoal/ [Time near shoal + Time near empty]). A score above 0.5 indicates a preference for the shoal.

The social preference test was performed twice, with 24 hr in between, and social preference scores of both tests were used to calculate the habituation index (Hab. Score = 1- [SPTrial2]/[SPTrial1 + SPTrial2]). A score above 0.5 represents a decrease in preference to associate with conspecifics.

Social recognition

The social recognition assay to evaluate short-term (i.e. 10 min retention) social memory was adapted from the procedure already developed in our lab for long-term (i.e. 24 hr retention) social memory in zebrafish (Gerlach et al., 2008), and has already been used successfully in previous studies (Ribeiro et al., 2020; Madeira and Oliveira, 2017). A focal fish was placed for 10 min in the central compartment of a three-compartment tank, separated by transparent and sealed partitions, to acclimatize. The focal fish was allowed to interact visually across partitions with two novel (unfamiliar) conspecifics for 10 min. After, both stimuli were removed, one was placed in the same compartment (familiar conspecific stimulus), while a novel conspecific was placed in the other compartment (novel conspecific stimulus). In a second 10 min interaction, the time spent by the focal fish near each compartment (termed novel cue or familiar cue) was quantified and used to measure the preference for the novel (Recognition Score = Time near Novel/[Time near Novel + Time near Familiar]). A recognition score of 0.5 indicates no preference between novel or familiar conspecifics.

Shoaling behavior

Shoaling behavior is a common behavior present in fish models and allows to determine complex interactions between individuals. Both focal fish and social partners were recorded in the home tanks (3.5L tank). Focal fish were tagged with fin clips for easy identification. The behaviors were video-recorded from side view for 10 min. Two components of shoaling behavior were analyzed manually in time bins of 8 s, using FIJI software (Schindelin et al., 2012): (Moore et al., 1997) focal fish distance to the group centroid (social integration); and (Wolf et al., 1998) the dispersion of the remaining shoal members as measured by their perimeter (social influence).

Data analysis

Data were analysed using SPSS 25.0. All data sets were tested for departures from normality with Shapiro-Wilks test. Two factor univariate ANOVA were used for comparing multiple groups. All data sets were corrected for multiple comparisons. Tukey’s Test comparisons were used as post-hocs. Given that ANOVA is known to be underpowered for detecting significance of genotype x environment interaction (Wahlsten, 1990) we have decided to proceed with post-hoc tests for multiple comparisons among treatments even when GixGs interaction were only marginally significant (p<0.10). Graphs were performed with GraphPad software.

Ethical approval

All experiments were performed in accordance with the relevant guidelines and regulations for the care and use of animals in research and approved by the competent Portuguese authority (Direcção Geral de Alimentação e Veterinária, permit 0421/000/000/2017).

Acknowledgements

We thank IGC Fish Facility for assistance on fish maintenance and Peter McGregor for comments and discussion on an earlier version of the manuscript. The authors declare no conflicts of interest related to this work. This work was funded by a Fundação para a Ciência e a Tecnologia (FCT) research grant (PTDC/BIA-ANM/0810/2014) and a FEDER grant (Lisboa-01–0145-FEDER-030627) awarded to RFO. ARN and MST were supported by Post-doc fellowships from Fundação para a Ciência e a Tecnologia (FCT, ARN: SFRH/BPD/93317/2013). Congento LISBOA-01–0145-FEDER-022170, co-financed by FCT (Portugal) and Lisboa2020, under the PORTUGAL2020 agreement (European Regional Development Fund). The authors declare no competing interests.

Funding Statement

The funders had no role in study design, data collection and interpretation, or the decision to submit the work for publication.

Contributor Information

Rui F Oliveira, Email: ruiol@ispa.pt.

Peggy Mason, University of Chicago, United States.

Catherine Dulac, Harvard University, United States.

Funding Information

This paper was supported by the following grants:

  • European Commission Lisboa-01-0145-FEDER-030627 to Rui F Oliveira.

  • Fundação para a Ciência e a Tecnologia PTDC/BIA-ANM/0810/2014 to Rui F Oliveira.

  • Fundação para a Ciência e a Tecnologia SFRH/BPD/93317/2013 to Ana Rita Nunes, Magda Teles.

  • European Commission LISBOA-01-0145-FEDER-022170 to Rui F Oliveira.

Additional information

Competing interests

No competing interests declared.

Author contributions

Data curation, Formal analysis, Investigation, Visualization, Methodology, Writing - original draft, Writing - review and editing.

Data curation, Formal analysis, Investigation, Visualization, Methodology, Writing - review and editing.

Resources, Data curation, Formal analysis, Methodology, Writing - review and editing.

Resources, Methodology.

Resources, Funding acquisition, Methodology, Writing - review and editing.

Conceptualization, Resources, Supervision, Funding acquisition, Methodology, Writing - original draft, Project administration, Writing - review and editing.

Conceptualization, Resources, Data curation, Formal analysis, Supervision, Investigation, Writing - original draft, Project administration, Writing - review and editing.

Ethics

Animal experimentation: All experiments were performed in accordance with the relevant guidelines and regulations for the care and use of animals in research and approved by the competent Portuguese authority (Direcção Geral de Alimentação e Veterinária, permit 0421/000/000/2017).

Additional files

Transparent reporting form

Data availability

Data used in this study is provided as supplemental material at this stage. Data available on Dryad at doi: https://doi.org/10.5061/dryad.xwdbrv1bq.

The following dataset was generated:

Oliveira RF. 2020. Genetic variation in the social environment affects behavioral phenotypes of oxytocin receptor mutants. Dryad Digital Repository.

References

  1. Baud A, Mulligan MK, Casale FP, Ingels JF, Bohl CJ, Callebert J, Launay JM, Krohn J, Legarra A, Williams RW, Stegle O. Genetic variation in the social environment contributes to health and disease. PLOS Genetics. 2017;13:e1006498. doi: 10.1371/journal.pgen.1006498. [DOI] [PMC free article] [PubMed] [Google Scholar]
  2. Champagne FA, Meaney MJ. Stress during gestation alters postpartum maternal care and the development of the offspring in a rodent model. Biological Psychiatry. 2006;59:1227–1235. doi: 10.1016/j.biopsych.2005.10.016. [DOI] [PubMed] [Google Scholar]
  3. Donaldson ZR, Young LJ. Oxytocin, vasopressin, and the neurogenetics of sociality. Science. 2008;322:900–904. doi: 10.1126/science.1158668. [DOI] [PubMed] [Google Scholar]
  4. Engeszer RE, Ryan MJ, Parichy DM. Learned social preference in zebrafish. Current Biology. 2004;14:881–884. doi: 10.1016/j.cub.2004.04.042. [DOI] [PubMed] [Google Scholar]
  5. Ferguson JN, Young LJ, Hearn EF, Matzuk MM, Insel TR, Winslow JT. Social amnesia in mice lacking the oxytocin gene. Nature Genetics. 2000;25:284–288. doi: 10.1038/77040. [DOI] [PubMed] [Google Scholar]
  6. Gerlach G, Hodgins-Davis A, Avolio C, Schunter C. Kin recognition in zebrafish: a 24-hour window for olfactory imprinting. Proceedings of the Royal Society B: Biological Sciences. 2008;275:2165–2170. doi: 10.1098/rspb.2008.0647. [DOI] [PMC free article] [PubMed] [Google Scholar]
  7. Goodson JL. Deconstructing sociality, social evolution and relevant nonapeptide functions. Psychoneuroendocrinology. 2013;38:465–478. doi: 10.1016/j.psyneuen.2012.12.005. [DOI] [PubMed] [Google Scholar]
  8. Goodson JL, Thompson RR. Nonapeptide mechanisms of social cognition, behavior and species-specific social systems. Current Opinion in Neurobiology. 2010;20:784–794. doi: 10.1016/j.conb.2010.08.020. [DOI] [PubMed] [Google Scholar]
  9. Hinz C, Kobbenbring S, Kress S, Sigman L, Müller A, Gerlach G. Kin recognition in zebrafish, Danio rerio, is based on imprinting on olfactory and visual stimuli. Animal Behaviour. 2013;85:925–930. doi: 10.1016/j.anbehav.2013.02.010. [DOI] [Google Scholar]
  10. Holt-Lunstad J, Smith TB, Layton JB. Social relationships and mortality risk: a meta-analytic review. PLOS Medicine. 2010;7:e1000316. doi: 10.1371/journal.pmed.1000316. [DOI] [PMC free article] [PubMed] [Google Scholar]
  11. Holt-Lunstad J, Smith TB, Baker M, Harris T, Stephenson D. Loneliness and social isolation as risk factors for mortality. Perspectives on Psychological Science. 2015;10:227–237. doi: 10.1177/1745691614568352. [DOI] [PubMed] [Google Scholar]
  12. Hsu PD, Lander ES, Zhang F. Development and applications of CRISPR-Cas9 for genome engineering. Cell. 2014;157:1262–1278. doi: 10.1016/j.cell.2014.05.010. [DOI] [PMC free article] [PubMed] [Google Scholar]
  13. Huang ZJ, Zeng H. Genetic approaches to neural circuits in the mouse. Annual Review of Neuroscience. 2013;36:183–215. doi: 10.1146/annurev-neuro-062012-170307. [DOI] [PubMed] [Google Scholar]
  14. Madeira N, Oliveira RF. Long-Term social recognition memory in zebrafish. Zebrafish. 2017;14:305–310. doi: 10.1089/zeb.2017.1430. [DOI] [PubMed] [Google Scholar]
  15. McQuaid RJ, McInnis OA, Stead JD, Matheson K, Anisman H. A paradoxical association of an oxytocin receptor gene polymorphism: early-life adversity and vulnerability to depression. Frontiers in Neuroscience. 2013;7:128. doi: 10.3389/fnins.2013.00128. [DOI] [PMC free article] [PubMed] [Google Scholar]
  16. Meeker ND, Hutchinson SA, Ho L, Trede NS. Method for isolation of PCR-ready genomic DNA from zebrafish tissues. BioTechniques. 2007;43:610–614. doi: 10.2144/000112619. [DOI] [PubMed] [Google Scholar]
  17. Miller N, Gerlai R. Quantification of shoaling behaviour in zebrafish (Danio rerio) Behavioural Brain Research. 2007;184:157–166. doi: 10.1016/j.bbr.2007.07.007. [DOI] [PubMed] [Google Scholar]
  18. Miller N, Gerlai R. From schooling to shoaling: patterns of collective motion in zebrafish (Danio rerio) PLOS ONE. 2012;7:e48865. doi: 10.1371/journal.pone.0048865. [DOI] [PMC free article] [PubMed] [Google Scholar]
  19. Moore AJ, Brodie ED, Wolf JB. Interacting phenotypes and the evolutionary process: I. direct and indirect genetic effects of social interactions. Evolution. 1997;51:1352–1362. doi: 10.1111/j.1558-5646.1997.tb01458.x. [DOI] [PubMed] [Google Scholar]
  20. Nunes AR, Ruhl N, Winberg S, Oliveira RF. Social phenotypes in zebrafish. In: Allan V, editor. The Rights and Wrongs of Zebrafish: Behavioral Phenotyping of Zebrafish. Springer; 2017. pp. 95–130. [DOI] [Google Scholar]
  21. Nunes AR, Carreira L, Anbalagan S, Blechman J, Levkowitz G, Oliveira RF. Perceptual mechanisms of social affiliation in zebrafish. Scientific Reports. 2020;10:3642. doi: 10.1038/s41598-020-60154-8. [DOI] [PMC free article] [PubMed] [Google Scholar]
  22. Orger MB, de Polavieja GG. Zebrafish behavior: opportunities and challenges. Annual Review of Neuroscience. 2017;40:125–147. doi: 10.1146/annurev-neuro-071714-033857. [DOI] [PubMed] [Google Scholar]
  23. Petfield D, Chenoweth SF, Rundle HD, Blows MW. Genetic variance in female condition predicts indirect genetic variance in male sexual display traits. PNAS. 2005;102:6045–6050. doi: 10.1073/pnas.0409378102. [DOI] [PMC free article] [PubMed] [Google Scholar]
  24. Ribeiro D, Nunes AR, Gliksberg M, Anbalagan S, Levkowitz G, Oliveira RF. Oxytocin receptor signalling modulates novelty recognition but not social preference in zebrafish. Journal of Neuroendocrinology. 2020;32:e12834. doi: 10.1111/jne.12834. [DOI] [PubMed] [Google Scholar]
  25. Santostefano F, Wilson AJ, Niemelä PT, Dingemanse NJ. Indirect genetic effects: a key component of the genetic architecture of behaviour. Scientific Reports. 2017;7:10235. doi: 10.1038/s41598-017-08258-6. [DOI] [PMC free article] [PubMed] [Google Scholar]
  26. Sartori C, Mantovani R. Indirect genetic effects and the genetic bases of social dominance: evidence from cattle. Heredity. 2013;110:3–9. doi: 10.1038/hdy.2012.56. [DOI] [PMC free article] [PubMed] [Google Scholar]
  27. Schindelin J, Arganda-Carreras I, Frise E, Kaynig V, Longair M, Pietzsch T, Preibisch S, Rueden C, Saalfeld S, Schmid B, Tinevez JY, White DJ, Hartenstein V, Eliceiri K, Tomancak P, Cardona A. Fiji: an open-source platform for biological-image analysis. Nature Methods. 2012;9:676–682. doi: 10.1038/nmeth.2019. [DOI] [PMC free article] [PubMed] [Google Scholar]
  28. Stoop R. Neuromodulation by oxytocin and vasopressin. Neuron. 2012;76:142–159. doi: 10.1016/j.neuron.2012.09.025. [DOI] [PubMed] [Google Scholar]
  29. Thompson RJ, Parker KJ, Hallmayer JF, Waugh CE, Gotlib IH. Oxytocin receptor gene polymorphism (rs2254298) interacts with familial risk for psychopathology to predict symptoms of depression and anxiety in adolescent girls. Psychoneuroendocrinology. 2011;36:144–147. doi: 10.1016/j.psyneuen.2010.07.003. [DOI] [PMC free article] [PubMed] [Google Scholar]
  30. Wade M, Hoffmann TJ, Jenkins JM. Gene-environment interaction between the oxytocin receptor (OXTR) gene and parenting behaviour on children's theory of mind. Social Cognitive and Affective Neuroscience. 2015;10:1749–1757. doi: 10.1093/scan/nsv064. [DOI] [PMC free article] [PubMed] [Google Scholar]
  31. Wahlsten D. Insensitivity of the analysis of variance to heredity-environment interaction. Behavioral and Brain Sciences. 1990;13:109–120. doi: 10.1017/S0140525X00077797. [DOI] [Google Scholar]
  32. Wilson AJ, Coltman DW, Pemberton JM, Overall ADJ, Byrne KA, Kruuk LEB. Maternal genetic effects set the potential for evolution in a free-living vertebrate population. Journal of Evolutionary Biology. 2004;18:405–414. doi: 10.1111/j.1420-9101.2004.00824.x. [DOI] [PubMed] [Google Scholar]
  33. Wilson AJ, Morrissey MB, Adams MJ, Walling CA, Guinness FE, Pemberton JM, Clutton-Brock TH, Kruuk LE. Indirect genetics effects and evolutionary constraint: an analysis of social dominance in red deer, Cervus elaphus. Journal of Evolutionary Biology. 2011;24:772–783. doi: 10.1111/j.1420-9101.2010.02212.x. [DOI] [PubMed] [Google Scholar]
  34. Wolf JB, Brodie Iii ED, Cheverud JM, Moore AJ, Wade MJ. Evolutionary consequences of indirect genetic effects. Trends in Ecology & Evolution. 1998;13:64–69. doi: 10.1016/S0169-5347(97)01233-0. [DOI] [PubMed] [Google Scholar]
  35. Zebrafish Neuroscience Research Consortium. Kalueff AV, Gebhardt M, Stewart AM, Cachat JM, Brimmer M, Chawla JS, Craddock C, Kyzar EJ, Roth A, Landsman S, Gaikwad S, Robinson K, Baatrup E, Tierney K, Shamchuk A, Norton W, Miller N, Nicolson T, Braubach O, Gilman CP, Pittman J, Rosemberg DB, Gerlai R, Echevarria D, Lamb E, Neuhauss SC, Weng W, Bally-Cuif L, Schneider H. Towards a comprehensive catalog of zebrafish behavior 1.0 and beyond. Zebrafish. 2013;10:70–86. doi: 10.1089/zeb.2012.0861. [DOI] [PMC free article] [PubMed] [Google Scholar]

Decision letter

Editor: Peggy Mason1
Reviewed by: Peggy Mason2, Lauren A O'Connell3, Robert Gerlai4

In the interests of transparency, eLife publishes the most substantive revision requests and the accompanying author responses.

Acceptance summary:

This paper asks a fundamental question regarding the influence of others' genotypes on the behavioral expression of an individual's genotype. The design is perfectly aligned to the question from the choice of the animal used to the conditions, genotypes and behavioral assays. The results are intrinsically interesting and also provide a critical proof of principle that will enable a myriad of future follow up investigations.

Decision letter after peer review:

Thank you for submitting your article "Genetic variation in the social environment affects behavioral phenotypes of oxytocin receptor mutants in zebrafish" for consideration by eLife. Your article has been reviewed by Peggy Mason as Reviewing Editor and Catherine Dulac as the Senior Editor, a Reviewing Editor, and three reviewers. The following individuals involved in review of your submission have agreed to reveal their identity: Peggy Mason (Reviewer #1); Lauren A O'Connell (Reviewer #2); Robert Gerlai (Reviewer #3).

The reviewers have discussed the reviews with one another and the Reviewing Editor has drafted this decision to help you prepare a revised submission.

We would like to draw your attention to changes in our revision policy that we have made in response to COVID-19 (https://elifesciences.org/articles/57162). Specifically, we are asking editors to accept without delay manuscripts, like yours, that they judge can stand as eLife papers without additional data, even if they feel that they would make the manuscript stronger. Thus the revisions requested below only address clarity and presentation.

The reviewers were excited about this clean study showing that the phenotypic expression of a genotype depends on the genotype of the individuals in the surrounding group as well as an individual's own genotype. This clear and fundamental study yielded an important result that is of broad interest to scientists trying to link genetics to behavior. It will inform both the design and interpretation of future work.

Reviewer #1:

This paper asks a fundamental question regarding the influence of others' genotypes on the behavioral expression of an individual's genotype. The design is perfectly aligned to the question from the choice of the animal used to the conditions, genotypes and behavioral assays. The results are intrinsically interesting and also provide a critical proof of principle that will enable a myriad of future follow up investigations.

My major comments are analytical and rhetorical. The only experimental question I have is what are the N-s? Please explicitly state how many fish were studied in each condition.

I disagree with the terminology used. Eg in the Abstract: the social environment, which is composed of conspecifics genotypes, NO, clearly the social environment is far more than the genotypes of those around an individual. And the issue is not really genetics vs environment. It is Genetics-self/individual vs Genetics-shoal. The environment, even the "social" environment, comprises far more than a fish's genetics: its age, reproductive status, nutritional/stress state and so on. In the Introduction, the authors say that previous works "have ignored the potential contribution of the environment to the behavioral phenotype studied." --This is not true. There is a large literature on how various forms of stress, occurring neonatally or at other times in the life cycle, interact with genotype. This example highlights the need to change the "environment" rhetoric used. It is, as the authors say: the genotypic composition of the social environment (Abstract). [Here I would only add the conspecific social environment as there are other species in an individual's natural environment.]

P=0.058 -> This P value is used in line Results and Discussion section to say there was no significant effect of either genotype, environment or GxEs interaction on social preference. This appears to be an overstated adherence to p<0.05 as meaningful. Is there a difference?

(SP = Time near shoal/ [Time near shoal + Time near empty]) -> why not just use Time near shoal? What is left out here is the time a fish spends in the middle of the middle chamber. A fish that spends 1 minite and one that spends 9 minutes next to the shoal would both be seen as low social preference if they spent no time next to the empty tank but these two fish would appear to differ. Additionally, the heat plot in Figure 1B in particular suggests that the proximity criterion is imposed upon the data arbitrarily and does not reflect the distribution of the fish's location. I suspect that a better metric could be devised in short order. Finally, it was unclear to me whether a similar criterion of proximity was used for the other metrics but if so, the same comment goes for them as for social preference.

The results would be far more accessible if the metrics were described in the text. One of the lovely features of eLife is that length is not an issue. Take the space you need to tell your story and no more is the guide rather than an arbitrary number of words. So please explain the metrics in the Results section. Even the explanations that are present could be expanded to great effect. For example, social preference is tendency to be near other fish rather than empty water (other choices for the non-preferred tank could conceivably be objects, a group of fewer fish, a single fish and so on). And while the metrics of habituation and individual recognition are clear (from the methods section), a word about the meaning of these metrics would be helpful. In other words, give the reader a reason to think that the metrics are important rather than simply measurable and therefore useful.

Reviewer #2:

This Short Report describes an elegantly designed experiment to show that the genotype of the rearing environment is important for behavior phenotypes of knockout animals in adulthood. They make the important point that the genotype of the rearing environment can influence behavioral phenotypes of knockout animals and cautions the scientific community to think about the genetic environment in which their knockouts are being raised, which will become even more important as more and more labs use knockout technologies in their animal of choice. Overall, I think this simple study is an important contribution to the field and have no major concerns.

Reviewer #3:

This is a brilliantly written, concise, logical and easy to follow paper in which the authors describe significant findings demonstrating GxE interaction in social behavior in zebrafish. The experiments are well described, well conducted, the results are well documented, illustrated, and are significant and important. The interpretation of the results is correct, and in addition to specifically for zebrafish social behavior research they also send a crucial message to all readers who study genetic effects on behavior.

1) Introduction.

Exactly because of the generality of the message, it'd be nice if the authors could expand their introduction/discussion and cite studies on zebrafish social behavior (e.g. Noam Miller had a series of experiments), genotype x environment interaction (with mice as well as with other fish species), as well as on the interpretation of studies using genetic manipulation (e.g. knock out). This broader intro would place the current study in the right context and would also correct the somewhat haphazard way the authors picked some studies to cite.

2) Materials and methods section.

Habituation score is not described for the social recognition test.

Shoaling behavior was recorded from a side-view camera, yet Figure 1G and I are depicting the fish from top view. Also, most shoaling studies using live shoal monitoring indeed monitor shoal cohesion, shoaling behavior with overhead cameras because shoal dispersion is better quantified in this two-dimensional plane, as opposed to from the side. One reason for this is that the relative distance of the fish to the top or to the bottom is more of a measure of fear/anxiety and less so of shoaling/social behavioral responses in laboratory tanks and in natural habitats with relatively shallow waters. Why was the side-view chosen?

Data analysis was conducted using ANOVA followed by Tukey's multiple range post-hoc tests. These are standard and accepted tests, but I note that ANOVA is known to be underpowered for detecting significance of interaction between its main factors. In fact, Wahlsten, (1990) demonstrated this specifically in the context of genotype x environment interaction. I draw the authors' attention to this because in their stat table, for example, they report G x E as p = 0.088 for social group dispersion, but find (I assume by Tukey) a clear indication of G x E interaction. It would be important for the reader to know the logic of how the authors proceeded from ANOVA to Tukey and how these seemingly conflicting stat findings are interpreted. That is, please cite the Wahlsten, 1990 paper and state what I mentioned above.

3) interpretation.

It is possible that the mutants do not recognize shoal-mates as conspecifics or do not have the ability to perceive and/or process finer social signals, hence the reduced discrimination score. There may be several other possible explanations too. Such possibilities of interpretive ideas/working hypotheses should be offered as they would help think about future studies for the analysis of behavioral as well as neurobiological mechanisms underlying the mutation induced changes in particular and the oxytocin-system in general.

Reviewer #4

The authors present an interesting paper that supports evidence for indirect genetics effects on social behaviour. They exploit the use of a zebrafish mutant for oxytocin receptor to understand if the social environment can modify the phenotypical response of the mutant in a plethora of different social behaviour assays.

The results of this paper have potentially a wide impact on the way social behavioural paradims are planned and executed. Therefore, the results need to be strong and heavily validated. I feel some controls and analysis could be added to support the main point. Below are my concerns about the paper:

1) Figure 1B and E

- I could not find on the legend what the heat map represents. Is it from a single fish? What type of fish and for how long?

2) Results Figure 1C.

- The social preference of w/t and OtxR fish raised with OtxR mutants is reduced. This is an important finding and it is not discussed in the paper. It seems that the social environment in both fish reduces sociality.

- The authors do not specify in the text if some of the fish used as social cue have been raised together with the focal fish.

- The authors identify mutated or w/t fish by genotyping the fish prior the experiments. How much time do the fish have to recover from the genotyping before the experiment, and are the fish selected for testing left in single tanks during this period of time?

3) Results Figure 1D.

- W/t fish seem to maintain similar habituation score when raised with w/t or OtxR mutants. In contrast, OtxR mutants seems to pay less attention to the social cue when exposed for the second time. This could be due to the fact that OtxR fish have a reduced interest for the social cue, however, other parameters could also be responsible for this. It is possible that the OtxR fish show a reduction of exploration to the chamber that is not specific to the social cue? Have the authors tested this possibility?

- Are the tested fish exposed to the exact same group of social cue fish after 24hours?

- The authors should analyse how w/t vs OtxR social cue interact differently with the test fish. This could provide an explanation for the difference seen in the graph results.

4) Results Figure G-J

- The authors say in the methods that they use tags to identify the tested fish. When was this tag introduced? The authors need to describe in detail what these tags are.

- My major concern is that the presence of a tag on a fish could also be the cause of the different behavioural phenotype seen. This could be resolved by using one of the several available tracking systems that allow to identify individual fish with high accuracy (Yun-Xiang et al., 2018, Romero-Ferrero et al., 2019).

- The authors in the methods write that a camera from the side was used to record the experiments. If this is the case, the schematics in Figure 1G and I should show fish from the side.

- "Two components of shoaling behaviour were analysed in time bins of 8 seconds". What is the frequency of recording of the experiments? Did the authors saw a difference over time?

Results and Discussion section: "In other words, the social environment can revert phenotypes associated with specific genes". This sentence is too strong since only few of the behaviours described in the paper seem to be modified by the social environment.

eLife. 2020 Sep 9;9:e56973. doi: 10.7554/eLife.56973.sa2

Author response


The reviewers were excited about this clean study showing that the phenotypic expression of a genotype depends on the genotype of the individuals in the surrounding group as well as an individual's own genotype. This clear and fundamental study yielded an important result that is of broad interest to scientists trying to link genetics to behavior. It will inform both the design and interpretation of future work.

Reviewer #1:

This paper asks a fundamental question regarding the influence of others' genotypes on the behavioral expression of an individual's genotype. The design is perfectly aligned to the question from the choice of the animal used to the conditions, genotypes and behavioral assays. The results are intrinsically interesting and also provide a critical proof of principle that will enable a myriad of future follow up investigations.

We thank very much the comments of the reviewer.

My major comments are analytical and rhetorical. The only experimental question I have is what are the N-s? Please explicitly state how many fish were studied in each condition.

The sample sizes in the 4 experimental conditions were: (1) wild-type in a wild-type shoal, n=15; (2) OxtR+/- in an OxtR+/- shoal, n=15; (3) Wild-type in a OxtR+/- shoal, n=9; (4) OxtR+/- in a wild-type shoal, n=9. This information was available in the legend of Figure 1. To make it more visible, we have also included this information in the Materials and methods section of the revised manuscript.

I disagree with the terminology used. Eg in the Abstract: the social environment, which is composed of conspecifics genotypes, NO, clearly the social environment is far more than the genotypes of those around an individual. And the issue is not really genetics vs environment. It is Genetics-self/individual vs Genetics-shoal. The environment, even the "social" environment, comprises far more than a fish's genetics: its age, reproductive status, nutritional/stress state and so on.

We totally agree with this remark. We have now realized that in some passages of the text one could get the impression that the social environment could be reduced to the genotypes of conspecifics, which is not what we meant. To avoid misleading the readers and following this recommendation of the reviewer, we have replaced GxEs by GixGs in order to emphasize the contributions of the focal vs. conspecifics genotypes to the observed phenotypes. Hence, we hope to make clear, in this passage and along the whole manuscript, that the conspecifics’ genotypes are the component of the social environment that we are addressing in this paper, but that there are other dimensions of the social environment.

In the Introduction, the authors say that previous works "have ignored the potential contribution of the environment to the behavioral phenotype studied." --This is not true. There is a large literature on how various forms of stress, occurring neonatally or at other times in the life cycle, interact with genotype. This example highlights the need to change the "environment" rhetoric used. It is, as the authors say: the genotypic composition of the social environment (Abstract). [Here I would only add the conspecific social environment as there are other species in an individual's natural environment.]

Text has been changed accordingly.

P=0.058 -> This P value is used in line Results and Discussion section to say there was no significant effect of either genotype, environment or GxEs interaction on social preference. This appears to be an overstated adherence to p<0.05 as meaningful. Is there a difference?

As stated by the referee, the genotype of conspecifics main effect is marginally significant (p=0.058 with a partial partial η2 = 0.079, i.e. moderate effect), while no significant main effect is observed for genotype (p=0.195, partial η2 = 0.038, low effect) or GixGs interaction (p=0.825, partial η2 = 0.001, low effect)(note: we have used as reference for the magnitude of effect sizes: small for partial η2 > 0.01; medium for partial η2 > 0.06; and large for partial η2 > 0.14; http://imaging.mrc-cbu.cam.ac.uk/statswiki/FAQ/effectSize). To support the discussion of this analysis, we have now included in the Table 1 the partial eta squared for each test performed. Text has been changed accordingly.

(SP = Time near shoal/ [Time near shoal + Time near empty]) -> why not just use Time near shoal? What is left out here is the time a fish spends in the middle of the middle chamber. A fish that spends 1 min and one that spends 9 min next to the shoal would both be seen as low social preference if they spent no time next to the empty tank but these two fish would appear to differ.

We understand the reviewer concerns. However, if one uses the time near the shoal without taking in consideration the time near the empty tank we are not ruling out other physical factors of the empty tank in the attraction expressed by the focal fish towards the shoal that is presented inside a side compartment of the tank. For this reason, preference scores, such as the one we have used, are commonly used in the field, and are needed to assess the relative attraction towards the shoal after removing any putative effects of attraction towards an empty tank/ tank wall (e.g. thigmotaxis).

Additionally, the heat plot in 1B in particular suggests that the proximity criterion is imposed upon the data arbitrarily and does not reflect the distribution of the fish's location. I suspect that a better metric could be devised in short order.

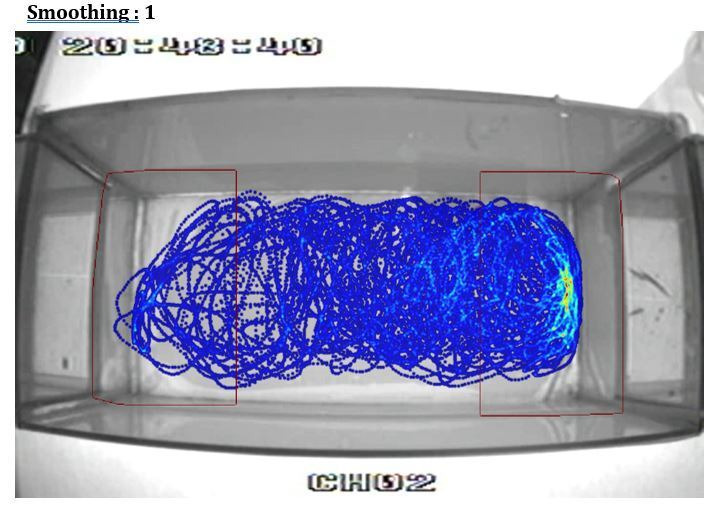
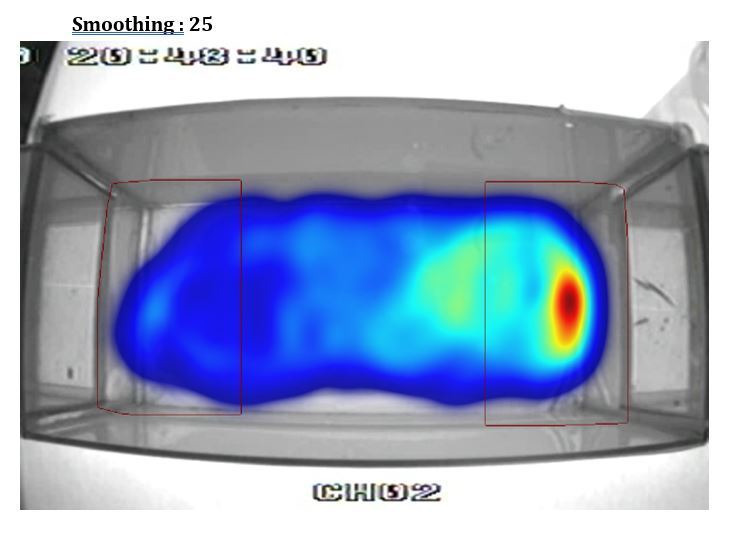
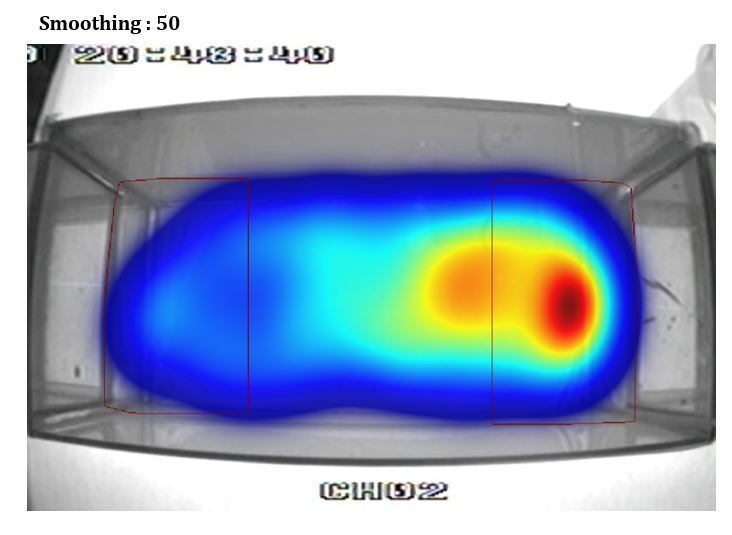
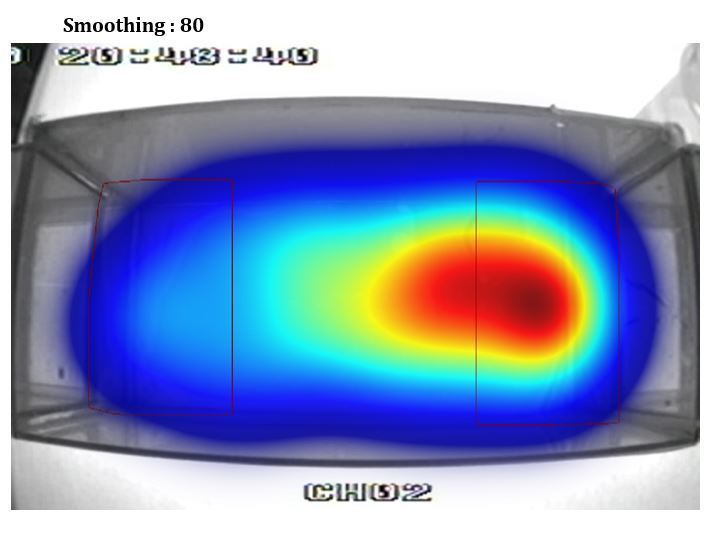
This is an artifact of using different smoothing parameters to build the heatmap from the videotracking (using Ethovision). To illustrate this point we show in Author response image 1, Author response image 2, Author response image 3, Author response image 4 the original video tracking and its heatmap representation using different smoothing parameters. We have inadvertently used a very high smoothing (80) which have extended the high-density area outside the RoI. However, with lower smoothing values (e.g. 25, 50) the peak density of the spatial distribution of the fish is clearly within the RoI. We have now used a smoothing of 25 in Figure 1B.

Author response image 1.

Author response image 1.

Author response image 2.

Author response image 2.

Author response image 3.

Author response image 3.

Author response image 4.

Author response image 4.

Finally, it was unclear to me whether a similar criterion of proximity was used for the other metrics but if so, the same comment goes for them as for social preference.

An arbitrarily defined RoI was also used in the social recognition test, and subsequently an index (subsection “Social recognition”; Recognition Score = Time near Novel/[Time near Novel + Time near Familiar]) was used. For the same reason detailed above one cannot simply use the percentage of time spent with one of the two individuals and this is the score commonly used to measure the discrimination between the two stimuli fish. Anyway, we agree with the reviewer that in future studies it will be important to develop metrics of social preference and social recognition that are independent of arbitrarily defined RoIs.

The results would be far more accessible if the metrics were described in the text. One of the lovely features of eLife is that length is not an issue. Take the space you need to tell your story and no more is the guide rather than an arbitrary number of words. So please explain the metrics in the Results section. Even the explanations that are present could be expanded to great effect. For example, social preference is tendency to be near other fish rather than empty water (other choices for the non-preferred tank could conceivably be objects, a group of fewer fish, a single fish and so on). And while the metrics of habituation and individual recognition are clear (from the methods section), a word about the meaning of these metrics would be helpful. In other words, give the reader a reason to think that the metrics are important rather than simply measurable and therefore useful.

We have detailed more the rational for metrics used at the end of the Introduction. We acknowledged the recommendation for the use of more text as needed, although we are trying to follow the eLife recommendation that Short Reports should not exceed 1,500 words in the main text (excluding the Materials and methods section, References, and Figure legends).

Reviewer #2:

This Short Report describes an elegantly designed experiment to show that the genotype of the rearing environment is important for behavior phenotypes of knockout animals in adulthood. They make the important point that the genotype of the rearing environment can influence behavioral phenotypes of knockout animals and cautions the scientific community to think about the genetic environment in which their knockouts are being raised, which will become even more important as more and more labs use knockout technologies in their animal of choice. Overall, I think this simple study is an important contribution to the field and have no major concerns.

We thank very much the commentaries of the reviewer.

Reviewer #3:

This is a brilliantly written, concise, logical and easy to follow paper in which the authors describe significant findings demonstrating GxE interaction in social behavior in zebrafish. The experiments are well described, well conducted, the results are well documented, illustrated, and are significant and important. The interpretation of the results is correct, and in addition to specifically for zebrafish social behavior research they also send a crucial message to all readers who study genetic effects on behavior.

1) Introduction.

Exactly because of the generality of the message, it'd be nice if the authors could expand their introduction/discussion and cite studies on zebrafish social behavior (e.g. Noam Miller had a series of experiments), genotype x environment interaction (with mice as well as with other fish species), as well as on the interpretation of studies using genetic manipulation (e.g. knock out). This broader intro would place the current study in the right context and would also correct the somewhat haphazard way the authors picked some studies to cite.

We acknowledge the reviewer suggestion. However, eLife has a recommendation that the main text of Short Reports should not exceed 1,500 words (which includes Introduction, Results and Discussion section). Moreover, we have focused the Introduction in social genetic effects, which is a particular case of genotype x environment interaction (in which the genotype of conspecifics present in the environment is the environmental component that is taken into consideration), and we would like to keep it focused instead of opening it to general GxE effects, for which there is an abundant literature. Nevertheless, in the revised text we cite some of the suggested literature on zebrafish social behavior, without increasing significantly or changing the tone of the Introduction.

2) Materials and methods section.

Habituation score is not described for the social recognition test.

We have not measured habituation in the social recognition test since the construct of habituation in the scope of discrimination learning is not established in the literature. In fact, both habituation and recognition represent two different types of learning (the former is a single stimulus learning and the latter a two-stimuli learning). Thus, the social recognition test was performed only once and we reported the social recognition score which translates the ability of the fish to discriminate between a familiar vs. a novel fish, which is what is commonly reported in this type of study in other species, such as rodents.

Shoaling behavior was recorded from a side-view camera, yet Figure 1G and I are depicting the fish from top view. Also, most shoaling studies using live shoal monitoring indeed monitor shoal cohesion, shoaling behavior with overhead cameras because shoal dispersion is better quantified in this two-dimensional plane, as opposed to from the side. One reason for this is that the relative distance of the fish to the top or to the bottom is more of a measure of fear/anxiety and less so of shoaling/social behavioral responses in laboratory tanks and in natural habitats with relatively shallow waters. Why was the side-view chosen?

We agree with the reviewer, but in we recorded the fish in their home tanks not only to reduce fish manipulation and consequently, stress induced by the manipulation, but mainly for us to be able to identify the focal fish within a group (all fishes were fin clipped at different locations to allow the identification of the focal fish after genotyping). In this respect, it would be impossible to identify the focal fish if the recording was done from a top view. We have now changed the Figure 1G and I to reflect the recording from a side-view.

Data analysis was conducted using ANOVA followed by Tukey's multiple range post-hoc tests. These are standard and accepted tests, but I note that ANOVA is known to be underpowered for detecting significance of interaction between its main factors. In fact, Wahlsten, (1990) demonstrated this specifically in the context of genotype x environment interaction. I draw the authors' attention to this because in their stat table, for example, they report G x E as p = 0.088 for social group dispersion, but find (I assume by Tukey) a clear indication of G x E interaction. It would be important for the reader to know the logic of how the authors proceeded from ANOVA to Tukey and how these seemingly conflicting stat findings are interpreted. That is, please cite the Wahlsten, 1990 paper and state what I mentioned above.

Following this commentary we have revised the use of post-hoc Tukey tests in this study following the ANOVA main effects and interaction tests. Given the low power of ANOVA for detecting significance of interaction between its main factors mentioned by the reviewer, we have decided to proceed with post-hoc tests when the p-value for the interaction was marginally significant (p<0.10). Otherwise, we have not proceeded with the post-hoc analysis for the interaction. As a result we have changed Figure 1F where there was an effect of genotype but not of the interaction, and we kept the post-hoc analysis in Figure 1J, where there was a marginally significant GixGs interaction (p=0.088). Moreover, we have now also included the partial eta squared in the revised Table 1 and the marginally significant GixGs interaction reported shows a moderate partial η2 of 0.065.

3) interpretation.

It is possible that the mutants do not recognize shoal-mates as conspecifics or do not have the ability to perceive and/or process finer social signals, hence the reduced discrimination score. There may be several other possible explanations too. Such possibilities of interpretive ideas/working hypotheses should be offered as they would help think about future studies for the analysis of behavioral as well as neurobiological mechanisms underlying the mutation induced changes in particular and the oxytocin-system in general.

In this paper we aim to draw attention to potential GixGs effects in GMO animals used in behavioral neuroscience, and we used the oxt-receptor (oxtr) mutant as a case study. Thus, in the writing of the paper we are more focused on establishing a proof of concept rather than providing detailed tentative hypothesis for the observed results. Nevertheless, regarding the genotypic effect observed in oxtr-/- fish, it has already been reported in another recent study from our lab (Ribeiro et al., 2020), where we have shown that this deficit is also present for object recognition, hence suggesting a general recognition memory deficit rather than a specific deficit in the social domain. We have added this information to the revised text.

Reviewer #4

The authors present an interesting paper that supports evidence for indirect genetics effects on social behaviour. They exploit the use of a zebrafish mutant for oxytocin receptor to understand if the social environment can modify the phenotypical response of the mutant in a plethora of different social behaviour assays.

The results of this paper have potentially a wide impact on the way social behavioural paradims are planned and executed. Therefore, the results need to be strong and heavily validated.

We thank the reviewer for the commentaries.

I feel some controls and analysis could be added to support the main point. Below are my concerns about the paper:

1) Figure 1B and E

- I could not find on the legend what the heat map represents. Is it from a single fish? What type of fish and for how long?

The heat map is from a single representative WT focal fish raised in a wild-type social environment during a 10minute trial in both social preference (1B) and social recognition (1E). We have now included this information in the figure legend.

2) Results Figure 1C.

- The social preference of w/t and OtxR fish raised with OtxR mutants is reduced. This is an important finding and it is not discussed in the paper. It seems that the social environment in both fish reduces sociality.

As mentioned above by referee 1, there is a marginally significant main environment effect on social preference (p=0.058). We have now highlighted this finding in the last paragraph of the Results section.

- The authors do not specify in the text if some of the fish used as social cue have been raised together with the focal fish.

Fish used as social cue were always unfamiliar fish which were not raised together with the focal fish. This is applicable for both Social Preference and first part of the social recognition test. We have now included this information in the subsection “Social preference and social habituation”.

- The authors identify mutated or w/t fish by genotyping the fish prior the experiments. How much time do the fish have to recover from the genotyping before the experiment, and are the fish selected for testing left in single tanks during this period of time?

Fish were genotyped by fin cliping one-week prior to the experiments, to allow them to recover before being tested. During this period of time, the fish selected for testing were always together with their group members, which was possible because all members of the group were fin clipped at specific fin locations. To make it clear, we have now included this information in the subsection “Genotyping”.

3) Results Figure 1D.

- W/t fish seem to maintain similar habituation score when raised with w/t or OtxR mutants. In contrast, OtxR mutants seems to pay less attention to the social cue when exposed for the second time. This could be due to the fact that OtxR fish have a reduced interest for the social cue, however, other parameters could also be responsible for this. It is possible that the OtxR fish show a reduction of exploration to the chamber that is not specific to the social cue? Have the authors tested this possibility?

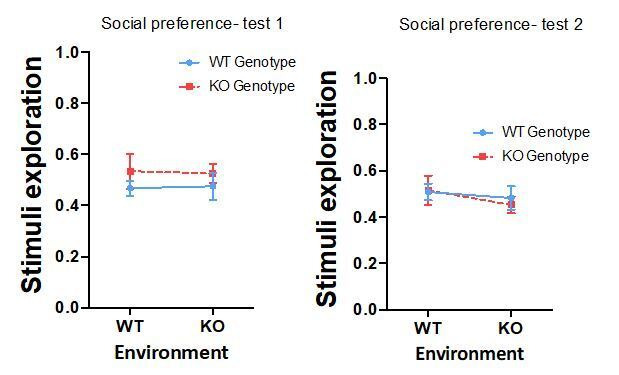
We have also computed stimuli exploratory scores (stimuli exploratory score = (T shoal + T empty) / T total). As can be observed in the graphs bellow, there were no differences in stimuli exploratory score between the different groups in the two tests performed for social preference (Test 1- genotype: p=0.206, partial η2 0.036; environment: p=0.992, partial η2 0.000; GixGs interaction: p=0.867, partial η2 0.001; Test 2- genotype: p=0.802, partial η2 0.001; environment: p=0.336, partial η2 0.021; GixGs interaction: p=0.686, partial η2 0.004).

Author response image 5.

Author response image 5.

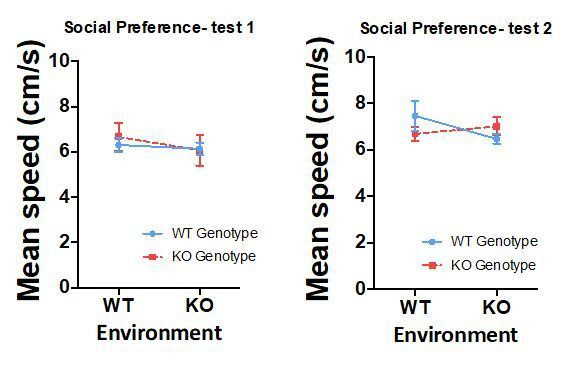
Furthermore, as shown in the following graphs, there are no differences in mean speed of the different groups during the two tests of social preference performed (Test 1- genotype: p=0.794, partial η2 0.002; environment: p=0.492, partial η2 0.011; GixGs interaction: p=0.703, partial η2 0.003; Test 2- genotype: p=0.812, partial η2 0.001; environment: p=0.516, partial η2 0.010; GixGs interaction: p=0.202, partial η2 0.037).

Author response image 6.

Author response image 6.

- Are the tested fish exposed to the exact same group of social cue fish after 24hours?

After 24 hours, fish were exposed to a different shoal of conspecifics in the same behavioral setup.

- The authors should analyse how w/t vs OtxR social cue interact differently with the test fish. This could provide an explanation for the difference seen in the graph results.

Although we agree that this analysis could be very interesting, it is currently not possible because the shoal of conspecifics were not recorded during the trial, only the focal fish.

4) Results Figure G-J

- The authors say in the methods that they use tags to identify the tested fish. When was this tag introduced? The authors need to describe in detail what these tags are.

We clearly explain in the revised text that fish were tagged through fin clipping at different fin locations in order to genotype and identify the focal fish, one-week prior to the behavioral experiment. The following fin clips were performed within each group:

Fish 1- Bottom caudal fin

Fish 2- Top caudal fin

Fish 3- Bottom and Top caudal fin

Fish 4- Bottom caudal and anal fin

Fish 5- Top caudal and anal fin

- My major concern is that the presence of a tag on a fish could also be the cause of the different behavioural phenotype seen. This could be resolved by using one of the several available tracking systems that allow to identify individual fish with high accuracy (Yun-Xiang et al., 2018, Romero-Ferrero et al., 2019).

We believe that the fin clipping was not the cause of the different behavioral phenotypes observed since: (1) all fish from the group were fin clipped at different fin locations to allow their identification; (2) the fin clip of the focal fish was not always in the same position; and (3) fish were allowed one-week recovery before being tested.

- The authors in the methods write that a camera from the side was used to record the experiments. If this is the case, the schematics in Figure 1G and I should show fish from the side.

Figure has been changed accordingly.

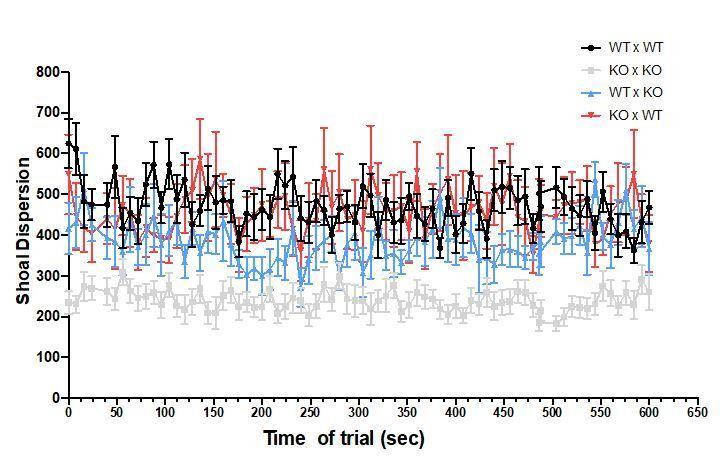
- "Two components of shoaling behaviour were analysed in time bins of 8 seconds". What is the frequency of recording of the experiments? Did the authors saw a difference over time?

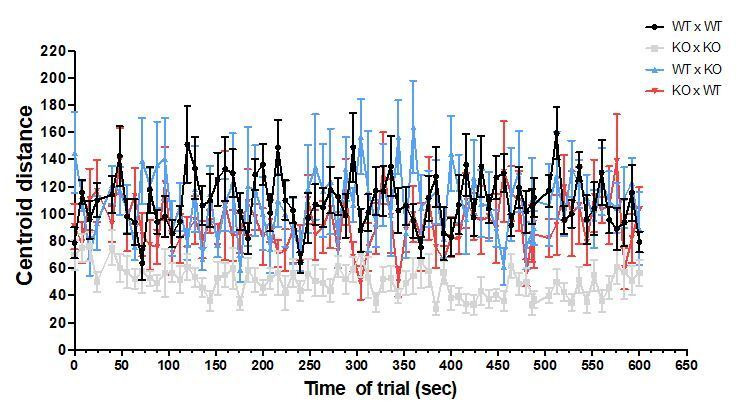
The fish were recorded during the entire trial of 10 min, but the analyses were done every other 8 seconds. No differences were observed over time, as shown in Author response image 7 and Author response image 8 for focal fish distance to group centroid and shoal dispersion.

Author response image 7.

Author response image 7.

Author response image 8.

Author response image 8.

Results and Discussion section: "In other words, the social environment can revert phenotypes associated with specific genes". This sentence is too strong since only few of the behaviours described in the paper seem to be modified by the social environment.

The reviewer is absolutely right, we have changed the text to: “(…) the social environment can revert particular phenotypes associated with specific genes.”

Associated Data

    This section collects any data citations, data availability statements, or supplementary materials included in this article.

    Data Citations

    1. Oliveira RF. 2020. Genetic variation in the social environment affects behavioral phenotypes of oxytocin receptor mutants. Dryad Digital Repository. [DOI] [PMC free article] [PubMed]

    Supplementary Materials

    Figure 1—source data 1. Effects of individual and conspecifics genotype on Social Preference.
    Figure 1—source data 2. Effects of individual and conspecifics genotype on social habituation.
    Figure 1—source data 3. Effects of individual and conspecifics genotype on social recognition.
    Figure 1—source data 4. Effects of individual and conspecifics genotype on social integration.
    Figure 1—source data 5. Effects of individual and conspecifics genotype on social influence.
    Transparent reporting form

    Data Availability Statement

    Data used in this study is provided as supplemental material at this stage. Data available on Dryad at doi: https://doi.org/10.5061/dryad.xwdbrv1bq.

    The following dataset was generated:

    Oliveira RF. 2020. Genetic variation in the social environment affects behavioral phenotypes of oxytocin receptor mutants. Dryad Digital Repository.


    Articles from eLife are provided here courtesy of eLife Sciences Publications, Ltd

    RESOURCES