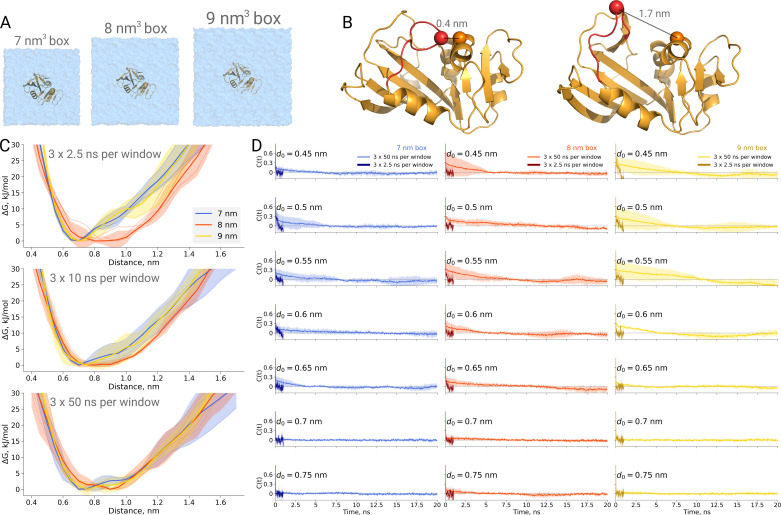
Figure 5. Thermodynamics of dihydrofolate reductase.
Dihydrofolate reductase was simulated in boxes of 3 different sizes (A). (B) The distance between Cα atoms of residues 18 and 45 was used as a reaction coordinate. Here, loop M20 is coloured in red. (C) Free energy profiles along the reaction coordinate were constructed from three simulation repeats. Upper panel: 2.5 ns sampling time of which 0.5 ns were discarded for equilibration. Middle panel: 10 ns sampling time of which 2 ns were discarded for equilibration. Bottom panel: 50 ns sampling time of which 10 ns were discarded for equilibration. (D) Autocorrelation times for the interatomic distance between Cα atoms of residues 18 and 45 for simulations in the boxes of different size. The plots in different rows correspond to the interatomic distances used for a harmonic restraint. The shaded areas denote 95% confidence intervals derived from the standard errors over three repeats assuming a normal distribution.

