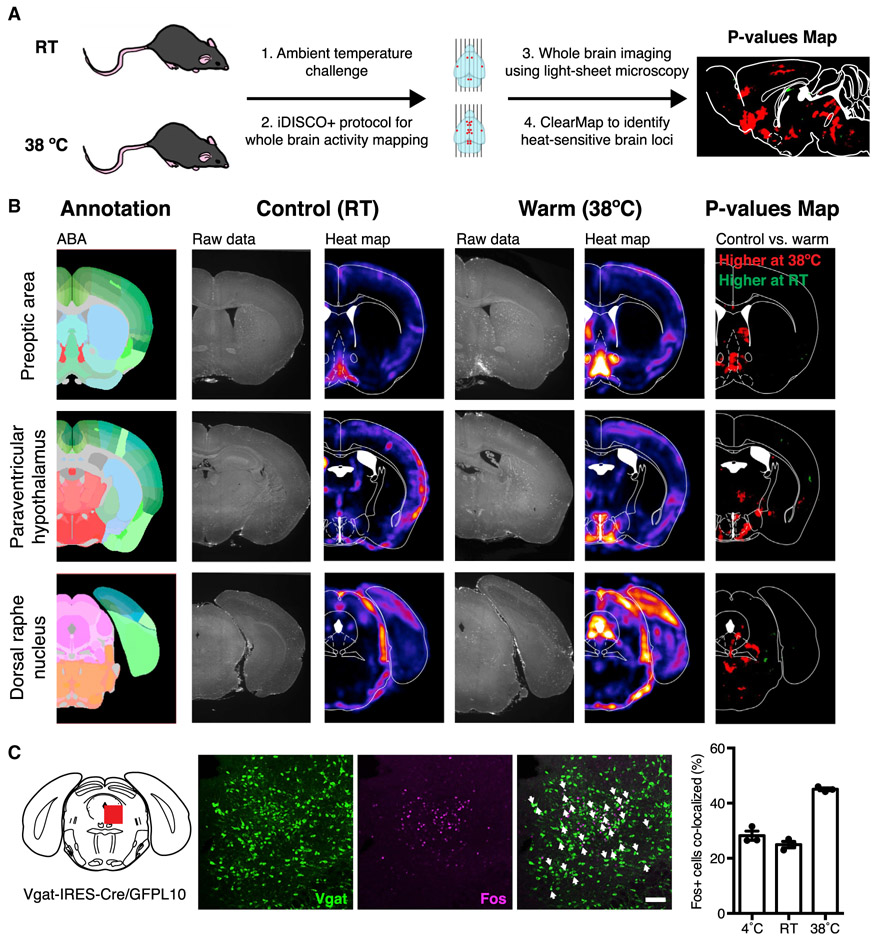
Figure 1. Whole-Brain Fos Mapping Identifies Heat-Sensitive Neurons.
(A) Schema for whole-brain activity mapping in response to thermal challenge.
(B) Whole-brain imaging and ClearMap results for the POA (top), hypothalamus (middle), and DRN (bottom). p values maps display differentially activated brain loci in 38°C versus RT (n = 5 mice per group).
(C) Vgat and Fos colocalization after 38°C thermal challenge. Significantly increased Fos and Vgat colocalization was observed at 38°C, compared to room temperature (p < 0.0001). Unpaired t test comparing treatments (n = 3 mice per group). White arrows designate double-labeled cells.
Scale bar, 100 mm. Data are presented as mean ± SEM.

