Abstract
Electrohydrodynamic printing (EHDP) is able to precisely manipulate the position, size, and morphology of micro-/nano-fibers and fabricate high-resolution scaffolds using viscous biopolymer solutions. However, less attention has been paid to the influence of EHDP jet characteristics and key process parameters on deposited fiber patterns. To ensure the printing quality, it is very necessary to establish the relationship between the cone shapes and the stability of scaffold fabrication process. In this work, we used a digital microscopic imaging technique to monitor EHDP cones during printing, with subsequent image processing algorithms to extract related features, and a recognition algorithm to determine the suitability of Taylor cones for EHDP scaffold fabrication. Based on the experimental data, it has been concluded that the images of EHDP cone modes and the extracted features (centroid, jet diameter) are affected by their process parameters such as nozzle-substrate distance, the applied voltage, and stage moving speed. A convolutional neural network is then developed to classify these EHDP cone modes with the consideration of training time consumption and testing accuracy. A control algorithm will be developed to regulate the process parameters at the next stage for effective scaffold fabrication.
Keywords: electrohydrodynamic jetting, convolutional neural network, image processing, scaffold fabrication
1. Introduction
With the rapid development of micro-/nano-manufacturing, electrohydrodynamic printing (EHDP) has recently drawn great attention for its capability to print micron to nanometer-scale fibers. EHDP technology uses a pneumatic or syringe pump to supply viscous solution to a nozzle with constant flow rate and applies a high voltage between the nozzle and substrate to generate electric field. The solution is charged and distorted into a Taylor cone shape at the nozzle tip. When the electrostatic force exerted on the Taylor cone overcomes its surface tension, a microjet ejects downward, quickly solidifies due to solvent evaporation. The solidified fibers are deposited on the substrate with a nearly circular cross section[1]. The printing resolution of EHDP is improved by about two orders of magnitude in comparison to the conventional inkjet printing systems[2]. The deposited fibers on the substrate can be orientated by a computer-controlled precision stage and stacked into scaffolds with tailored microstructure. With the advantages of low cost, simple setup, and high printing resolution, EHDP has attracted a wide range of innovative explorations. Most importantly, EHDP enables the fabrication of biomimetic fibrous scaffolds with the feature size close to the scale of extracellular matrix, which can facilitate the cell attachment, proliferation, and tissue regeneration[3].
Even though the EHDP mechanism is conceptually simple, the actual formation process strongly depends on the properties of the inks (viscosity, surface tension, and electrical conductivity), environmental factors (temperature and humidity), and other process parameters (nozzle-to-substrate distance, solution feeding rate, and dimensions of nozzle). Due to the process complexity and the variation of electric field strength in fiber layer stacking process, EHDP lacks an accurate process model and easily becomes unstable in large-scale fabrication (a few hours). Therefore, it becomes an urgent and, at the same time, challenging task to characterize the EHDP process and control the morphologies of deposited fibers and constructed scaffolds by fiber layer stacking. In the past, we could only verify the scaffold’s morphology by taking scanning electron microscopic image after the printing process.
Ideally, we like to monitor the EHDP jet formation and regulate its process adaptively to achieve the desired scaffold morphology. This is quite similar to what have been done in electrospinning process monitoring[4]. Researchers usually installed high-speed cameras to visualize the ejection of droplets from the nozzle in a safety distance and investigated the relation between the geometry of Taylor cone, environmental factors, and produced fibers[5,6]. However, such monitoring systems are too expensive, compared with the setup cost of EHDP system. Besides, the EHDP process can generate high-velocity jet which is around a few meters per second with the use of low viscous solutions[7]. It is difficult to regulate such a process in a timely manner with control. Thus, most of the current low-viscosity EHDP systems are open loop (i.e., without feedback or feedforward control).
The EHDP jet formation time would be significantly prolonged with the use of high viscous biopolymer solutions for scaffold fabrication. Thus, it is possible to detect any abnormal modes using a digital microscope device. This imaging device should be able to observe comprehensive details in a cost-effective way so as to observe the jet triggering voltage and the lowest voltage for stable EHDP process. Researchers have studied Taylor cone modes with different viscous solutions[8]. When high viscous solutions are fed into the EHDP system, the jet ejection velocity can be comparable with that of the computer-controlled precision stage in the range of 50–400 mm/s[9].
This paper presents an EHDP monitoring approach in scaffold fabrication process. More specifically, this paper will focus on (1) the development of the microscopic image sensing technique which enables real-time monitoring of EHDP and (2) an identification algorithm which can process the captured images, extract features, and classify the EHDP cone modes by convolutional neural network (CNN). The rest of the paper is as follows: Section 2 provides a description of the EHDP process and monitoring system setup, Section 3 introduces image processing methods applied to the captured microscopic images, applying CNN in EHDP cone modes’ classification and validating the performance of the developed CNN models are presented in Section 4, and Section 5 provides concluding remarks and future directions.
2. Experimental setup
2.1. Introduction of EHDP system
Figure 1A illustrates the schematic diagram of our laboratory built EHDP system, which consists of a three-axis motorized stage, a high voltage power supply to trigger and maintain EHDP process, a digital microscope, a solution feeding system, and a substrate. The solution feeding system consists of a syringe pump (New Era Pump System), a 5 ml syringe, a flexible hose, and a stainless steel nozzle with internal diameter of 0.5 mm. The syringe is filled with the solution obtained by dissolving the polycaprolactone (PCL) pellets with an average molecular weight (wt) of 80 kDa in the acetic acid (>99.7% pure). As shown in Figure 1B, a jet ejects at the apex of the Taylor cone when the applied voltage gradually increases to the jet trigging value. The EHDP process characterization is based on the above fundamental phenomenon. Its stability is determined by the ratio of length-to-width of Taylor cones, as shown in Figure 1B. This ratio can be used to determine the lowest voltage for stable EHDP process, and a larger ratio means a longer cone shape[10].
Figure 1.
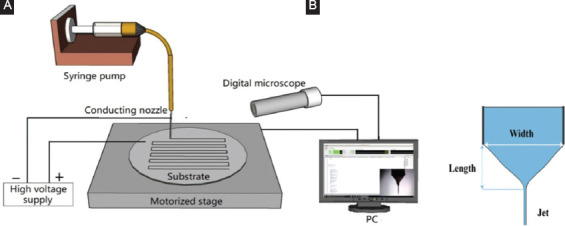
Electrohydrodynamic printing (EHDP) setup and the monitoring system. (A) Schematic diagram of EHDP setup and monitoring system (B) Taylor cone.
The three-axis precision stage from Aerotech, Inc. (Pittsburgh, PA, USA) is driven by linear motors. It has a travel range of 150 mm with 3 μm accuracy on X and Y axes, and a travel range of 50 mm with 5 μm accuracy on Z axis. The substrate, a polished silicon wafer, is fixed on X-Y plane. The motorized stage where the substrate rests on is digitally controlled and hence is capable to stretch the jetting fiber in a programmable manner. The stage speed (SS) along X and Y axes is set within the same range of 50–300 mm/s. The moving stage along X and Y axes could generate a mechanical drawing force to pull the deposited fiber, where the fiber diameter and morphology are influenced by the SS.
In this study, three EHDP key process parameters are looked into to explore their influence on jetting fibers and printed patterns, namely the applied voltage (V: 2.6–3.4 kV), the nozzle-substrate distance (D: 3–4.5 mm), and the SS: 50–300 mm/s. We obtain the images of EHDP Taylor cones formed by PCL solutions (65 w/V% in acetic acid; 70 w/V% in acetic acid; and 80 w/V% in acetic acid, g/mL), and PCL/zein composite solutions (50 w/V% PCL and 20 w/V% zein in acetic acid; 60 w/V% PCL and 10 w/V% zein in acetic acid), and with the syringe feed rate (FR) at 0.7 μl/min, temperature at 25°C, and humidity around 50–60%.
2.2 Monitoring System Setup
Our monitoring region focuses on the EHDP Taylor cone and its jet. Since the captured images were strongly influenced by the lighting conditions, an adjustable LED light source is introduced in a reflective way to ensure good image quality. The EHDP process is video recorded by a Supereyes B011 digital microscope with 200 magnification and 30 frames per second. One can view and analyze microscale features of the observation region on a computer screen. The camera position and shooting angle are calibrated by aligning the area of the gray scale nozzle image with a predefined nozzle position.
Figure 2A shows a standard EHDP cone shape with a straight jet. Figure 2B shows a cone jet with helical deformation which consists of two distinct parts: A long, roughly vertical “tail” (with length in millimeters and diameter in micrometers to nanometers) which deforms primarily by severe electrostatic force stretching and a helical “coil” in which the deformation is dominated by bending and twisting. Once these coiled fibers are dispersed along the stage moving direction, versatile structures can be formed on the substrate as shown in Figure 2C.
Figure 2.

(A) Standard electrohydrodynamic printing cone shape, (B) cone-jet region with helical deformation, (C) diverse deposited non-straight fiber patterns (scale bar: 200 μm).
3. Image Processing and Feature Extraction
Various Taylor cones and jets images are recorded. The next step is to process these images automatically and construct the linkage between the diversity of Taylor cones and deposited fibers. Image quality and size may vary from one process run to another. Thus, we need to interpret these monitoring images by acquisition, segmentation, and feature extraction.
3.1 Image Processing
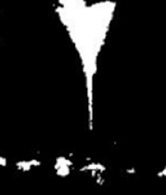
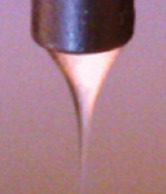
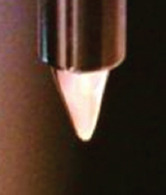
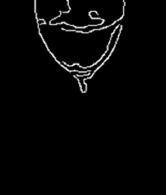
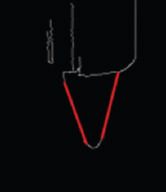
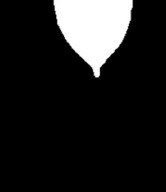
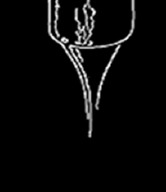
Some cones can be distinguished from the background in the captured images. Thus, the image processing would start with binarization, followed by the detection of maximum connected region. For those images, the binarization with a single threshold may not be sufficiently to extract the cone images from the background. A method named “sharpen” will be implemented, followed by edge detection, dilation, and erosion. These processing methods are briefly described as below. Table 1 shows the images before and after each processing method.
Table 1.
Image processing methods
| Images | Sharpen | Maximum connected region | Edge detection | Straight line detection | Erosion and dilation |
|---|---|---|---|---|---|
| Before | 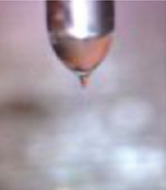 |
 |
 |
 |
 |
| After | 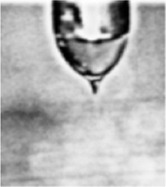 |
 |
 |
 |
 |
3.1.1 Sharpen
In sharpen, a constant (>1) is added to the transfer function of high-pass filters in the frequency domain to recall some low-frequency components. This can improve the contrast of the edge region and keep the smooth region at the same time[11]. After sharpening, the observed region becomes easier to be detected than that of the original image as shown in the first column of Table 1.
3.1.2 Maximum Connected Region
When color images are transformed into binary images, there are numerous connected regions. As shown in the second column of Table 1, it consists of one major connected region (target of interest) and some smaller regions due to noise, grids, or reflected light. Pixels are counted in every labeled region, and then, the maximum connected region is identified, that is, Taylor cone and jet.
3.1.3 Edge Detection
Edge refers to the most obvious change of local intensity within an image. Canny operator with non-maximum suppression method is used for edge detection, since it can detect thinner edges than those of other operators. A quasi-Gauss function is introduced to realize a smoothing operation and reduce noise influence[11]. To detect the edge of Taylor cone and nozzle more precisely, a threshold (about 0.15–0.3) is introduced to determine the minimum gradient according to the brightness and contrast.
3.1.4 Straight Line Detection
After the edge detection, the image will be further processed by the straight line detection to extract cone features. In the Euclidean space, the points on a straight line correspond to a sinusoidal cluster in the Hough parameter space[11]. The intersection in the Hough parameter space defines the straight line between the points, which can be applied to evaluate the Taylor cone shapes and their stability.
3.1.5 Erosion and Dilation
The dilation makes the target “grow” in the image, while the erosion can make target “shrink” and get intersection of target and structural elements[11]. In this study, we apply an open operation (dilation followed by erosion) to remove the noise in the images, followed by a close way (erosion followed by dilation) to close the small gaps on the thin edges. An example is shown in the last column of Table 1.
3.2 Feature Extraction
After the above-mentioned image processing steps, two key features are extracted to describe the Taylor cone and jet.
3.2.1 Centroid
Centroid is the arithmetic mean position of all the points in the cone, that is, center of mass[12]. Since the inner diameter of the nozzle is fixed, the value of centroid can be used to describe the Taylor cone shape and size. To be more specific, the smaller centroid value indicates a shorter cone.
3.2.2 Jet Diameter
The flying jet diameter is usually measured at the position close to the substrate. Under a proper nozzle-substrate distance, the solvent in micro-/nano-jet can fully evaporate, and the semi-solid jet eventually becomes solidified fiber patterns on the substrate.
3.3. Influences of Process Parameters on the Extracted Features
3.3.1 Effect of the Applied Voltage and Nozzle-substrate Distance
Figure 3A describes the effect of the applied voltage on centroid value under different nozzle-substrate distances. 65 wt/v% PCL is used for this experiment, with the solution FR at 0.7 μl/min and the SS at 150 mm/s. Under the same applied voltage, the size of Taylor cone described by centroid value is proportional to the nozzle-substrate distance. In other words, a larger nozzle-substrate distance would relate to a larger size of Taylor cone.
Figure 3.
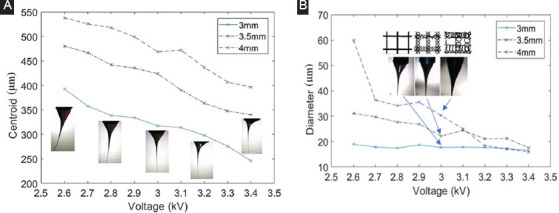
Effect of the applied voltage on centroid and diameter under varied distance (65 wt/v% polycaprolactone, feed rate = 0.7 μl/min, stage speed = 150 mm/s). (A) Effect of voltage and distance on centroid. (B) Effect of voltage and distance on diameter
Figure 3A also includes Taylor cone images at the nozzle-substrate distance of 3 mm. In general, the size of Taylor cone is inversely proportional to the applied voltage. It is found that a voltage around 2.6 kV can generate a huge size of Taylor cone, and this size reduces with the increase of the voltage. The cone shape becomes excessively tiny when the voltage is around 3.4 kV. In other words, increasing the applied voltage above a threshold will reduce the stability of the jet[10]. Similar phenomena are also observed for the nozzle-substrate distance at 3.5 mm and 4 mm. Similarly, we also investigate the size and shape of Taylor cones using 70 wt/v% PCL and draw the same conclusion.
About the effect of the applied voltage on the cone-jet diameter in Figure 3B, increasing the applied voltage leads to slightly decrease of the jet diameter when the nozzle-substrate distance is 3 mm. The jet diameter decreases more significantly when the nozzle-substrate distance increases to 3.5 and 4 mm. As the electrostatic force becomes weaker under a larger distance, EHDP process generates a thicker jet which can be further stretched with the increase of the applied voltage[10].
The captured cone images at 3 kV under different nozzle-substrate distances and their corresponding deposited fiber patterns are shown in Figure 3B. Compared with the Taylor cone shape at 3 mm, the cone deforms significantly at 4 mm. To achieve stable printing, the ratio of the applied voltage to the nozzle-substrate distance should be kept in a reasonable range. At 3 mm, EHDP could avoid the whipping instability and realize the direct writing of straight micro-/nano-fibers. With the increase of this distance to 3.5 mm and above, the serpentine structures are observed on the substrate.
At 3 mm, the deposited fiber patterns on the substrate may vary with the applied voltage as shown in Figure 4. When the applied voltage is about 2.6–3 kV, the straight fiber can be collected on the substrate. When the applied voltage reaches to 3.2 kV, the fiber patterns change to serpentine structure. The amplitude of the serpentine structure increases significantly at 3.4 kV applied voltage. Through adjusting the key process parameters, we can manipulate the solidified electrospun fiber flying in a stabilized helical manner. Thus, versatile serpentine structures can be direct written on a moving substrate with diverse amplitude and cycles.
Figure 4.

Effect of the applied voltage on the deposited fiber patterns (65 wt/v% polycaprolactone, stage speed = 150 mm/s, D = 3 mm). (A) 2.6–3 kV. (B) 3.2 kV. (C) 3.4 kV
3.3.2 Effect of the SS
We conduct several tests to examine the effect of the SS (100–300 mm/s) on Taylor cone and jet. The mechanical drawing force acting on the jetting increases with the SS. This leads to an increasing degree of slant jet and its elongation rate and eventually generates diverse trajectory. When the SS is greater than the downward speed of the jet, the fiber length deposited on the substrate is larger than the jet length fallen on substrate per unit time[13].
As shown in Figure 5, the EHDP jet falls down almost vertically and buckles in some degree near the substrate at the SS range of 50–150 mm/s. The jet evolves into a compressed “heel” shape (Figure 5A and B) and becomes unstable with periodically meandering. Thus, a lower SS may lead to a series of bifurcations, such as alternating loops, and translated coiling on the substrates as shown in Figure 2. This jet buckling effect is less obvious when the SS is above 200 mm/s, and straight fibers can be observed on the substrate.
Figure 5.

Electrohydrodynamic printing jet under varied stage speed (65 wt/v% polycaprolactone, V = 3 kV) (A) 50 mm/s; (B)100 mm/s; (C) 150 mm/s; (D) 200 mm/s; (E) 250 mm/s; (F) 300 mm/s
4. CNN in EHDP Cone Modes’ Classification
Conventional machine learning algorithms such as support vector (v) machines have limited capability to process natural data (such as the pixel values of an image). Constructing a pattern recognition system requires considerable domain expertise to design a feature extractor which transforms these data into suitable features for these learning algorithms. Applying these algorithms in EHDP cone mode classification need to go through both feature extraction and classification processes in a separated way, which inevitably lead to information loss. Furthermore, a feature selection process is essential to decide which features should be used as the inputs of the learning algorithms[14].
In the past decade, CNN is making major advances by allowing a learning algorithm to be fed with natural data and to automatically discover the representations needed for detection or classification[15]. CNN is widely used in image classifications and considered as a dominant approach for many recognition and detection applications[16]. A CNN model gets its output by conducting convolutional on an input image data and a wt/v, updating the wt/v iteratively by back propagation, and finally ending up with an optimal network for classification applications[17,18].
In this study, CNN is used to classify the microscopic images into eight categories as shown in Table 2, including a standard cone mode (stable cone-jet mode) and seven other categories. The EHDP cone categories are usually characterized by the geometrical form of the droplets at the nozzle tip, the breakup mechanisms, and the type of instabilities[19]. Majority of researchers use the stable cone-jet mode for biopolymer scaffold fabrication. Such mode is known to exist only for a limited window, where the applied voltage is just above the lowest voltage for stable printing and the FR is above a minimum threshold necessary to sustain a steady jet.
Table 2.
Categories of Taylor cone modes
| Cone shape | Characteristics | Typical image | Cone shape | Characteristics | Typical image |
|---|---|---|---|---|---|
| Broken | Cone broken due to faster SS or jet discharge | 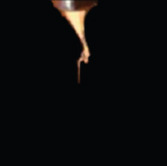 |
Tiny | Cone length/width ratio: 0.5–0.9 | 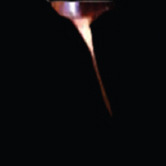 |
| Discharge | Discharge cone due to high conductivity of solution | 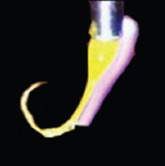 |
Multijet | Multiple unstable jet at the end of cone | 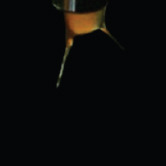 |
| Dry | Semisolidified cone due to low humidity | 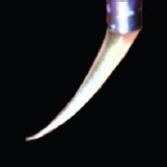 |
Meniscus | Meniscus cone shape | 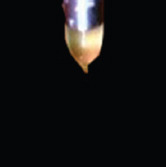 |
| Huge | Cone length/width ratio ≥ 2.0 | 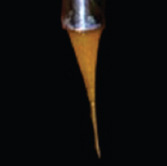 |
Standard | Cone length/width ratio: 1.2–1.6 | 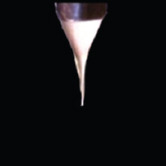 |
It is quite hard to describe the physical conditions for each mode using EHDP process parameters, since they are significantly affected by the properties of biopolymer solutions. The causes for spontaneous mode switch mainly come from the change of the electric field strength in fiber layer stacking process, solution impurities or precipitation, variation of process parameters, and environmental factors.
Under the same fabrication process parameters, the cone shape would shift from standard to meniscus if the PCL ink concentration increases from 70 wt/v% to 80 wt/v% and above. The larger cone in the meniscus mode is due to higher surface tension caused by higher PCL concentration. For 70 wt/v% PCL solution, the cone shape can evolve from meniscus, standard, and tiny to multijet when the applied voltage increases from 2 to 5 kV while keeping other EHDP process parameters constant. Besides, the cone shape would be tiny or huge when the solution FR is low (FR <0.5 μL/min) or high (FR >1.2 μL/min). Moreover, the cone would break when the solution feeding rate is too low or the SS is too fast (SS >250 mm/s). Environmental parameters such as temperature and humidity have distinct effects on the cone modes. The cone jet may become dry or continuous discharge when the relative humidity is <50%, since the lower humidity speedup the evaporation rate of PCL/zein composite solutions[20].
4.1 Applying CNN for EHDP Cone Modes’ Classification
The proposed CNN model can perform feature extraction and classification in a unified framework. Compared with traditional machine learning methods (such as support vector machines), the proposed CNN is a better option for the mentioned application.
We have tried different CNN layer structures in the training and explored a tradeoff between the training time consumption and the model accuracy in testing. The classification accuracies of CNN models are reported for varying convolution layer depth from 1 to 8 and increasing the number of convolution layers from 1 to 2 results a performance boost. Thus, the CNN model with two convolutional layers, two fully-connected (FC) layers, and a softmax layer is proposed. Every convolutional layer comes with a max-pooling layer and a normalization layer. The images are processed into the same size by cropping or padding. The output of the CNN model is the eight-category classification.
Cross entropy defined as equation (1) is used to evaluate the loss for this CNN model.

Where, refers to the ith labeled value and yi refers to ith output of the softmax layer.
The wt/v is initialized using Gaussian distribution and then optimized by AdamOptimizer using gradient descent method. The Adam optimizer optimizes the wt/v in every layer so as to improve the traditional gradient descent and promote the dynamic adjustment of the wt/v. We use TensorFlow developed by Google[21], as the framework to build the CNN model for this application.
4.2 Data Set Preparation
In total, 5000 image samples are randomly divided into three sets: A training set (4000 samples), a validation set (500 samples), and a test set (500 samples). Uniformly distributed samples from each category are used in both training and testing dataset. To avoid overfit, both cross-validation and data argumentation are implemented to ensure the high accuracy in both training and testing. The data argumentation can generate more training examples by deformation such as rotation and translation. Besides, a regularization technique called dropout is used at the end of FC layers to randomly drop neurons units with 50% probability during training to avoid overfitting[22].
4.3 Training and Testing Results
We evaluate the performance of CNN models using both accuracy and training time. In each step of training, a batch of 16 or 32 images from each category is input into the CNN for performance comparison. The training is conducted with a total of 10000 steps. The CNN model trained with the smaller batch size (16) is chosen due to better performance in terms of testing accuracy and training time consumption. We also vary the size of training samples from 500, 1000, 2000 to 4000, and the training time increases significantly with the size of training samples. The corresponding testing accuracy is 88.9%, 91.3%, 92.3%, and 94.7%, respectively. The CNN models with larger size of training data have some improvement on the testing accuracy. With the training data size of 4000 samples, the accuracy of the trained CNN model under each category is shown in Table 3.
Table 3.
The accuracy of predicted classes
| Classification category | Fine | Broken | Discharge | Dry | Huge | Tiny | Multi | Meniscus |
|---|---|---|---|---|---|---|---|---|
| Accuracy | 93.7 | 95.1 | 90.6 | 95.1 | 95.7 | 93.8 | 95.3 | 96.5 |
To have better classification in EHDP real-time monitoring, continuous 15 frames of the microscope images are used for classification and the cone mode is finalized by the maximum vote. This analysis would facilitate the development of EHDP process control algorithms at the next stage, which could regulate the applied voltage and the printing SS from run to run, for more reliable and viable manufacturing.
5. Conclusion
EHDP has recently drawn great attention for its capability to print micron to nano scaffolds using biopolymer solutions. This great potential motivates researchers to devote intensive efforts on the development of EHDP monitoring and control system. In the paper, we collect digital microscopic images to monitor EHDP scaffold fabrication process. The captured microscopic images are used to evaluate the influence of the key process parameters on the cone shape and jet by features such as centroid and jet diameter. A CNN identification model is developed to classify EHDP cone modes into eight categories with good classification accuracy and low computational time. While, besides the information derived from the microscopic images, material properties such as conductivity or solvent evaporation rate should also be taken into account to identify the EHDP process. With the aid of advanced control techniques, we may regulate the EHDP key process parameters to achieve a more viable manufacturing process in near future. These efforts would eventually translate EHDP fabrication from a research stage to the commercially viable manufacturing process.
Acknowledgment
This project is financially Supported by Key Program Special Fund in Xi’an Jiaotong-Liverpool University (XJTLU) under Grant KSF-A-09. This work is also partially supported by Suzhou S&T Project-Key Industrial Technology Innovation under Grant SYG201842.
References
- 1.Zhang B, He J, Li X, et al. Micro/nanoscale electrohydrodynamic printing:From 2D to 3D. Nanoscale. 2016;8(34):15376–15388. doi: 10.1039/c6nr04106j. https://doi.org/10.1039/c6nr04106j. [DOI] [PubMed] [Google Scholar]
- 2.Park J U, Hardy M, Kang SJ, et al. High–resolution electrohydrodynamic jet printing. Nat Mater. 2007;6(10):782–789. doi: 10.1038/nmat1974. https://doi.org/10.1038/nmat1974. [DOI] [PubMed] [Google Scholar]
- 3.Sun J, Vijayavenkataraman S, Liu H. An overview of scaffold design and fabrication technology for engineered knee meniscus. Materials. 2017;10(1):29. doi: 10.3390/ma10010029. https://doi.org/10.3390/ma10010029. [DOI] [PMC free article] [PubMed] [Google Scholar]
- 4.Garg K, Bowlin G L. Electrospinning jets and nanofibrous structures. Microfluidics. 2011;5(1):13403. doi: 10.1063/1.3567097. https://doi.org/10.1063/1.3567097. [DOI] [PMC free article] [PubMed] [Google Scholar]
- 5.Reneker D H, Yarin AL. Electrospinning jets and polymer nanofibers. Polymer. 2008;49(10):2387–2425. https://doi.org/10.1016/j.polymer.2008.02.002. [Google Scholar]
- 6.Cai Y, Gevelber M. The effect of relative humidity and evaporation rate on electrospinning:Fiber diameter and measurement for control implications. J Mater Sci. 2013;48(22):7812–7826. https://doi.org/10.1007/s10853–013–7544–x. [Google Scholar]
- 7.Yarin A L, Koombhongse S, Reneker DH. Bending instability in electrospinning of nanofibers. J Appl Phys. 2001;89(5):3018–3026. [Google Scholar]
- 8.Wang X. Rheology behaviors of stable electrohydrodynamic direct–write jet. AIP Adv. 2016;6(10):105103. [Google Scholar]
- 9.Huang Y, Duan Y, Ding Y, et al. Versatile, kinetically controlled, high precision electrohydrodynamic writing of micro/nanofibers. Sci Rep. 2014;4:5949. doi: 10.1038/srep05949. https://doi.org/10.1038/srep05949. [DOI] [PMC free article] [PubMed] [Google Scholar]
- 10.Park J, Park J W, Nasrabadi A M, et al. Methodology to set up nozzle–substrate gap for high resolution electrohydrodynamic jet printing. Appl Phys Lett. 2016;109(13):134104. https://doi.org/10.1063/1.4963846. [Google Scholar]
- 11.Gonzalez R C, Woods RE, Eddins SL. Vol. 624. Upper Saddle River, New Jersey: Pearson–Prentice–Hall; 2004. Digital Image Processing using MATLAB. [Google Scholar]
- 12.Reneker D H, Yarin AL. Electrospinning jets and polymer nanofibers. Polymer. 2008;49(10):2387–2425. [Google Scholar]
- 13.Duan Y, Ding Y, Xu Z, et al. Helix electrohydrodynamic printing of highly aligned serpentine micro/nanofibers. Polymers. 2017;9(9):434. doi: 10.3390/polym9090434. [DOI] [PMC free article] [PubMed] [Google Scholar]
- 14.Sun J, Hong G S, Rahman M, et al. Improved performance evaluation of tool condition identification by manufacturing loss consideration. Int J Prod Res. 2005;43(6):1185–1204. [Google Scholar]
- 15.Cireşan D, Meier U, Schmidhuber J. Multi-Column Deep Neural Networks for Image Classification 2012. IEEE Conf.Comput Vis Pattern Recognit. 2012;2012:3642–3649. [Google Scholar]
- 16.LeCun Y, Bengio Y, Hinton G. Deep learning. Nature. 2015;521(7553):436. doi: 10.1038/nature14539. [DOI] [PubMed] [Google Scholar]
- 17.Fu J L, Zheng HL, Mei T, et al. Look closer to see better:Recurrent attention convolutional neural network for fine–grained image recognition 2017. IEEE Conf.Comput Vis Pattern Recognit. 20172017:4476–4484. https://doi.org/10.1109/CVPR.2017.476. [Google Scholar]
- 18.Simonyan K, Zisserman A. Very Deep Convolutional Networks for Large–scale Image Recognition. In Process International Conference on Learning Representations. 2014 http://arxiv.org/abs/1409.1556. [Google Scholar]
- 19.Raje P V, Murmu NC. A review on electrohydrodynamic–inkjet printing technology. Int J Emerg Technol Adv Eng. 2014;4(5):174–183. [Google Scholar]
- 20.Linzhi J, Xiang W, Hang L, et al. Zein Increases the cytoaffinity and biodegradability of scaffolds 3D–printed with zein and poly (ε–caprolactone) composite ink. ACS Appl Mater Interfaces. 2018;10(22):18551–18559. doi: 10.1021/acsami.8b04344. https:doi:10.1021/acsami.8b04344. [DOI] [PubMed] [Google Scholar]
- 21. [Last accessed on 2018 Jul 14];TensorFlow. Available from:https://www.tensorflow.org .
- 22.Srivastava N, Hinton G, Krizhevsky A, et al. Dropout:A simple way to prevent neural networks from overfitting. J Mach Learn Res. 2014;15(1):1929–1958. [Google Scholar]


